Article

Temperature Field Simulation and Experimental Confirmation of Laser Cladding High-Entropy Alloy Coating on Cr12MoV

1
Department of Mechanical Engineering, Northeast Electric Power University, No. 169 Changchun Road, Jilin 132012, China
2
School of Mechanical Civil Engineering, Jilin Agricultural Science and Technology University, Jilin 132010, China
*
Author to whom correspondence should be addressed.
Processes 2024, 12(2), 257; https://doi.org/10.3390/pr12020257
Submission received: 1 January 2024 / Revised: 19 January 2024 / Accepted: 20 January 2024 / Published: 25 January 2024
(This article belongs to the Section Materials Processes)

Abstract

:
In order to meet the mechanical property of the die steel, this study used laser cladding to prepare a high-entropy alloy coating on Cr12MoV. A finite element method using a double ellipsoidal heat source model is proposed to simulate the evolution of the temperature field in laser cladding. The simulation results showed that with the increase in the power, the peak temperature of the molten pool increased from 2005.5 °C to 2357.4 °C, and the depth of the molten pool increased from 1.60 mm to 2.04 mm. The coating with the laser power of 1600 W had a good macroscopic quality and high lattice distortion (2.43 × 10⁻²). Due to the increase in laser energy density, the size of equiaxed crystals gradually increased from 1400 W to 1700 W. Under the comprehensive effect of the solution and fine grain strengthening, the coating with the power of 1600 W had a higher average microhardness (600 HV), which is 150% higher than that of the substrate. The experiment results further confirmed the accuracy of the simulation.

1. Introduction

As a traditional cold working die steel, Cr12MoV is often used in the manufacturing of various stamping dies, trimming dies, and drawing dies. In the actual application and production, the mold often shows a lose efficacy due to the low wear resistance produced by the diversity and complexity of working conditions. Therefore, the surface-strengthening treatment is a cost-effective way to enhance the property and service life of the mold. Among various surface modification techniques, laser cladding has gained a widespread industrial application due to its ability to produce coatings with high hardness, wear resistance, and corrosion resistance [1,2,3,4,5,6].
In recent years, high-entropy alloys have gained much attention from researchers as cladding layers and have been used in various industrial fields [7,8,9]. However, there are few investigations about laser cladding high-entropy alloys on Cr12MoV, and only Tianjin University carried out this research. Cai et al. [10] found that, compared with the laser technology parameter, the dilution rate changed more obviously with the change of alloy elements. In this study, the increase in the Fe element increased the dilution rate of the coating, and the wear resistance and corrosion resistance of the coating decreased with the increase in dilution rate. Furthermore, Cai et al. [11] studied the high temperature oxidation resistance of FeCoCrNiAl0.3 and FeCoCrNiAl0.7, processed at 950 °C for 100 h, and indicated that FeCoCrNiAl0.7 had a better high temperature oxidation resistance because the grain boundary produced the phase transition. However, the increase in the Al element reduces the corrosion potential of the coating, resulting in the deterioration of the corrosion resistance of the FeCoCrNiAl0.7 coating. Cai et al. [12] also investigated the strengthening mechanism of high-entropy cladding layers. They found that the FeCoCrNiAl0.3 coating is mainly composed of columnar crystals, while the FeCoCrNiAl1.0 coating is mainly composed of equiaxed crystals. In addition, the difference between phase structures hindered the dislocation movement, which made FeCoCrNiAl1.0 have a good mechanical property.
In recent years, the development of computer technology has matured and is widely used in various industrial fields. Using computer technology to simulate the laser cladding process has gradually become an important research direction [13,14,15,16,17]. In order to optimize the ultrasonic vibration-assisted laser cladding process, Chai et al. analyzed the influence of ultrasonic power on the cladding trajectory and temperature field by numerical simulation [18]. Wang et al. used the finite element method to simulate and analyze the temperature, shape, and evolution of the molten pool during laser cladding, and found that the size of the molten pool and the flow rate are positively correlated with the laser power [19]. Yang et al. analyzed the influence of the S element on the shape of the molten pool in the process of laser cladding by combining the numerical simulation and experiment. It was found that the S content on the surface of the molten pool gradually decreased during laser cladding, and the shape of the molten pool changed from an arc to double arc [20]. The above results show that the correct numerical simulation can guide the experiment, save the time cost and material consumption of the experiment, and further improve the efficiency of the laser cladding experiment.
It is well-known that the solidification conditions of the molten pool during laser cladding play a crucial role in determining the microstructure of the resulting coating [21,22,23]. However, because the cooling rate of the molten pool is fast, it is difficult to acquire a thermal behavior parameter under the existing experimental condition. Therefore, in order to obtain a dense microstructure and good mechanical property, the numerical simulation of the laser cladding of high-entropy alloys on Cr12MoV is important. In the past decade, only Zhang et al. [24] analyzed the temperature distribution characteristics under different powers and scanning speeds, and conducted an experimental verification.
To sum up, in order to improve the wear resistance of Cr12MoV, this paper designed Al2CrFeNiMo as cladding materials. In the meantime, the optimized laser technology parameter results in significantly solid solution strengthening and fine-grained strengthening, which further improves the microhardness and wear resistance. Therefore, this study adopted the finite element method based on a double ellipsoidal heat source to simulate the temperature field, and finally determined the suitable laser power. At the same time, this study comparatively analyzed the experimental and simulation results, and further verified the accuracy of the simulation.

2. Materials and Methods

The study designed Cr12MoV as the substrate with 50 mm × 30 mm × 10 mm, and the chemical composition is listed in Table 1.
Al2CrFeNiMo powders were employed as cladding materials with a particle size ranging from 300 to 400 mesh and a purity of 99.9%. This is mainly caused by the fact that Al also strengthens the friction and wear properties of the material, and Ni and Cr improve the plasticity and corrosion resistance of the alloy. And, Ni improves the wettability of the coating and substrate, and reduces the brittleness of the coating. As the most common metal material, Fe can not only forms a Fe-Cr solid solution of BCC structure with excellent performance with Cr, but also enhances the compatibility of the cladding material and matrix.
According to the mass of the elements shown in Table 2, each element was weighed using an electronic balance and blended for 2 h using a planetary ball miller at 240 r/min with a ball-to-powder (mass ratio) of 2:1.
The laser equipment was a DL-HL-DT2000 type cross-flow CO2 laser. Argon was employed as a protective gas. Based on the preliminary research of the research group, the parameters of laser cladding are as follows: laser power of 1400–1700 W, scanning speed of 180 mm/min, spot diameter of 3 mm, overlap rate of 30%, and argon flow rate of 5 L/min. Prior to laser cladding, the powder with the thickness of 1.0 mm was prefabricated on Cr12MoV by using the die with a size of 50 mm × 30 mm × 1 mm.
We used the TD-3500 X-ray diffractometer (Dandong Tongda Technology Co., Ltd., Dandong, China) to analyze the phases of cladding layers. The unit had a Nickel-filtered Cu Ka source and operates at 40 kV and 30 mA. The data collection range was set at 2θ = 20°–80°, with a step size of 0.028 and step time of 0.3 s.
After undergoing rough grinding, fine grinding, and polishing processes, we used aqua regia to etch the laser cladding samples. We used a JSM-7610s mode field emission scanning electron microscope (SEM) to observe the microstructure of cladding layers.
We used the HXD-1000TMC/LCD microhardness tester to measure the microhardness of high-entropy cladding layers. The measurement position was from the coating surface to the substrate. The load was 200 g, and the load holding time was 15 s. In the cross-section of the sample, one data point was measured every 0.05 mm, taking the average of three parallel points as the hardness value.

3. Establishment Method of Finite Element Model

In this study, in order to simplify the process of building the model, the model follows the following assumptions:
(1)
The material is isotropic;
(2)
During the laser cladding process, both the substrate and powder remain stable without undergoing evaporation, and the volume loss of the material is disregarded;
(3)
The shape of the coating is semi-cylindrical and ignores the model fillet and other fine structures;
(4)
The powder particles do not affect each other and fully absorb the energy.

3.1. Heat Conduction Equation

In order to ensure the temperature distribution in the molten pool to conform to the heat equation, the nonlinear transient heat method is used to calculate the temperature field, and the equation is expressed as follows [25,26]:
ρ c T t = x ( k x T x ) + y ( k y T y ) + z ( k z T z ) + Q
where ρ is the density (kg/m3); c is the specific heat (J/kg·K); T t is the change rate of the micro-element temperature with time; kx, ky, and kz are the conductivity coefficient of the microelement in a three-dimensional space (W/(m·K)); Q is the heat inside the melt pool (W/m2).
When the material has isotropic thermal conductivity, kx = ky = kz = k, there is no spontaneous heat generation inside the material during the laser cladding process. So, Q = 0 and Equation (1) can be simplified, as shown in Equation (2):
ρ c T t = k ( 2 T x 2 + 2 T y 2 + 2 T z 2 )

3.2. Boundary Conditions

In this study, the following four types of boundary conditions are applied [27]:
(1)
The rigid boundary condition is shown in Equation (3):
k T n ( n x + n y + n z ) = T s ( x , y , z , t )
where, nx, ny, and nz are the cosine values on the boundary normal; Ts is the boundary temperature. The boundary temperature is not fixed and changes with time and space.
(2)
The heat transfer boundary condition is shown in Equation (4):
k T n ( n x + n y + n z ) = β ( T a T s )
where β is the heat transfer coefficient; Ta is medium temperature.
(3)
Heat flux boundary condition is shown in Equation (5):
k T n ( n x + n y + n z ) = q s ( x , y , z , t )
where qs is the input per unit area of an external heat source (W/m2).
(4)
The contact boundary condition, including laser radiation and the air convection generated during the laser cladding process, is shown in Equation (6):
k T n ( n x + n y + n z ) = σ ε ( T a 4 T s 4 )
where σ is the Stefan–Boltzmann constant; ε is the emissivity.

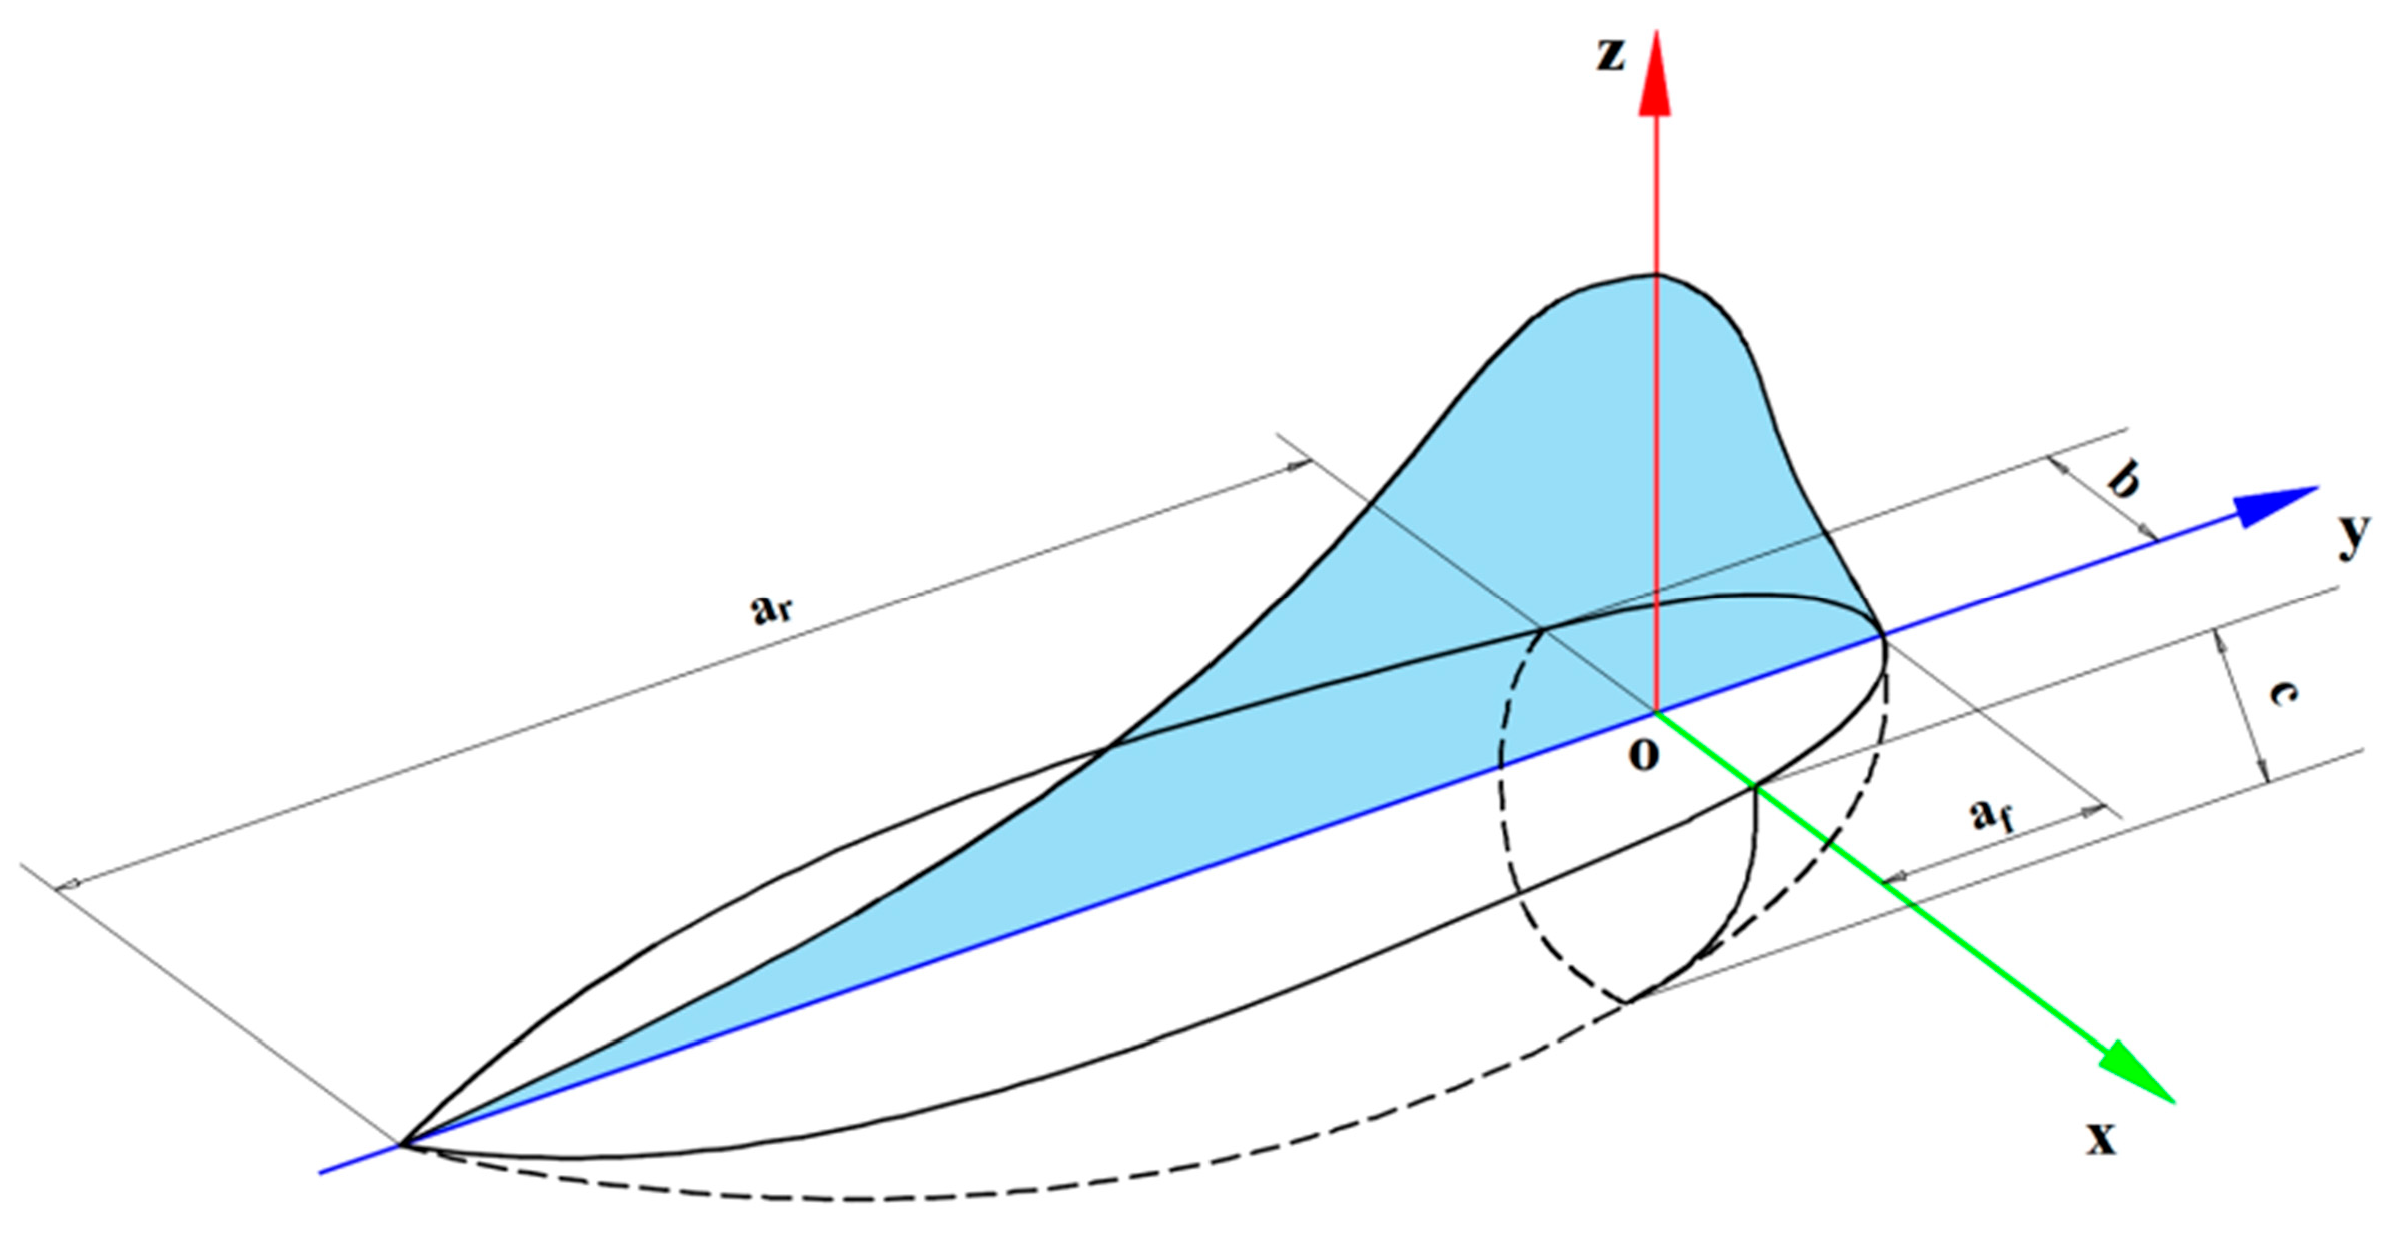
3.3. Heat Source Model

It is important to choose an appropriate heat source model for the simulation of the laser cladding process. According to the research of Meng et al., at high power, the double ellipsoid heat source model has greater advantages than the Gaussian heat source in the simulation results of the depth and contour of the molten pool [28]. In addition, Luo et al. compared the simulation results of the Gaussian heat source and the double ellipsoid heat source; they found that the results of the double ellipsoid heat source model were more accurate, because the energy distribution of the double ellipsoid heat source model was more in line with the actual laser heat source than the Gaussian heat source [29].
In the laser cladding process, there is a significant temperature gradient before and after the heat source. The double ellipsoidal heat source is divided into two different quarter ellipsoids, with the first half being distinct from the second half. By utilizing the double ellipsoidal heat source for laser cladding, it is possible to effectively suppress the temperature gradient in front of the melt pool’s center. This results in a more stable temperature gradient distribution behind the heat source. The double ellipsoidal heat source distribution model is shown in Figure 1 [30,31].
The equations of the quarter-ellipsoid in both halves of the double ellipsoidal heat source model are shown in Equation (7) and Equation (8), respectively:
q ( r ) = 6 3 f 1 Q π 3 / 2 a r b c exp { 3 [ ( x a r ) 2 + ( x b ) 2 + ( x c ) 2 ] }
q ( r ) = 6 3 f 2 Q π 3 / 2 a f b c exp { 3 [ ( x a f ) 2 + ( x b ) 2 + ( x c ) 2 ] }
where f1 and f2 are the front and rear ellipsoidal energy distribution coefficient, and their sum is a fixed value of 2, which is 0.6 and 1.4, respectively [32,33]; Q is the input power of the model, and Q = ηUI; ar, af, b, c are the shape parameters of the ellipsoid.

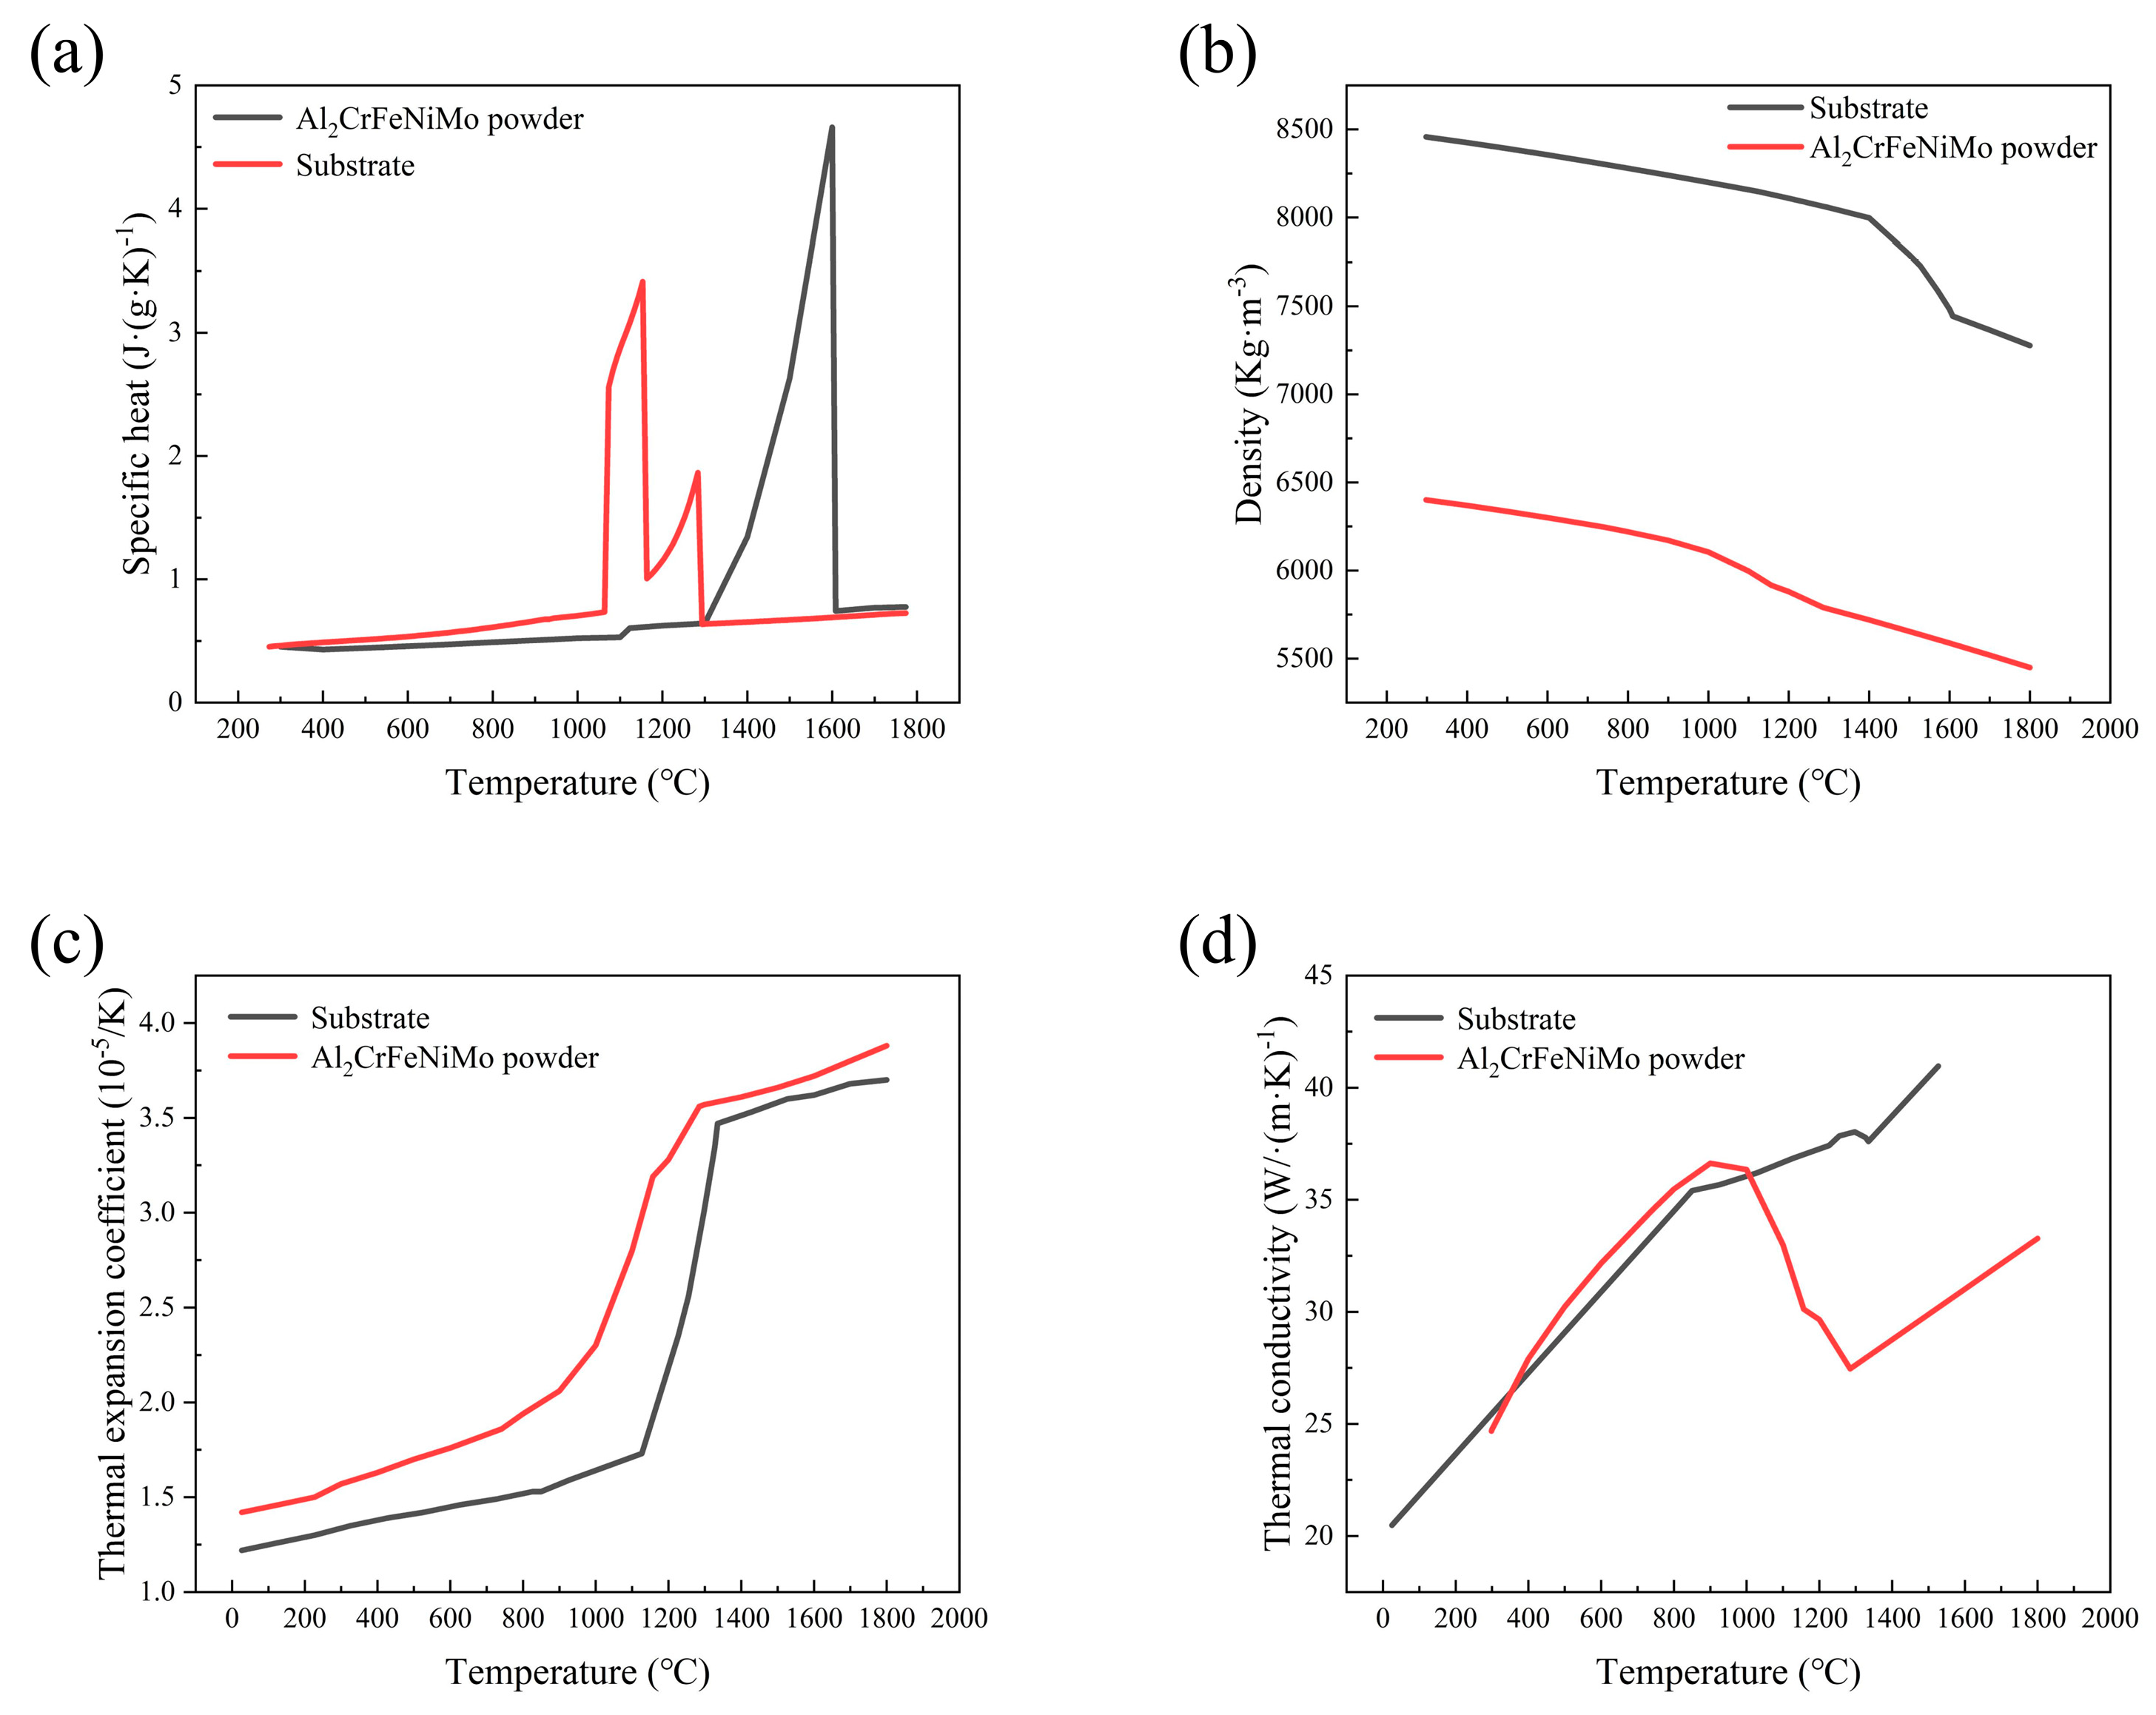
3.4. Thermophysical Parameters of Materials

By using the CALPHAD phase diagram method, the typical thermophysical parameters of Cr12MoV and Al2CrFeNiMo powder with a temperature change were calculated and obtained, as shown in Figure 2. In this study, these properties of coating materials and substrate materials change with the change of temperature, which has an important impact on the numerical simulation of the temperature field in the process of laser cladding.

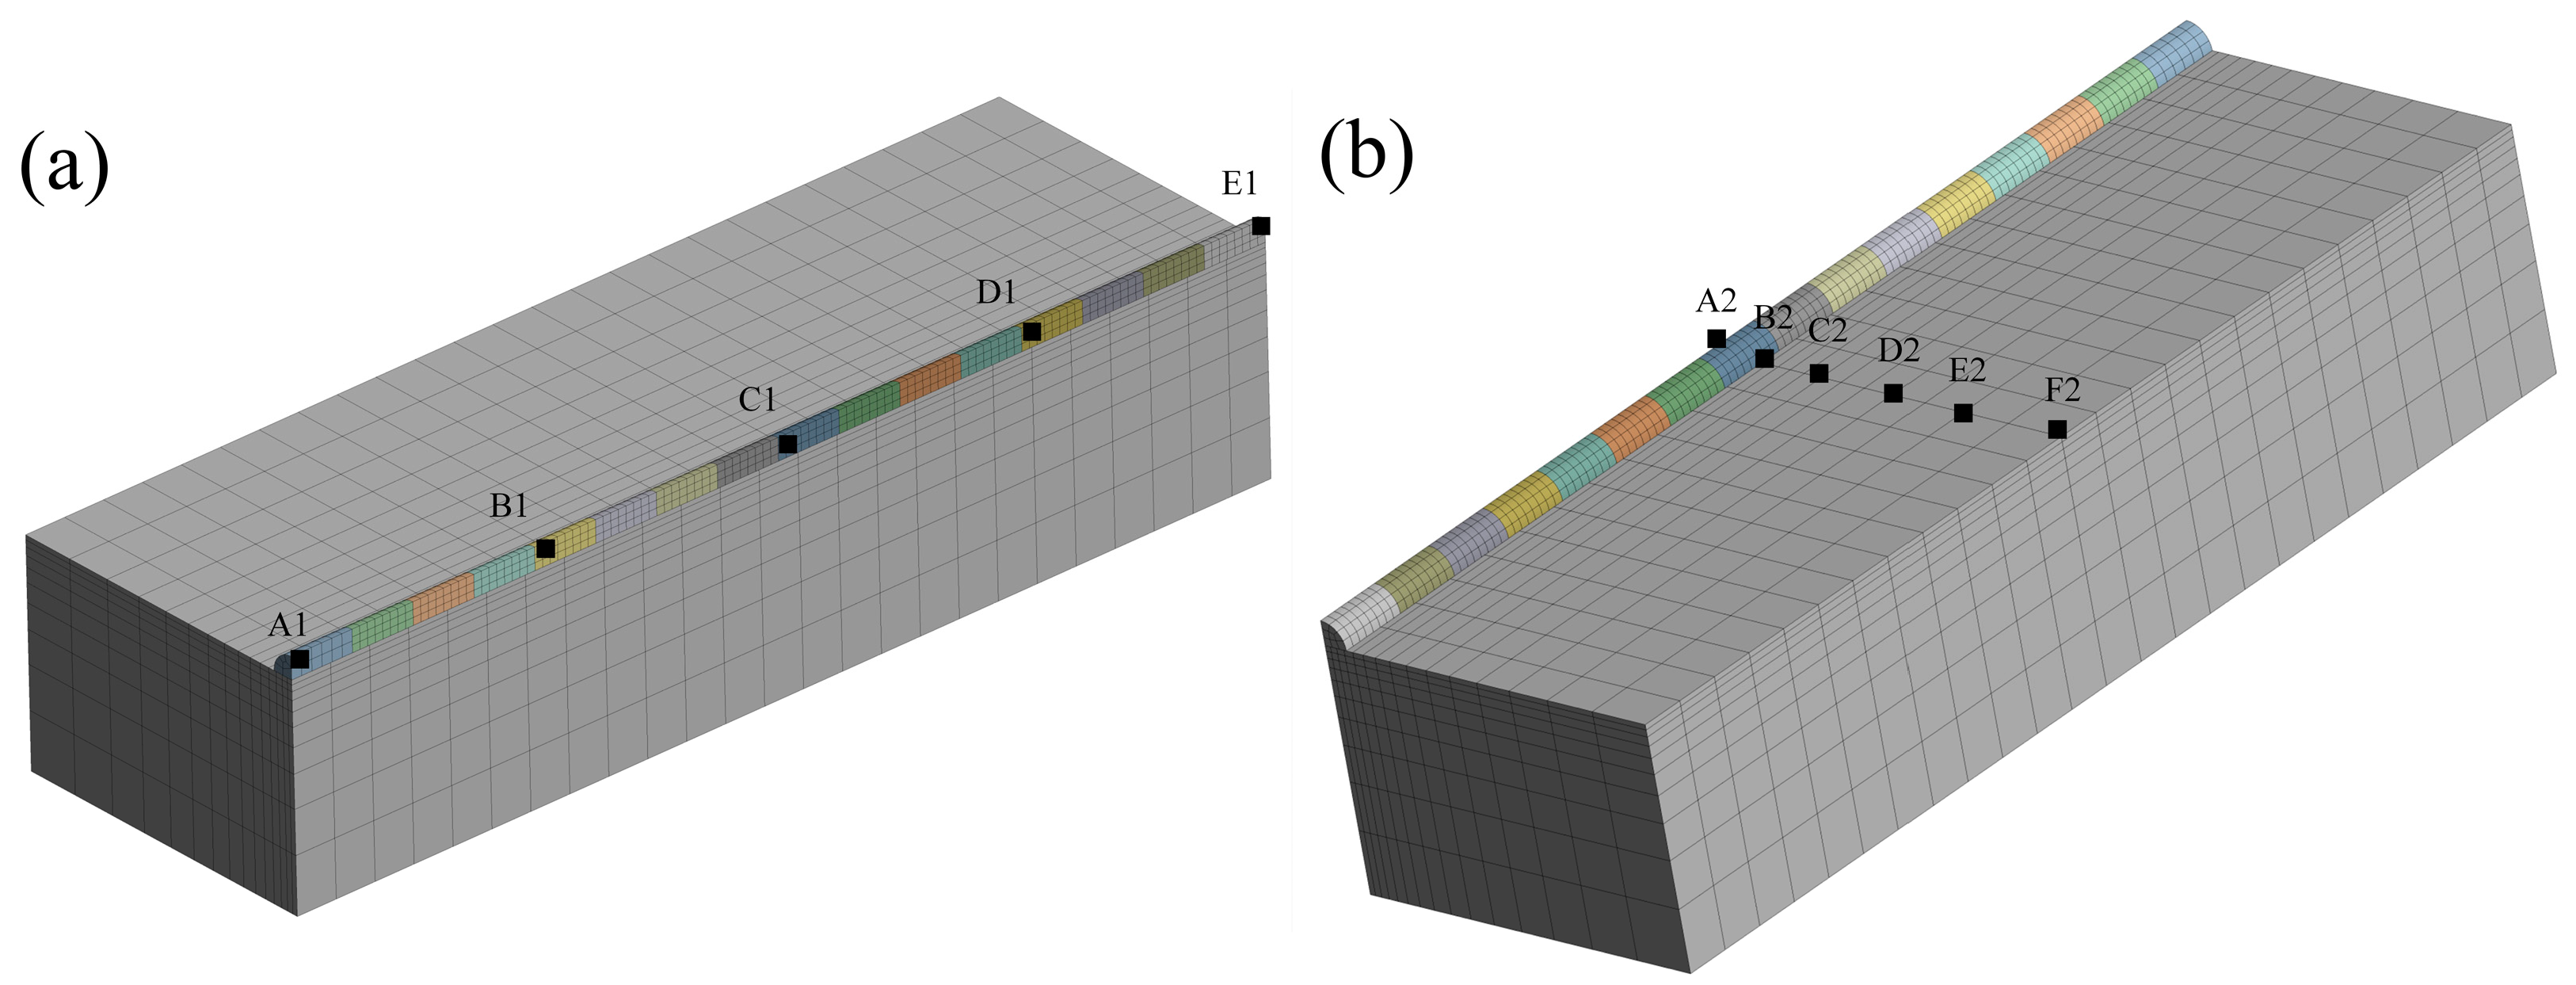
3.5. Establishment of the Finite Element Model

In the numerical simulation, the coating was set to a semi-cylindrical model, which had a length of 50 mm and a radius of 1 mm. We selected the hexahedral element as a mesh type to enhance the accuracy of the simulation. The mesh was divided into 24,086 nodes and 4746 elements. In the x, y, and z directions, we used a stretching method to divide the mesh into 25, 15, and 10 elements, respectively. We used the transient analysis method and the life-and-death element method to simulate the process of laser cladding in Ansys software (https://www.ansys.com/). The initial time was 0, the ambient temperature was 25 °C, and the scanning direction was a positive x-axis.

4. Results and Discussion

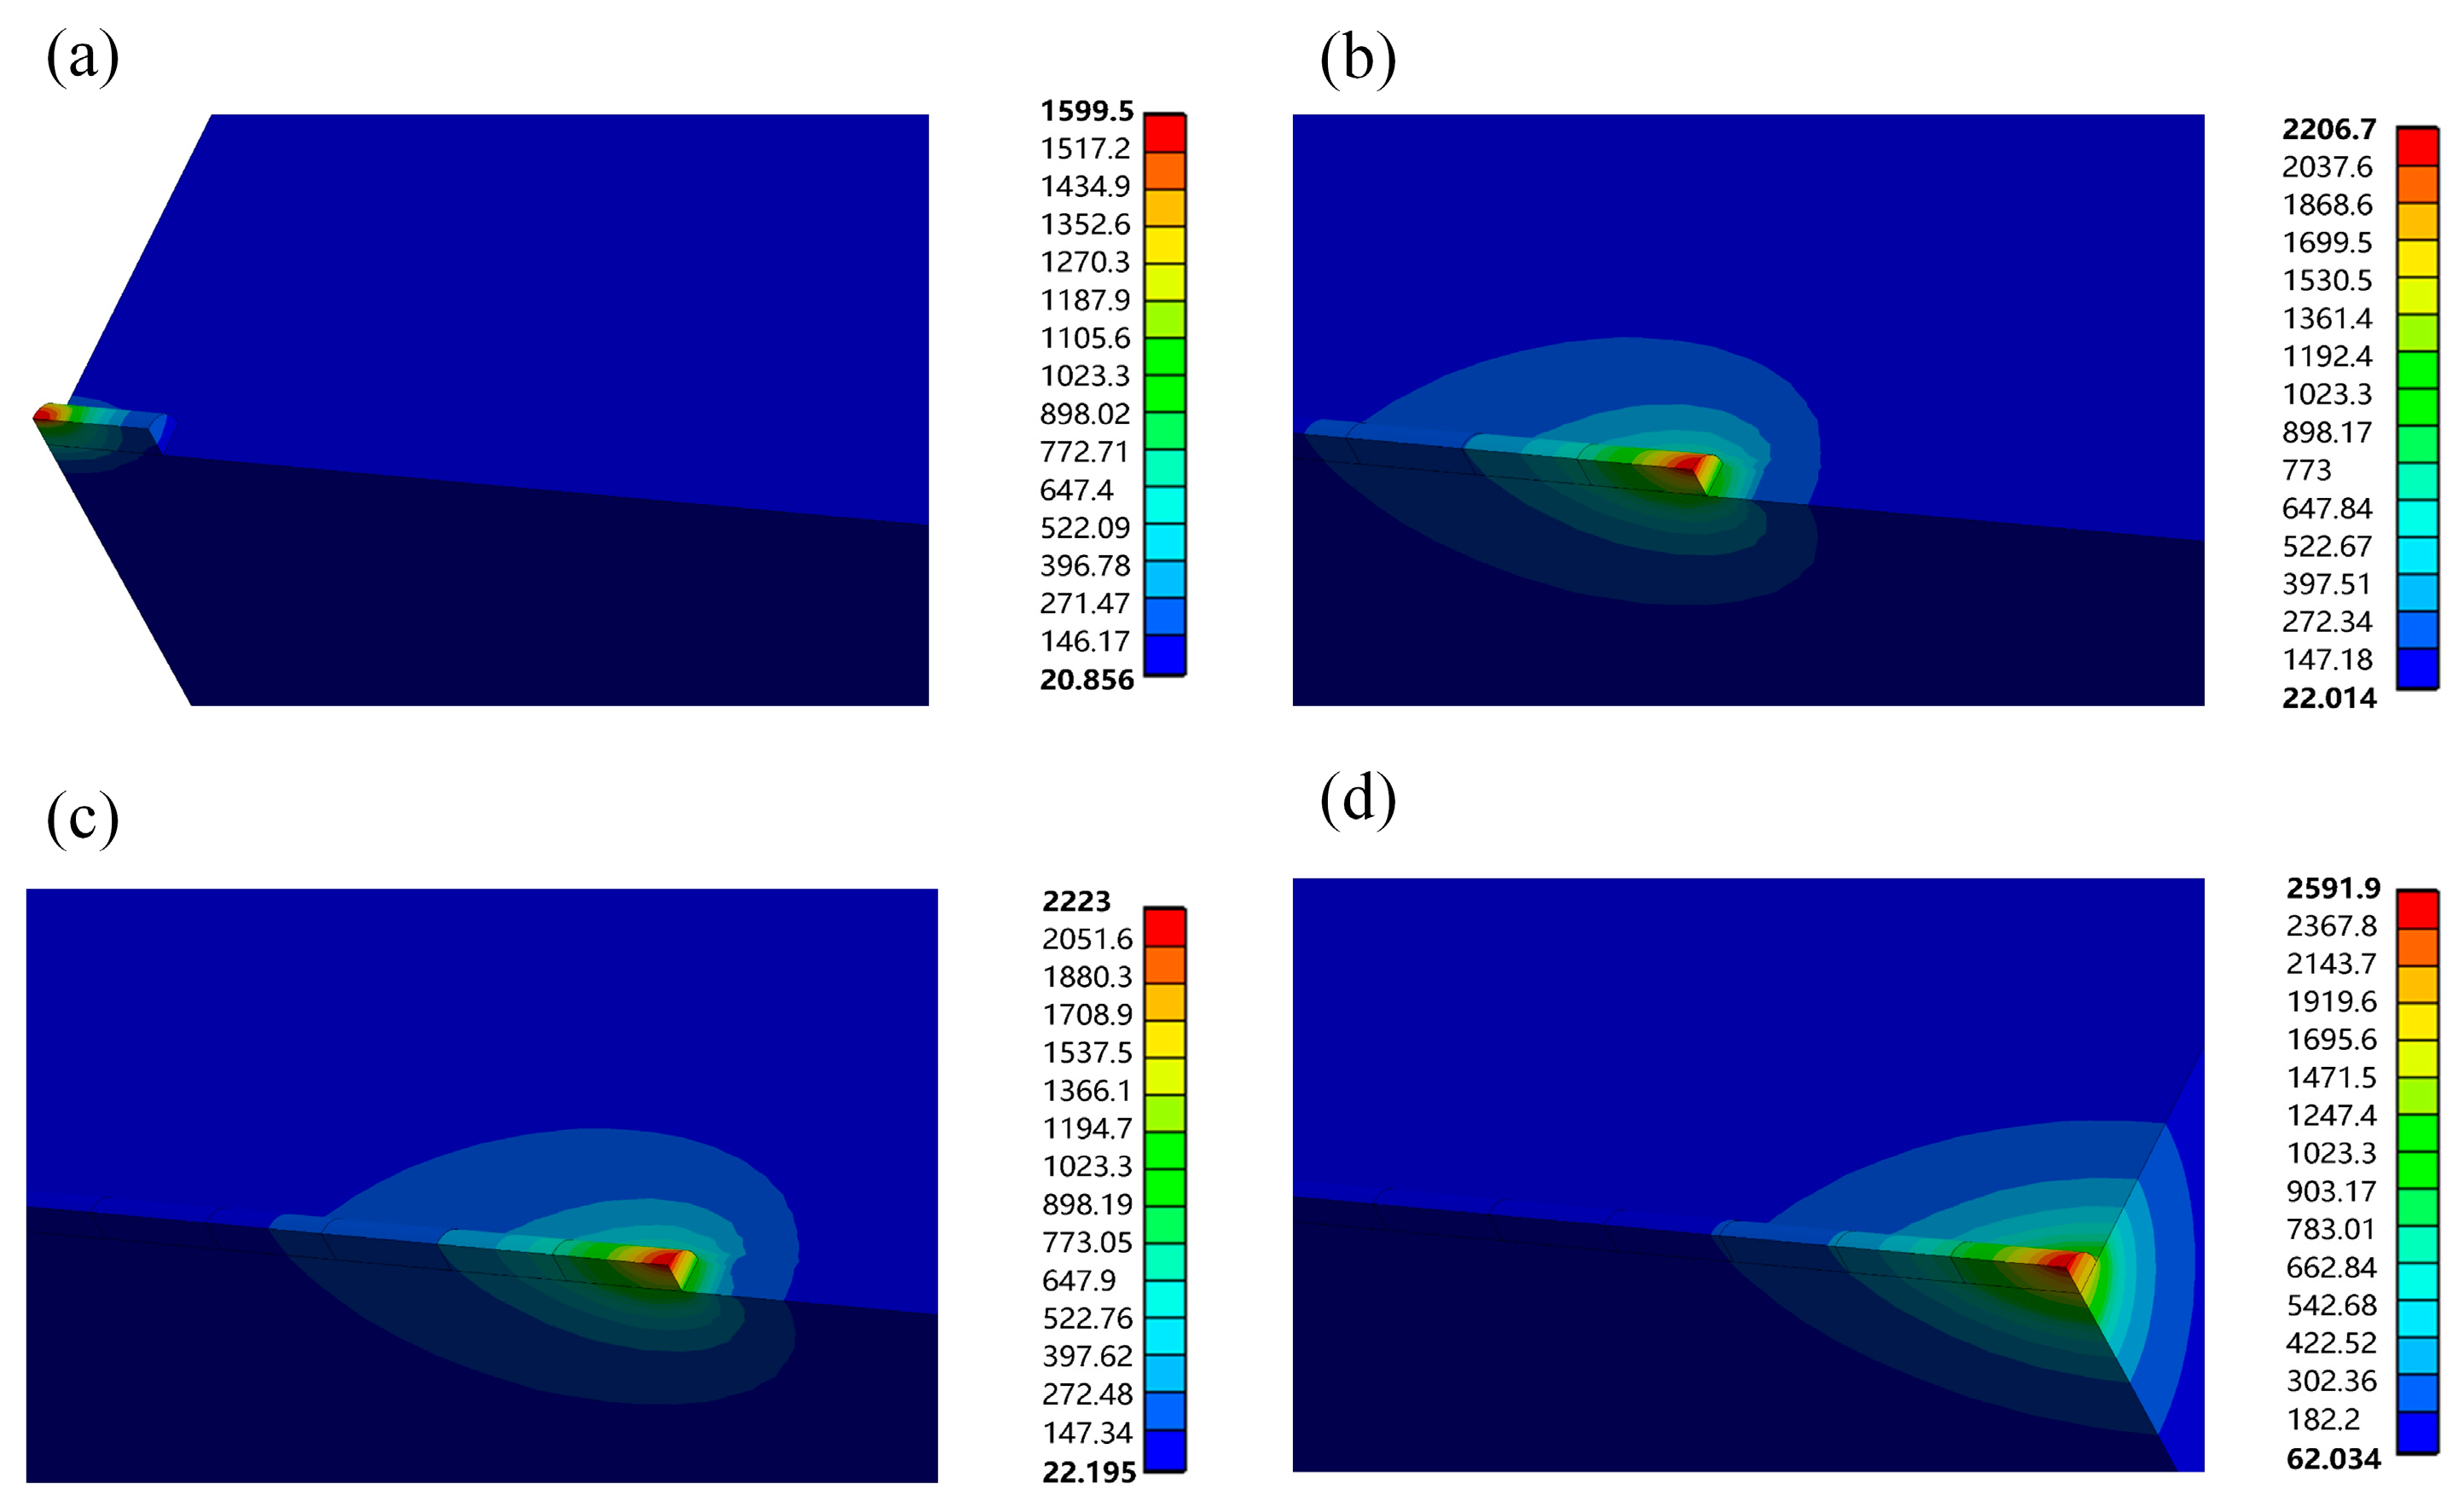
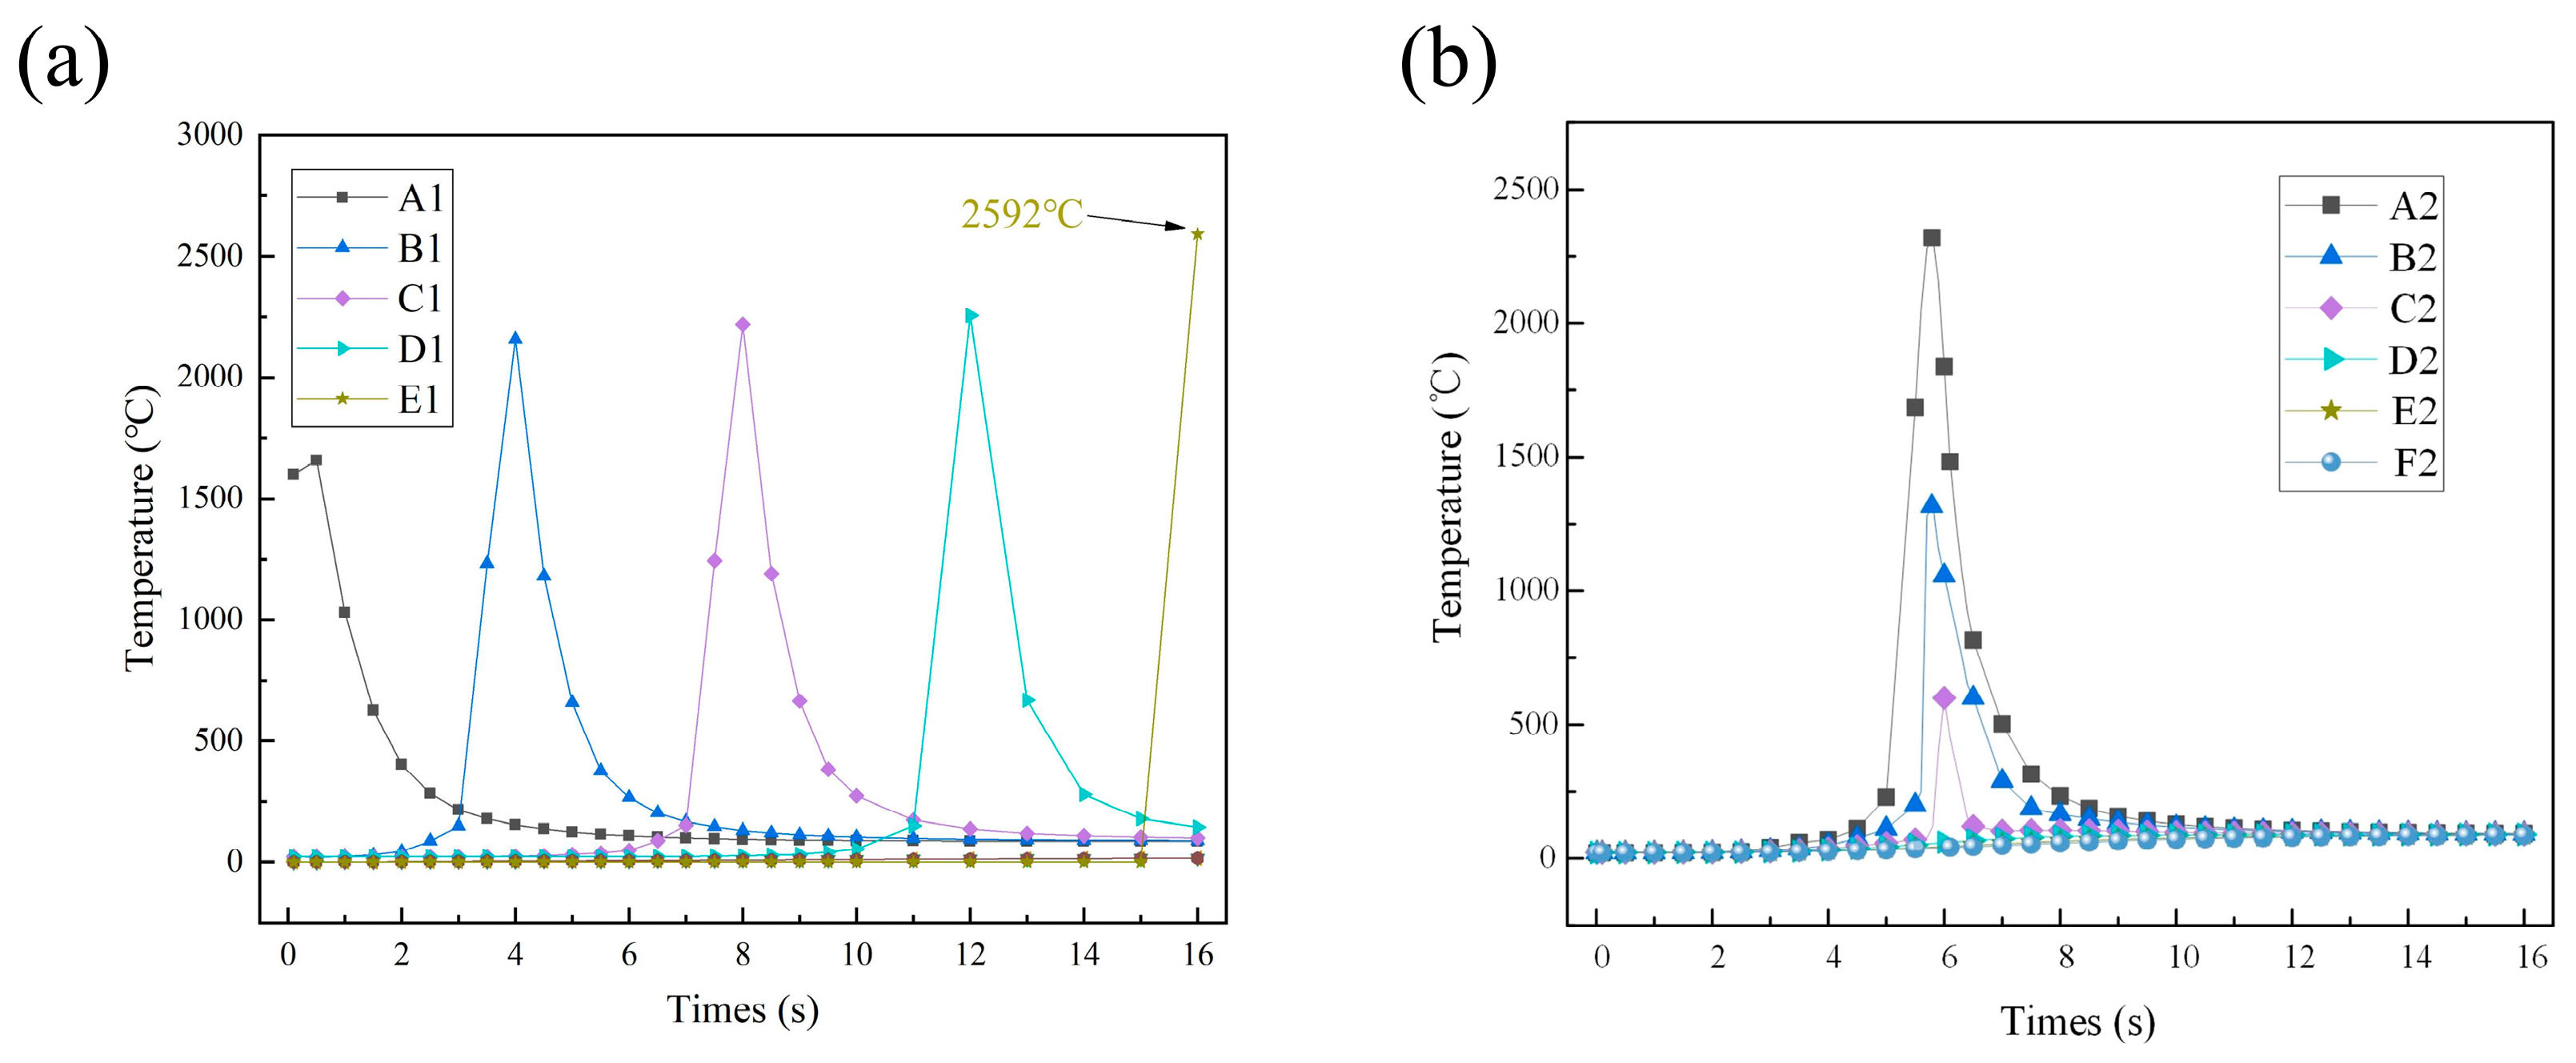
4.1. Distribution of Temperature Field under Different Laser Powers

Figure 3 shows the temperature field nephogram of the molten pool at 12 s under different laser powers ranging from 1400 W to 1700 W and a scanning speed of 180 mm/min. The maximum temperature of the molten pool increases with the increase in laser power from 1400 W to 1700 W, which are 2005.5, 2123.5, 2239.3, and 2357.4 °C, respectively. The reason for the increase in the molten pool temperature is as follows: according to the specific energy formula, when the scanning speed and spot diameter are constant, a high laser power results in a greater specific energy and high temperature.
Figure 4 illustrates the temperature fields of a cross-section of the molten pool under different powers of 1400, 1500, 1600, and 1700 W. As demonstrated, when the laser power increases from 1400 W to 1700 W, the depth of the molten pool increases from 1.60 mm to 2.04 mm, and the width of the molten pool increases from 2.00 mm to 2.72 mm. The shallow molten pool results in poor bonding strength due to the insufficient melt of the coating and substrate when the laser power is low. At the same time, the utilization rate of powder is decreased due to the presence of unmelted particles. The large laser energy produces the high dilution rate when the laser power is high, which leads to the flaw and deformation of the coating. In Figure 4, it is clearly shown that the molten pools with a laser power of 1500 W and 1600 W have an appropriate depth, which ensures a full melting of the powder, and makes the coating and substrate obtain good bonding strength. According to the temperature field nephogram and the temperature distribution of the molten pool cross-section, it can be concluded that the optimal laser power in this study is 1600 W.

4.2. Distribution of Temperature Field under Power of 1600 W at Different Time

The simulation of temperature field of the single-pass laser cladding under the laser power of 1600 W is performed to further investigate the temperature distribution characteristics of laser cladding, and the temperature nephograms of the coating at 0.1 s, 6 s, 8 s, and 16 s are illustrated in Figure 5.
As exhibited, the maximum temperature of the molten pool is 1599.5 °C at 0.1 s. The interface temperature is not enough to melt the substrate (Figure 5a), which makes the molten pool narrow. At 6 s, the maximum temperature of the molten pool reaches 2206.7 °C; the substrate melts at this temperature. The temperature field exhibits the elliptical shape and diffuses towards the surrounding area (Figure 5b). At 8 s, the maximum temperature and the range of the heat-affected zone gradually increases (Figure 5c). At 16 s, the laser cladding is completed, and the maximum temperature reaches 2591.9 °C (Figure 5d). It can be observed clearly that the maximum temperature of the molten pool gradually increases from 0.1 s to 16 s. This is mainly caused by the fact that the temperature field exhibits an elliptical distribution, which indicates that the temperature values are not uniformly distributed; therefore, the coating and substrate are preheated by the previous cladding process. However, it must be pointed out that due to the high heating and cooling rates during the process of laser cladding, the influence of the heat on the substrate is small, and heat-affected zone of the substrate is narrow, which not only ensures the original property of the substrate, but also reduces the thermal stress of the interface.
Furthermore, in order to investigate the temperature distribution of the molten pool cross-section, some points (Figure 6) are selected along the horizontal and vertical direction as the tracking paths, and the temperature change is shown in Figure 7. As illustrated, the temperature of the horizontal and vertical tracking paths exhibits changes periodically. Figure 7a illustrates that the temperature of each tracking point shows an upward trend in the early stage from beginning to end. When the temperature rises to the highest point, then it begins to decline, and the decline gradient changes from sharp to slow. In addition, Figure 7a also indicates that the highest temperature of the E1 point reaches 2592 °C due to heat accumulation during the laser cladding process.
Figure 7b indicates that the temperature gradually decreases from point A2 to point F2, and only three points of A2, B2, and C2 have temperatures above 500 °C; the temperature is close to 0 °C at D2, E2, and F2, which further confirms that laser cladding has a narrow heat-affected zone.

4.3. Macroscopic Morphology of the Coatings under Different Laser Powers

Figure 8 illustrates the macroscopic morphology of the coatings with different laser powers ranging from 1400 W to 1700 W and a scanning speed of 180 mm/min. As exhibited, when the laser power is 1400 W, the surface morphology of the coating exhibits poor continuity where there exists an obvious molten globule. The reason for this is that the coating does not fully melt under the low laser power, which leads to the partial powder peeling off (Figure 8a). With the increase in laser power, the energy density also increases, which makes the coating fully melt, have the high mobility, and present a continuous and flat surface. And, it is clear that the coating with a laser power of 1600 W has a better macroscopic quality than the coating with a laser power of 1500 W (Figure 8b,c). Because of the excessive melting of the substrate, the coating under the power of 1700 W produced thermal stress, which makes the surface of the coating present a rough and uneven shape (Figure 8d).
To sum up, it is apparent that the coating cladded by the laser power of 1600 W has the best macroscopic morphology. The experimental result is consistent with the result of the temperature field’s numerical simulation (Figure 3). Therefore, the accuracy of the simulation has been verified.

4.4. Phase Composition of the Coatings under Different Laser Powers

Figure 9 illustrates the XRD spectrum of the coatings under different laser powers ranging from 1400 W to 1700 W. The results show that the coatings consist of a BCC solid solution. Compared with the standard PDF card, it is conjectured that the BCC solid solution is the Fe-Cr phase.
In accordance with Bragg Equations (9) and (10), the lattice constants of the coatings under different powers were calculated [34].
2 d sin θ = n λ
d = a h 2 + k 2 + l 2
where d is the spacing between the planes in the lattice; θ is the angle between the incident ray and the scattering planes; n is the diffraction progression, n = 1; λ is the wavelength of the incident wave, λ = 1.54 Å.
For the cubic, the lattice distortion is expressed as follows [35]:
ε = | α α 0 | α 0
where ε is the lattice distortion, α is the actual lattice constant, and α0 is the theoretical lattice constant.
Table 3 shows the lattice constant and lattice distortion of the coatings under different laser powers. As illustrated, the lattice distortion of the coatings is 2.02–2.43 × 10⁻²; however, the lattice distortion of AlCoCrFeNi is 7.0 × 10⁻⁴ [36], which indicates that the Al2CrFeNiMo coating in this paper has the bigger lattice distortion.
When the laser power is 1400 W, because the depth of the molten pool is shallow, the atoms begin to solidify before fully diffusing, which leads to a lower solid solubility. Therefore, the lattice constant and lattice distortion of the coating are lower. When the laser power increases (1500 and 1600 W), the energy density and depth of the molten pool also increase, which makes the atomic diffuse sufficiently and improves the lattice constant and lattice distortion, as illustrated in Table 3. However, when the laser power increases to 1700 W, the elements of the coating are burned due to the large heat input, which results in the atomic concentration reducing; therefore, the lattice distortion is weakened. The above experimental results further verify the accuracy of the numerical simulation.

4.5. Microstructure of the Cladding Zone under Different Laser Powers

Figure 10 illustrates the microstructure of the cladding zone with a scanning speed of 180 mm/min and different powers ranging from 1400 W to 1700 W. It is observed that the grain size of the cladding zone is positively correlated with the laser power. When the laser power is 1400 W, a shallow molten pool is generated, and the shielding gas with a low temperature and fast flow rate carries away a large amount of heat and improves the rate of heat dissipation. Therefore, the fast cooling speed produces a large supercooling degree, which results in the formation of fine cellular crystals, as shown in Figure 10a.
When the laser power is 1500 W, the molten pool depth increases. At the initial stage of laser cladding, the substrate with a low temperature makes the bottom of the molten pool produce the fast cooling rate and large supercooling degree. Therefore, fine cellular crystals are formed. However, as the laser cladding progresses, the substrate temperature gradually increases, which leads to a worse heat dissipation effect, and then results in a decrease in the cooling rate and supercooling degree; finally, the equiaxed crystals are formed. Therefore, it can be observed that there are two types of grain morphologies from Figure 10b.
Under the laser power of 1600 W, the molten pool absorbs more heat, and the temperature of the substrate gradually is close to that of a molten pool. Therefore, the cooling effect cannot be achieved through the heat dissipation of the substrate. At the same time, the cooling mode is dominated by the common heat dissipation of the melting pool and the substrate. Due to the low cooling rate of this heat dissipation mode, the molten pool has a low degree of supercooling; thus, the cellular crystals are gradually transformed into equiaxed crystals, as shown in Figure 10c. The refined grain characteristics will significantly improve the microhardness of the coating.
Under the laser power of 1700 W, the substrate is significantly affected by the laser energy. The larger pool depth and width makes the existence time of the liquid increase, which leads to the grain growing up sufficiently. Therefore, the coarse and equiaxed crystals begin to emerge and tend to transform into dendrites, as shown in Figure 10d.
It should be pointed out that at the low powers (1400 and 1500 W), the cladding powder is melted sufficiently, and a few holes will be generated after the coating solidifies. At high powers (1600 and 1700 W), the fully melted powder increases the fluidity of the melt pool, which makes the coating form a dense microstructure.

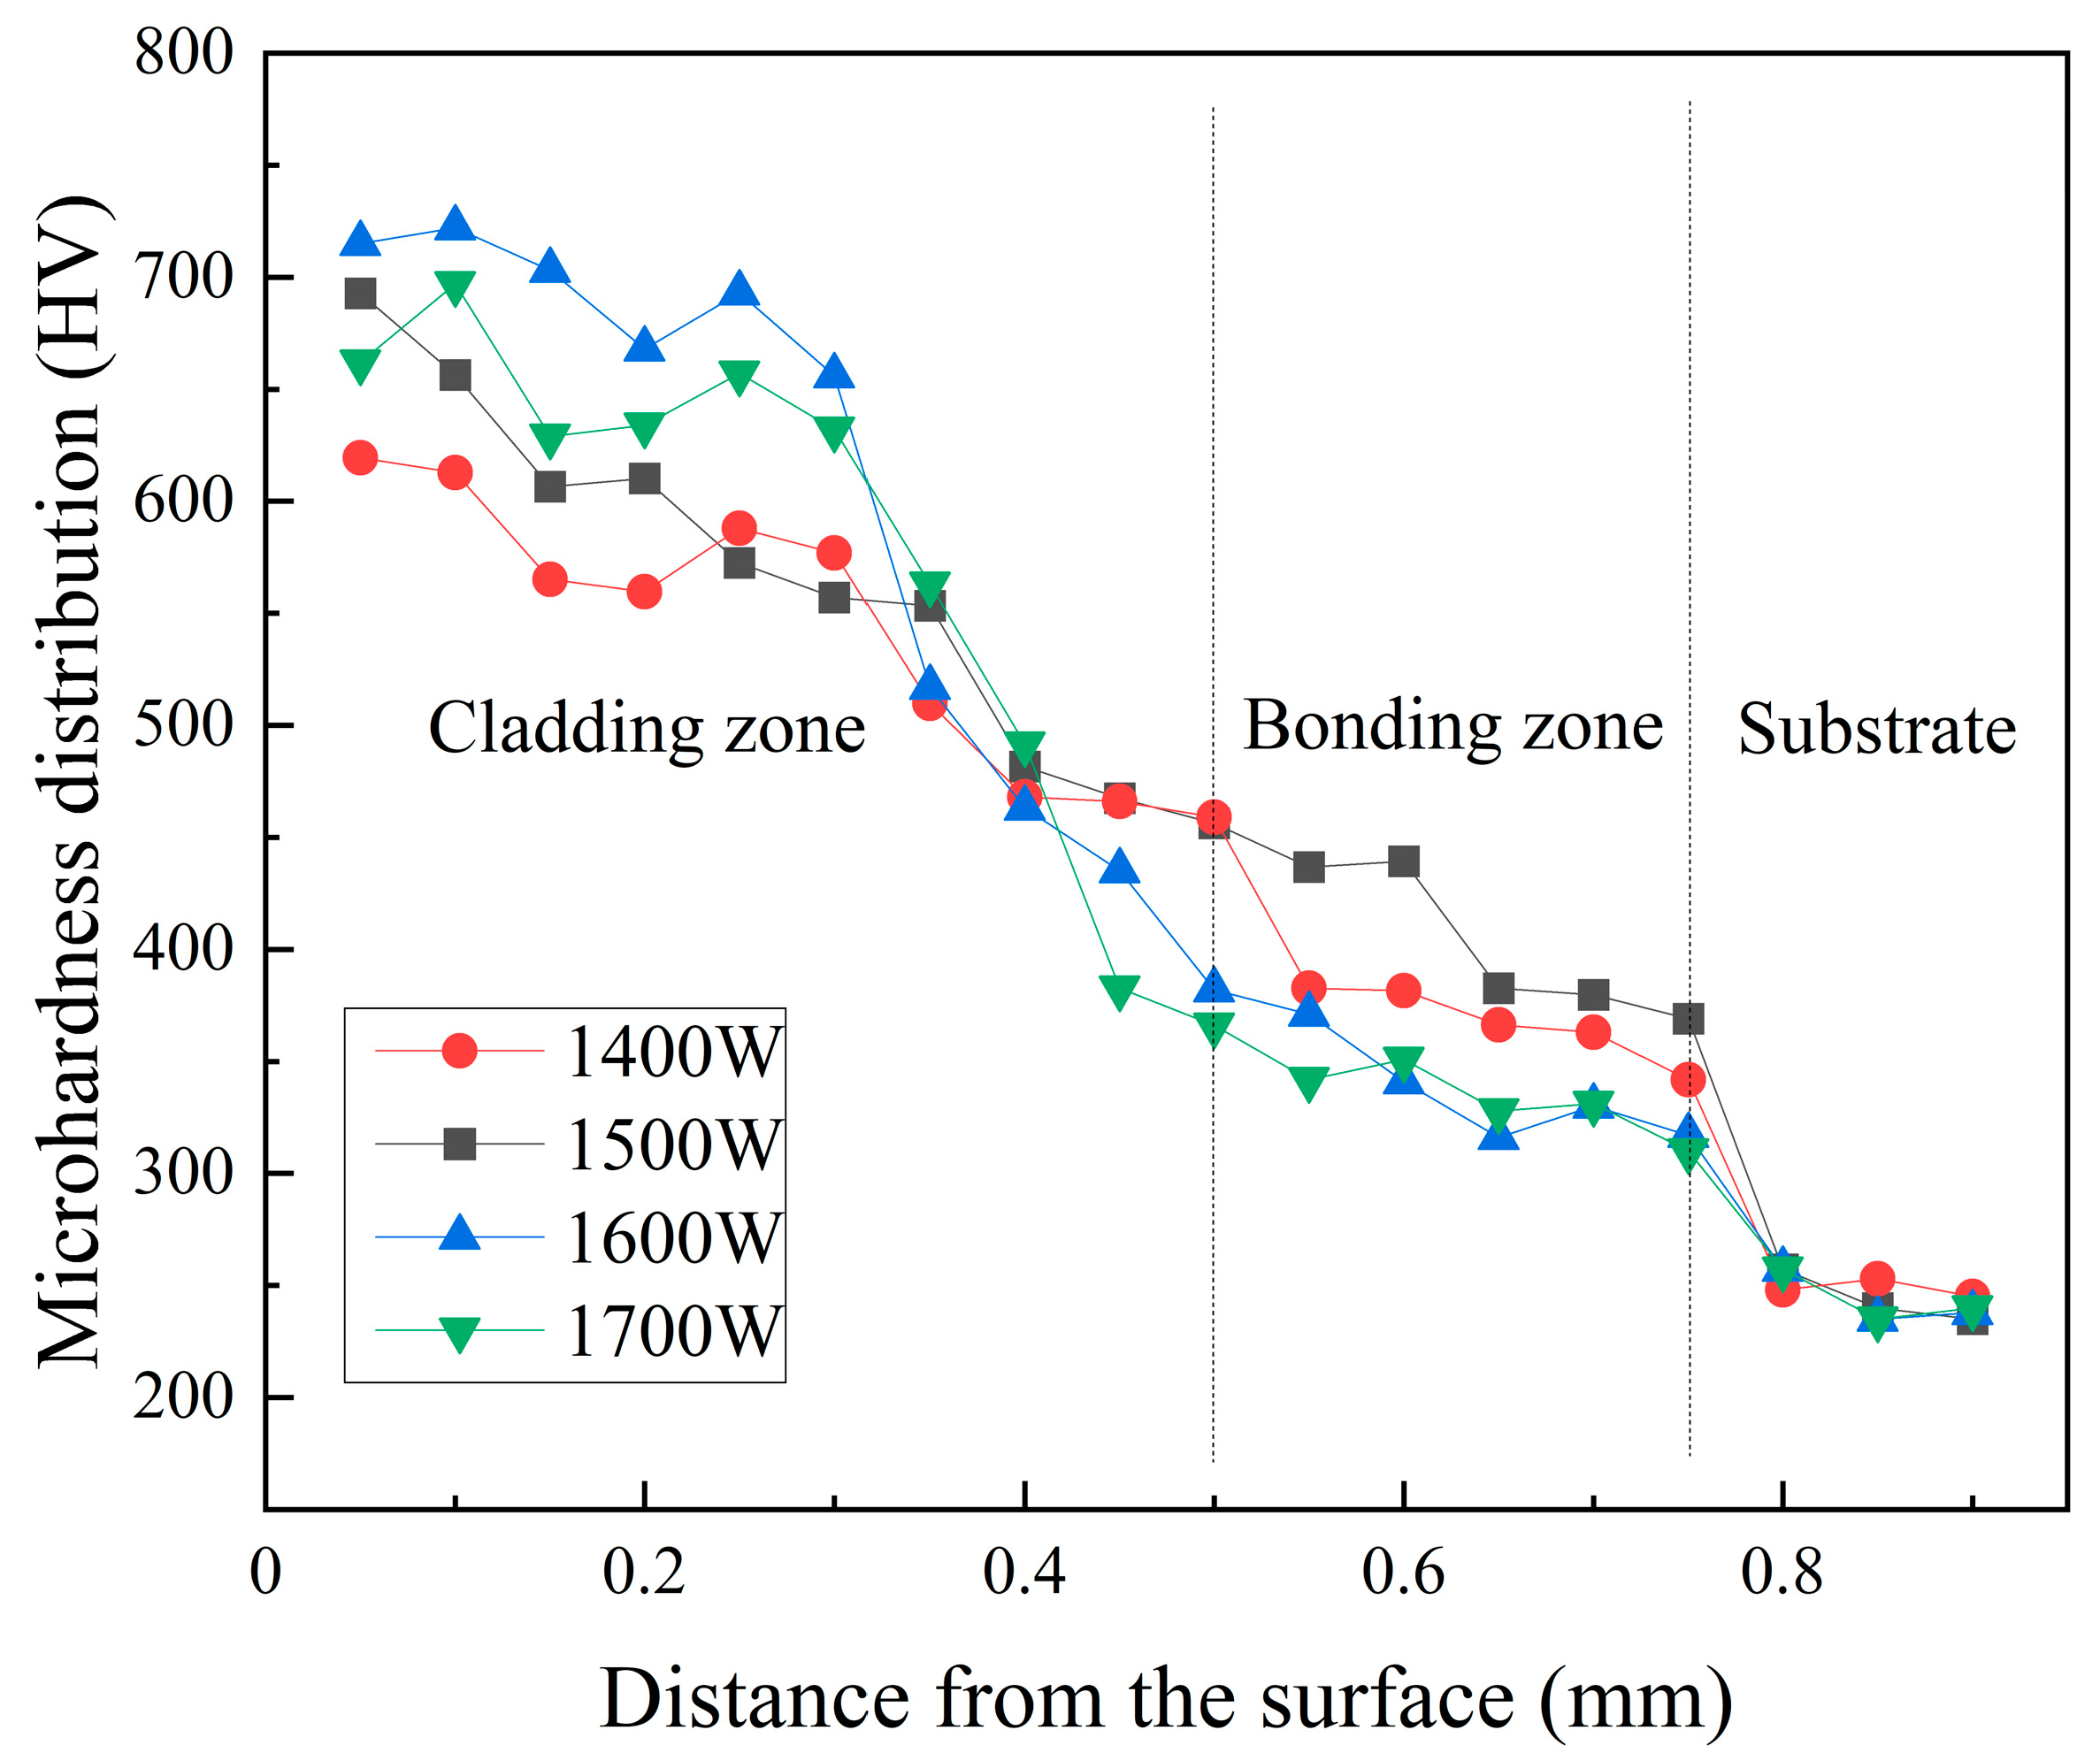
4.6. Hardness Analysis of Al2CrFeNiMo High-Entropy Cladding Layers under Different Laser Power

Figure 11 illustrates the cross-sectional hardness distribution curves of the coatings with powers from 1400 W to 1700 W. According to the figure, it is a fact that the microhardness of the coatings exhibits the same change trend: the hardness values of the cladding zone exhibit a minimal variation, while the microhardness of the bonding zone significantly decreases. The reasons are as follows: the microstructure of the cladding zone consists of fine cellular or equiaxed crystals, with the grain size gradually increasing from top to bottom. As a result, the microhardness curves in the cladding zone exhibit a slow declining trend. In the bonding zone, the microstructure consists of coarse columnar dendrites, which lead to a significant decrease in microhardness.
It is observed in Figure 11 that the average microhardness of the coatings under different powers are 545 HV (1400 W), 566 HV (1500 W), 600 HV (1600 W) and 572 HV (1700 W), respectively. It is clear that the microhardness of the coatings is 127~150% higher than that of the substrate (240 HV).
The main reason is that firstly, due to the characteristics of laser cladding, such as the small molten pool, high energy density, and fast cooling rate, the microstructure of coatings becomes fine and dense, resulting in fine grained strengthening [37]. Secondly, within the coatings exists the high lattice distortion (Table 3), which makes the internal energy and micro-stress of the coatings increase, hinders the dislocation movement, and improves the microhardness of coatings [38]. Finally, according to the XRD analysis results, the cladding layers are composed of a BCC structure with high microhardness. Furthermore, the dislocation type in the BCC solid solution is the screw dislocation. Compared with other dislocation types, the dislocation movement of the screw dislocation is more difficult, which also improves the microhardness of the coatings.
Moreover, it is found that the coating with a power of 1600 has the highest microhardness, as exhibited in Figure 11. This is mainly caused by the fact that the hardness of coatings is affected by the degree of grain strengthening, solution strengthening, and the dense microstructure. The coating with a power of 1600 has the high lattice distortion, which produces a large solution strengthening. At the same time, the coating also has the fine equiaxed grain and dense microstructure. The comprehensive effect of the above reasons makes the coating with the power of 1600 W have a high microhardness; the highest hardness even reaches to 725 HV, which is 202% higher than that of the substrate.
Nevertheless, it is clear that the laser power reaches to 1700 W, and a decrease in the microhardness in the coating is observed. This is mainly due to the dilution of magnesium in the substrate, coarse dendrites, and low lattice distortion (2.02 × 10⁻²).

5. Conclusions

(1)
We used the double ellipsoidal heat source to establish a finite element model to simulate the process of laser cladding Al2CrFeNiMo on Cr12MoV. The optimal process parameters are obtained through the simulation, and are the power of 1600 W and the scanning speed of 180 mm/min. The simulated melt pool depth is 1.82 mm under these parameters.
(2)
The results of the temperature field simulation showed that the temperature field exhibited a elliptical distribution. The temperature on the horizontal and vertical tracking paths presented a periodic change. The quality of cladding layers was ensured due to the stable heat transfer during the laser cladding process, and the small range of the heat-affected zone.
(3)
Al2CrFeNiMo coatings under different powers ranging from1400 W to 1700 W were prepared. It was found that the coating morphology under the laser power of 1600 W was smoother and better than that of other powers. The result of XRD showed that the coatings under different powers were all composed of BCC, and had different degrees of lattice distortion. At the laser power of 1600 W, the lattice distortion value of the coating was the maximum, which was 2.43 × 10⁻², and the solid solution strengthening effect was the best.
(4)
With the increase in laser power, the microstructure changed from a cellular crystal to equiaxed crystal, and the grain size gradually increased. The microhardness of the coatings is 127~150% higher than that of the substrate (240 HV). The coating with the power of 1600 W has a high microhardness; the highest hardness even reaches to 725 HV, which is 202% higher than that of the substrate.

Author Contributions

Conceptualization, S.J. and Y.T.; methodology, Y.T.; software, S.J. and Y.T.; validation, S.J., Y.T. and S.B.; investigation, S.J. and Y.T.; data curation, P.L.; writing—original draft preparation, S.J. and Y.T.; writing—review and editing, Y.G. All authors have read and agreed to the published version of the manuscript.

Funding

This work was supported by the Project of Science and Technology research of Department of Education of Jilin Province (20220098KJ), (JJKH20240135KJ), the Natural Science Foundation of Science and Technology Department of Jilin Province (20230101335JC).

Data Availability Statement

Data are contained within the article.

Conflicts of Interest

The authors declare that they have no known competing financial interests or personal relationships that could have appeared to influence the work reported in this paper.

References

  1. Sun, S.; Fu, H.; Ping, X.; Lin, J.; Lei, Y.; Wu, W.; Zhou, J. Reinforcing behavior and microstructure evolution of NbC in laser cladded Ni45 coating. Appl. Surf. Sci. 2018, 455, 160–170. [Google Scholar] [CrossRef]
  2. Huang, L.; Zhou, J.; Xu, J.; Huo, K.; He, W.; Meng, X.; Huang, S. Microstructure and wear resistance of electromagnetic field assisted multi-layer laser clad Fe901 coating. Surf. Coat. Technol. 2020, 395, 125876. [Google Scholar] [CrossRef]
  3. Yan, H.; Chen, Z.; Zhao, J.; Zhang, P.; Yu, Z.; Lu, Q. Enhancing tribological properties of WS2/NbC/Co-based self-lubricating coating via laser texturing and laser cladding two-step process. J. Mater. Res. Technol. 2020, 9, 9907–9919. [Google Scholar] [CrossRef]
  4. Shi, J.; Kong, D. Effects on Al2O3 and La2O3 additions on electrochemical performances of laser-cladded WC10Co4Cr coatings. Int. J. Appl. Ceram. Technol. 2021, 19, 436–450. [Google Scholar]
  5. Liu, M.; Duan, C.; Li, G.; Cai, Y.; Wang, F. Friction property and milling machinability of Ni60 cladding layer in hybrid additive-subtractive manufacturing. J. Manuf. Process. 2023, 93, 162–172. [Google Scholar] [CrossRef]
  6. Sun, S.; Fu, H.; Ping, X.; Guo, X.; Lin, J.; Lei, Y.; Wu, W.; Zhou, J. Effect of liquid nitrogen cooling on grain growth and properties of laser cladding in-situ (Ti, Nb)C/Ni composite coatings. Mater. Charact. 2019, 152, 115–129. [Google Scholar]
  7. Yang, C.; Liu, X.; Liu, Y.; Zhu, Z.; Meng, Y.; Zhou, H.; Zhang, S. Effect of Cu-doping on tribological properties of laser-cladded FeCoCrNiCux high-entropy alloy coatings. Tribol. Int. 2023, 188, 108868. [Google Scholar] [CrossRef]
  8. Zhang, H.; Wu, W.; He, Y.; Li, M.; Guo, S. Formation of core–shell structure in high-entropy alloy coating by laser cladding. Appl. Surf. Sci. 2016, 363, 543–547. [Google Scholar] [CrossRef]
  9. Liu, Z.; Kong, D. Effects of TiC mass fraction on microstructure, corrosive–wear and electrochemical properties of laser cladded CoCrFeNiMo high–entropy alloy coatings. Tribol. Int. 2023, 186, 108640. [Google Scholar]
  10. Cai, Y.; Chen, Y.; Manladan, S.M.; Luo, Z.; Gao, F.; Li, L. Influence of dilution rate on the microstructure and properties of FeCrCoNi high-entropy alloy coating. Mater. Des. 2018, 142, 124–137. [Google Scholar] [CrossRef]
  11. Cai, Y.; Zhu, L.; Cui, Y.; Geng, K.; Han, T.; Manladan, S.M.; Luo, Z.; Han, J. Influence of high-temperature condition on the microstructure and properties of FeCoCrNiAl0.3 and FeCoCrNiAl0.7 high-entropy alloy coatings. Surf. Eng. 2020, 37, 179–187. [Google Scholar] [CrossRef]
  12. Cai, Y.; Zhu, L.; Cui, Y.; Geng, K.; Manladan, S.M.; Luo, Z.; Han, J. Strengthening mechanisms in multi-phase FeCoCrNiAl1.0 high-entropy alloy cladding layer. Mater. Charact. 2020, 159, 110037. [Google Scholar] [CrossRef]
  13. Li, C.; Yu, Z.; Gao, J.; Zhao, J.; Han, X. Numerical simulation and experimental study of cladding Fe60 on an ASTM 1045 substrate by laser cladding. Surf. Coat. Technol. 2019, 357, 965–977. [Google Scholar] [CrossRef]
  14. Gao, J.; Wu, C.; Hao, Y.; Xu, X.; Guo, L. Numerical simulation and experimental investigation on three-dimensional modelling of single-track geometry and temperature evolution by laser cladding. Opt. Laser Technol. 2020, 129, 106287. [Google Scholar] [CrossRef]
  15. Chai, Q.; Fang, C.; Qiu, X.; Xing, Y.; Sun, G. Modeling of temperature field and profile of Ni60AA formed on cylindrical 316 stainless steel by laser cladding. Surf. Coat. Technol. 2021, 428, 127865. [Google Scholar] [CrossRef]
  16. Yang, C.; Tan, Y.; Liu, Y.; Xia, P.; Cui, Y.; Zheng, B. Modeling and Optimization of Laser Cladding Fixation Process for Optical Fiber Sensors in Harsh Environments. Sensors 2022, 22, 2569. [Google Scholar] [CrossRef] [PubMed]
  17. Yao, F.; Fang, L. Thermal Stress Cycle Simulation in Laser Cladding Process of Ni-Based Coating on H13 Steel. Coatings 2021, 11, 203. [Google Scholar] [CrossRef]
  18. Chai, Q.; Zhang, H.; Fang, C.; Qiu, X.; Xing, Y. Numerical and experimental investigation into temperature field and profile of Stellite6 formed by ultrasonic vibration-assisted laser cladding. J. Manuf. Process. 2023, 85, 80–89. [Google Scholar] [CrossRef]
  19. Wang, L.; Zhang, D.; Chen, C.; Fu, H.; Sun, X. Multi-physics field coupling and microstructure numerical simulation of laser cladding for engine crankshaft based on CA-FE method and experimental study. Surf. Coat. Technol. 2022, 438, 128396. [Google Scholar] [CrossRef]
  20. Yang, J.; Aiyiti, W.; Jiang, H.; Shan, J.; Zhang, Y. Evolution of molten pool morphology and prediction of inclined cladding layer morphology. Opt. Laser Technol. 2021, 142, 107164. [Google Scholar] [CrossRef]
  21. Bhowmik, A.; Yang, Y.; Zhou, W.; Chew, Y.; Bi, G. On the heterogeneous cooling rates in laser-clad Al-50Si alloy. Surf. Coat. Technol. 2021, 408, 126780. [Google Scholar] [CrossRef]
  22. Lee, Y.; Nordin, M.; Babu, S.; Farson, D. Effect of Fluid Convection on Dendrite Arm Spacing in Laser Deposition. Metall. Mater. Trans. B 2014, 45, 1520–1529. [Google Scholar] [CrossRef]
  23. He, F.; Zhou, H.; Li, K.; Zhu, Y.; Wang, Z. Numerical Analysis and Experimental Verification of Melt Pool Evolution during Laser Cladding of 40CrNi2Si2MoVA Steel. J. Therm. Spray Technol. 2023, 32, 1416–1432. [Google Scholar] [CrossRef]
  24. Zhang, D.; Hao, Y.; Li, J. Simulation and Verification of Temperature Field on Cr12MoV Laser Cladding. Hot Work. Technol. 2016, 45, 157–160+164. [Google Scholar]
  25. Hua, L.; Tian, W.; Liao, W.; Zeng, C. Numerical Simulation of Temperature Field and Residual Stress Distribution for Laser Cladding Remanufacturing. Adv. Mech. Eng. 2014, 6, 291615. [Google Scholar] [CrossRef]
  26. Liu, H.; Li, M.; Qin, X.; Huang, S.; Hong, F. Numerical simulation and experimental analysis of wide-beam laser cladding. Int. J. Adv. Manuf. Technol. 2018, 100, 237–249. [Google Scholar] [CrossRef]
  27. Li, C.; Liu, C.; Li, S.; Zhang, Z.; Zeng, M.; Wang, F.; Wang, J.; Guo, Y. Numerical Simulation of Thermal Evolution and Solidification Behavior of Laser Cladding AlSiTiNi Composite Coatings. Coatings 2019, 9, 391. [Google Scholar] [CrossRef]
  28. Meng, G.; Zhang, J.; Li, J.; Jiang, Z.; Gong, Y.; Zhao, J. Impact of pore defects on laser additive manufacturing of Inconel 718 alloy based on a novel finite element model: Thermal and stress evaluation. Opt. Laser Technol. 2023, 167, 109782. [Google Scholar] [CrossRef]
  29. Lou, X.; Liu, M.; Li, Z.; Li, H.; Shen, J. Effect of Different Heat-Source Models on Calculated Temperature Field of Selective Laser Melted 18Ni300. Chin. J. Lasers 2021, 48, 52–62. [Google Scholar]
  30. Song, M.; Wu, L.; Liu, J.; Hu, Y. Effects of laser cladding on crack resistance improvement for aluminum alloy used in aircraft skin. Opt. Laser Technol. 2021, 133, 106531. [Google Scholar] [CrossRef]
  31. Wu, S.; Liu, Z.; Gong, Y.; Liang, X.; Wu, Y.; Zhao, X. Analysis of the sequentially coupled thermal–mechanical and cladding geometry of a Ni60A-25 %WC laser cladding composite coating. Opt. Laser Technol. 2023, 167, 109595. [Google Scholar] [CrossRef]
  32. Sun, S.; Fu, H.; Chen, S.; Ping, X.; Wang, K.; Guo, X.; Lin, J.; Lei, Y. A numerical-experimental investigation of heat distribution, stress field and crack susceptibility in Ni60A coatings. Opt. Laser Technol. 2019, 117, 175–185. [Google Scholar] [CrossRef]
  33. Sun, J.; Klassen, J.; Nitschke-pagel, T.; Dilger, K. Effects of heat source geometric parameters and arc efficiency on welding temperature field, residual stress, and distortion in thin-plate full-penetration welds. J. Adv. Manuf. Technol. 2018, 99, 497–515. [Google Scholar] [CrossRef]
  34. Zhao, T.; Wang, L.; Zhang, S. Effect of synergistic cavitation erosion-corrosion on cavitation damage of CoCrFeNiMn high entropy alloy layer by laser cladding. Surf. Coat. Technol. 2023, 472, 129940. [Google Scholar] [CrossRef]
  35. Liu, X.; Lei, W.; Ma, L.; Liu, J.; Liu, J.L.; Cui, J. On the microstructures, phase assemblages and properties of Al0.5CoCrCuFeNiSix high-entropy alloys. J. Alloys Compd. 2015, 630, 151–157. [Google Scholar] [CrossRef]
  36. Zhu, J.; Fu, H.; Zhang, H. Synthesis and properties of multiprincipal component AlCoCrFeNiSix alloys. Mater. Sci. Eng. 2010, 527, 7210–7214. [Google Scholar] [CrossRef]
  37. Wang, C.; Li, J.; Wang, T.; Chai, L.; Deng, C.; Wang, Y.; Huang, Y. Microstructure and properties of pure titanium coating on Ti-6Al-4V alloy by laser cladding. Surf. Coat. Technol. 2021, 416, 127137. [Google Scholar] [CrossRef]
  38. Liu, A.; Jing, Y.; Cui, X.; Ding, Q.; Song, Y.; Jin, G. Influence of atomic size effect on the properties of high entropy alloy coatings. Mater. Today Commun. 2023, 37, 107150. [Google Scholar] [CrossRef]
Figure 1. Double ellipsoidal heat source model diagram.
Processes 12 00257 g001
Figure 2. Thermophysical parameters of Cr12MoV and Al2CrFeNiMo powder. (a) Specific heat; (b) density; (c) thermal expansion coefficient; (d) thermal conductivity.
Processes 12 00257 g002
Figure 3. Temperature field nephogram of the molten pool at 12 s under different powers. (a) 1400 W; (b) 1500 W; (c) 1600 W; (d) 1700 W.
Processes 12 00257 g003
Figure 4. Temperature field nephogram of the molten pool under different laser powers. (a) 1400 W; (b) 1500 W; (c) 1600 W; (d) 1700 W.
Processes 12 00257 g004
Figure 5. Temperature nephograms under the power of 1600 W at different times. (a) 0.1 s; (b) 6 s; (c) 8 s; (d) 16 s.
Processes 12 00257 g005
Figure 6. Tracking paths. (a) Horizontal tracking paths; (b) vertical tracking paths.
Processes 12 00257 g006
Figure 7. Change of temperature under different tracking paths. (a) Horizontal tracking paths; (b) vertical tracking paths.
Processes 12 00257 g007
Figure 8. Macroscopic morphology of the coating under different laser powers. (a) 1400 W; (b) 1500 W; (c) 1600 W; (d) 1700 W.
Processes 12 00257 g008
Figure 9. XRD spectrum of the coatings under different laser powers.
Processes 12 00257 g009
Figure 10. Microstructure of the cladding zone under different laser powers. (a) 1400 W; (b) 1500 W; (c) 1600 W; (d) 1700 W.
Processes 12 00257 g010
Figure 11. Microhardness of coatings under different powers.
Processes 12 00257 g011
Table 1. Chemical composition of Cr12MoV die steel (wt.%).
ElementsCSiMnCrMoVFe
Mass percentage1.4~1.70≤0.4≤0.411.0~12.50.4~0.60.2~0.3Bal.
Table 2. Chemical composition of Al2CrFeNiMo (wt.%).
ElementAlCrFeNiMo
Mass percentage17.0516.4317.6518.5530.32
Table 3. Lattice constants and lattice distortion values of Al2CrFeNiMo coatings.
Power (P)1400 W1500 W1600 W1700 W
2θ (°)43.53743.40643.40843.592
Lattice constant (Å)2.9372.9462.9462.934
Lattice distortion2.12 × 10−22.43 × 10−22.43 × 10−22.02 × 10⁻²
Disclaimer/Publisher’s Note: The statements, opinions and data contained in all publications are solely those of the individual author(s) and contributor(s) and not of MDPI and/or the editor(s). MDPI and/or the editor(s) disclaim responsibility for any injury to people or property resulting from any ideas, methods, instructions or products referred to in the content.

