1. Introduction
Hypersonic vehicles generate very high near-wall temperatures due to their strong bows, leading-edge shock waves and a large kinetic energy dissipation. These high temperatures lead to real gas effects, meaning that the assumption of calorically perfect gas is invalid. Real gas effects [
1] is a general term for several sophisticated physical and chemical phenomena, including vibrational energy excitation, the dissociation and ionization of air components, and hydrocarbon chemical reaction. These phenomena result in a more complex turbulence mechanism and pose several challenges to the design of hypersonic and supersonic vehicles.
As computer technology and computational fluid dynamics evolve, direct numerical simulation (DNS) approaches [
2] provide the most detailed turbulent flow field information and have been used to analyze turbulence statistics and turbulence structures. To solve high-temperature flow problems with the Navier–Stokes equations, the transport coefficient must first be determined, including the viscosity. The viscosity is mainly determined by temperature, but its response is also affected by different species components. When the turbulent flows are coupled with chemical reactions, the effects of temperature and species on viscosity need to be considered. At this point, the viscosity can be obtained from the mixture rule (VM) [
3,
4]. When turbulent flows are not accompanied by chemical reactions, the viscosity is just a function of temperature, for which a power law (VP) or Sutherland’s law (VS) [
5] is appropriate.
The DNS of hypersonic and supersonic turbulent flows is mainly based on VP [
6,
7,
8,
9,
10] and VS [
11,
12,
13,
14,
15,
16]. The DNS of compressible turbulent channel flows was first studied by Coleman et al. [
6] and Huang et al. [
7]. Baranwal et al. [
8] studied the impact of compressibility on the near-wall, asymptotic behavior of turbulent fluxes using DNS, while Volpiani et al. [
9] studied the influence of nonadiabatic walls on supersonic shock/turbulent-boundary-layer interactions. Ghosh et al. [
10] investigated the similarities and differences between supersonic turbulent channel flows and pipe flows. Yao and Hussain [
11] performed DNS at Mach numbers of 0.8 and 1.5 with Reynolds numbers varying from 3000 to 34,000 to obtain turbulence statistics and study the coherent structures. Tang et al. [
12] performed DNS at Mach numbers of 3.83 and 1.56, and investigated the near-wall structure and statistics of fluctuating pressure with an isothermal wall. Yu et al. [
13] performed DNS of channel flows at different Mach numbers to study the genuine compressibility effects. Zhang and Xia [
14] produced exact expressions for the mean heat flux at the wall for the compressible turbulent channel flows, and used DNS to validate their results at different Reynolds numbers and Mach numbers. Chen et al. [
15] performed DNS of supersonic turbulent channel flows in thermally perfect gas for various dimensional wall temperatures, enabling them to determine the effects of wall temperature on the velocity–temperature correlations. Chen et al. [
16] also proposed an energy transfer mechanism for thermally perfect gas and calorically perfect gas in high-temperature supersonic turbulent channel flows (HTSTCF), and verified it through DNS.
When a chemical reaction is considered, the DNS of hypersonic and supersonic flows is more complex because several physical and chemical models [
17,
18] must be implemented. Duan et al. [
19] performed DNS under different enthalpy conditions in air to investigate the influence of enthalpy condition on the hypersonic turbulent boundary layer (HTBL). Passiatore et al. [
20] also studied the high-enthalpy effects on HTBL and compared it with the DNS under the frozen-chemistry assumption. Li et al. [
21] also performed a DNS to investigate the wall heat transfer between different enthalpy conditions for HTBL, while Chen and Li [
22] investigated the turbulence characteristics in HTSTCF. It should be emphasized that all of the aforementioned studies in this paragraph were based on VM.
Many studies of high-temperature flow under chemical equilibrium have been conducted recently [
23,
24,
25,
26,
27,
28,
29]. Pish et al. [
23] studied the chemical reaction effects on the characteristic of hypersonic flow around a blunted cone. Upwind parabolized Navier–Stokes [
24] is another computational fluid dynamic code that is dedicated to the solution of hypersonic flows in chemical equilibrium and non-equilibrium conditions. Chen et al. [
25] performed DNS of chemical equilibrium to investigate the effects of different coupling conditions. They found that many turbulence statistics and large-scale structures which hold for calorically perfect gas also hold for chemical equilibrium. Although some achievements have been made in the study of chemical equilibrium, the understanding of chemical equilibrium still needs further improvement.
The objective of this study is to perform two DNS of temporally evolving HTSTCFs and study the effects of the viscosity law on the turbulence statistics and large structures needed for chemical equilibrium. Turbulence statistics include mean turbulence statistics, fluctuating turbulence statistics, a strong Reynolds analogy, and a turbulent kinetic energy budget. The assumption of this gas model is that the rates of excitation of vibrational energy and chemical reaction are infinitely fast. The rest of this paper has the following structure. A brief introduction of the governing equations is given in
Section 2.
Section 3 presents the details of the DNS. DNS results and discussions are presented in
Section 4, mainly including turbulence statistics and instantaneous structures. Finally, conclusions are drawn in
Section 5.
2. Governing Equations
In this work, the subscripts r c, w, and s denote reference, center, wall, and species, respectively. A double asterisk ** indicates dimensional flow variables, with the corresponding dimensionless flow variables being denoted by the same symbols but without asterisks.
2.1. Navier–Stokes Equations
The time-dependent, three-dimensional, and non-dimensional forms of the compressible Navier–Stokes equations are considered. Non-dimensionalization is based on the reference conditions and the following reference quantities are chosen: reference length
, reference velocity
, reference density
, reference temperature
, and reference viscosity
The non-dimensional formulas are as follows:
where
is the velocity vector in the
direction.
The governing equations of mass, momentum and energy conservation can be described by:
where
,
, and
are the body force vector, Kronecker tensor, and Reynolds number.
The assumption is that each species is a perfect gas; based on Dalton’s law, the equation of state for the mixture pressure is as follows:
where
,
,
,
, and
are the
sth species pressure, the number of species, the
sth species mass fraction, the species molecular weight, and the gas constant. The viscous stress
modelled as
The total energy
and heat flux
are as follows:
where
is the Prandtl number. The NASA Lewis (now Glenn) Research Center has been compiling and disseminating thermodynamic data for use in its chemical equilibrium programs. The specific heat
and enthalpy
are determined by work of Mcbride and Zehe [
19]:
where the curve-fitting coefficients are
and
, respectively.
2.2. Species Equations
The five-species mixture (
) chemistry model of atomic oxygen (
), molecular oxygen (
), nitric oxide (
), atomic nitrogen (
), and molecular nitrogen (
) was considered in this study. This model is a good approximation at temperatures below about 10,000 K and represents realistic reactions of air in the absence of ionization. For chemical equilibrium, the chemical reactions are as follows:
The equations for the species pressure can be represented by the following expressions:
Equation (11) is Dalton’s law, which states that the total pressure of the mixture is the sum of the partial pressures. Equations (12)–(14) represent the equilibrium constant
(determined by temperature) for the three chemical reactions [
17]. Equation (15) is the mass balance equation.
2.3. Viscosity Laws
Two viscosity laws have been selected to study the viscosity law effects: the mixture rule and Sutherland’s law.
① Mixture rule (VM). The viscosity is not only affected by temperature, but also by the species mass fraction. The theoretical solutions of transport properties are very complex and semi-empirical formulas and curve-fitting are introduced. The species viscosity
is determined by Gupta [
3]:
where
(
) are constant coefficients. The mixture rule for viscosity is Wilke’s rule [
4]:
where
are the mole fractions.
② Sutherland’s law (VS) [
5]. The viscosity only changes with temperature, and is written as follows:
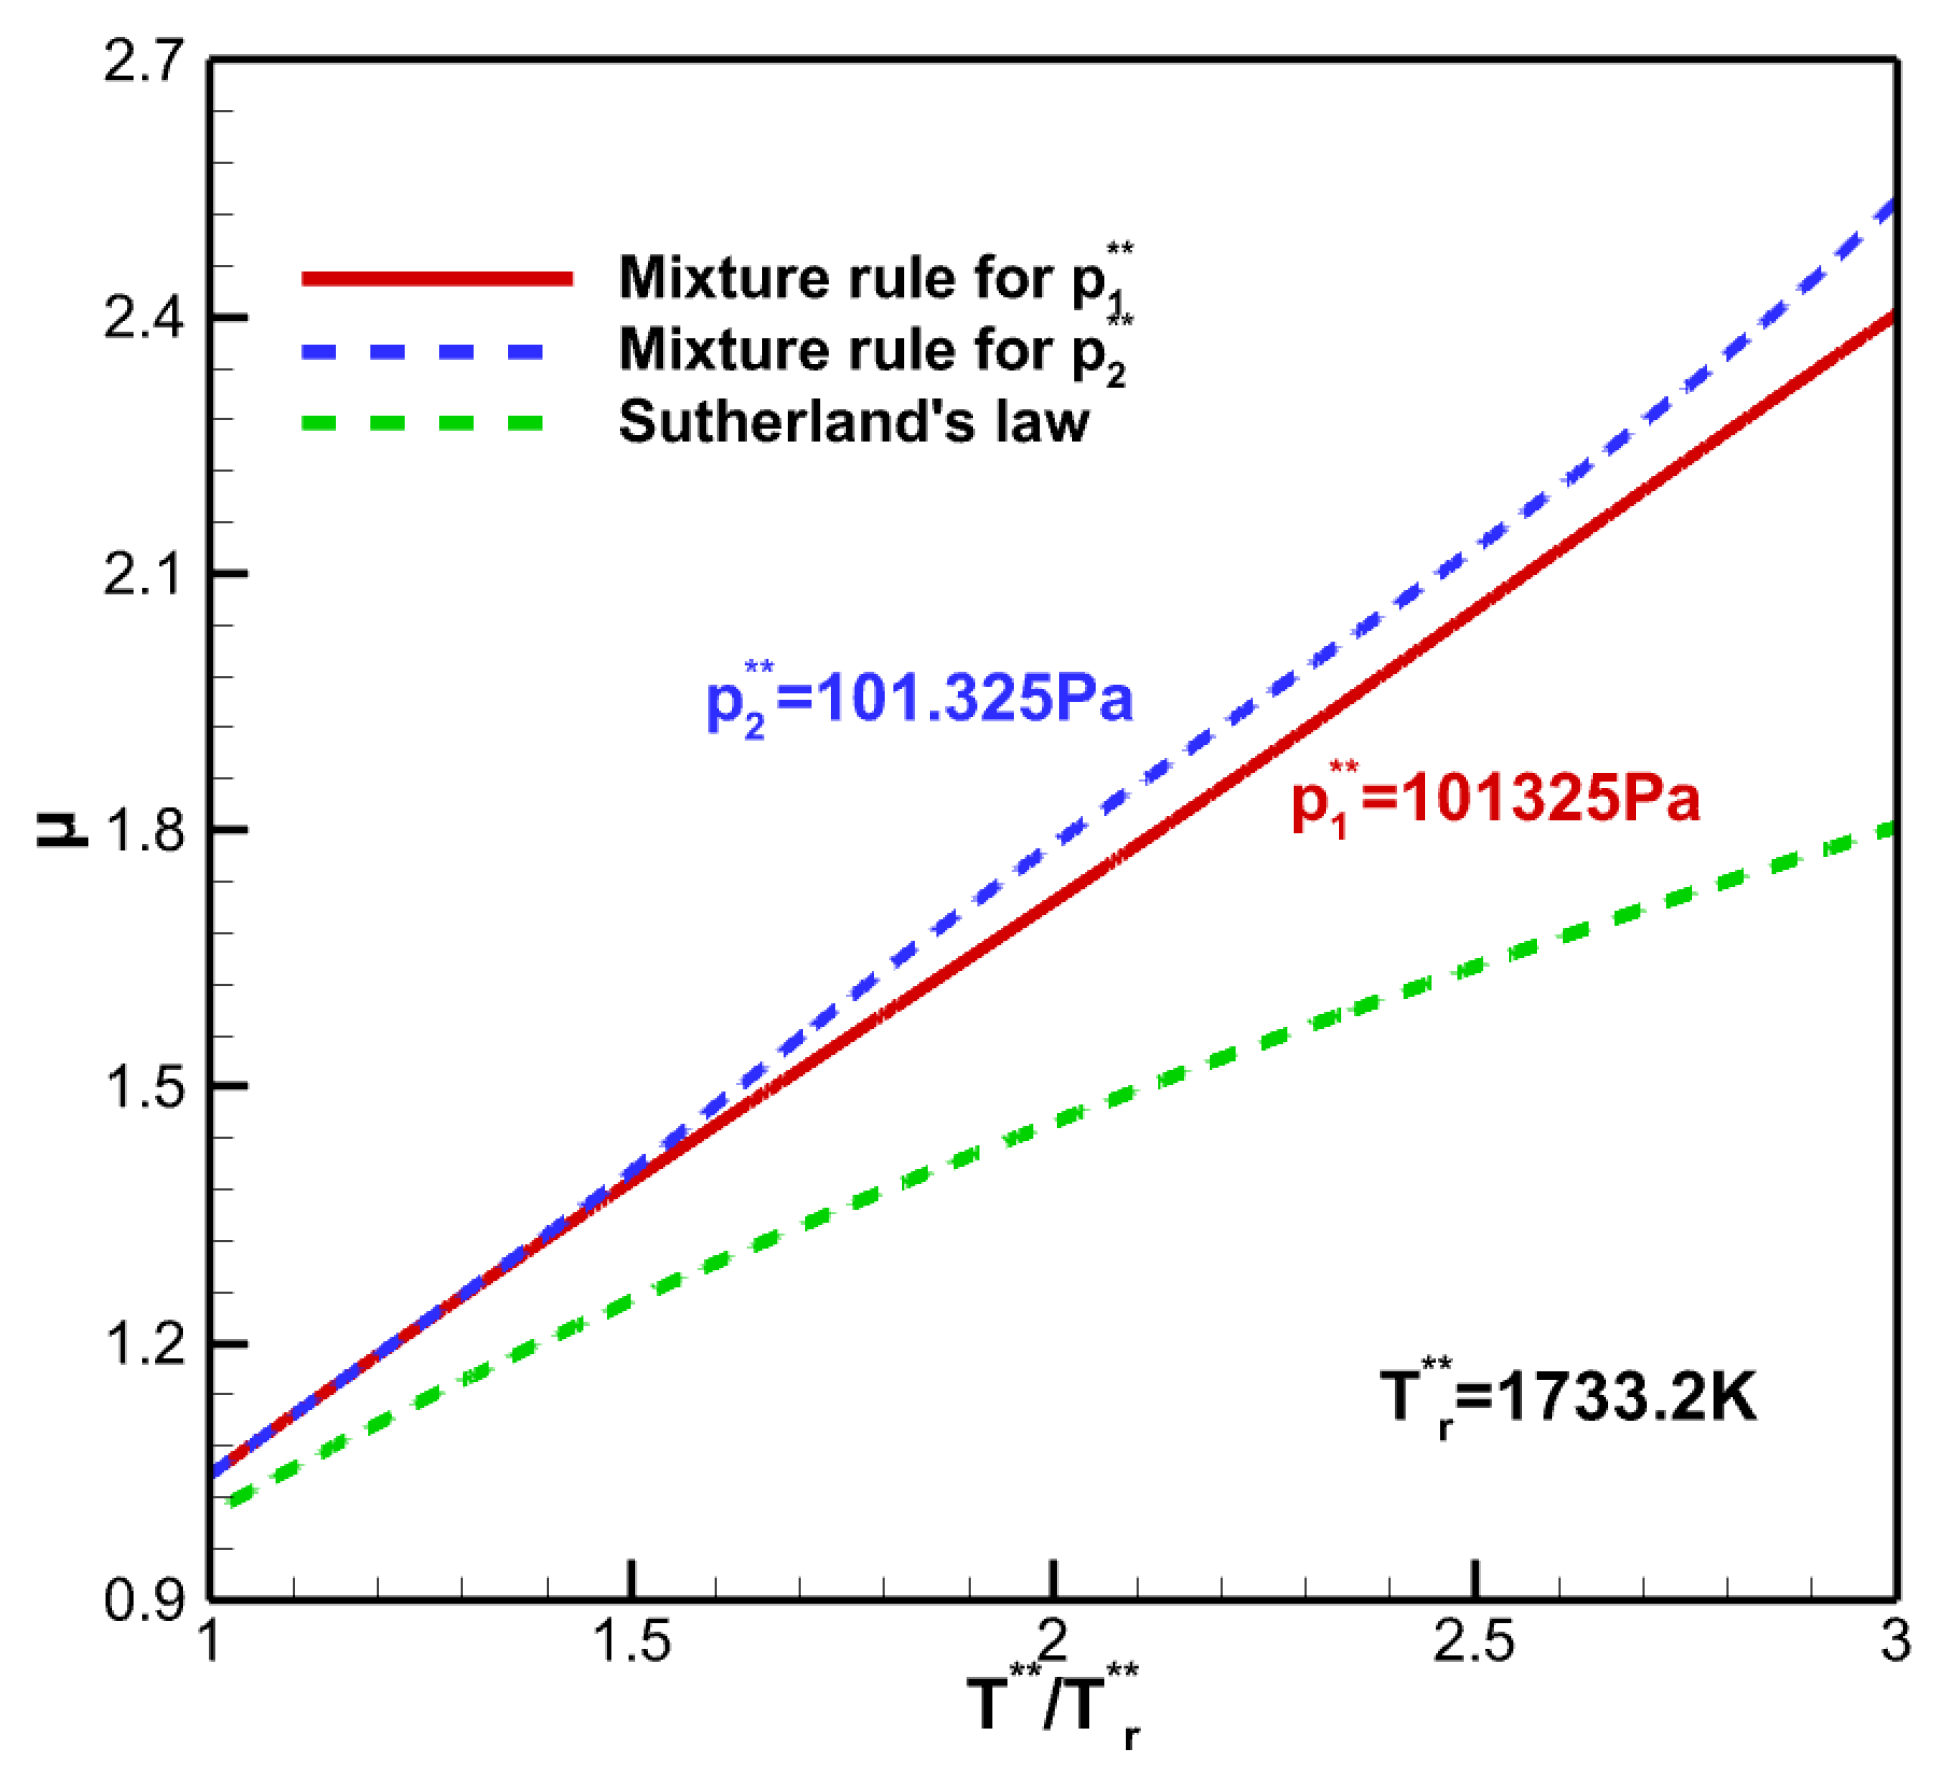
Figure 1 shows the relationship between dynamic viscosity and temperature. The dynamic viscosity is strongly dependent on temperature. The difference between VM and VS gradually increases as the temperature increases. At a given temperature, the dynamic viscosity obtained by VM is larger than that obtained by VS. Although there is a significant change in pressure, the effect on dynamic viscosity is still minimal. In addition, the dynamic viscosity calculated by VM decreases with increasing pressure.
3. DNS Details
Assuming the chemical equilibrium, two DNS of temporally evolving HTSTCF are conducted at the same operating conditions (
) except for viscosity law.
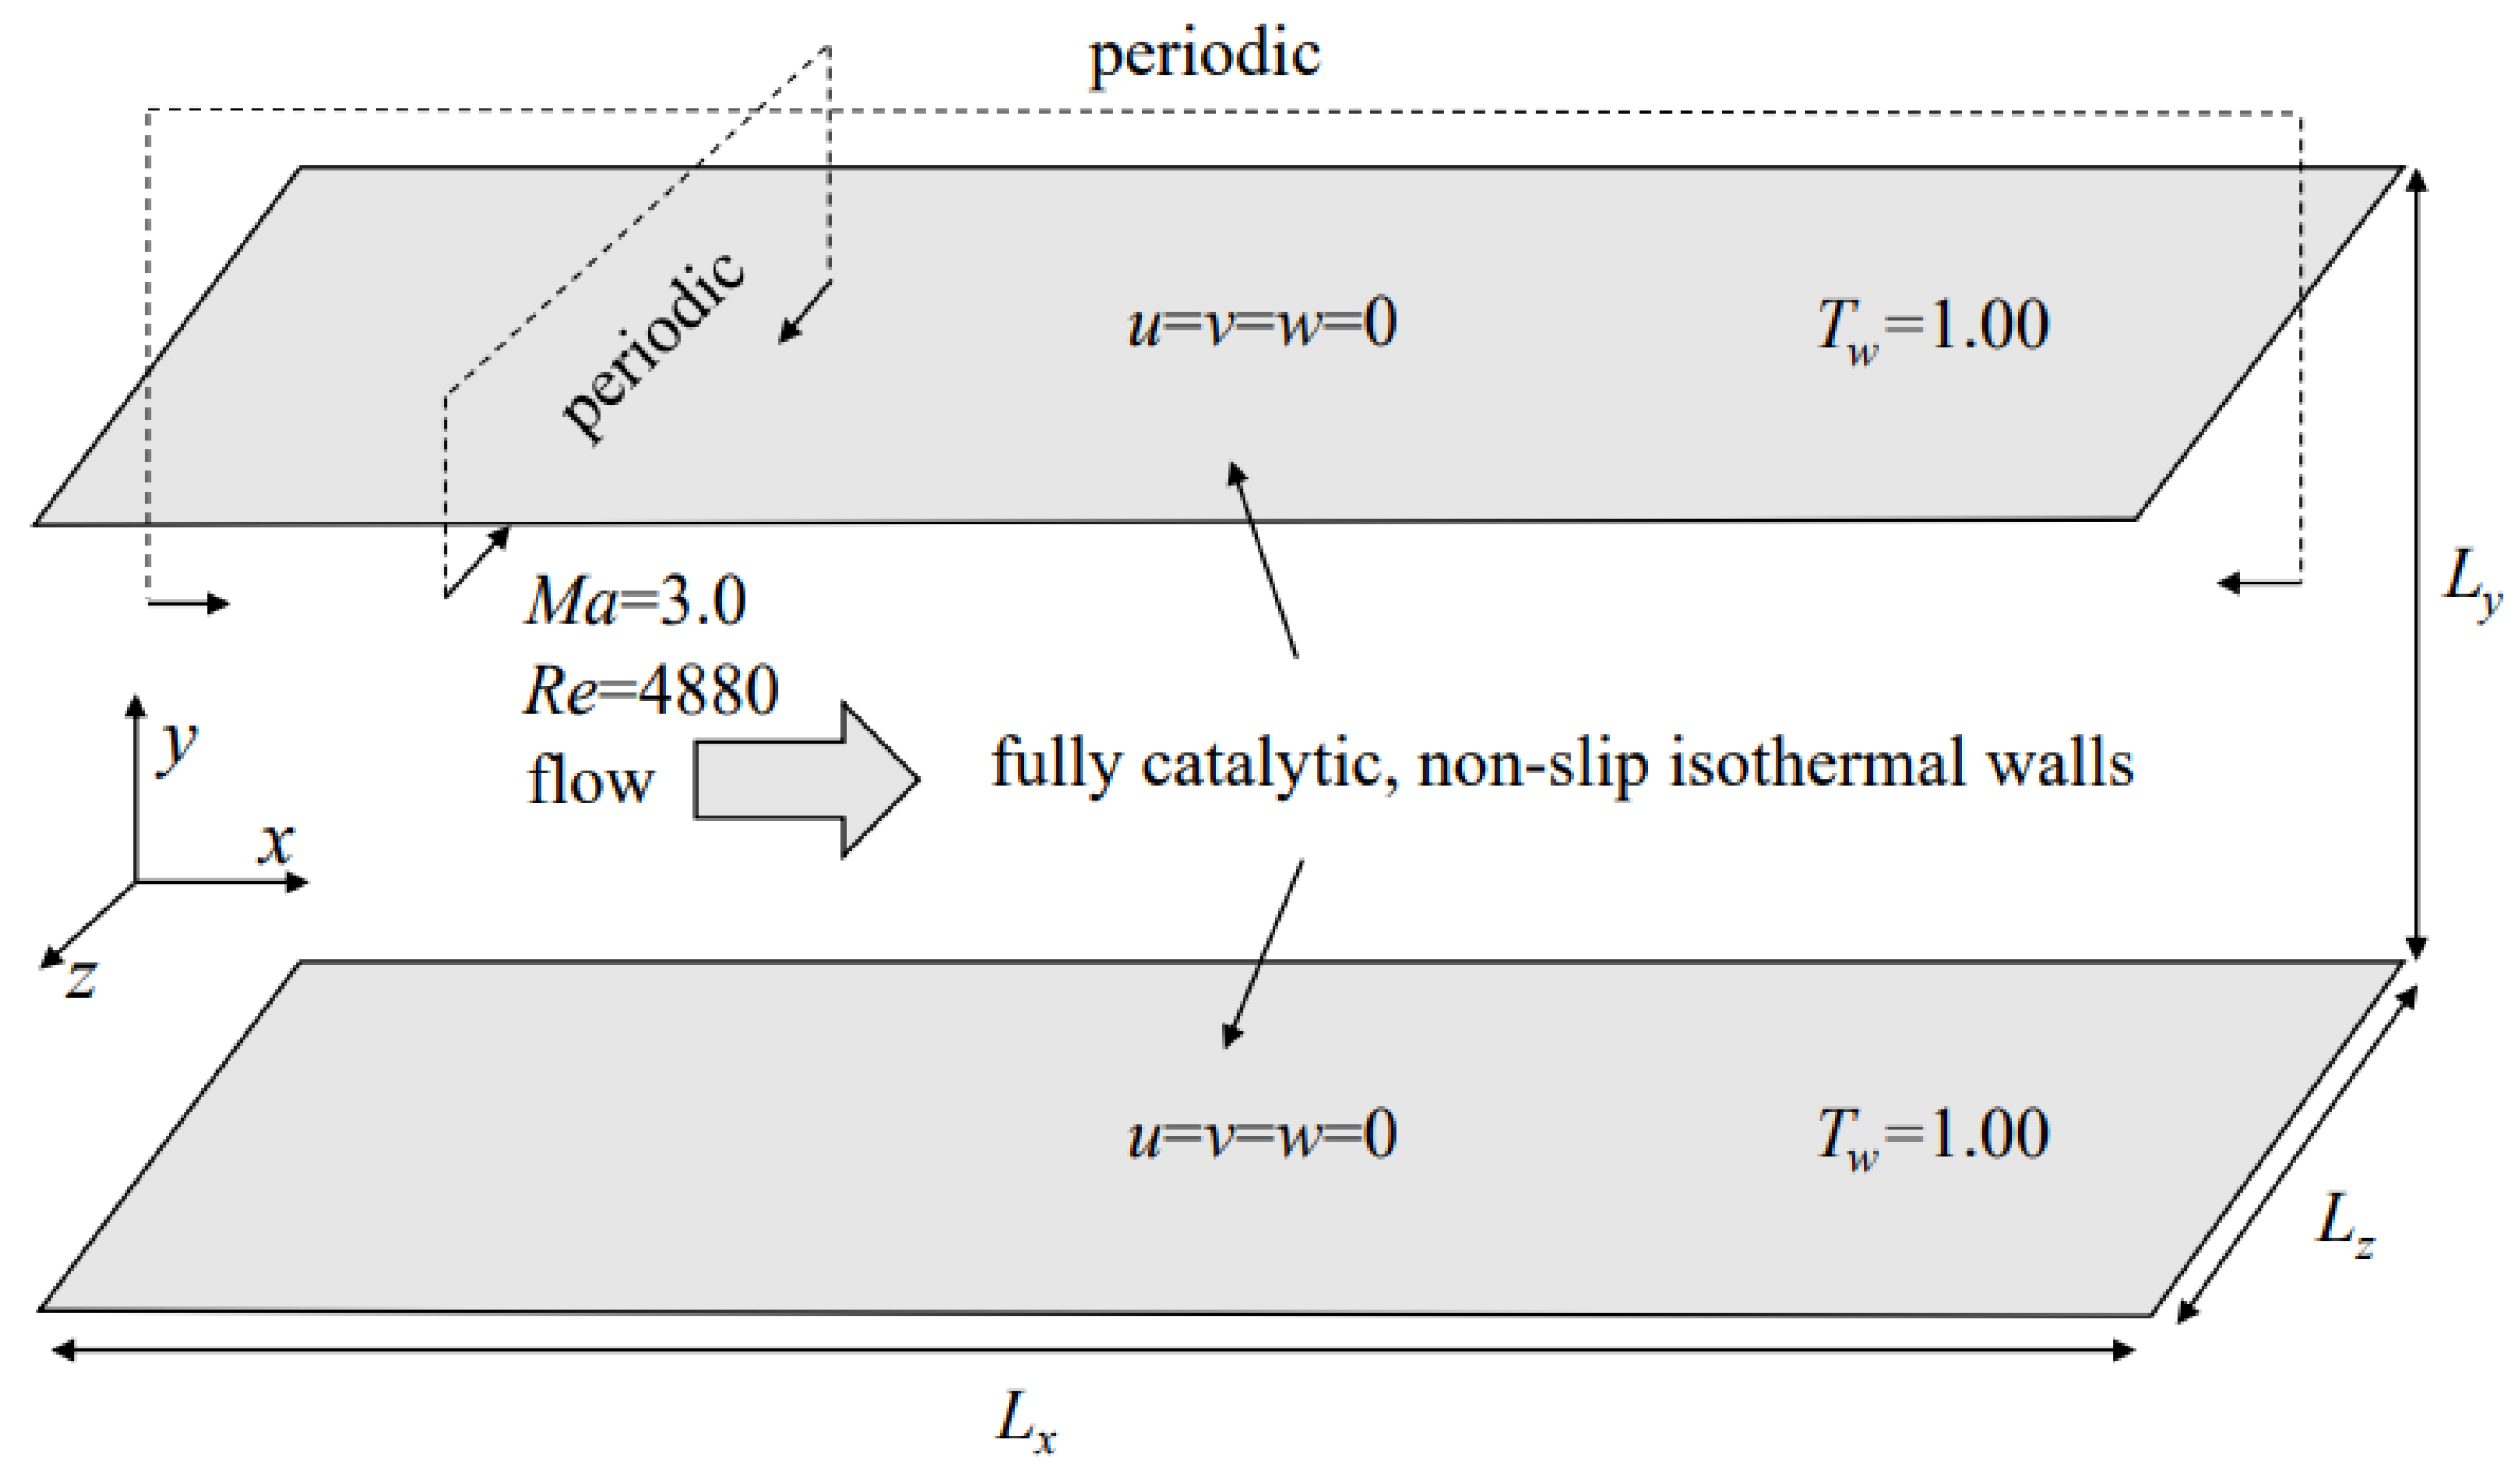
Figure 2 shows the model of this study. The Mach number could be computed as
, where
is the speed of sound at the isothermal wall. The Reynolds number could be computed as
, where
is the channel half width.
Table 1 shows the flows and computational parameters. Several previous DNS of Chen et al. [
15], Li et al. [
30], Modesti and Pirozzoli [
31], and Coleman et al. [
6] are also given for comparison.
The numerical code was developed from OPENCFD-EC, a high-order finite difference code developed at the Key Laboratory of High Temperature Gas Dynamics, Institute of Mechanics, Chinese Academy of Sciences. The OPENCFD-EC has been applied successfully in many numerical simulations of supersonic and hypersonic turbulent flows [
32,
33,
34], including HTSTCF. Moreover, the authors [
25] have been using the developed code to obtain DNS data. The governing equations presented in Sec. II are solved using Van-Leer flux vector splitting and the seventh-order WENO scheme [
35] to make the convection terms discrete. The viscous terms are discretized by the eighth-order central difference scheme. Time integration is carried out through the third-order Runge–Kutta.
For computational efficiency, streamwise (
x) and spanwise (
z) directions used periodic boundary conditions as shown in
Figure 2. The wall temperature is kept isothermal, and the no-slip condition is used for the velocity, which is the most realistic and commonly used scenario for internal streams [
6,
7,
14,
25,
31]. A fully catalytic wall for the species mass fraction is applied for the species wall boundary condition which assumes an infinitely fast recombination of the atoms at the wall.
Table 2 describes the mesh information. The lengths of computational domain are
, corresponding to the grid size of
. Uniform grids are used in the streamwise and spanwise directions, while geometric stretching grids are used in the wall–normal direction. Previous studies have shown that this grid resolution is sufficient to recognize the finest scales of motion [
16,
25]. The streamwise and spanwise grid spacings for the VM and VS are
,
and
,
, respectively. The first collocation point off the wall in the wall-normal direction is at
(VM) and
(VS); the maximum grid spacing is
(VM) and
(VS).
Table 3 and
Table 4 summarize the flow parameters and species mass fractions after being time-averaged at the channel centerline, respectively. The friction Mach number could be computed as
(the subscript
denotes friction);
is the friction velocity
. The friction Reynolds number could be computed as
. The viscosity law does not affect the friction Mach number; the friction Reynolds number for VM is weaker than that for VS. At the channel centerline, the mean dynamic viscosity for VM is larger than that for VS, whereas the opposite trend is true for other physical quantities, including mean density, static temperature, pressure, and dissociation degree.
4. DNS Results and Discussions
In the following discussions, Reynolds and Favre averaging are employed. The Reynolds average of
over the homogeneous directions (
x and
z) and time (
t) is denoted as
, and the corresponding fluctuation by
. The Favre average
defined as
The corresponding fluctuation by .
4.1. Mean Turbulence Statistics
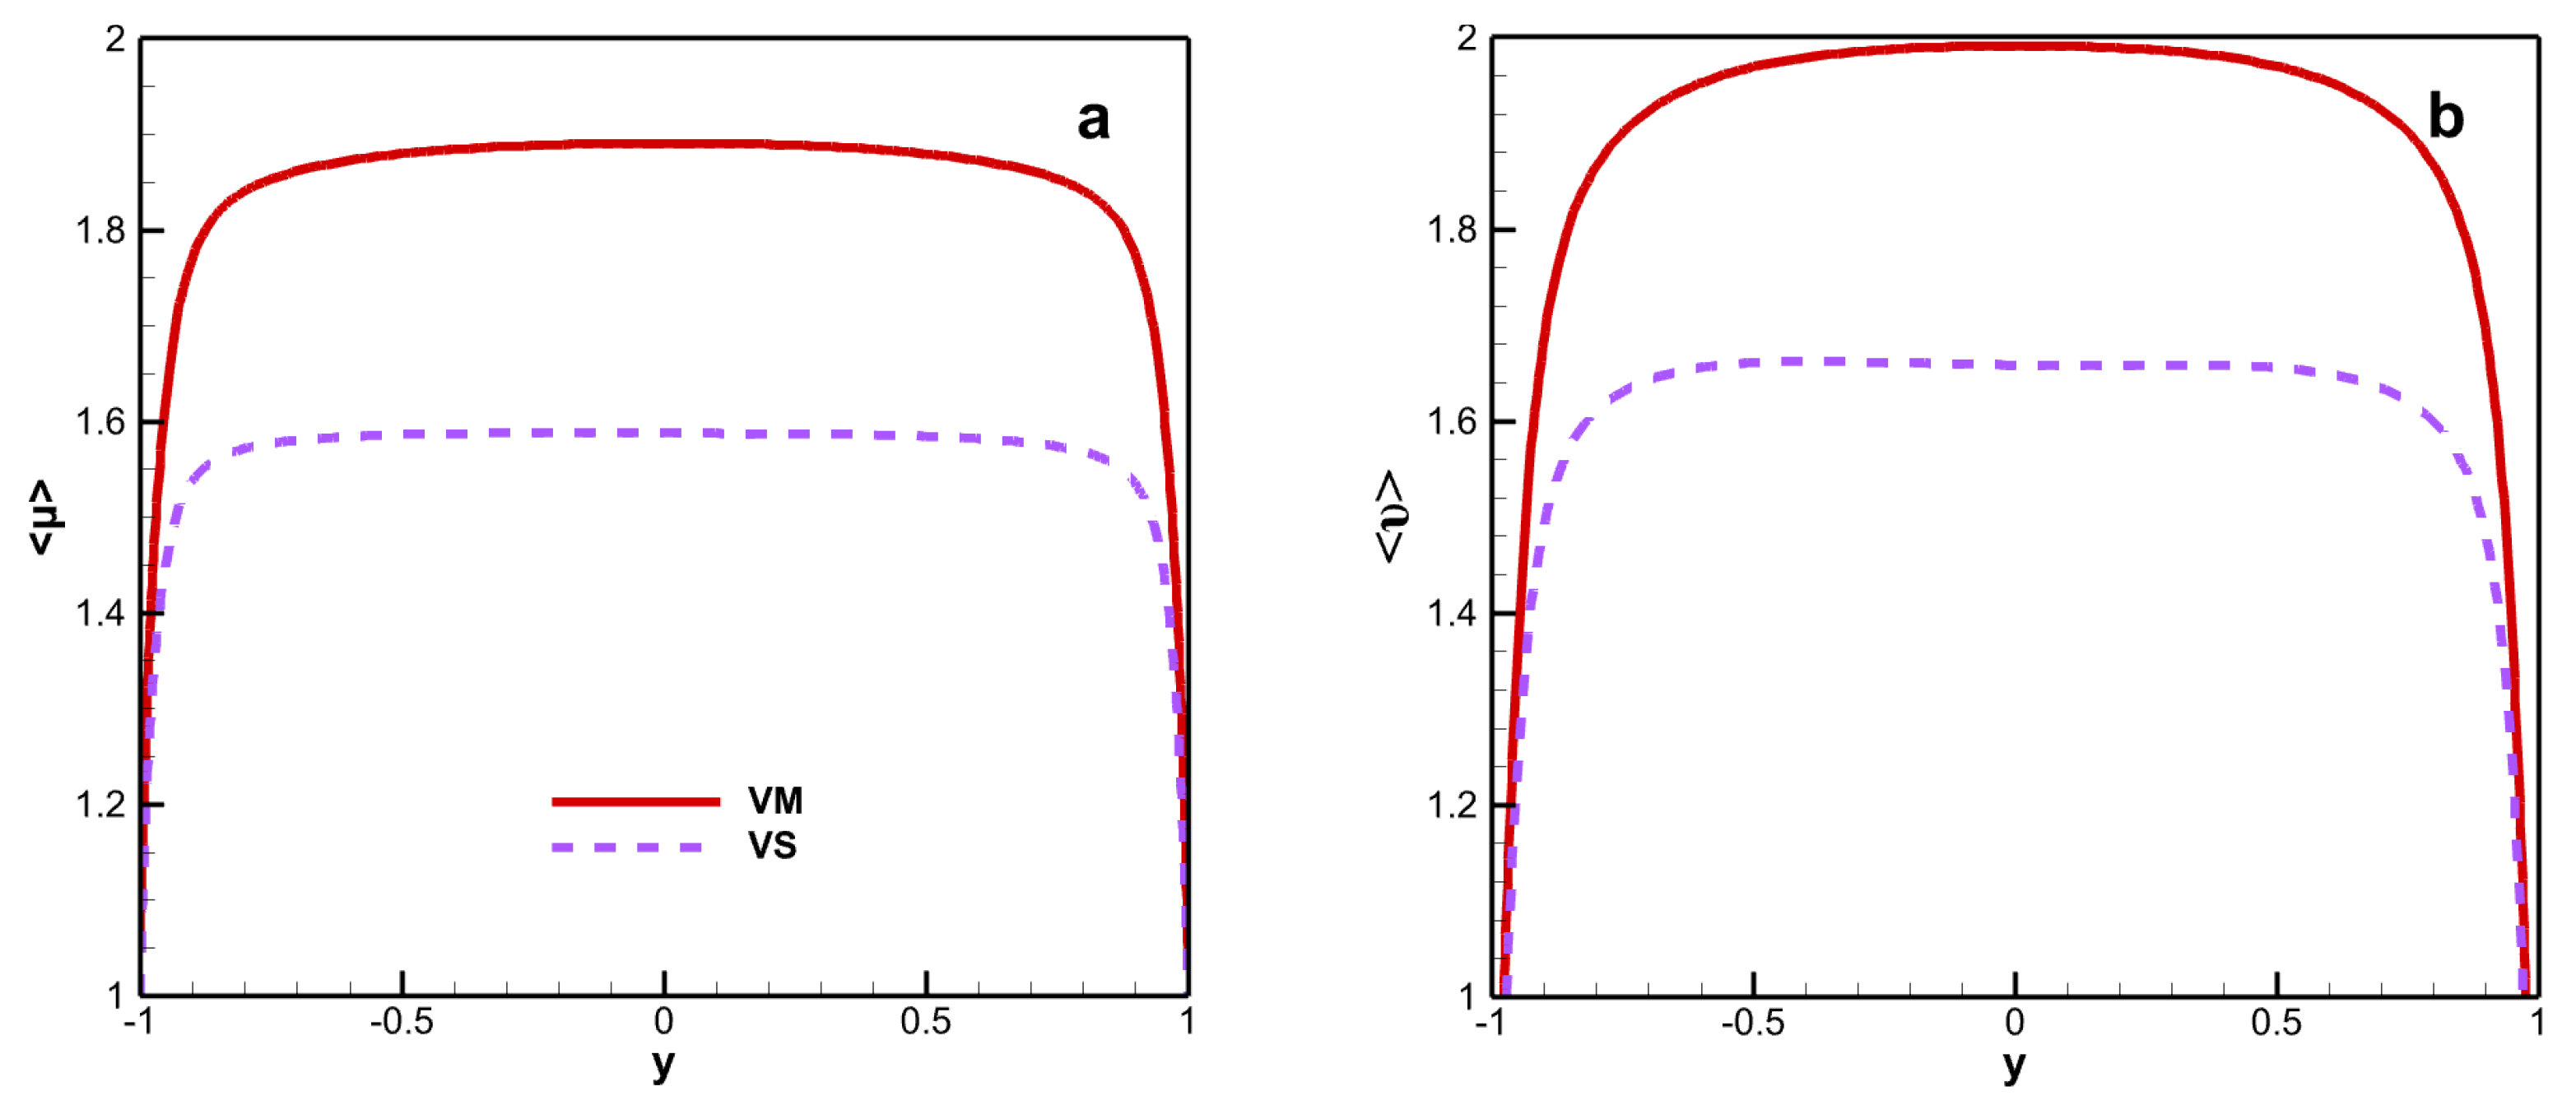
Figure 3 shows the mean dynamic and kinematic viscosity. The mean dynamic and kinematic viscosity exhibit similar trends under the different viscosity laws, with a remarkable increase and peaks in the core region. When the viscosity law takes into account chemical reaction species, the mean dynamic viscosity and mean kinematic viscosity significantly increase. The results indicate that chemical reactions significantly alter the magnitude of viscosity. The peak mean dynamic viscosity reaches 1.891 for VM and 1.588 for VS. For the kinematic viscosity, the peak value of the mean kinematic viscosity is 1.991 for VM and 1.659 for VS. The maximum deviations in the mean dynamic viscosity and mean kinematic viscosity under the VM and VS formulations are 19.1% and 20.0%, respectively.
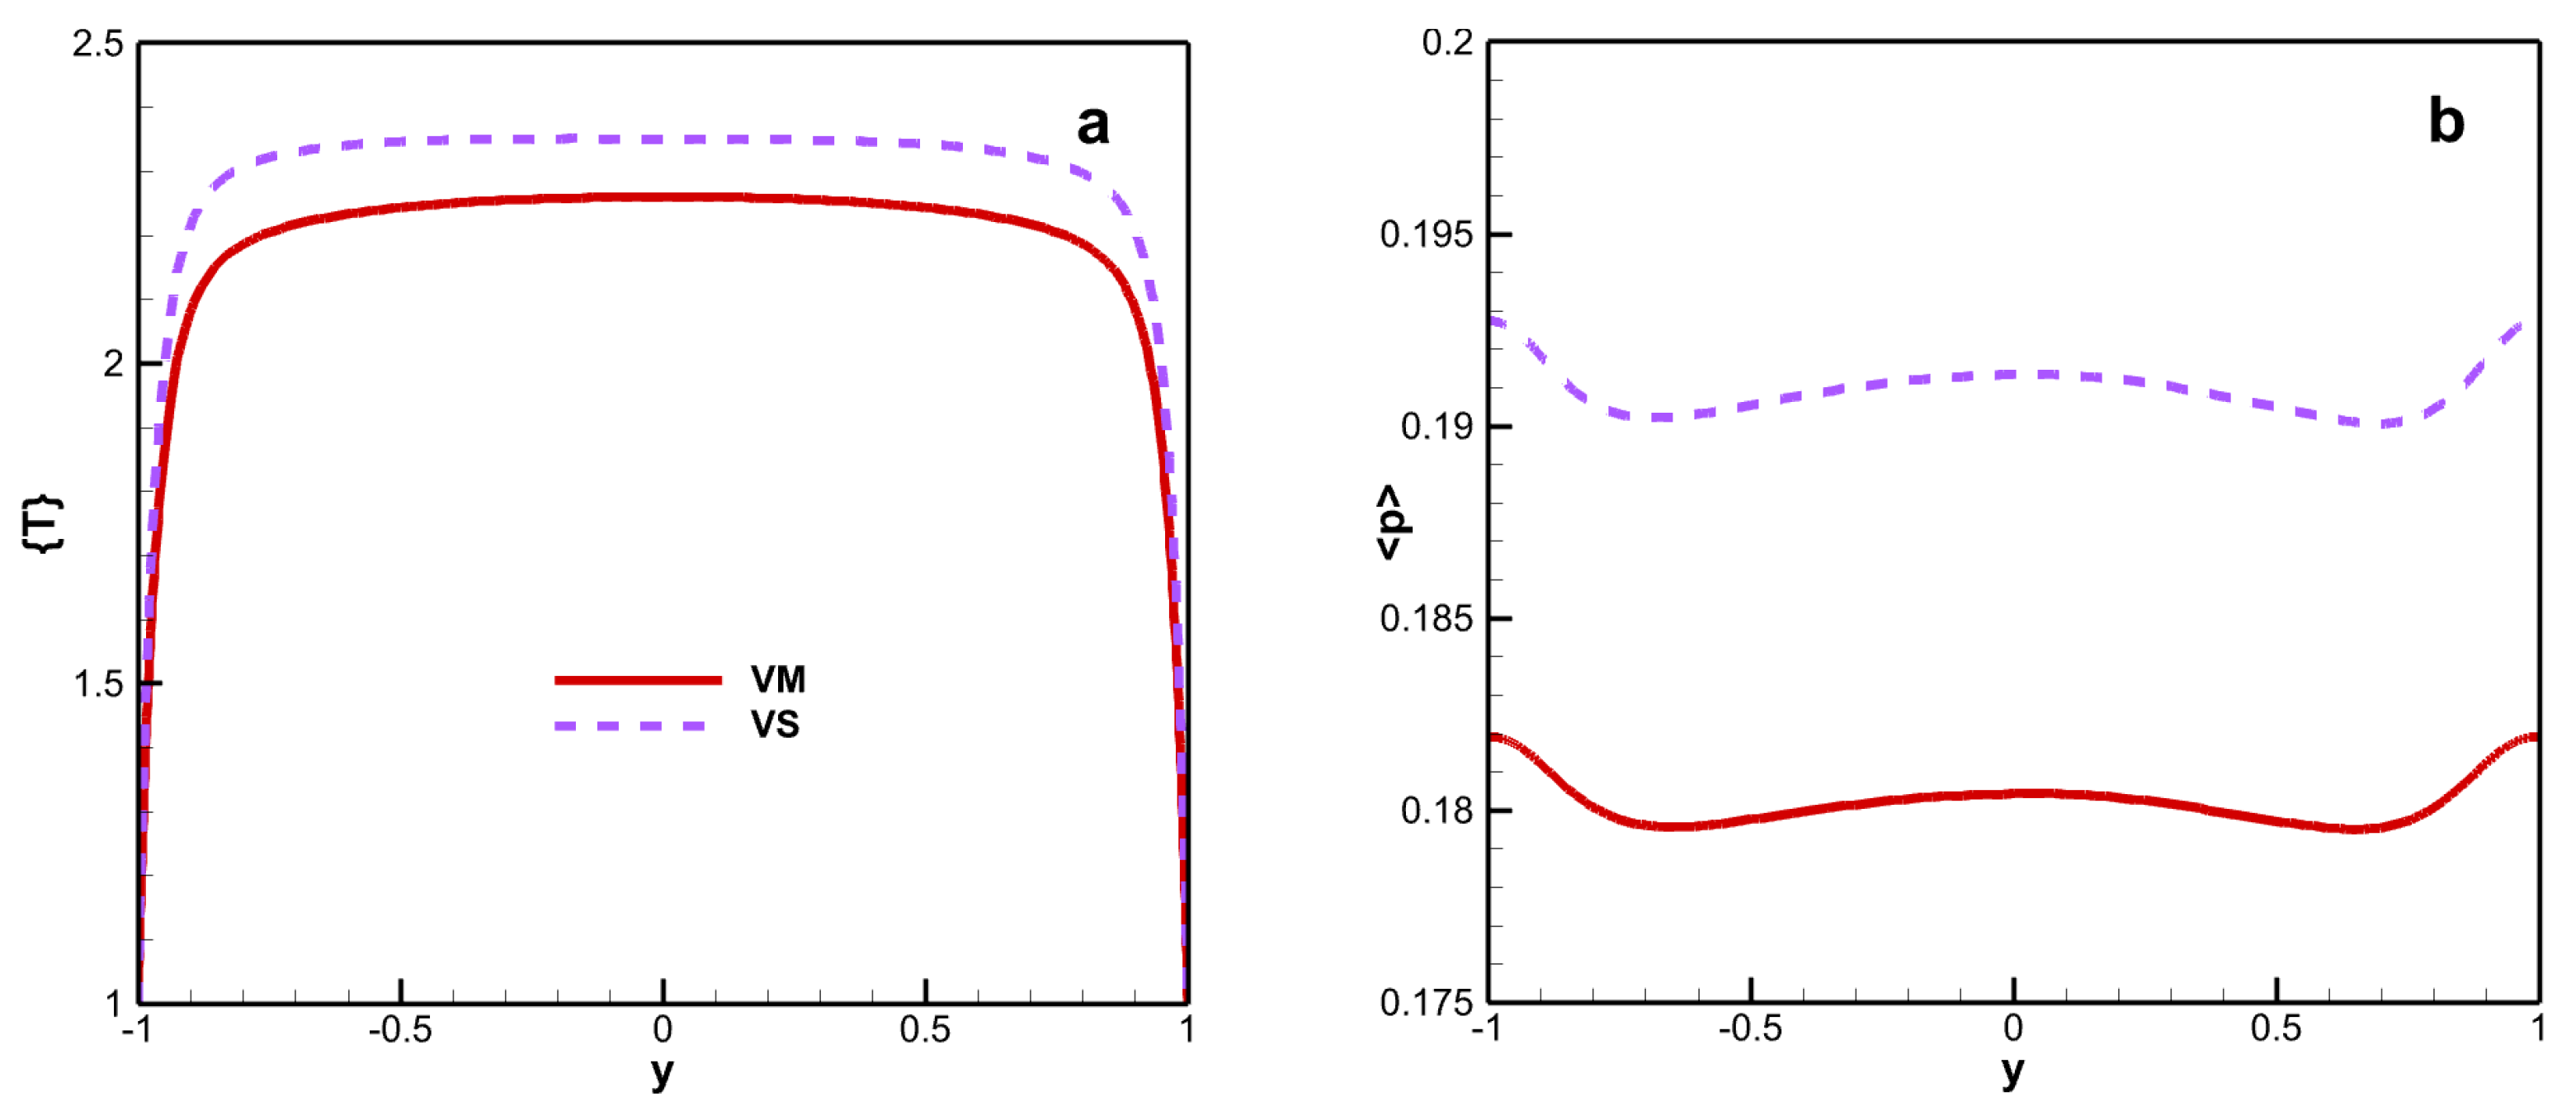
Figure 4 shows the mean static temperature and pressure. Although viscosity laws exhibit significant differences in mean viscosity, the differences in mean temperature and mean pressure are relatively small. The peak mean static temperature is 2.260 for VM and 2.351 for VS. The maximum deviation in mean temperature is 4.03%. The influence of viscosity law on the mean temperature and pressure exhibits the same effects. The mean pressure remains almost stable in the channel. The mean pressure for VM is weaker than for VS, and the maximum deviation under both viscosity laws is 6.0%.
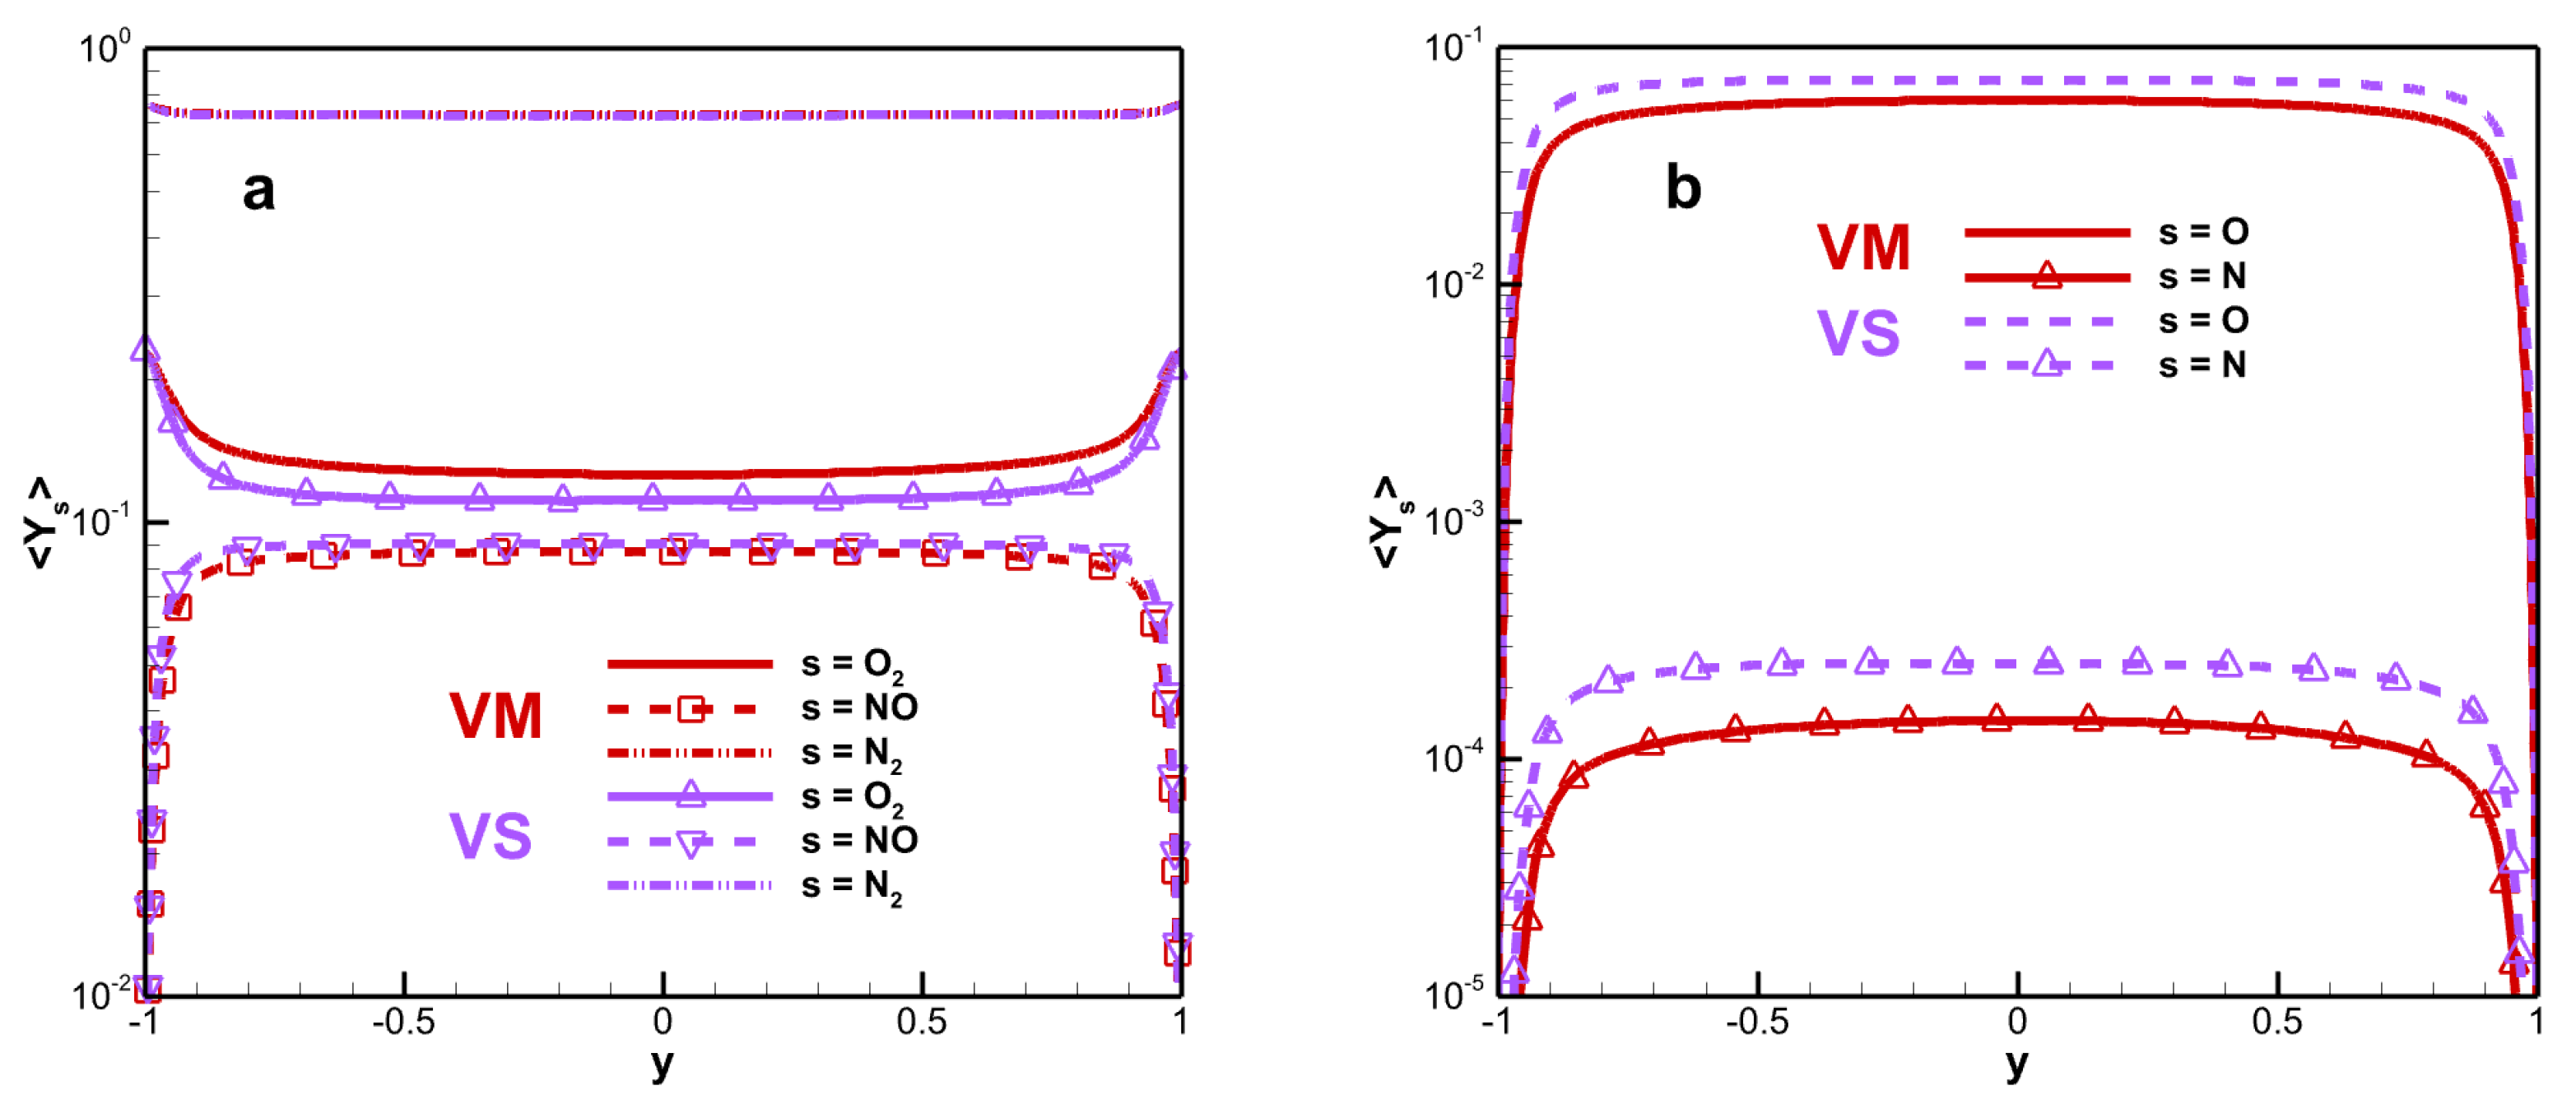
Figure 5 shows the mean species mass fraction. The change is only obvious near the wall. The degree of dissociation of the oxygen molecule is much higher than that of the nitrogen molecules. The maximum deviation in oxygen molecular mass fraction is 13.49%. This phenomenon can be explained by the relatively low temperature, making it difficult to trigger a large amount of dissociation in the nitrogen molecules. A higher viscosity produces a greater intermolecular interaction and leads to a weaker degree of dissociation. VM is weaker than VS for the degree of dissociation, and the trend is similar to that of the mean static temperature. The maximum mean oxygen atomic mass fractions of VM and VS are 0.060 and 0.073, respectively.
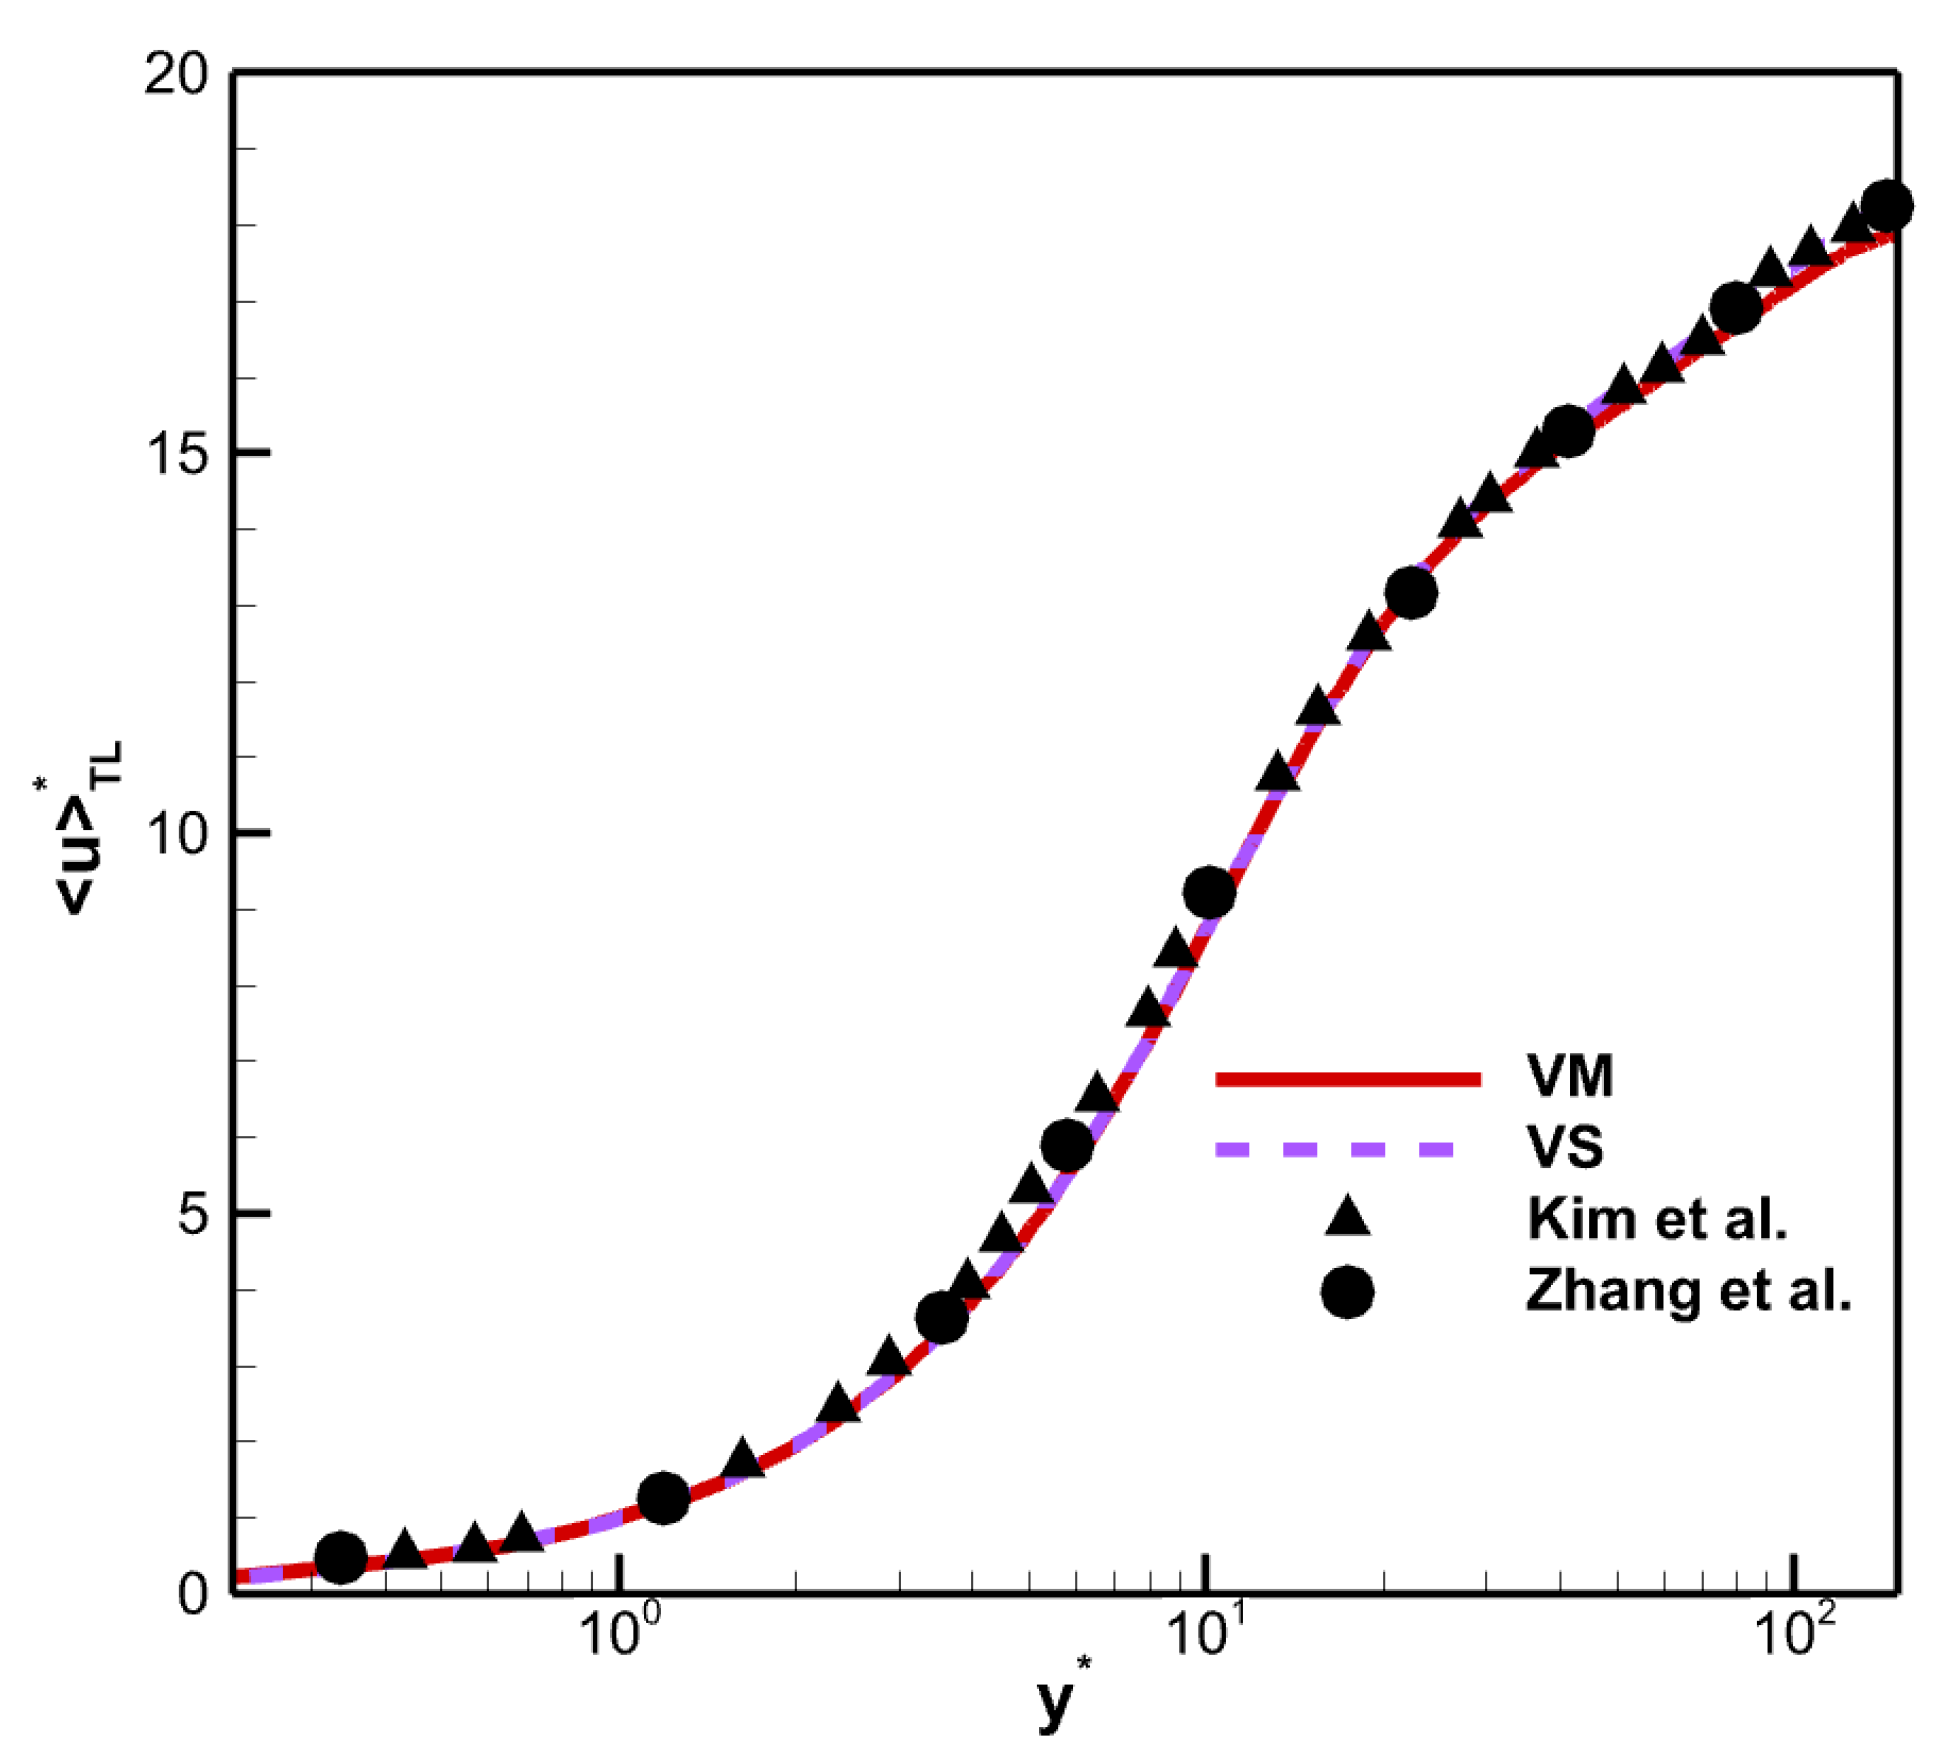
Recently, an alternative transformed velocity has been derived by Trettel and Larsson [
36], named the TL transformation. The TL transformation
with the wall–normal distance nondimensionalized using the semilocal scaling
(the superscript
denotes semilocal scaling) is shown in
Figure 6.
The TL transform collapses the different mean velocity profiles to the incompressible case [
37]. Although there are differences in viscosity laws, the profiles also collapse with in results of Zhang et al. [
38]. The results indicate that the TL-transformed mean velocity is insensitive to viscosity laws. From this, it can be concluded that the chemical reactions do not directly influence the flow dynamics, but indirectly influence them through the coupling of the thermodynamic quantities, which are closely related to the mean property of the fluid.
4.2. Fluctuating Turbulence Statistics
The distribution of the root mean square (RMS) dynamic viscosity fluctuation as shown in
Figure 7a, defined as
versus the wall scaling
, where
The flow state belongs to the laminar flow in the viscous sublayer, so the fluctuation is very small. When it reaches the buffer layer or even the log-law layer, the fluctuation is most active in this region. Therefore, a bell-shaped curve can be observed in
Figure 7. Although the fluctuating dynamic viscosity has a fairly large magnitude for both viscosity laws, several differences are clear, especially near the wall. For example, the magnitudes of
is larger for VM than for VS along the channel, with a peak value of 7.5% for VM and 5.8% for VS. When the viscosity is related to the species, the maximum position moves towards the core region of the channel.
Figure 7b shows the RMS kinematic viscosity fluctuation
versus wall scaling
. Similar to
Figure 7a, the peak positions are the same, but the fluctuation value has increased; the fluctuation in VM is still greater than that in VS. The maximum of
is 18.12% for VM and 17.35% for VS. The RMS temperature fluctuation (
) versus wall scaling
as shown in
Figure 7c. The deviation in the RMS temperature fluctuation between the two viscosity laws is relatively weak, with a maximum value of 5.9%.
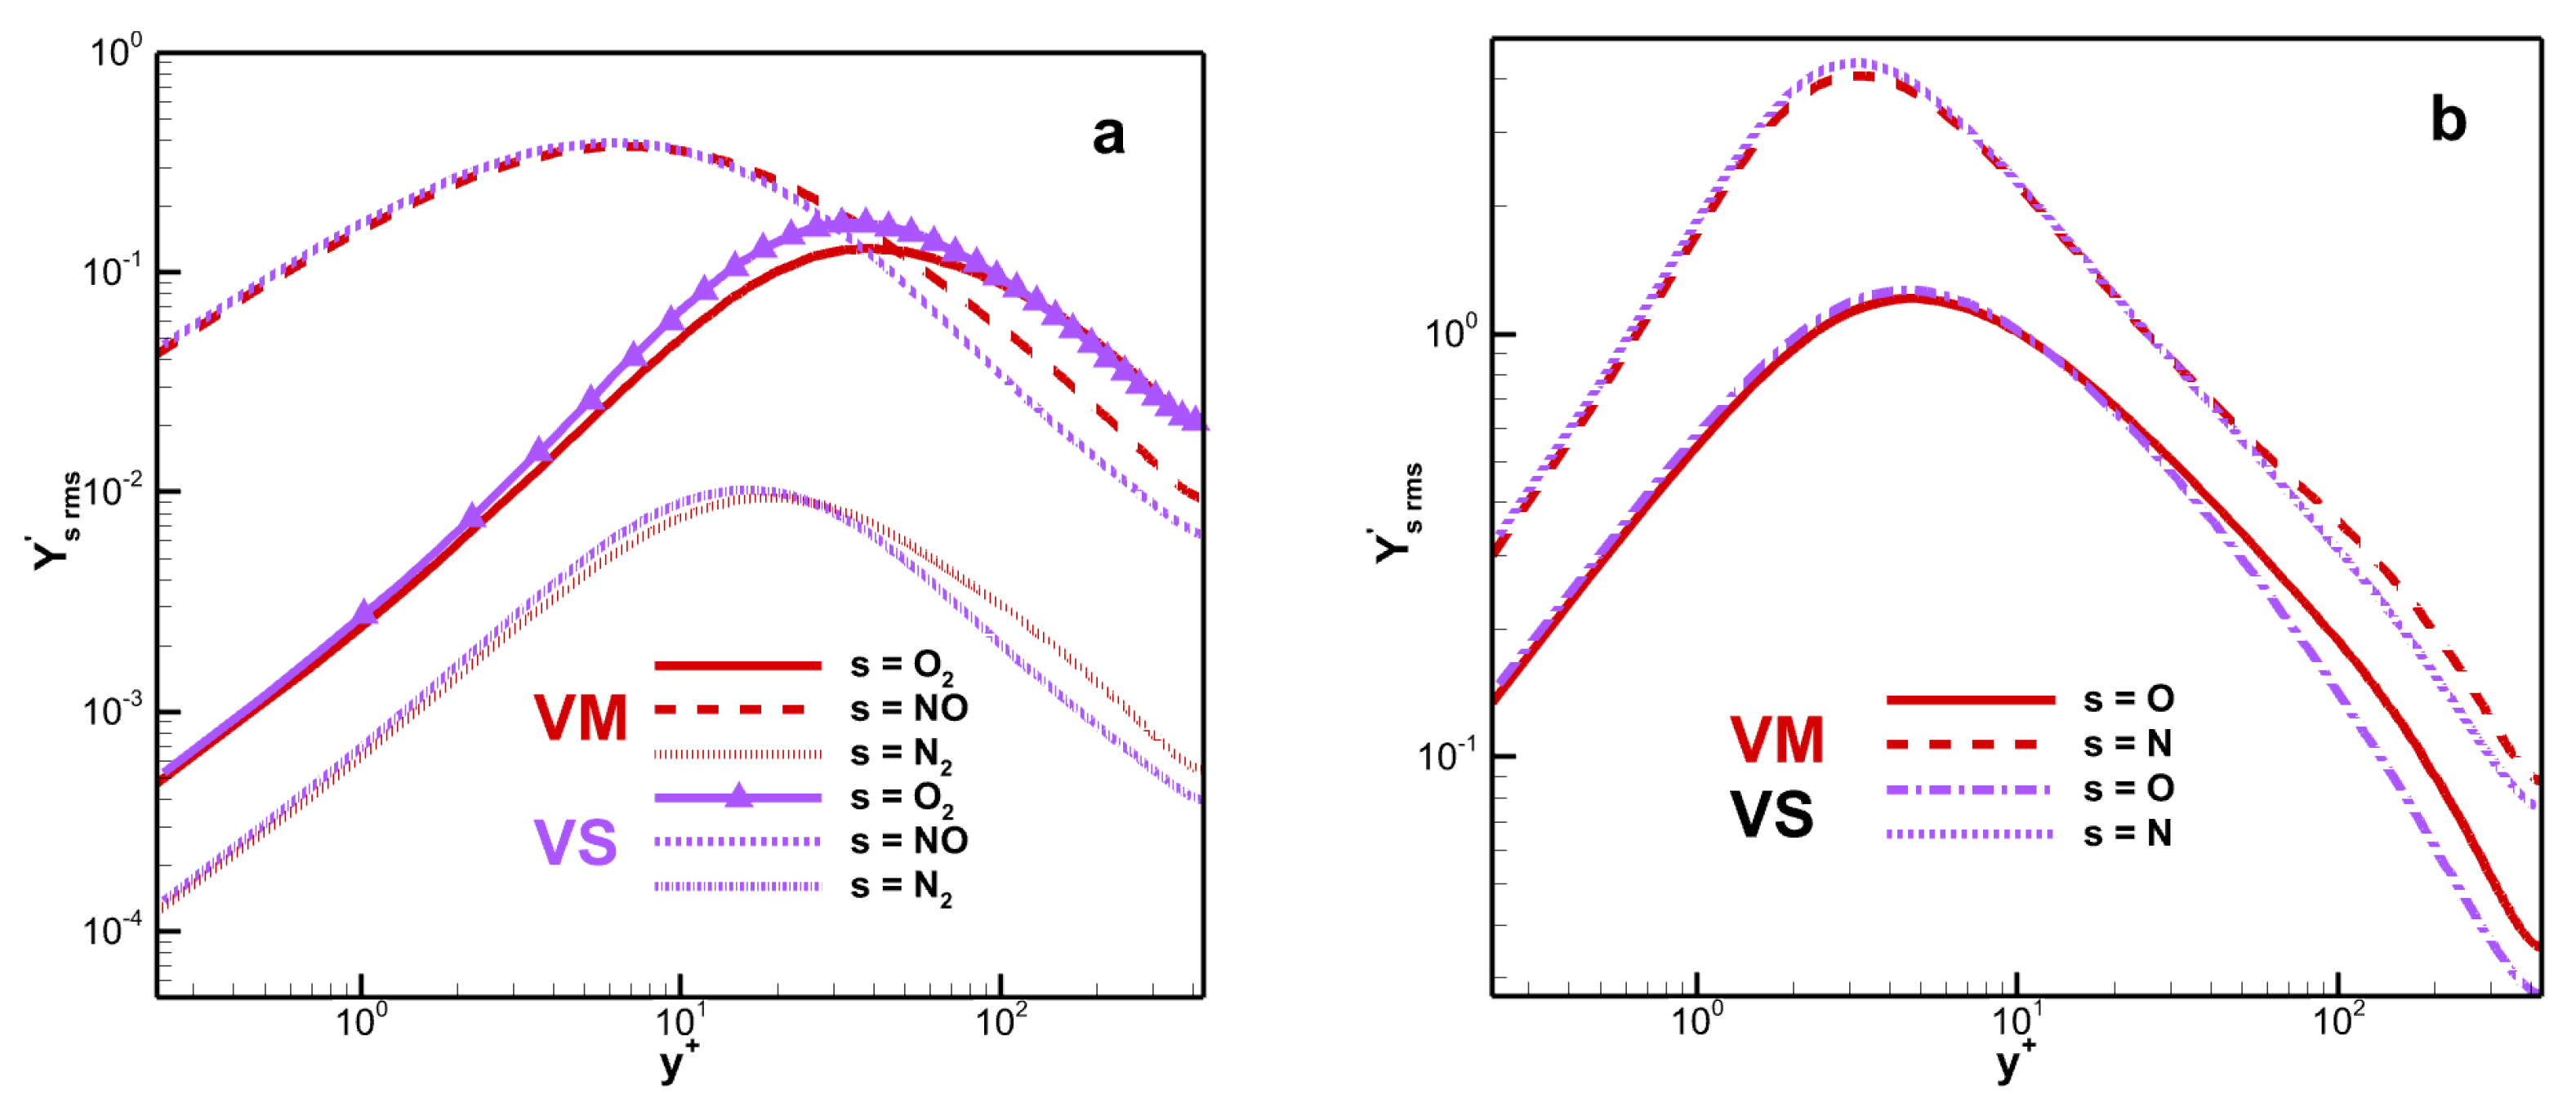
Figure 8 shows the RMS mass fraction. The peak value of
is 0.128 for VM and 0.168 for VS. The fluctuation difference in mass fraction for monatomic molecules is small and the difference is mainly reflected in the peak and far from the wall. The species mass fraction fluctuation of diatomic molecules reaches its maximum value in the buffer layer, while that of monatomic molecules reaches its maximum value in the viscous sub-layer.
The RMS velocity fluctuations could be computed as
(similar to
and
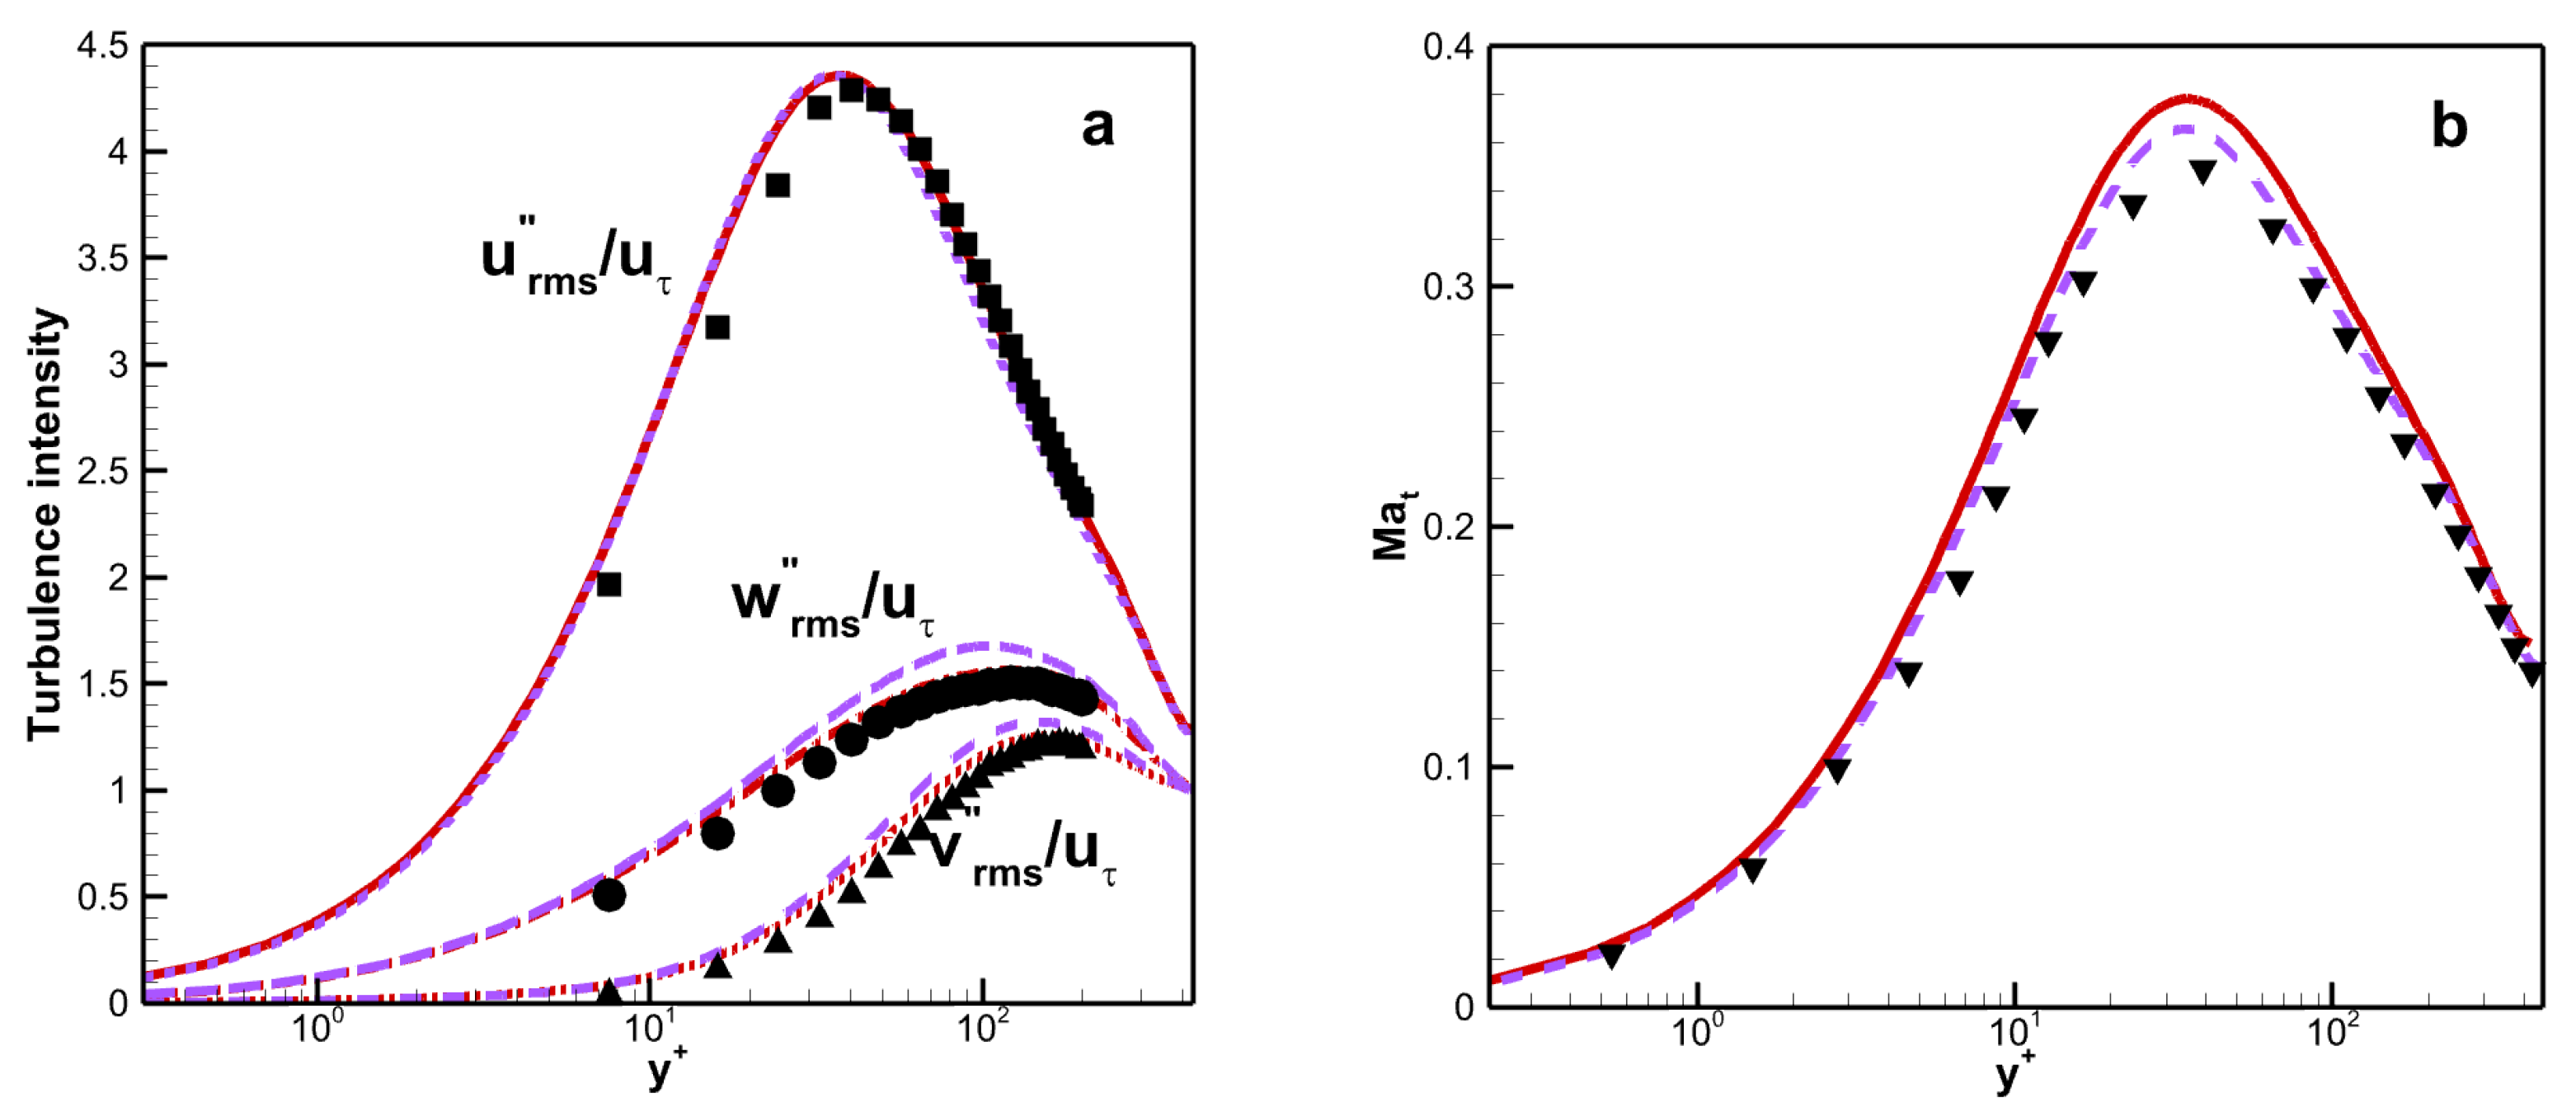
). There is good agreement between the results for the two viscosity laws, as shown in
Figure 9a. The maximum value of streamwise RMS velocity fluctuations is around 4.4 for both viscosity laws. Therefore, the turbulence intensity is insensitive to the viscosity law. The turbulent Mach number
is used to indicate the importance of compressibility effects. The maximum of
is about 0.378 for VM and 0.366 for VS as shown in
Figure 9b. This means that the compressibility effects are improved when the mixture rule is considered.
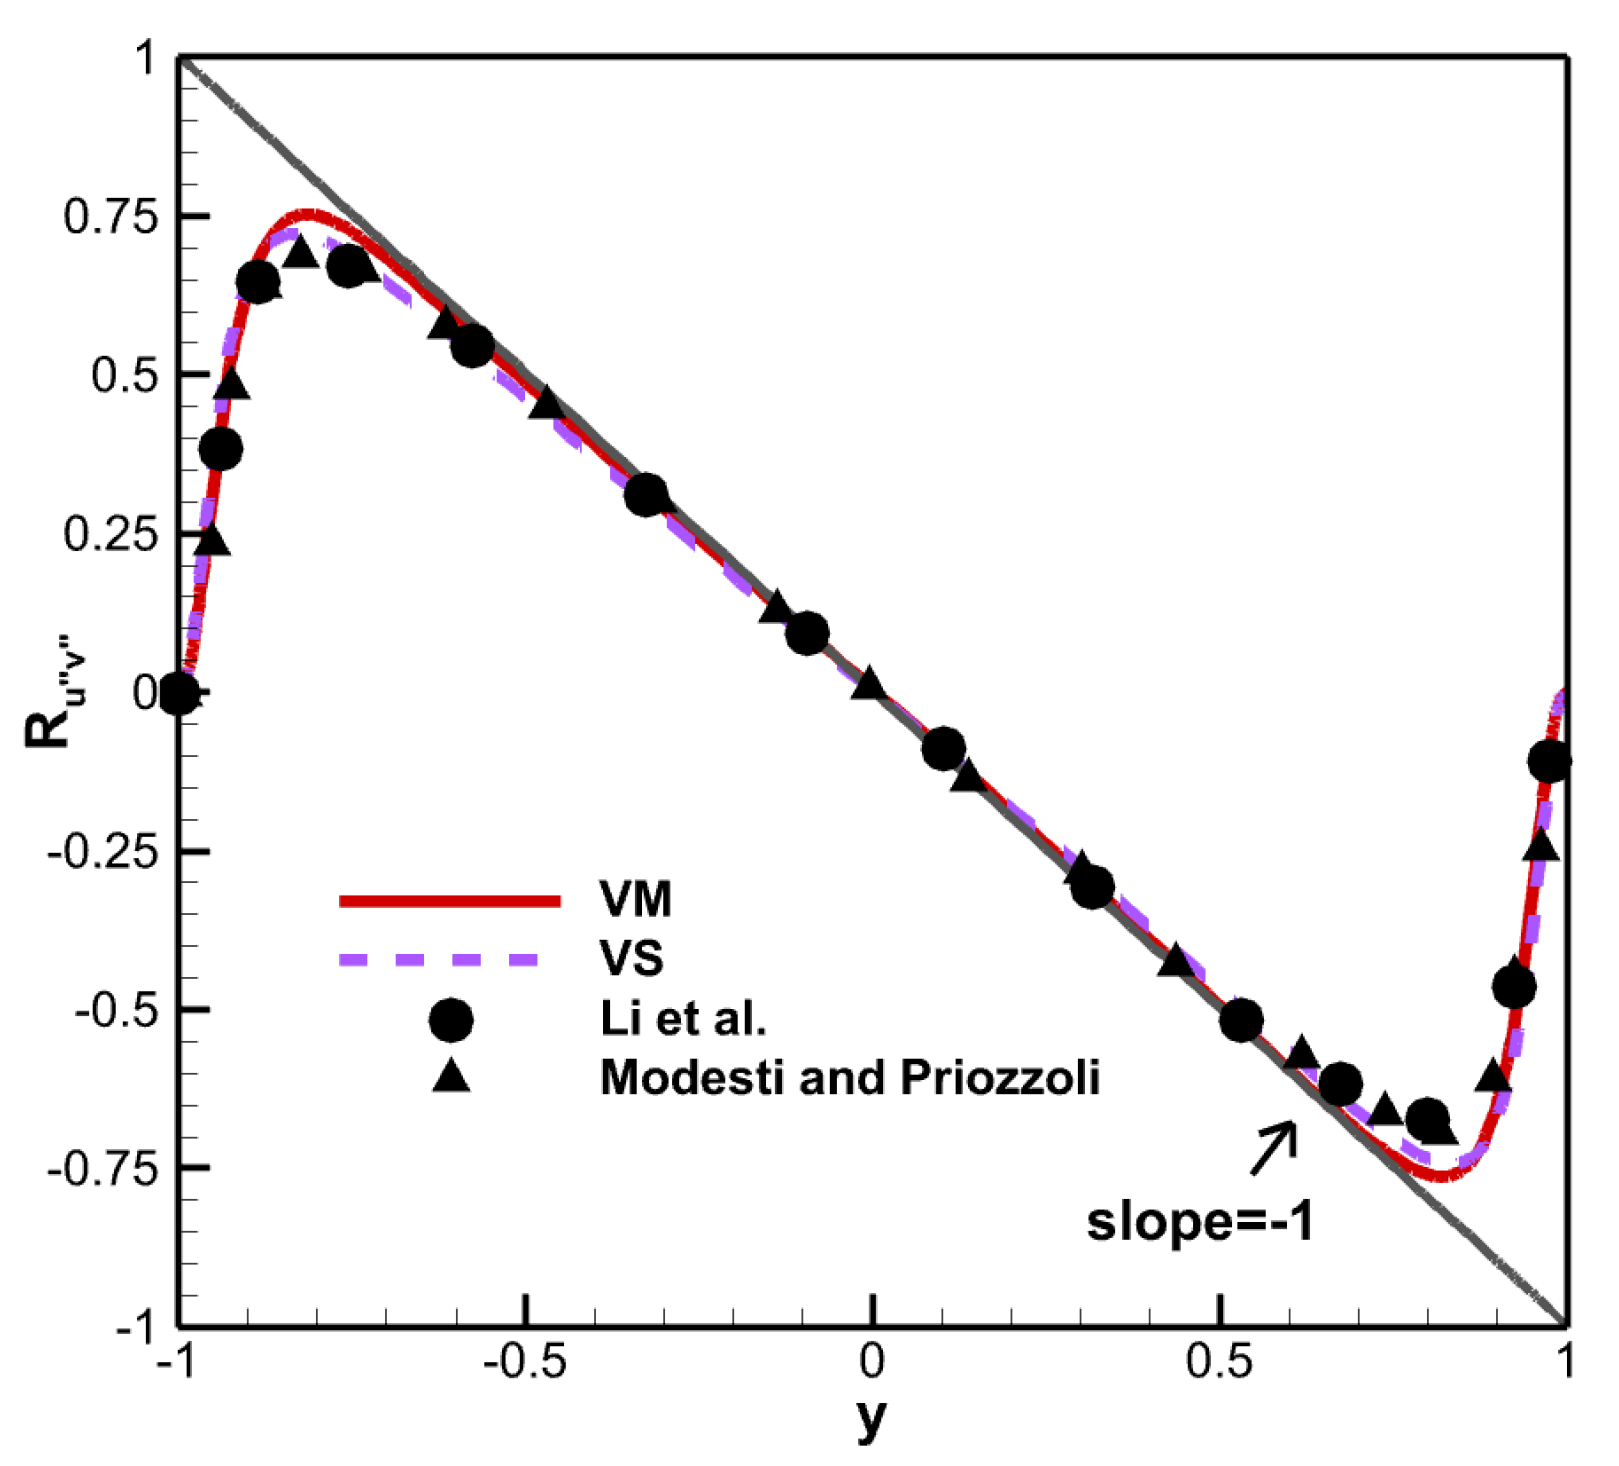
The Reynolds shear stress is defined as:
The Reynolds shear stress is insensitive to the viscosity law, and the results are relatively close for both viscosity laws, as shown in
Figure 10. The results also corresponded well with those of Li et al. [
30], and Modesti and Priozzoli [
31]. The slope basically maintained at −1. The Reynolds shear stress under both viscosity laws reaches the same maximum value of 0.75 at around
.
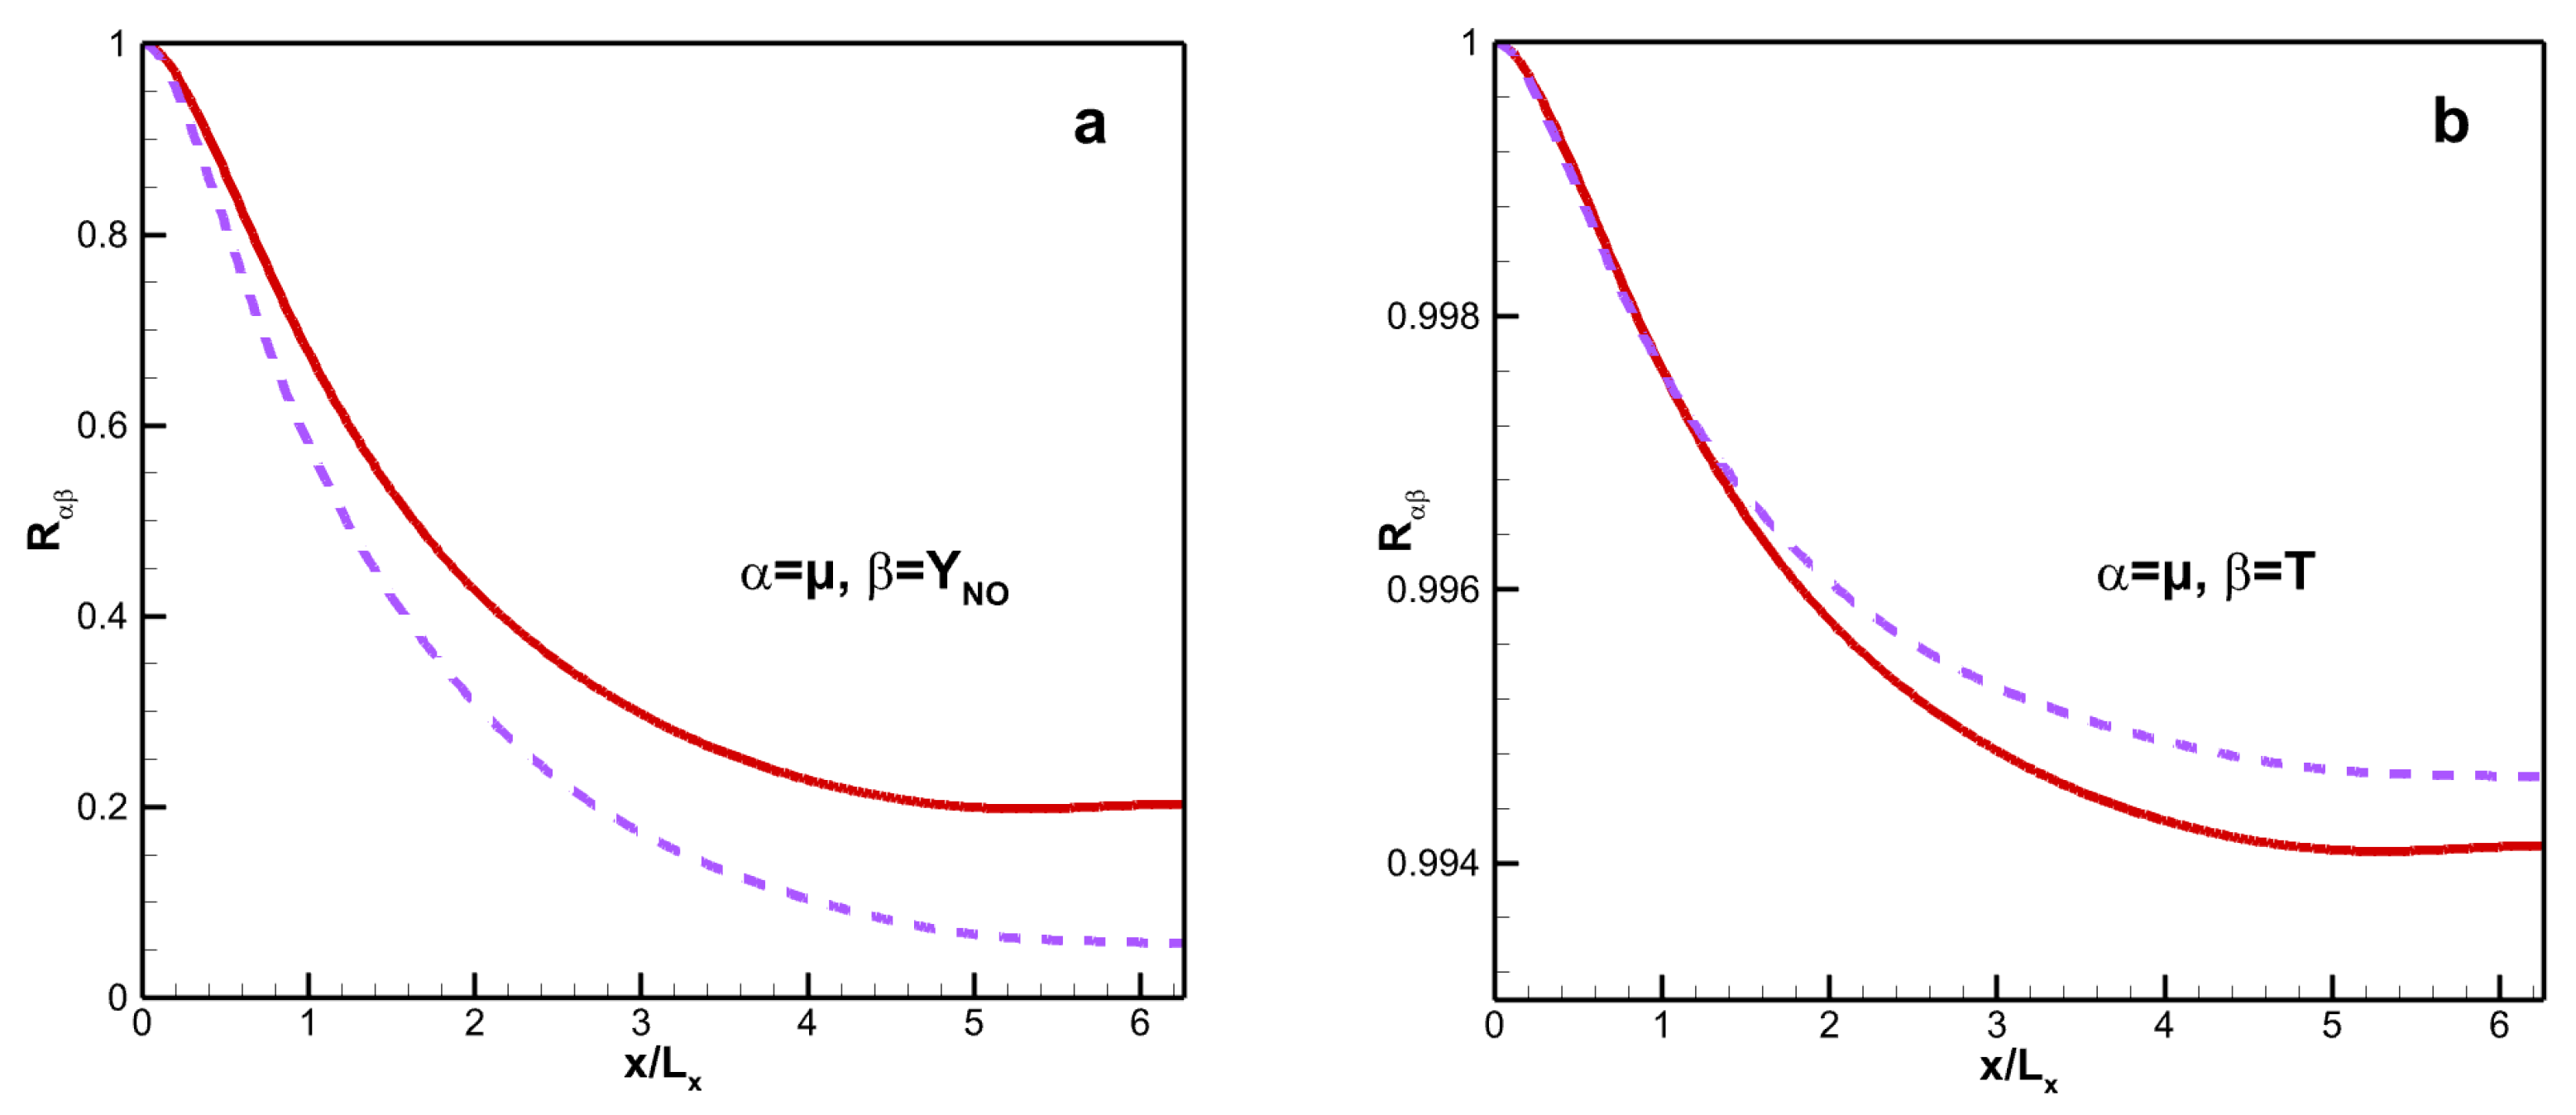
Figure 11 shows the streamwise two-point correlations
. The streamwise two-point correlation is as follows:
where
and
are variables relating to viscosity, static temperature, or mass fraction. The streamwise correlation coefficients, including those between dynamic viscosity and mass fraction of
NO and between viscosity and static temperature, decrease with the increasing streamwise distance. The minimum value of the former is 0.198 for VM and 0.057 for VS. Although the latter coefficient for VM is weaker than that for VS, their minimum values are greater than 0.994 for both viscosity laws.
4.3. Strong Reynolds Analogy
The strong Reynolds analogy (SRA) [
39] can be defined as:
To remove the dependence on wall temperature, several “modified” SRAs have been proposed. These modified SRAs are listed in
Table 5.
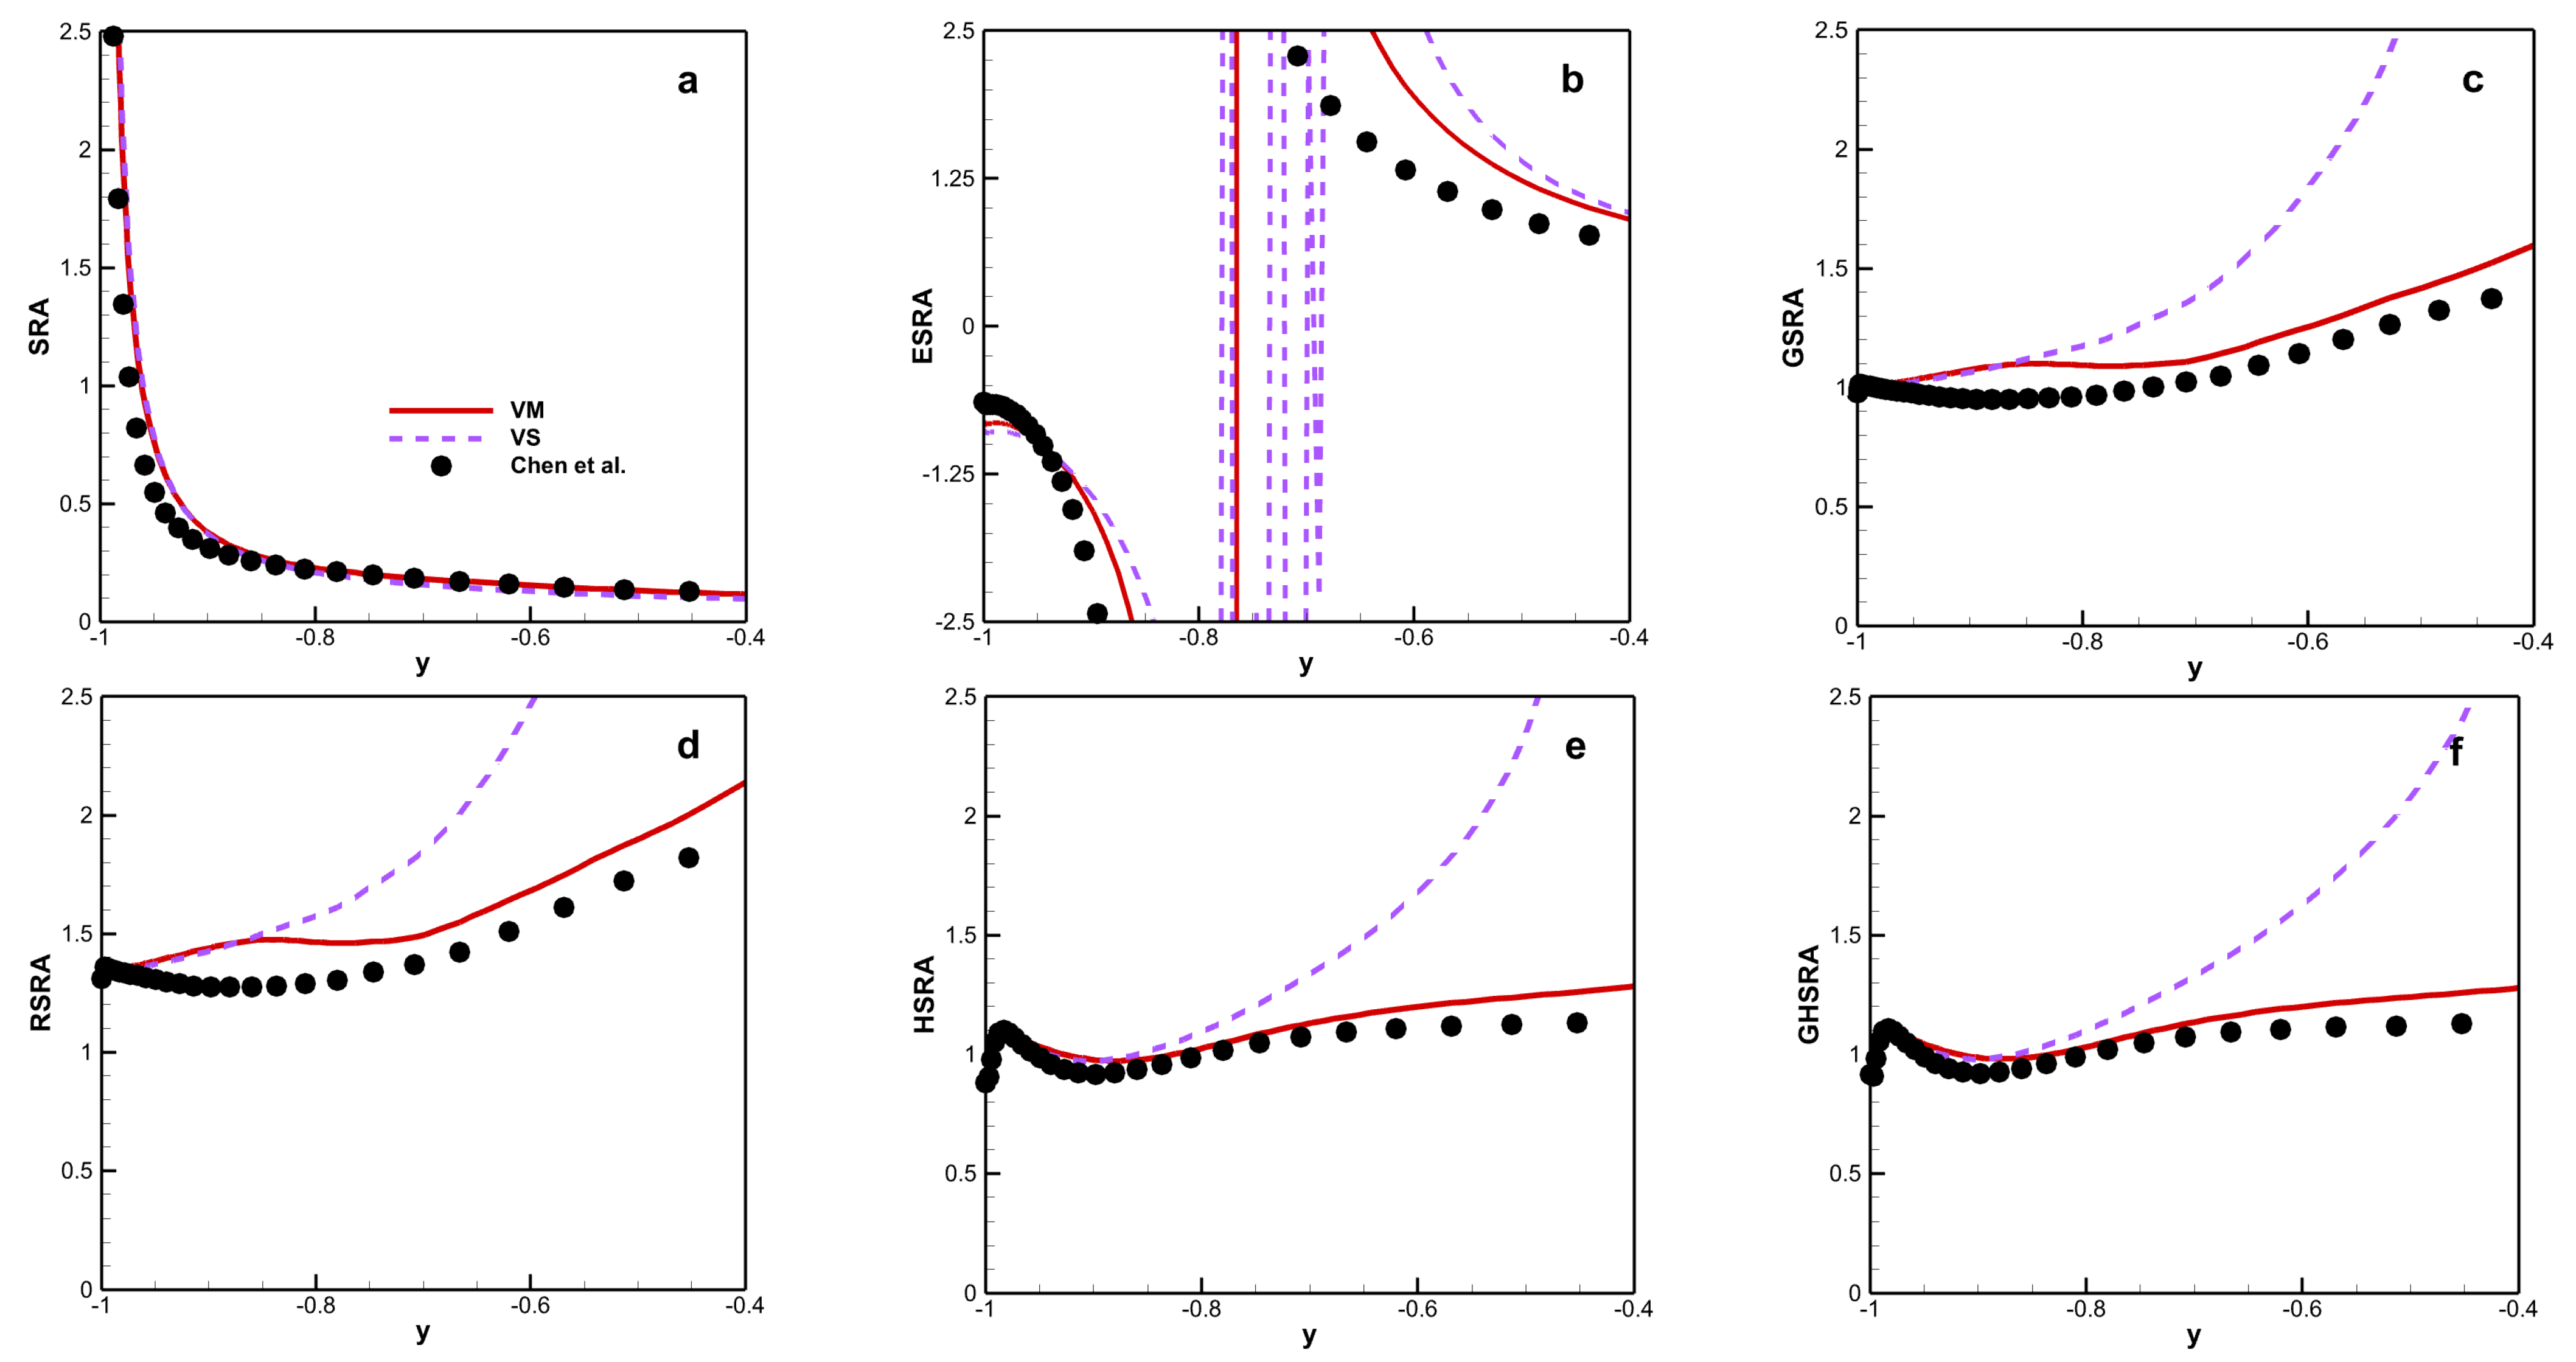
Figure 12 shows the various SRA results for the different viscosity laws. Several similar characteristics can be observed with different viscosity laws. First, SRA and ESRA fail for both viscosity laws because the value of SRA deviates significantly from 1.0 and overshoot and sign changes can be observed in the ESRA. Second, the trends exhibited by the other modified SRAs are similar, with magnitudes that are closer to 1.0 for VM than for VS. Moreover, the magnitude of HSRA and GHSRA stay near to 1.0 for VM along the channel. This means that HSRA and GHSRA are better than the other modified SRAs in predicting HTSTCF results for chemical equilibrium under the mixture viscosity law.
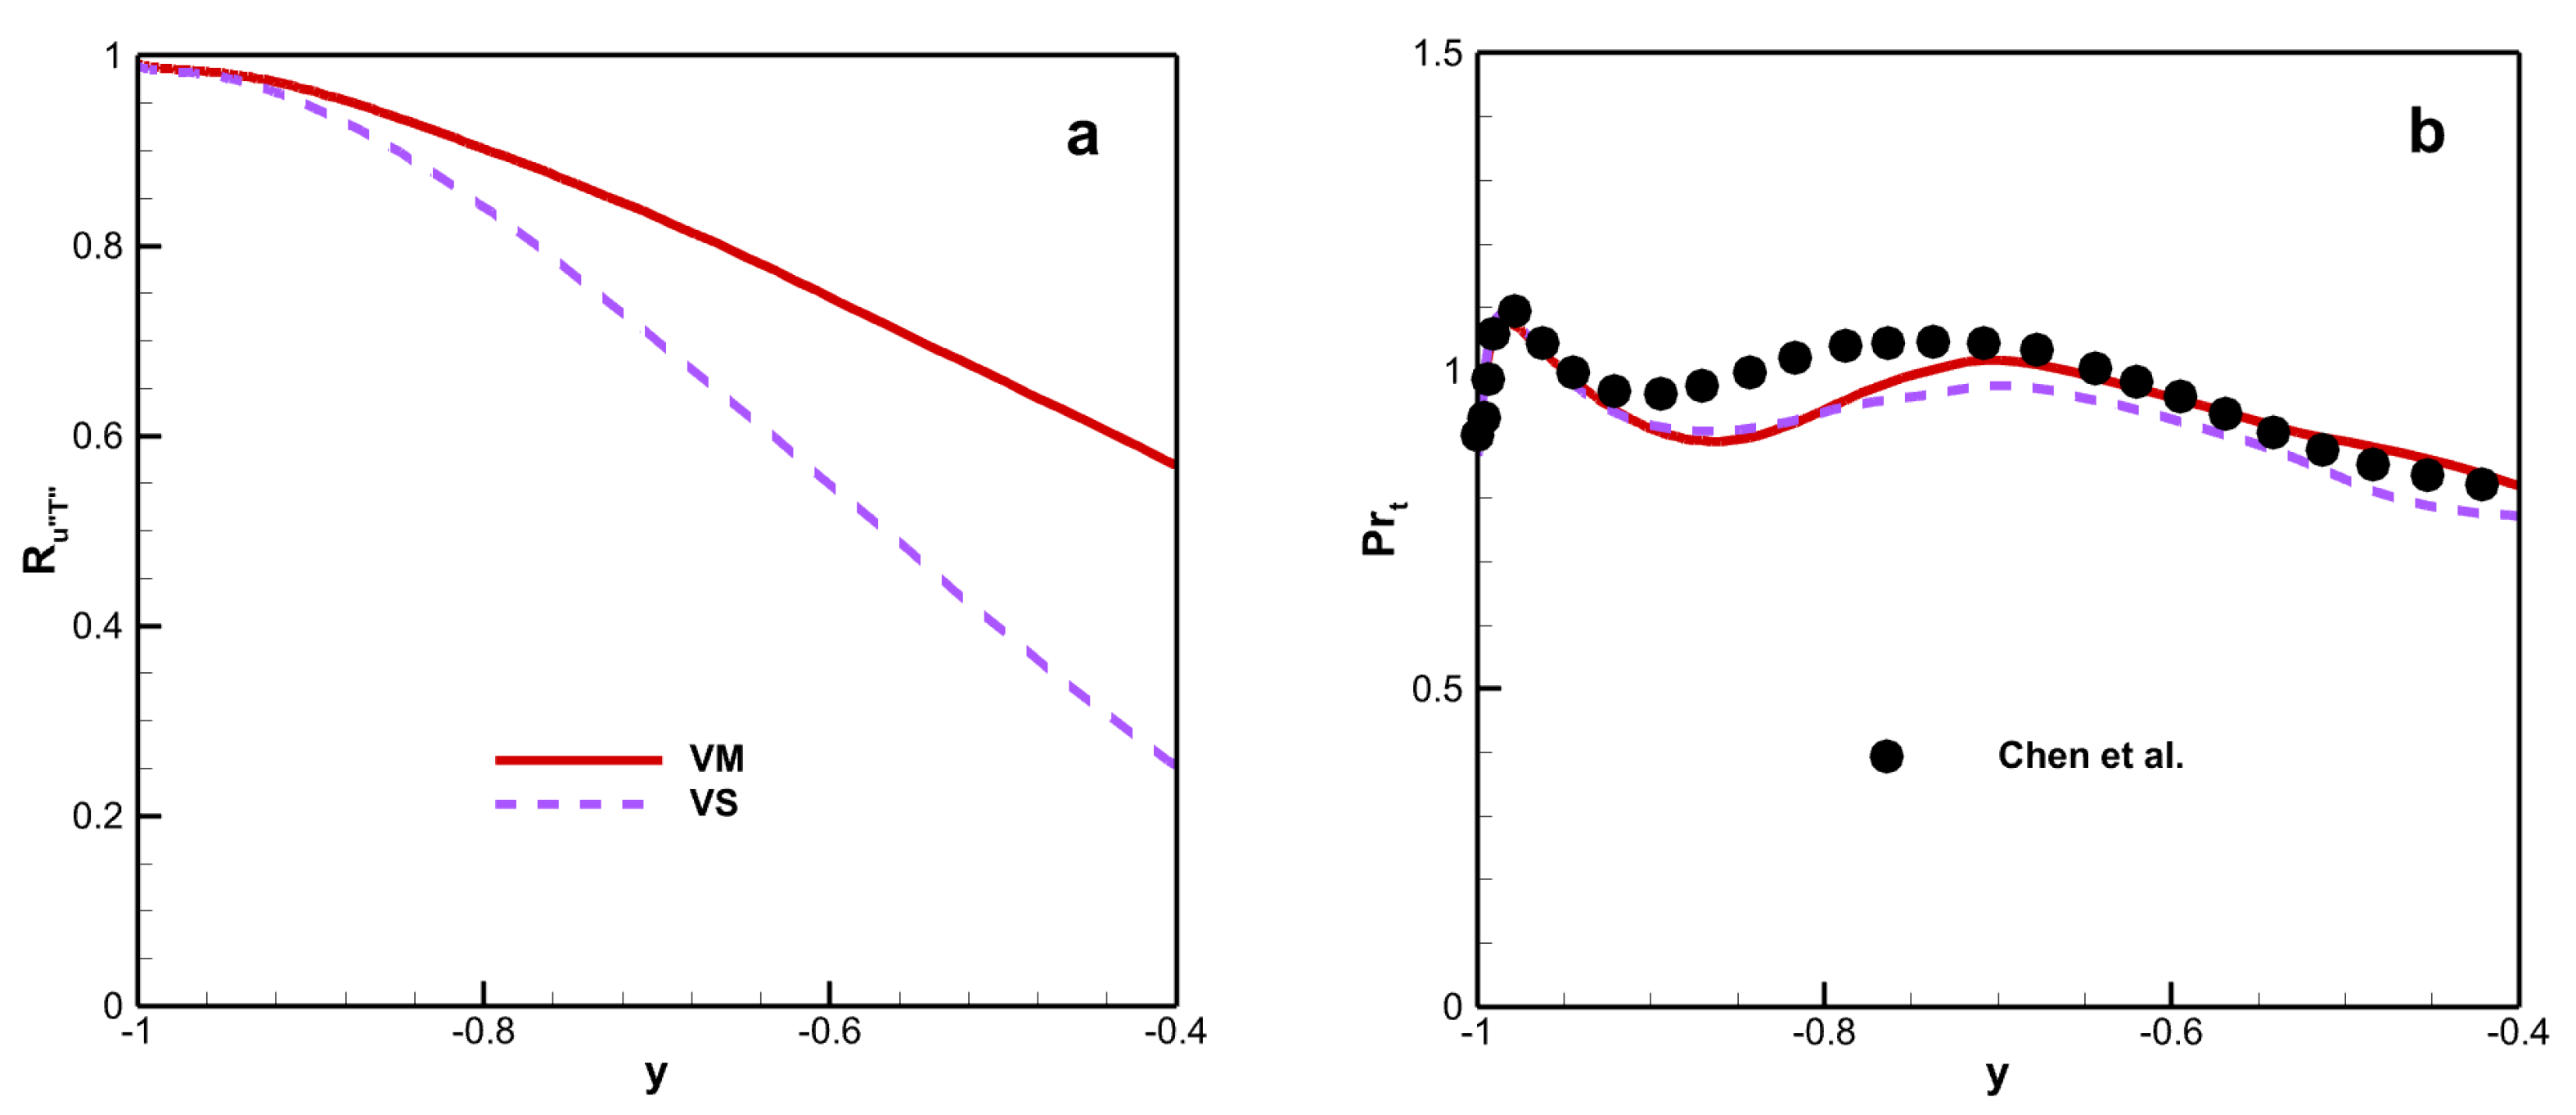
Figure 13a shows the correlation coefficient between the streamwise velocity and temperature fluctuation
, which can be defined as follows:
There is a positive correlation between
and
because
is positive. The correlation coefficient depends on the wall temperature near the wall, but this dependence decreases with increasing wall–normal distance. Moreover,
for VM is larger than that for VS, especially at the core region of the channel.
Figure 13b shows the turbulent Prandtl number, which has an impact on HSRA and GHSRA and is defined as follows:
where
is the turbulent Prandtl number. The turbulent Prandtl number is insensitive to the viscosity law, and remains close to unity along the channel.
4.4. Turbulent Kinetic Energy Budget
The turbulent kinetic energy (TKE) is:
and the budget equation for TKE is as follows:
where
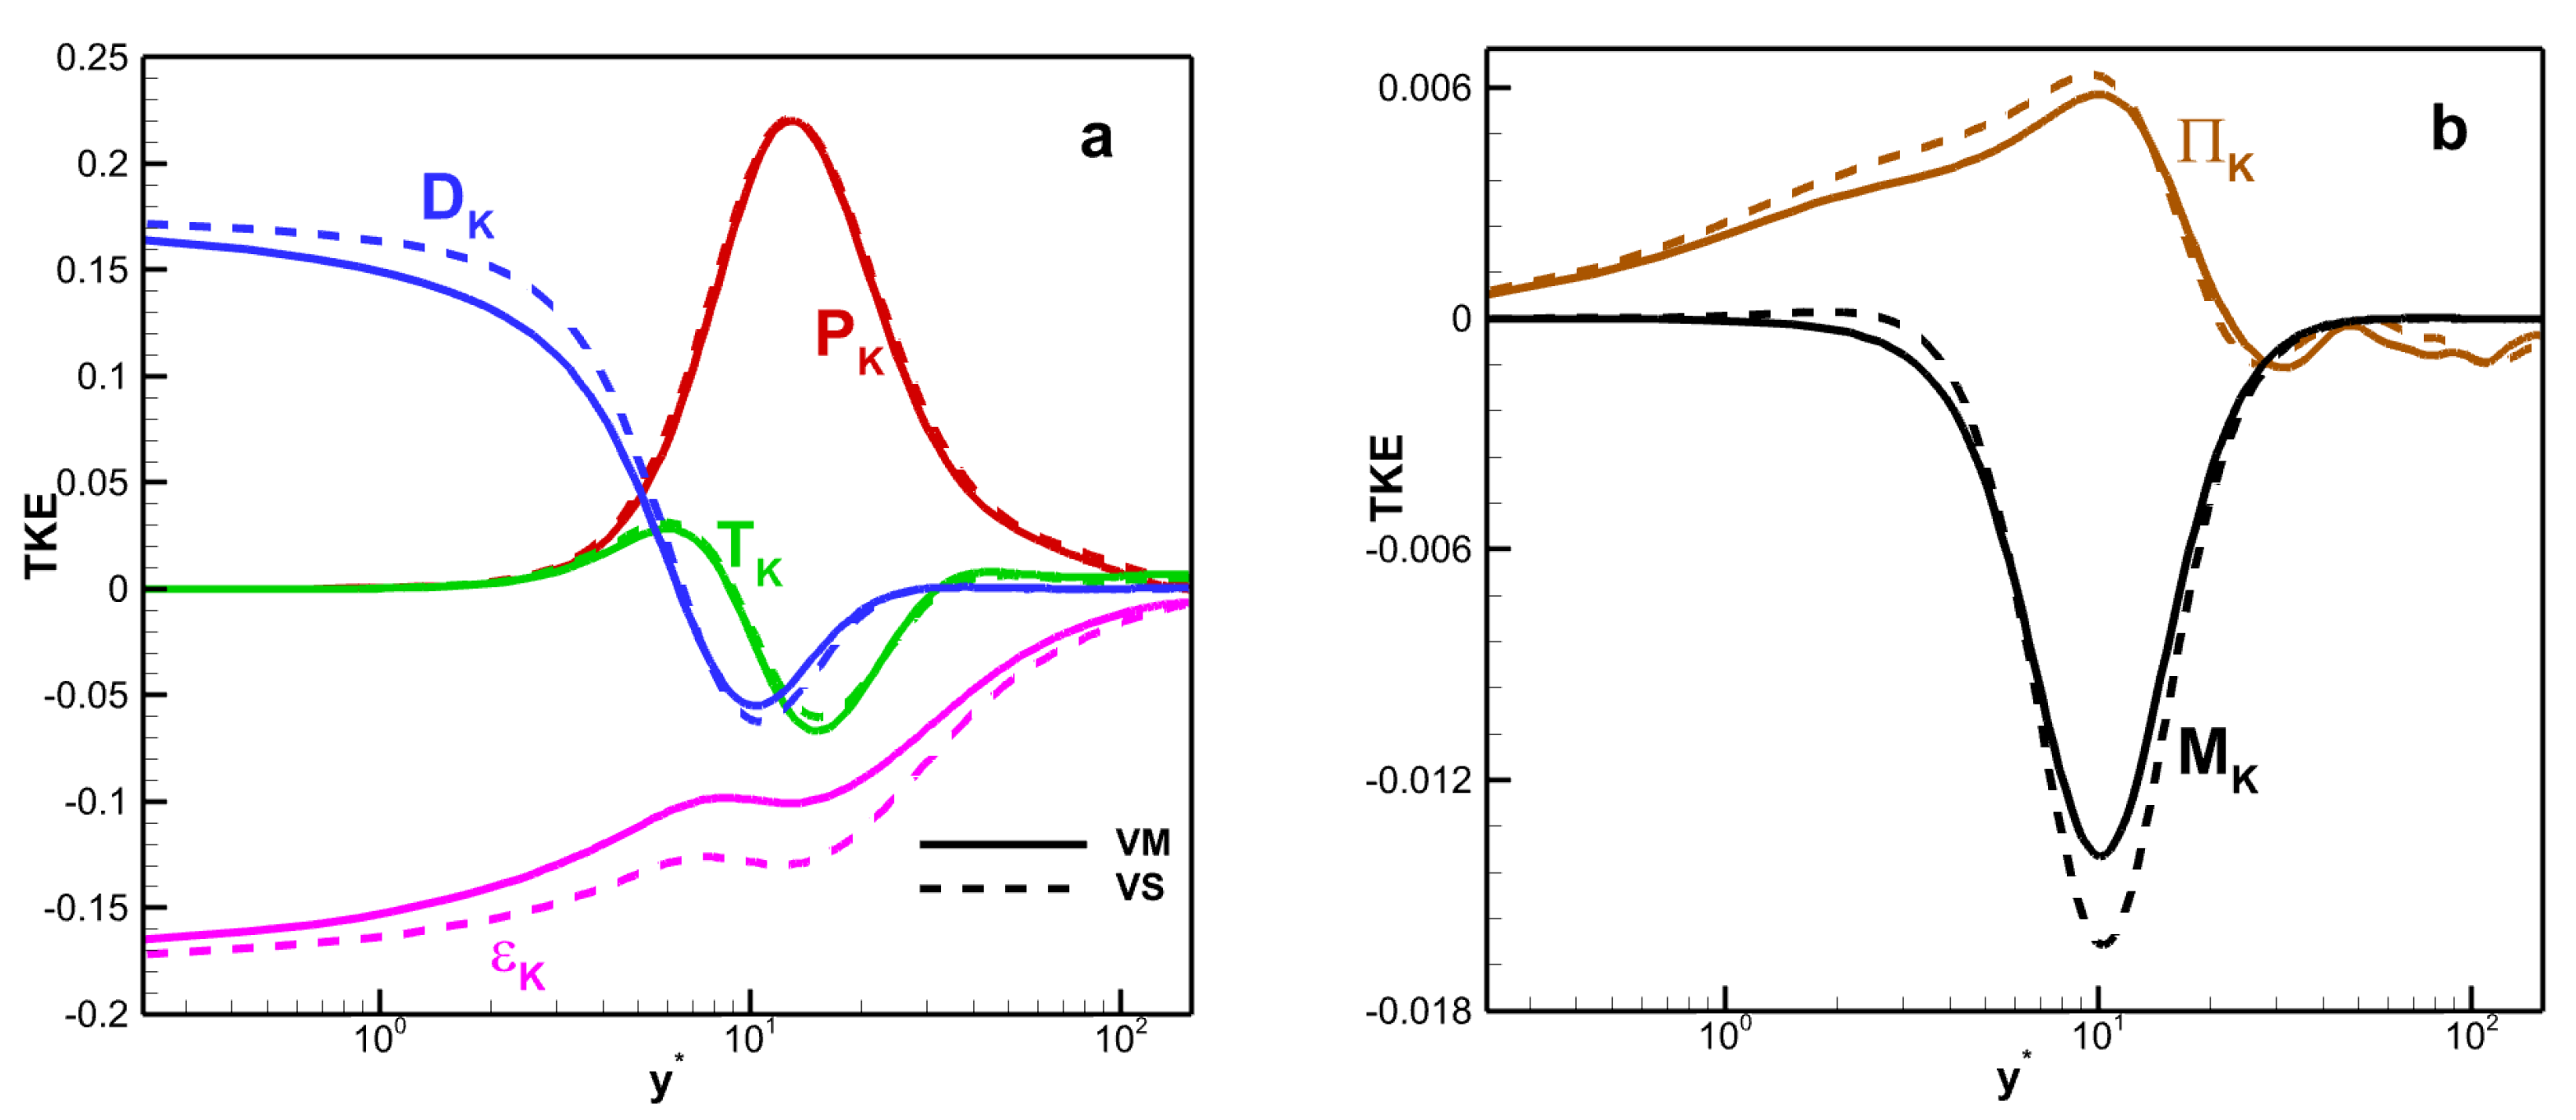
These terms can have the following meanings: the substantial derivative of the TKE along a mean streamline is on the left; , , , , , are the production term, the turbulent transport term, the pressure velocity gradient correlation term (which accounts for the sum of the pressure transport term and pressure dilatation term ), the viscous diffusion term, the density fluctuation term (which accounts for the sum of the mean flow viscous stress diffusion term and the pressure work conducted term ), and the molecular viscous dissipation term.
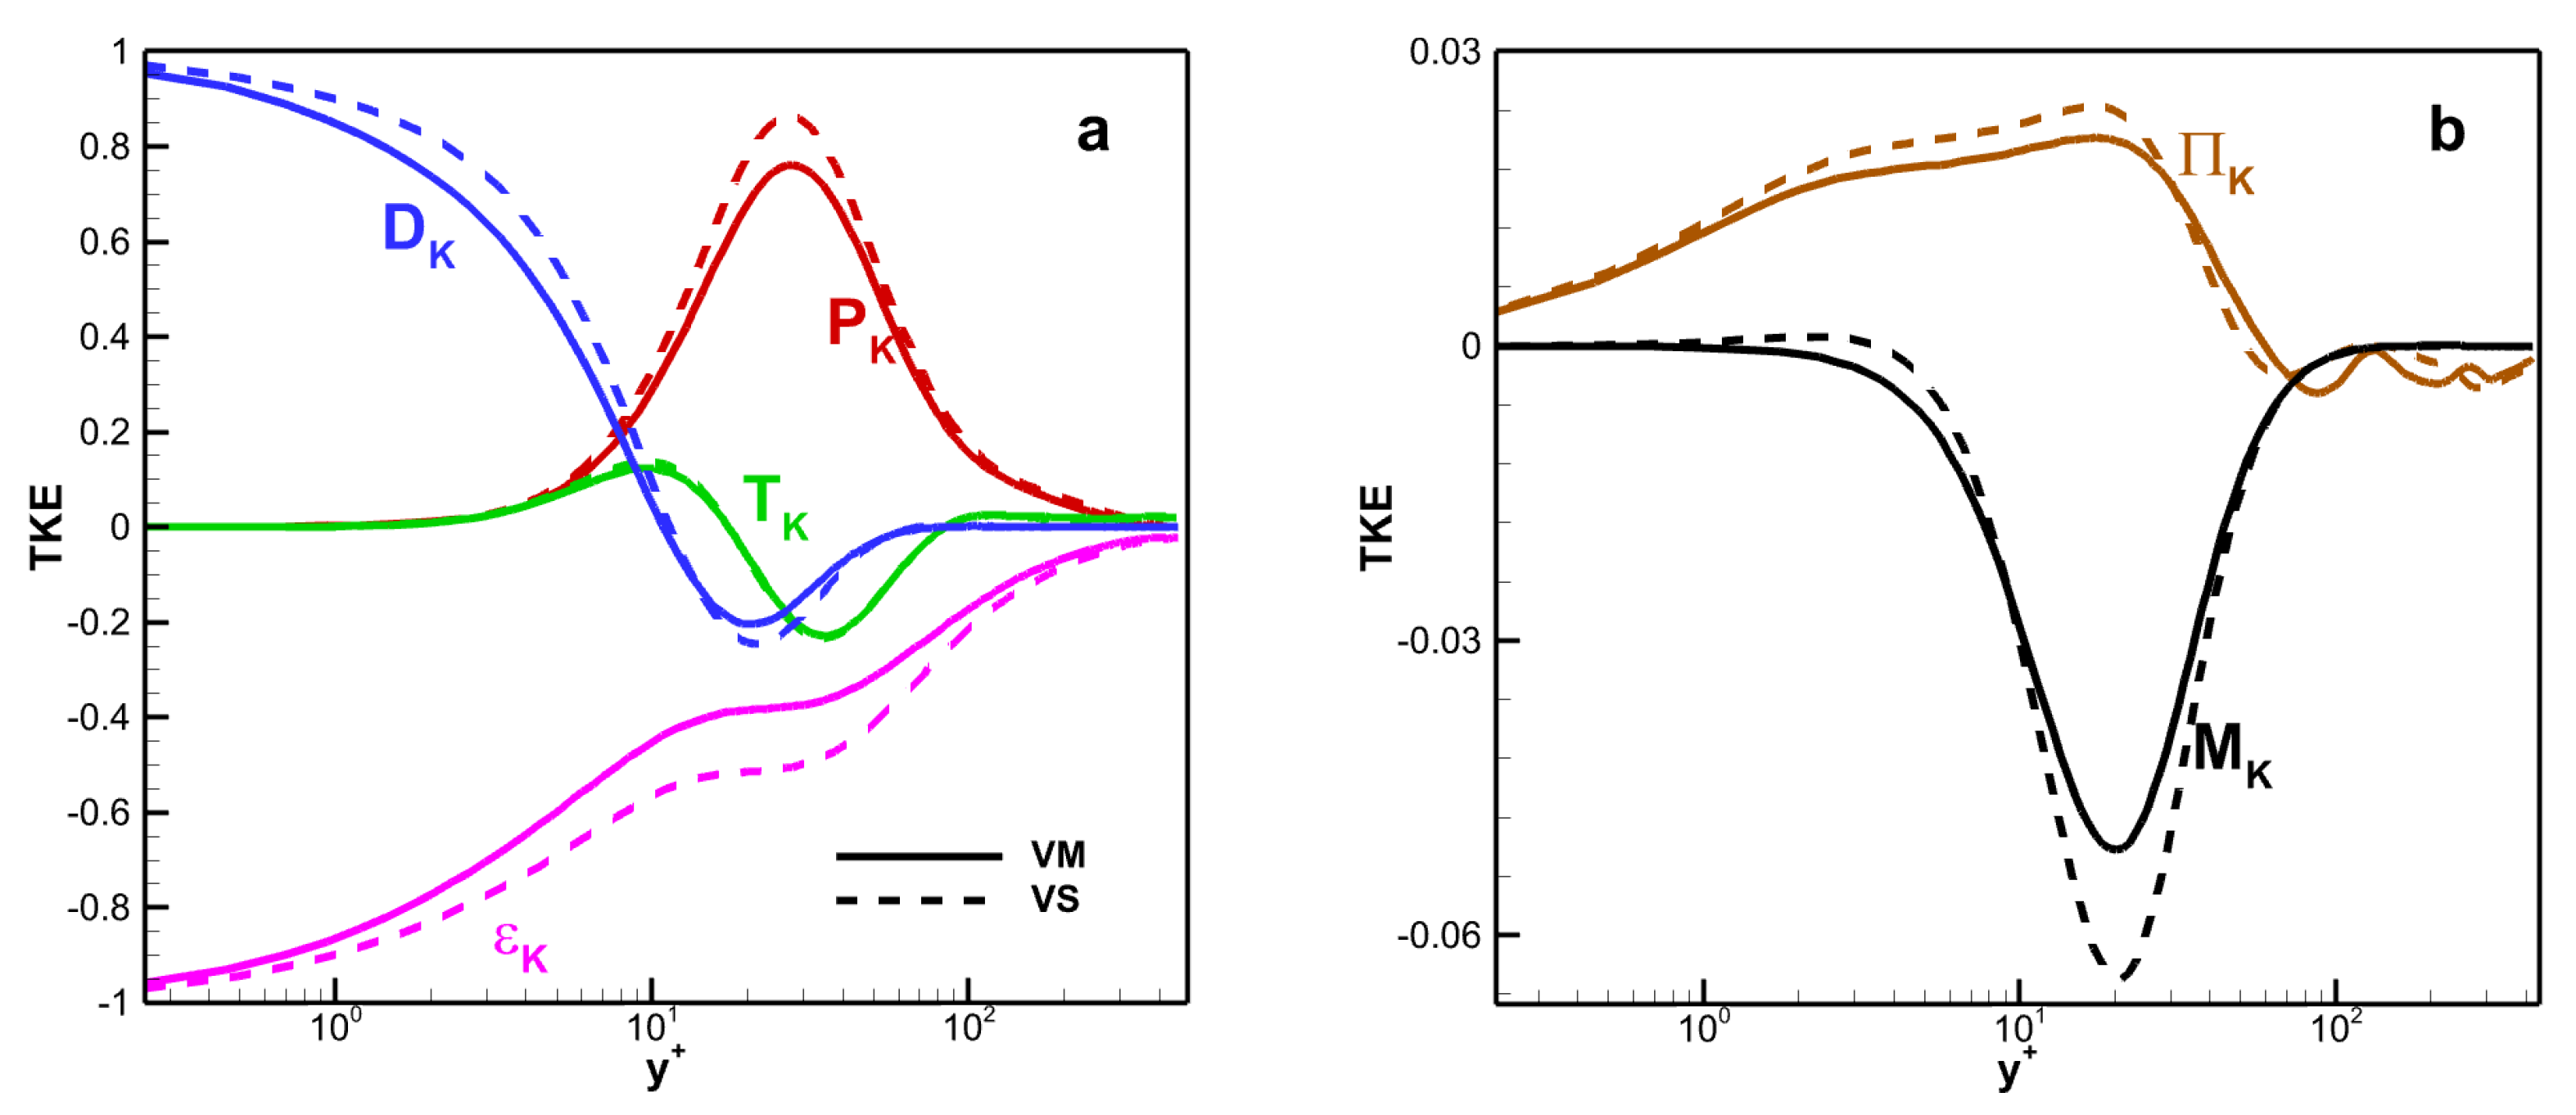
The TKE budget terms versus wall scaling
as shown in
Figure 14. All terms are normalized by the molecular viscous dissipation term at the wall, i.e.,
. The value of
is 0.0113 for VM and 0.0111 for VS. The production term
, turbulent transport term
, viscous diffusion term
, and the molecular viscous dissipation term
are dominant, whereas the pressure velocity gradient correlation term
and density fluctuation term
are relatively weak. Moreover, in the near-wall region, the viscous diffusion and viscous dissipation terms play a balancing role in the TKE transport process. As the distance between the fluid and the wall increases, the influence of the production term becomes increasingly significant. The viscosity law affects the amplitude of these terms, especially in the core region of the channel. For example, the maximum values of the production term for VM and VS are 0.761 and 0.862, respectively. The maximum deviation in the molecular viscous dissipation term is 36.4%.
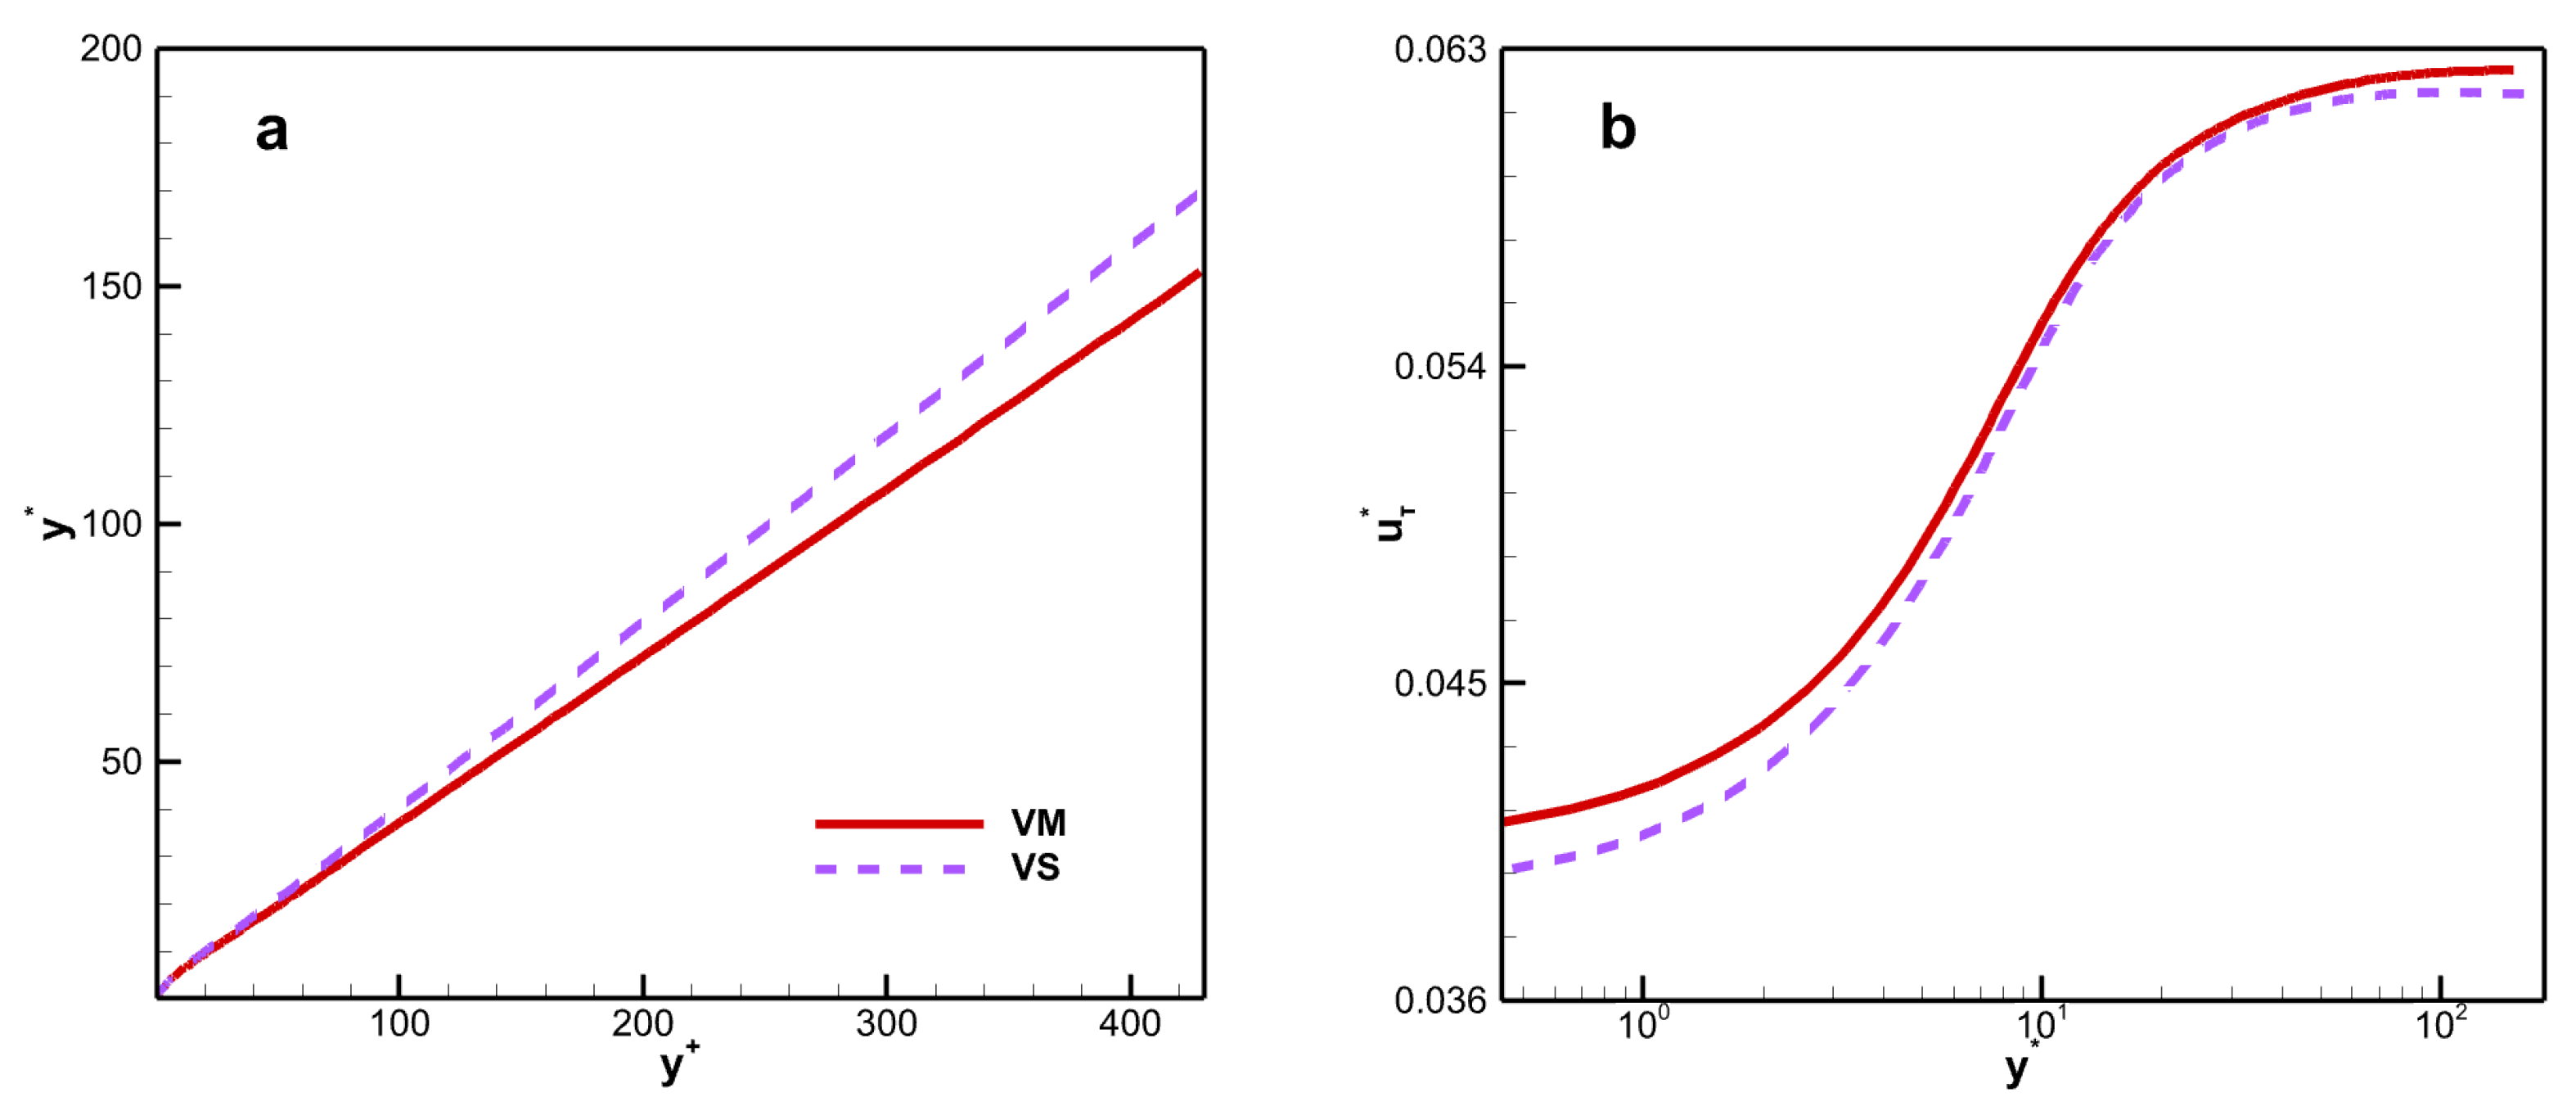
Huang et al. [
7] found that the data for different cases obey a more coherent trend under semilocal scaling (
,
), where
is defined as follows:
The semilocal scaling does not only depend on the properties of the wall, but also on the properties of the mean flow; moreover, wall scaling is based only on wall flow properties. Several studies have demonstrated the effectiveness of semilocal scaling [
43]. The similarities and differences in the ratios of
to
and
to
between VM and VS are shown in
Figure 15a,b, respectively.
The effectiveness of semilocal scaling was also proven in this study, as shown in
Figure 16. The production and turbulent transport terms collapse better under different viscosity laws, and the difference in other terms has been further narrowed. The difference between the peaks of the density fluctuation term is 0.0023.
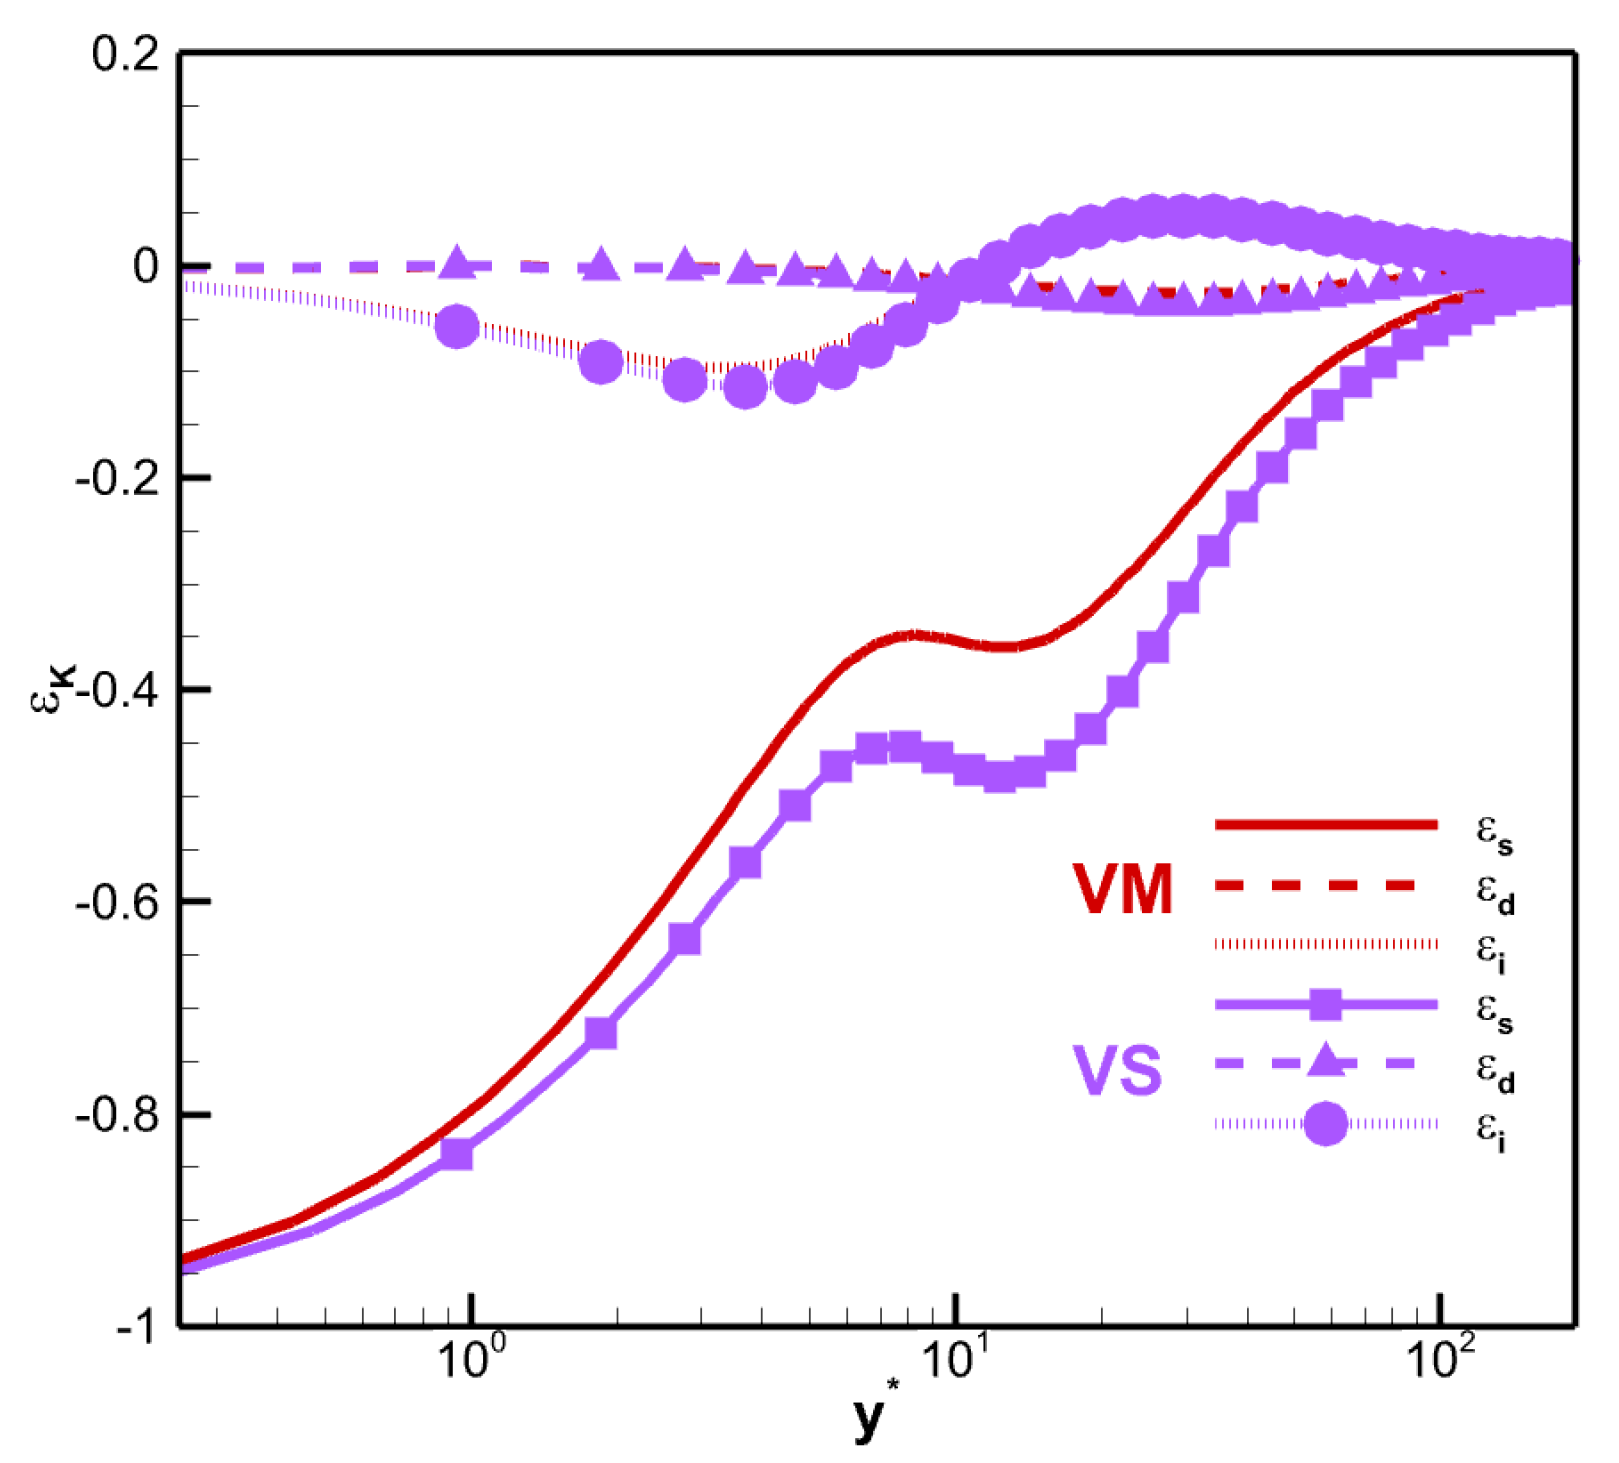
The molecular viscous dissipation term
can be expressed as the sum of solenoidal dissipation
, dilatational dissipation
, and an inhomogeneous part
.
The decomposition of the dissipation term
is shown in
Figure 17. Note that the dominant term in
is
, and
is near zero along the channel. The maximum difference between the solenoidal dissipation in the core region for VM and VS is approximately 0.127. The maximum value of
is approximately 9.32% for VM and 11.4% for VS at
and
. Thus,
is not negligible close to the wall.
4.5. Instantaneous Structures
4.5.1. Near-Wall Streaks
The instantaneous fluctuating temperature near the wall is shown in
Figure 18. Several long low-temperature regions (deep blue) can be identified, called near-wall streaks. The near-wall structure is mainly characterized by the streaks distributed along the streamwise direction, which are observed in both viscosity laws. The streamwise coherency for VM is stronger than that for VS, and the spanwise spacing is significantly larger. The average spanwise spacing of the near-wall streaks is approximately 151 for VM and 138 for VS, which is much larger than for calorically perfect gas (approximately 105 wall units). In addition, a clear traveling wave packet structure [
21,
44] can be observed for VM, whereas it is relatively unclear for VS.
4.5.2. Large Scale Structures
Vortex identification and visualization in turbulence are widely researched. There have been many pioneering studies on large-scale structures, such as the
criterion [
45,
46],
criterion [
47],
criterion of Jeong and Hussein [
48],
criterion of Chakraborty et al. [
49], and
-criterion of Liu et al. [
50,
51]. The
Q-criterion, is defined as
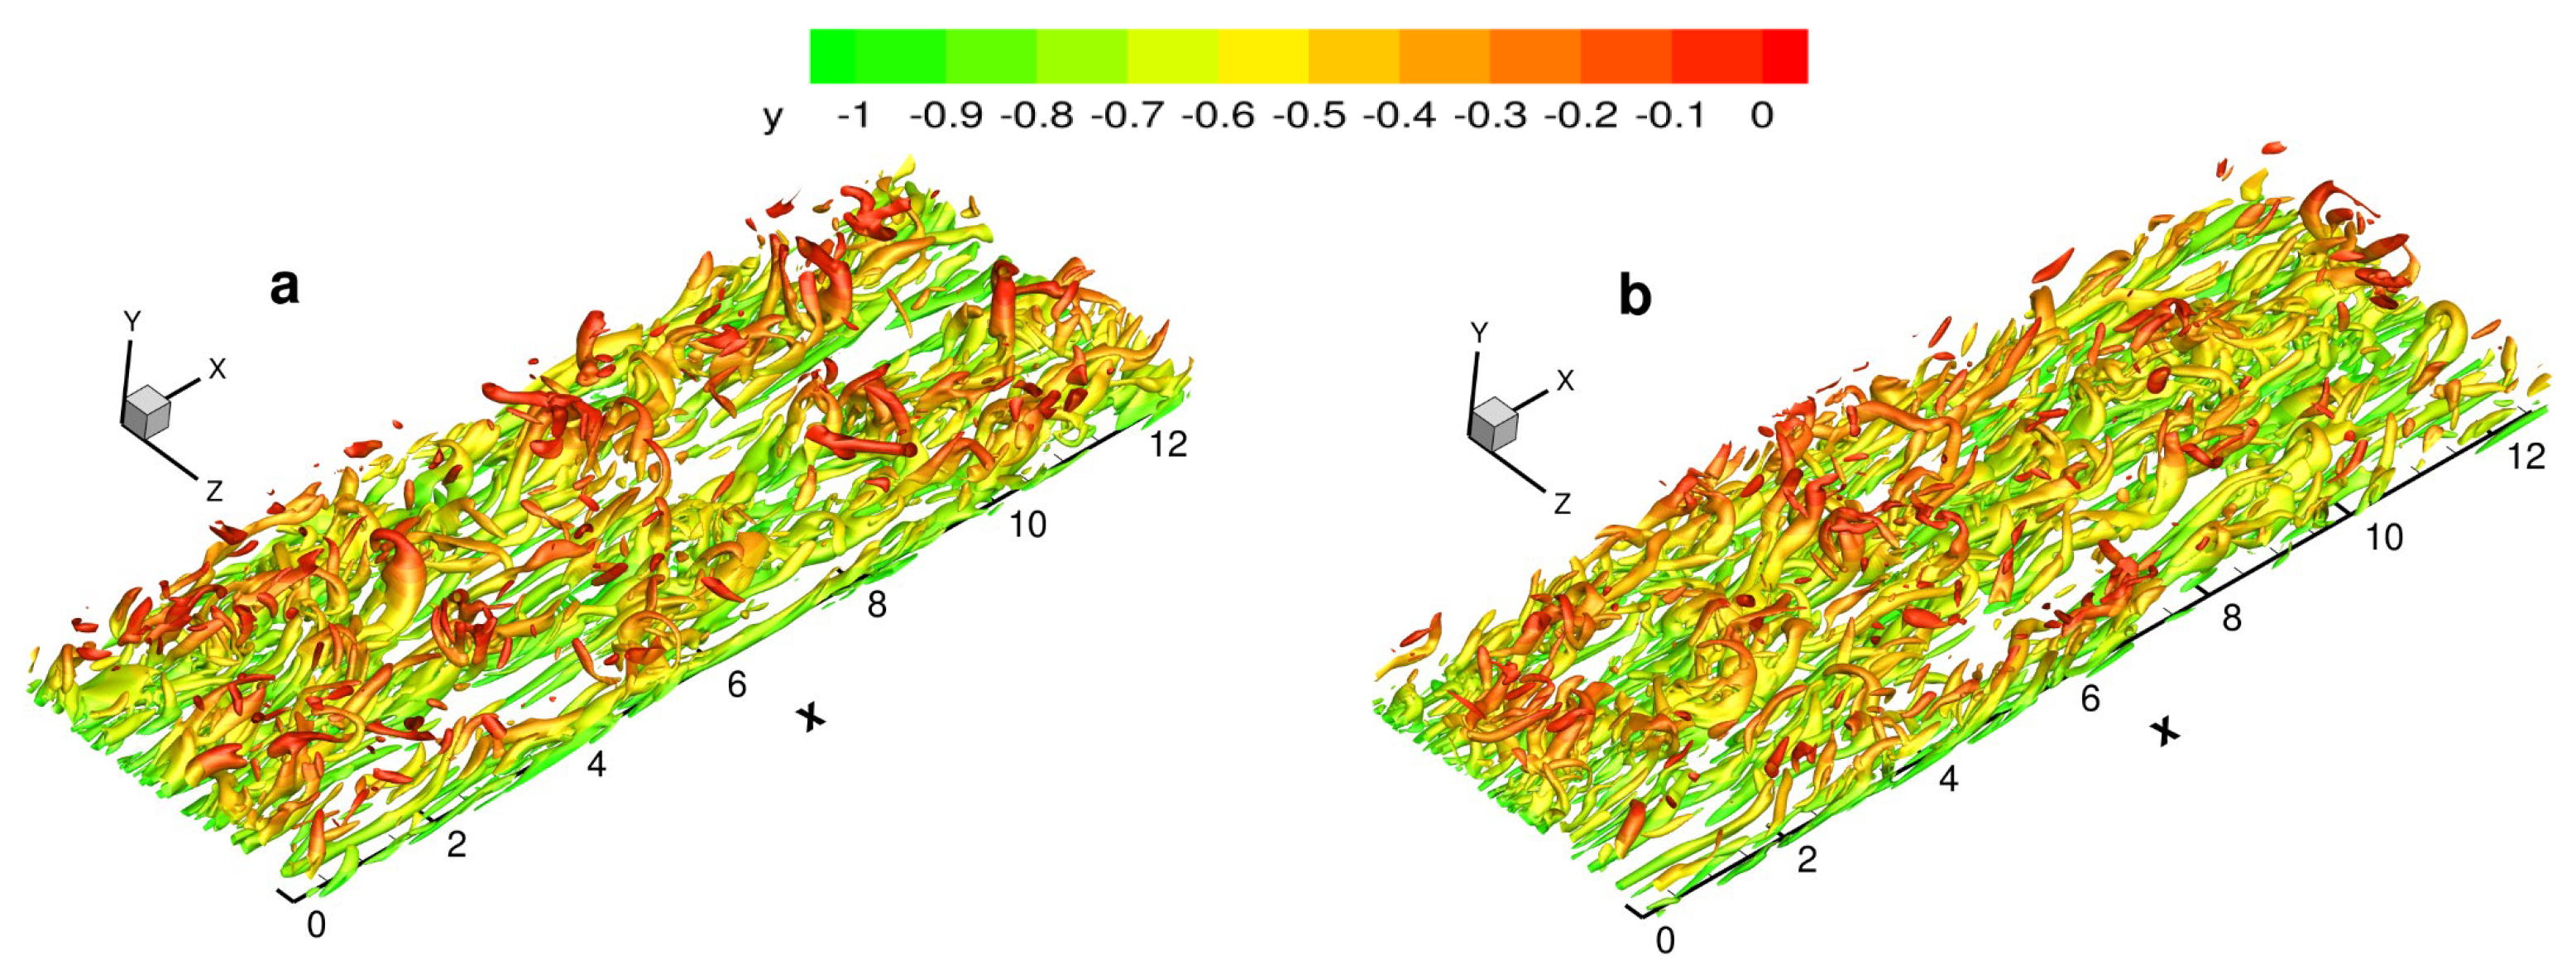
Figure 19 shows the instantaneous isosurfaces of
. Due to the symmetry condition, half of the domain is used in the normal direction. Streamwise vortex structures fill the near-wall region. Hairpin vortices can be observed under both viscosity laws. In the process of downstream development, the scale of the hairpin vortices gradually increases, resulting in a spanwise collision between several hairpin vortices and the merging of larger-scale hairpin vortices. After the hairpin vortex is fully developed, the head is lifted out of the region. The inner side of the hairpin vortex is tossed up and the outer side is swept down, which is a very important structure of turbulence. Compared with the results for VS, the vortex structure is less chaotic and the number of large-scale vortices is significantly higher in the case of VM.
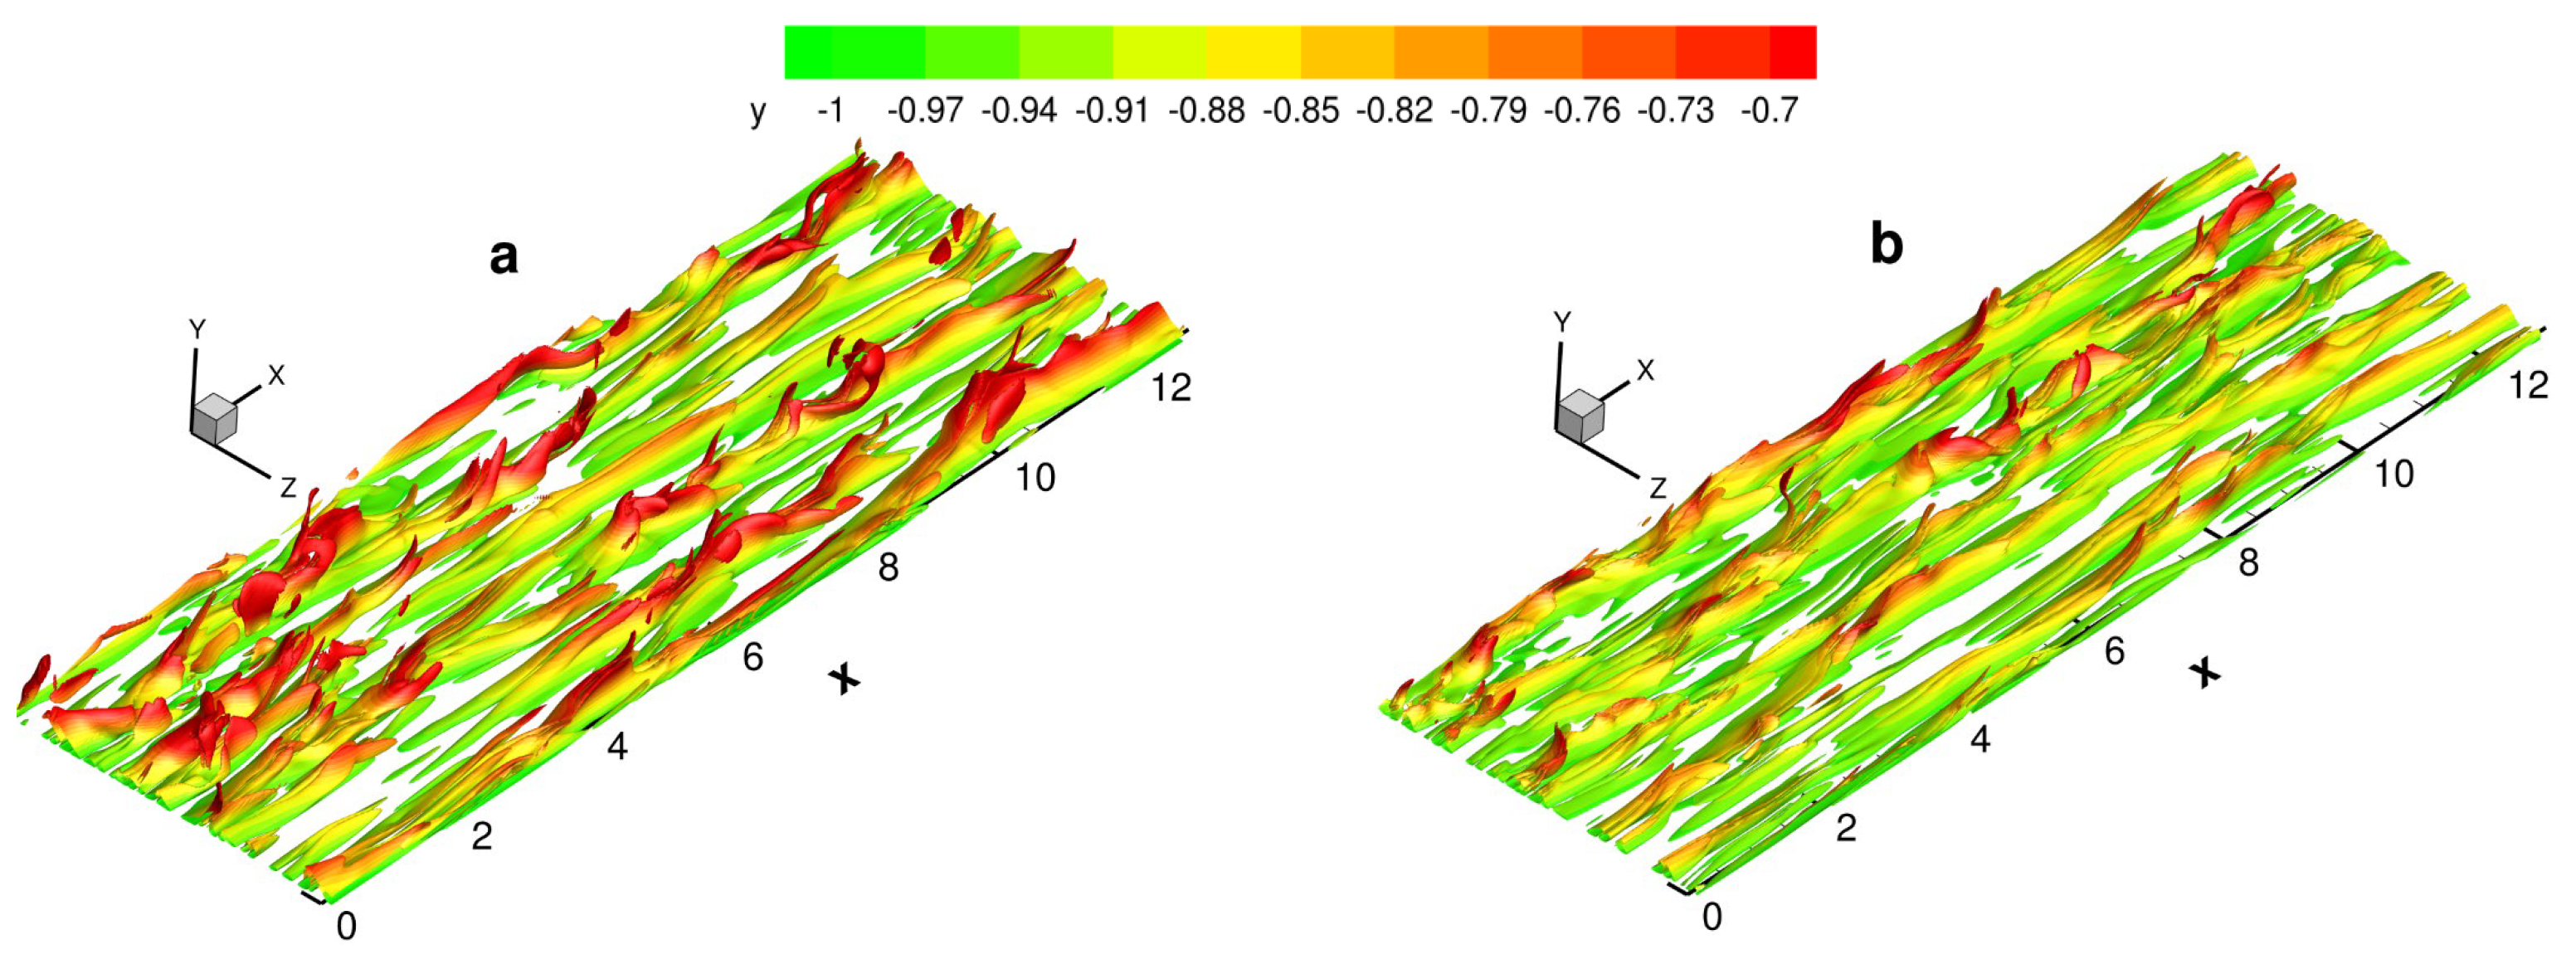
Figure 20 shows the instantaneous isosurfaces of the mass fraction gradient magnitude
. Large-scale structures can be observed, especially in the near-wall region. These structures disappear away from the wall. Although the instantaneous field is significantly different from those of the
criterion, the effects of the viscosity laws are similar. Moreover, the structure in the case of VM is obviously sharper than that for VS.
