Article

Energy Recovery Decision of Electric Vehicles Based on Improved Fuzzy Control

1
School of Business (MBA Education Center), Henan University of Science and Technology, Kaiyuan Avenue, Luoyang 471023, China
2
Department of Industrial Engineering and Management, National Kaohsiung University of Science and Technology, Kaohsiung 807618, Taiwan
*
Author to whom correspondence should be addressed.
Processes 2024, 12(12), 2919; https://doi.org/10.3390/pr12122919
Submission received: 18 October 2024 / Revised: 13 December 2024 / Accepted: 16 December 2024 / Published: 20 December 2024
(This article belongs to the Section Process Control and Monitoring)

Abstract

:
With the advancement of electric vehicles, their low energy recovery efficiency has become the main obstacle to development. This study focuses on the problem of braking energy loss in electric vehicles during urban road driving and proposes an improved fuzzy control strategy to optimize the energy management of electric vehicles. The exploration first introduces fuzzy control logic to adjust and optimize the energy recovery system of electric vehicles and then introduces a sparrow search algorithm to optimize the adjustment parameters. Finally, using MATLAB R2022a simulation software environment, a comparative analysis is conducted on two driving cycles: urban dynamometer driving schedule and New York City conditions. Simulation results show that the improved fuzzy control strategy can recover 906.41 kJ of energy under urban driving cycle conditions, and the energy recovery rate reaches 49.00%, while the ADVISOR strategy is 507.47 kJ and 27.13%, respectively. The energy recovery rate of the research method is 21.87% higher than that of the comparison method. Improved energy recovery rate of 80.68%. In the driving cycle with New York City, the improved strategy recovered 294.45 kJ of energy, and the energy recovery rate was 48.54%. Compared with the ADVISOR strategy, the energy recovery rate increased by 100.20%, and the energy recovery rate increased by about 110.77%. The research results indicate that the improved fuzzy control strategy is significantly superior to the ADVISOR control strategy, effectively improving energy recovery efficiency and battery charge state maintenance ability under an urban dynamometer driving schedule, achieving more efficient energy management.

1. Introduction

The global energy crisis and increasingly severe environmental pollution have accelerated the transformation of the automotive industry. Electric vehicles (EVs), as green transportation vehicles, are valued for their zero emissions and high energy efficiency. However, the energy utilization efficiency of EVs still needs to be optimized. Under urban dynamometer driving schedule (UDDS), frequent acceleration and deceleration lead to significant energy loss, especially during the braking process, where a large amount of kinetic energy is not effectively recovered and converted into electrical energy. This not only wastes valuable energy but also has a great impact on EV batteries [1,2]. At present, the energy recovery of EVs mainly relies on regenerative braking systems, which convert kinetic energy into electrical energy and store it during the braking process through the inverter operation of the motor. However, the existing regenerative braking energy management strategies have not yet achieved optimal results in different driving conditions [3]. Especially in the rapidly changing urban driving environment, the response and control strategies of the braking energy recovery (BER) system need to be further improved [4]. Traditional energy management strategies often exhibit the drawbacks of slow response and limited adjustment ability in the face of changing driving conditions. Wang et al. proposed an organic Rankine cycle energy management system for hybrid EVs with deep reinforcement learning when facing energy management issues. The simulation outcomes indicated that the raised method saves 2% of energy compared to traditional methods [5]. Mei et al. raised a fuzzy sliding mode control method with an adaptive control strategy for regenerative braking systems of EVs. This method combined the optimal battery operating conditions and energy recovery efficiency under actual constraints by fixing the pneumatic braking torque and motor torque and verified the feasibility of this method in experiments [6]. In the study of energy management technology for EV batteries by Abdelaal et al., two cascaded fuzzy logic controllers and a fuzzy tuning model predictive controller were analyzed, and the experimental results verified that the fuzzy tuning model predictive controller has a lower degree of reduction in battery pack state of charging (SOC) and health state [7]. Zhang et al. proposed a battery voltage fault diagnosis model with high sampling frequency real operating data of EVs. The model classified the driving conditions of EVs, analyzed the extracted operation segments, and predicted the battery voltage. The model achieved good voltage prediction and energy management in experimental results [8].
At present, the research on the energy recovery mechanism of electric vehicles has attracted widespread attention, especially in the context of the rapid development of electric vehicles, how to improve the efficiency of energy recovery has become an important issue to be solved. Most studies have focused on traditional regenerative braking energy management strategies, but their performance in busy urban environments is still unsatisfactory. The deep reinforcement learning-based approach proposed by Wang et al. [5]. improves the situation to some extent, but its adaptability and real-time performance are still limited. Therefore, in the rapidly changing urban driving environment, it is urgent to explore more efficient intelligent control strategies. In order to solve the problem of low energy recovery efficiency of electric vehicles, an improved fuzzy control strategy is proposed, which uses Sparrow Search Algorithm (SSA) to optimize parameters to improve the energy recovery rate of regenerative braking. The innovation of this method lies in proposing an improved energy management strategy that combines fuzzy control logic and SSA to intelligently regulate the regenerative braking of EVs under different working conditions. SSA was applied to the self-optimization of fuzzy control parameters to enhance the adaptability and accuracy of the strategy under complex driving conditions.

2. Methods and Materials

2.1. Energy Recovery Mechanism for Electric Vehicles

When an EV decelerates, it can recover energy through a regenerative braking system. During this process, the electric motor plays the role of a generator, transforming the vehicle’s kinetic energy into electrical energy and preserving it in the battery for reuse [9,10]. This system consists of several key components, including the bipolar transistor S , motor M , inductor L , resistor R , and capacitor C . Regenerative braking reduces energy loss and increases the range of EVs. The circuit diagram of BER is denoted in
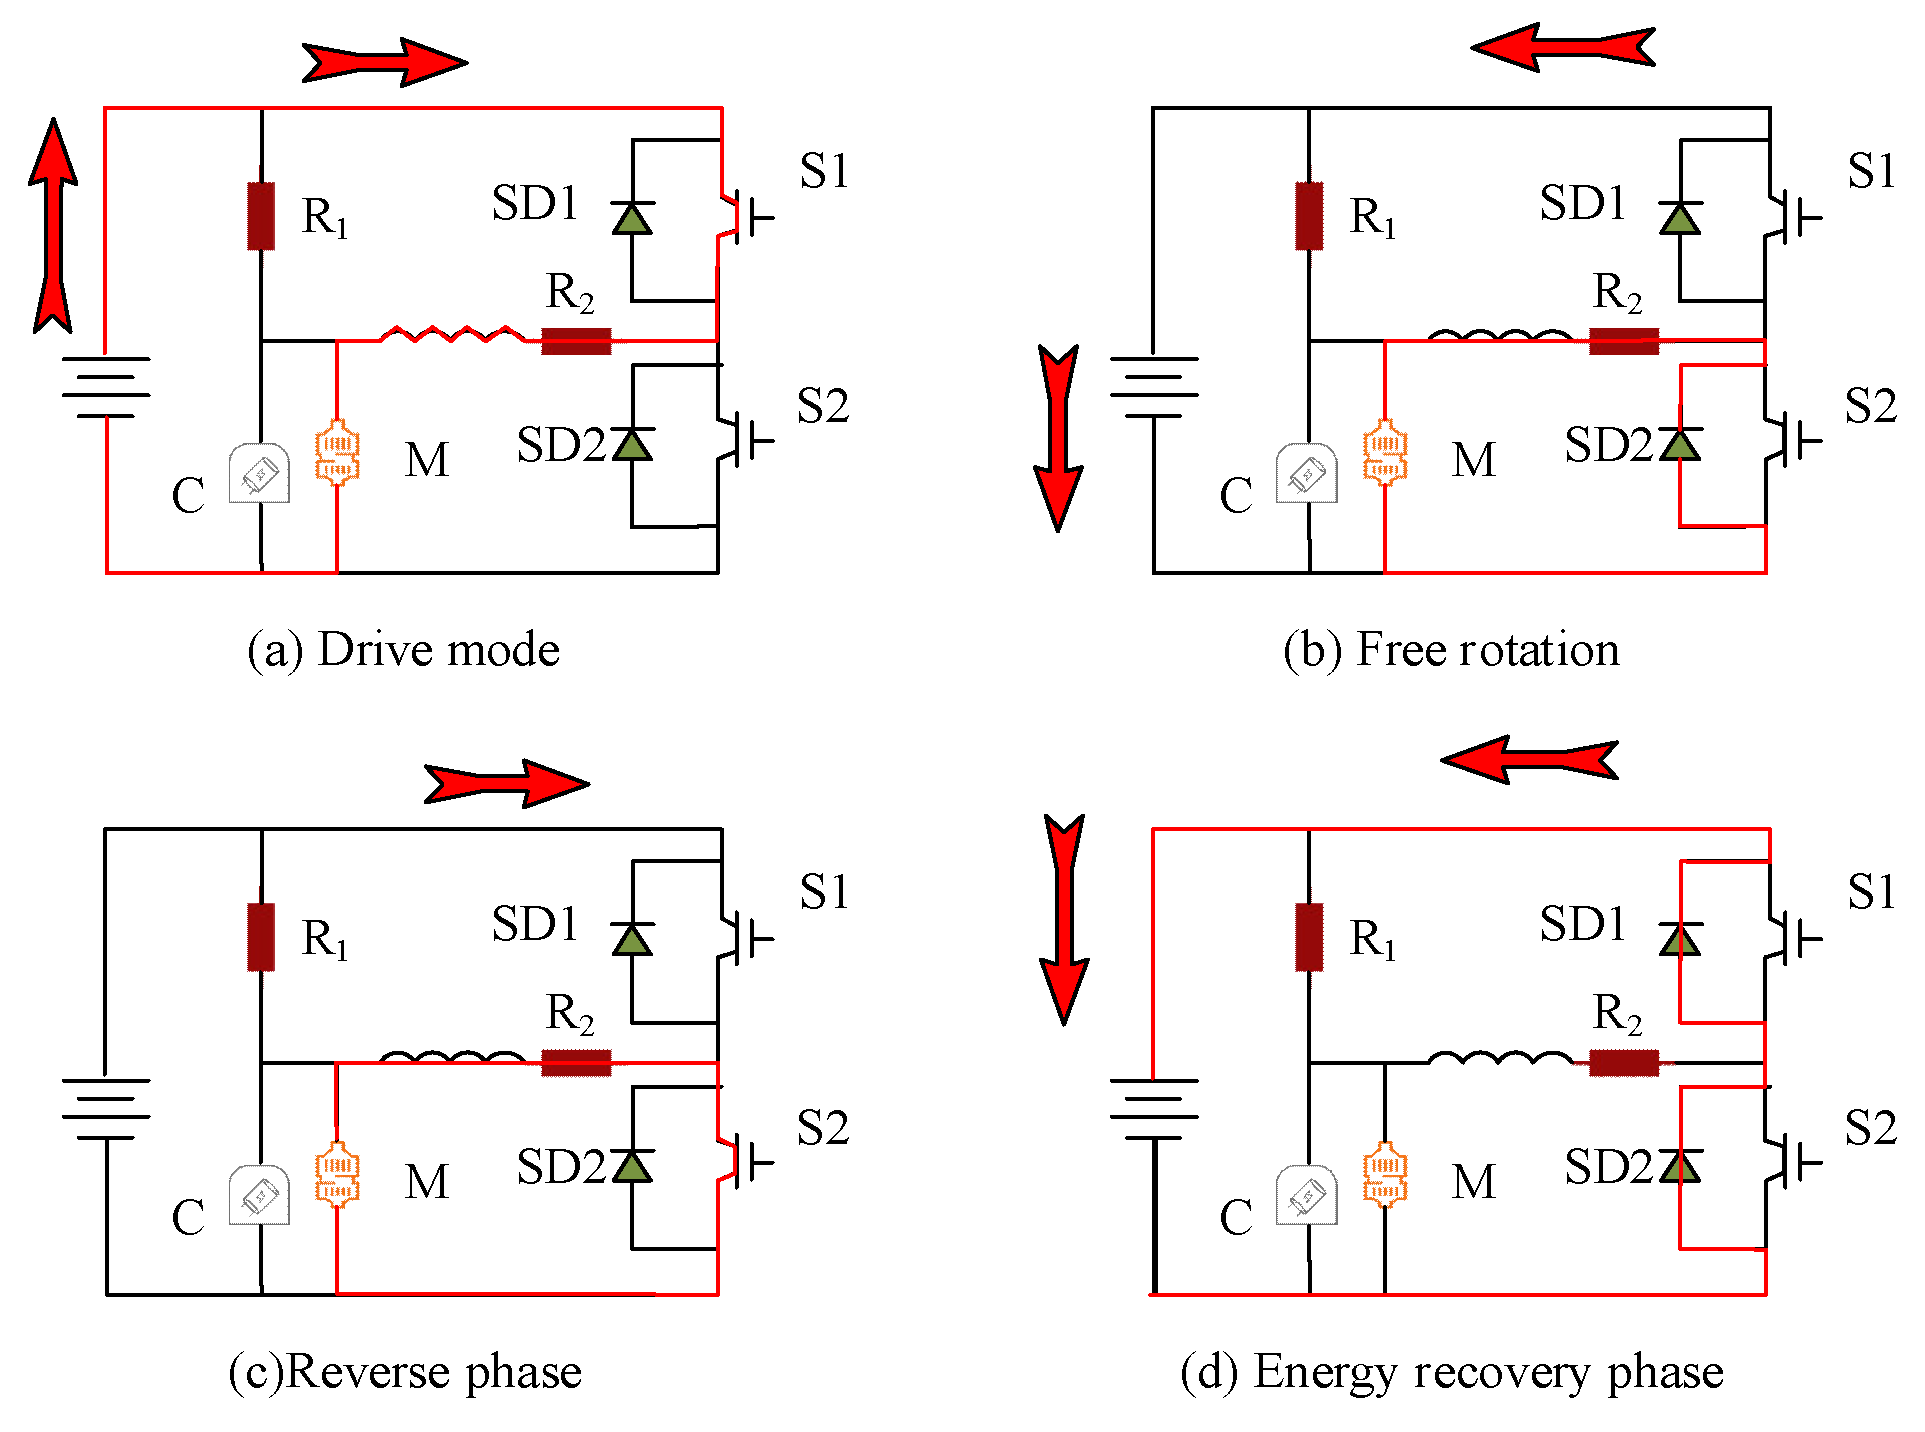
 Figure 1.
In Figure 1, the BER circuit diagram is divided into four stages. In the first stage of driving mode, as shown in Figure 1a, the vehicle relies on an electric motor for propulsion. At this time, only when the transistor S 1 is closed, S 2 remains disconnected, allowing current to be extracted from the battery pack to drive the motor. In the next stage, when the vehicle starts braking, the entire system enters the “free rotation” stage, as shown in Figure 1b. During this stage, the vehicle’s braking does not immediately cut off the current but allows the current to continue flowing through the power switch SD 2 . The third stage is the reverse phase, as shown in Figure 1c. After the braking action is maintained for a period of time, the motor starts to work in the reverse direction. At this time, the current flow direction changes, as S 1 is currently open and S 2 is closed. The fourth stage is the energy recovery phase, as shown in Figure 1d. During this period, S 2 is turned off, and the self-inductance effect of the inductor is utilized to allow current to pass through SD 1 and charge the battery. This stage is a crucial part of the entire process for the principle of energy conservation, where the influence of vehicle transmission systems and road resistance is ignored. The EV drops from the initial speed V 0 to the speed V 1 during braking, and its energy conservation formula is shown in Formula (1).
m v 1 2 m v 0 2 2 = W b + W r + W w
In Formula (1), v 0 represents the speed of the EV. W b represents the work done by the car during braking. m represents the mass of an object in the law of conservation of kinetic energy, which specifically represents the mass of a car in the study. W w represents the work done by air resistance. W r represents the work done by rolling resistance. The power calculation of the input braking system is shown in Formula (2).
P b r e a k , i n = f b v [ F w + F r + ( m + 4 I r 2 ) ]
In Formula (2), P b r e a k , i n represents the input braking system power. v represents the instantaneous speed of the car. F w represents wind resistance. F r represents rolling resistance, r represents the radius of the wheel. I means the battery’s charging current. f b represents the braking factor of the drive shaft, with values generally in the (0, 1) range. The power of the regenerative braking input transmission shaft is shown in Formula (3).
P b r e a k l i n e , i n = k f b v [ F w + F r + ( m + 4 I r 2 ) a x ]
In Formula (3), k represents the regenerative braking factor. a x represents the longitudinal deceleration of the vehicle. The research assumes that the charging efficiency of the battery is η 1 , and the energy recovered into the battery is shown in Formula (4).
E b , i n = b r e a k i n g P b 1 , i n d t P b 1 , i n = ( η ( k f b ( F w + F r + ( m + 4 I / r 2 ) a x ) I d r i v e l i n e i g 2 i 0 2 r 2 a x ) + I M I G i g 2 i 0 2 r 2 a x )
In Formula (4), η 1 represents the speed ratio of the vehicle’s transmission. i 0 represents the speed ratio of the main reducer of an EV. The efficiency of EVs in recovering kinetic energy is directly affected by braking distance and power generation efficiency. Therefore, during the stable braking of the vehicle, adjusting the braking torque can control the rotation speed of the motor, thus affecting the amount of current during charging. The amount of recoverable energy for braking a car is shown in Formula (5).
E b , i n = ( η ( k f b ( F w + F r + ( m + 4 I / r 2 ) a x ) I d r i v e l i n e i g 2 i 0 2 r 2 a x ) + I M I G i g 2 i 0 2 r 2 a x ) s
In Formula (5), s represents the length of the entire braking distance of the car. In the BER in EVs, there are always some necessary energy consumption and energy loss, and it is generally impossible to fully achieve all energy recovery and utilization. Furthermore, the study will analyze the energy lost in this part.

2.2. Energy Recovery Analysis of Regenerative Braking Process

During the braking of EVs, there is energy consumption and even mechanical energy loss, resulting in a corresponding reduction in the storage capacity in the energy storage system. The main factors for energy reduction include friction braking, bearing mechanical loss, rotational inertia loss, transmission loss, motor loss, and energy storage loss, as shown in Figure 2.
In Figure 2, there are six main factors affecting energy reduction, among which external conditions, driving forms, and control strategies are more affected by environmental factors, while output torque limitation and battery SOC estimation during motor braking are more affected by their own factors. Therefore, the study mainly analyzes these two factors [11,12]. The power generation efficiency of the motor itself is greatly affected by the motor speed and output torque. The functional relationship between the motor speed and the motor torque is denoted in Figure 3.
In Figure 3, when the actual speed is lower than the motor speed, the motor will output the maximum torque according to a fixed torque value, and the motor is in constant torque mode. On the contrary, if the threshold is exceeded, the motor enters a constant power mode to maintain a stable output power. The mathematical relationship between the actual wheel speed and the motor speed during the braking task of an EV can be indicated by Formula (6) [13].
n = v i g i 0 / 0.377 r η T
In Formula (6), n represents the motor speed. η T represents transmission efficiency. According to the motor peak characteristic curve in Figure 3, the method of motor torque is indicated in Formula (7).
T = T e , n Φ 9550 P e / n , Φ < n
In Formula (7), Φ represents the value of motor speed. T e represents the maximum torque. P e represents maximum power, and T represents the torque in dynamic changes. Therefore, the expression for the regenerative braking force of automobiles under the peak torque limit of the generator is shown in Formula (8).
F r e = T i 0 i g η T / r , n Φ 9550 P e i 0 i g η T / n r , Φ < n
Through Formula (8), it can be observed that when an EV is subjected to rapid braking, the motor speed will correspondingly increase. However, at this point, the braking torque of the motor will become smaller, which limits the efficiency of regenerative BER. After high-voltage electricity is converted into low-voltage electricity through a power converter, these low-voltage currents are then stored in the battery, providing a mechanism for EVs to capture and utilize energy [14]. The relationship between SOC and charging current is shown in Figure 4.
In Figure 4, the relationship between the controller and the SOC value can be seen. When the SOC value is low, the motor can achieve regenerative braking. When the SOC value is high, the motor will stop regenerative braking. To solve the problems of uncertainty and complex nonlinear system processing in the kinetic energy recovery of EVs, a fuzzy control strategy will be adopted for real-time and adaptable energy management, ensuring that the regenerative braking process can realize efficient energy recovery under various working conditions and effectively protect the battery.

2.3. Energy Control Strategy for Electric Vehicles Based on Improved Fuzzy Control

The research will achieve intelligent adjustment of key parameters such as motor speed, torque, and battery SOC by designing appropriate fuzzy rule sets and membership functions. When studying the fuzzy control strategy of composite power supply for pure EVs, the total power P s u m required by the vehicle, the state variable S O C b a t of the power battery, and the state variable S O C c a p of the supercapacitor were considered as inputs to the control system. The key parameter outputted by the controller is the energy distribution coefficient K c a p of the supercapacitor, which is used to guide how the composite power supply provides power. When supplying power to cars through this system, the calculation of the above indicator parameters is shown in Formula (9) [15,16].
P s u m = P c a p + P b a t P c a p = P r e q K c a p P b a t = P r e q ( 1 K c a p )
In Formula (9), the required power of the supercapacitor is represented by P c a p , the required power of the power battery pack is represented by P b a t , and the required power of the motor is represented by P b a t . When pure EVs are in operation, the allocation ratio P s u m of supercapacitors should be fuzzified within the range of 0 to 1. To ensure the stable power output of the power battery, it is necessary to set appropriate value ranges for the charging state S O C b a t of the power battery and the charging state S O C c a p of the supercapacitor. The research sets the state value range of the power battery between 0.20 and 0.95, and considering the inherent loss of supercapacitors when outputting energy, its state value range is therefore set to 0.25 to 0.75. By introducing the allocation ratio K r e p of motor demand power, the study aims to appropriately map input variables to their corresponding fuzzy intervals, simplifying the conversion process in the calculation process. The fuzzy range of the allocation ratio K c a p between K r e p and supercapacitors is also set to the range of 0 to 1. In the above system, the fuzzification category of P s u m and K c a p are set to ( T S , S , M , B , T B ) . The categories of S O C b a t and S O C c a p are set to ( L , M , H ) . The initial input variables are used in the fuzzy control system, and these variables usually represent the state of the electric vehicle under various working conditions. Therefore, the initial input variables are battery SOC, driving demand power, and supercapacitor charge state. The language values of the input and output variables were low (0.0–0.3), medium (0.3–0.7), and high (0.7–1.0). Driving demand power (0–0.5* maximum power), medium (0.5* maximum power–0.8* maximum power), high (0.8* maximum power–maximum power); Supercapacitor SOCs are low (0.0–0.3), medium (0.3–0.7), and high (0.7–1.0). The output variables and language values are low (0.0–0.3), medium (0.3–0.7), and high (0.7–1.0). The inference rules are formulated based on the relationship between the input variables and how they affect the output variables. Specifically, if the battery SOC is high and the driving demand power is low, the supercapacitor allocation coefficient is medium. If the battery SOC is medium, and the driving demand power is medium, the supercapacitor allocation coefficient is high; If the battery SOC is low and the supercapacitor SOC is low, the supercapacitor allocation coefficient is low. If the driving demand power is high and the supercapacitor SOC is high, the supercapacitor allocation coefficient is medium; If the battery SOC is low and the driving demand power is high, the ultracapacitor allocation coefficient is low. The study sets fuzzy rules based on the above information, as shown in Figure 5.
In Figure 5, the charging status of the power battery pack and supercapacitor pack is managed through dedicated control subsets, respectively. These subsets are distinguished based on Z-shaped, Gaussian-shaped, and S-shaped membership functions, representing relatively low ( T S and L ) and moderate ( S , M , B ) and relatively high ( T B and H ) membership. However, under such a fuzzy control framework, excessive reliance on manual tuning may lead to insufficient adaptation of the system to rapidly changing environments, thereby affecting response speed and control efficiency. In the above fuzzy control, manual adjustment is mainly relied on. In the face of rapidly changing working conditions, the response time and execution efficiency of the control system are poor. Therefore, the study will use SSA to optimize fuzzy control [17,18]. There are three types of sparrows in the SSA, each with different action patterns, including “discoverers”, “followers”, and “vigilantes”. The study uses H to represent the variable of the number of sparrows, and then the position update strategy of the “discoverer” sparrow is denoted using Formula (10) [19].
x i , j t = x i , j t × exp ( 1 α × i t e r max ) , R 2 < ζ x i , j t + Q × ϕ , R 2 ζ
In Formula (10), the step of defining t as the number of iterations is studied. x i , j t is the position update variable for sparrows. The variable α is a random number in the interval [0, 1]. R 2 means the value of an alarm signal. ζ is a set safety value, while Q is a random variable that follows a normal distribution, and ϕ represents a matrix. When the value of R 2 is lower than ζ , it means that sparrows are in a safe foraging area. If R 2 is greater than ζ , it denotes that the area where the sparrow is located is threatened. As for the follower-type sparrows, updating their position depends on their respective fitness. If their adaptability is poor, it means they cannot obtain food like the discoverer and need to leave the current area in search of new sources of food. If the fitness is good, it can search for food near the optimal sparrow. The position update method of the follower type sparrow is denoted in Formula (11) [20].
x i , j t = Q × exp ( x w o r s t t x i , j t i 2 ) , 2 i > n x P t + 1 + x i , j t x P t + 1 Q ϕ , 2 i n
In Formula (11), x w o r s t t represents the worst individual region. x P t + 1 represents the best individual region. The expression for updating the position of a sparrow of the vigilante type is shown in Formula (12).
x i , j t + 1 = x b e s t t + β x i , j t x b e s t t , φ i φ b e s t x b e s t t + k x i , j t x b e s t t φ φ w o r s t + ε , φ i = φ b e s t
In Formula (12), x b e s t t represents the optimal position sought, while β is a step size control parameter. k represents a random value within the interval [−1, 1]. ε is a non-zero constant, and φ represents the individual’s fitness value. When managing the composite power supply of pure EVs, it will consider two main energy management modes: energy output and recovery. In power supply mode, supercapacitors are the preferred energy source. However, in the BER mode, if the SOC level of the supercapacitor is high, the task of BER is transferred to the battery to complete. According to the fuzzy control optimized by SSA, the fuzzification and variation trend of its variables are shown in Figure 6.
From Figure 6, in the early stages of the SSA optimization, it is necessary to conduct extensive global exploration through a large number of discoverers. As the algorithm progresses and continues to iterate, the number of discoverers should be gradually reduced in order to concentrate on completing a local and detailed search of the solution space. At the same time, the relationship between population diversity and the proportion of discoverers also needs to be considered. When population diversity is insufficient, the number of discoverers should be increased to achieve in-depth exploration of the search space. However, once the population exhibits high diversity, the share of discoverers can be correspondingly reduced to promote search centralization. In the SSA algorithm, first define the size of the sparrow population, for example, set to 50. Each sparrow in the population is divided into three categories: finder, follower, and watcher. Initially, all sparrows randomly initialize their positions in the search space. Next, the performance of each sparrow was assessed against the fitness function, which is an indicator related to the target problem. Sparrows with the highest fitness score of 70% were labeled as finders. These sparrows are responsible for searching within safe feeding areas to find a better solution. Ten percent of sparrows with fitness scores in the medium range were designated followers. The sparrows learn from the location of the finder, move closer to it, and make appropriate adjustments. Sparrows with the lowest 20 percent fitness scores were marked as watchdogs, avoiding possible predators by constantly changing positions while trying to improve their fitness.

3. Results

3.1. Simulation Experiment Parameters

The experiment used MATLAB to construct an improved fuzzy control (IFC) model based on SSA. Core i7-12700KF was selected for the CPU, NVIDIA Geforce RTX 3060 was chosen for the graphics card, Kingston 16GB was applied for the memory module, and Windows 10 was utilized for the operating system. The first task for optimizing the fuzzy control process using SSA was to configure the relevant algorithm parameters. The population size was set to 50, the dimension of the objective function was 32, and the execution of the algorithm was limited to 100 iterations. Similarly, the safety threshold value was determined to be 0.60. The top 70% of SSA rankings were considered discoverer-type samples, the top 10% of the remaining samples were considered follower-type samples, and the remaining 20% were considered vigilance-type samples. The experimental hardware configuration is as follows: central processor Core i7-12700KF; Graphics card is NVIDIA GeForce RTX 3060; Memory is Kingston 16GB; The operating system is Windows 10. The research work adopted ADVISOR 2002 software as the vehicle simulation platform and developed models based on fuzzy logic for brake force distribution and power battery SOC estimation in a Matlab environment. These two models were integrated into ADVISOR software for further simulation analysis. To assess the efficacy of the research design method, in the simulation experiment stage, the American UDDS and New York City Conditions (NYCC) were selected, and the specific parameters are denoted in Table 1.
The study considered two standardized driving conditions to evaluate performance, namely UDDS and NYCC. UDDS simulated situations with long driving times, frequent braking, and significant speed fluctuations, such as congested urban roads or smooth suburban roads. Due to the presence of many slight brakes under this operating condition, the motor braking was more active, which is beneficial for energy regeneration and recovery. However, NYCC reflected typical urban driving conditions. Although the driving time was short and the braking frequency was high, its braking intensity was generally higher than that of UDDS, and the proportion of regenerative braking and energy recovery was relatively low. Table 1 Parameter Settings have a significant impact on the processing time and feasibility of real-time applications of urban electric vehicle systems. Longer travel times and high speeds require the system to process data quickly in more complex driving conditions, ensuring real-time responses to energy recovery strategies. Frequent acceleration and deceleration increase the computational load, requiring the system to have efficient data processing capabilities and timely adjustment of energy management. In addition, the number and time of stops in urban environments increase the dynamic interaction requirements of the system, further emphasizing the importance of highly adaptable and intelligent strategies to ensure the efficiency and reliability of energy management. The relationship curve between vehicle speed and time for these two working conditions is shown in Figure 7.
The study first evaluated the performance of the SSA by solving the Schaffer function using fitness values and error indicators. At the same time, the non-dominated sorting genetic algorithm II (NSGA-II) was compared and analyzed, and the findings are denoted in Figure 8. Figure 8a represents the fitness curve findings of the two algorithms in the Schaffer function, which shows that the NSGA-II algorithm converged at the 48th iteration, The SSA began to converge in 42 iterations and solved the Schaffer function. Figure 8b represents the iteration error curve result of the Schaffer function, where the NSGA-II algorithm reached the minimum error at the 60th iteration, and the minimum error is 0.05. The SSA achieved the minimum error in the 53rd iteration, and the minimum error result was 0.03. The results indicated that the SSA used in the study could have high computational efficiency while ensuring computational precision.

3.2. Analysis of Simulation Experiment Results

To accurately evaluate the SOC and energy regeneration efficiency of batteries, an optimized fuzzy control method was proposed and compared with the standard control strategy provided by ADVISOR. Simulation testing was divided into two dimensions: first is to examine the SOC of the power battery, which can directly reflect the influence of renewable energy on the charging state of the battery; the second is to compare the negative torque value output by the motor and the load kinetic energy generated by the motor, which helps to determine the status of energy recovery. The comparison of SOC simulation results between the proposed fuzzy control strategy and the ADVISOR control strategy for the two driving conditions of UDDS and NYCC is shown in Figure 9.
Figure 9a is the comparison results of battery SOC between two control strategies under UDDS conditions. The results showed that after 1327 s of using the improved fuzzy strategy, the battery SOC result was 0.738. The ADVISOR control strategy was performed for 1327 s, and the battery SOC result was 0.720. Figure 9b is the comparison results of battery SOC between two control strategies under NYCC conditions. The results showed that after 609 s, the battery SOC of the IFC strategy was 0.965, while that of the ADVISOR control strategy was 0.943. The above results indicate that the IFC strategy may be more adaptable to dynamic changes in driving conditions and make more optimized energy management decisions. The comparison outcomes of the changes in motor output torque between the IFC strategy and the ADVISOR control strategy under two operating conditions are denoted in Figure 10.
Figure 10a shows the motor output torque variation results of two control strategies under UDDS conditions. The results showed that in the simulation time of 1327 s, the improved fuzzy strategy had more results of motor output torque below zero compared to the ADVISOR strategy. Figure 10b denotes the results of the motor output torque variation under NYCC operating conditions for two control strategies. The results showed that in the simulation time of 609 s, the positive torque generated by the improved fuzzy strategy was basically the same as that of the ADVISOR control strategy, but more negative torque was generated. The outcomes showed that improving the fuzzy control strategy can realize better energy recovery effects, better energy management, and utilization throughout the entire driving cycle, thereby helping to cut down energy consumption and improve efficiency. The final feedback energy data results of the simulation experiment are denoted in Table 2.
From the perspective of vehicle braking energy and energy recovery, the difference in braking energy between the IFC strategy and the ADVISOR strategy was not significant in the two working conditions. However, the IFC strategy recovered 906.41 kJ in the UDDS working condition, while the ADVISOR strategy only recovered 507.47 kJ. Under the NYCC condition, the IFC strategy recovered 294.45 kJ, and the ADVISOR strategy recovered 147.16 kJ. The energy recovery rate of the IFC strategy was significantly higher. Under the UDDS condition, the IFC strategy achieved a recovery rate of 49%, while the ADVISOR strategy only had a recovery rate of 27.13%. Under the NYCC condition, the recovery rate of the IFC strategy was 48.54%, and The ADVISOR strategy was only 23.04%. The IFC strategy had an effective energy recovery rate of 11.71% and 13.67% under UDDS and NYCC conditions, respectively, while the ADVISOR strategy had only 6.45% and 6.30%, respectively. The outcomes indicated that the IFC strategy can not only recover more energy but also have a higher recovery rate. This indicated that its control logic could more effectively utilize the regenerative braking system to reduce overall energy consumption and increase battery SOC. Driver acceleration and braking behavior also have a significant impact on regenerative energy recovery, so the study tested two different driving styles: aggressive driving and smooth driving. Through modeling and simulation of driving behavior, the effect of renewable energy recovery is evaluated. The results are shown in Table 3.
The results in Table 3 show that the energy recovery rate of aggressive driving (UDDS: 8.64%/NYCC: 8.70%) is significantly lower than that of smooth driving (UDDS: 15.79%/NYCC: 19.24%), mainly due to the increase in energy loss caused by high frequency of acceleration and sudden braking, which cannot achieve excellent renewable energy recovery. In steady driving mode, the accumulative total of regenerative braking energy (UDDS: 1200.20 kJ/NYCC: 420.15 kJ) is significantly higher than in the radical driving mode; this shows that the smooth driving style is more advantageous to improve the efficiency of regenerative braking.

4. Discussion

The simulation results showed that under the UDDS condition, the total energy consumption of the IFC strategy and ADVISOR control strategy was 7834.24 kJ and 7932.42 kJ, respectively. The energy recovery efficiency of the IFC strategy and ADVISOR control strategy was 49.00% and 27.13%, respectively. Under NYCC, although the total energy consumption of the two strategies was similar, the fuzzy control strategy still had an energy recovery efficiency of 48.54%. Under the influence of different working conditions, due to the high number of start-stop cycles and braking opportunities, there were more opportunities to utilize regenerative braking to recover energy in the working conditions of UDDS. Even under the NYCC working conditions, the braking intensity was high, and the absolute energy value recovered was not as good as that of the UDDS. Improving the fuzzy control strategy could still effectively recover energy. In terms of effective energy recovery, the IFC strategy was significantly superior to the ADVISOR strategy in any situation. In terms of SOC of power batteries, a higher SOC value indicated that even under long-term operation or high-intensity braking, the improvement strategy could still better maintain the energy level of the battery. The outcomes indicated that the IFC strategy can realize strong adaptability in energy management according to different working conditions and can maintain high energy recovery efficiency on both congested and high-speed urban routes. This not only improves the efficiency of battery usage and extends its lifespan but also benefits the overall economy of EVs and reduces their dependence on energy. The research method shows good adaptability and scalability in a variety of EV configurations and driving environments. First, for hybrid electric vehicle (HEV) systems, the research method can effectively manage the energy distribution between the electric motor and the internal combustion engine, ensuring higher fuel economy and energy use efficiency under different operating conditions by monitoring the vehicle status and driving conditions in real-time. In addition, SSA’s adaptive optimization features enable the strategy to adapt to different battery configurations, adjusting in real-time based on battery performance and charge-discharge characteristics. In the non-urban driving environment, the fuzzy control—SSA strategy also has good scalability. Since non-urban environments tend to involve more stable speeds and less frequent braking, the system can take advantage of fuzzy control to respond quickly to fewer driving state changes while continuing to adjust dynamically with higher energy efficiency.

5. Conclusions

With the promotion of EVs in the global market, improving energy recovery efficiency and battery life has become a key research direction in the EV industry. Research optimized the energy recovery mechanism of EVs using fuzzy control theory and SSA. The effectiveness of the IFC strategy designed under two representative working conditions of UDDS and NYCC was compared with the traditional ADVISOR control strategy through simulation experiments. Through simulation experiments, it was proved that the IFC strategy studied significantly improved the energy recovery rate and battery SOC maintenance efficiency of EVs in actual driving conditions. The IFC strategy was superior to the ADVISOR control strategy in terms of quality and efficiency of energy recovery. A new energy management strategy is proposed by combining fuzzy control theory with a sparrow search algorithm. This combination highlights an adaptive and intelligent decision-making mechanism that can effectively cope with the complexity and nonlinear characteristics of different driving conditions. A new research direction on adaptability and real-time performance in complex urban environments is proposed. Although simulation outcomes indicated the effectiveness of the improved strategy, the research was validated in actual vehicle testing. Further research is needed to assess its adaptability to different EV models, driver behavior habits, and road conditions. Future research directions should utilize this control strategy for practical application verification and refine the fuzzy control logic to adapt to a wider range of practical application scenarios.

Author Contributions

Conceptualization, E.-H.Z.; methodology, E.-H.Z.; writing—original draft, E.-H.Z.; data curation, M.-H.S.; software, M.-H.S.; visualization, J.-C.H.; investigation, J.-C.H.; writing—review and editing, H.-T.L. All authors have read and agreed to the published version of the manuscript.

Funding

This research received no external funding.

Data Availability Statement

The datasets generated or analyzed during this study are available from the corresponding author upon reasonable request.

Conflicts of Interest

The authors declare no potential conflict of interest.

References

  1. Saiteja, P.; Ashok, B.; Wagh, A.S.; Farrag, M.E. Critical review on optimal regenerative braking control system architecture, calibration parameters and development challenges for EVs. Int. J. Energy Res. 2022, 46, 20146–20179. [Google Scholar] [CrossRef]
  2. Karabacak, Y.; Yaşar, A.; Sarıtaş, İ. Regenerative braking control of brushless DC motors with type 2 fuzzy logic controller. Int. J. Fuzzy Syst. 2023, 25, 2722–2732. [Google Scholar] [CrossRef]
  3. Doss, M.A.N.; Anuja, T.A.; Eswar, K.S.; Raja, M.V.; Ramasubramanian, V.S. Regenerative braking of BLDC motor applied to electric vehicles. Int. J. Veh. Struct. Syst. 2023, 15, 424–427. [Google Scholar] [CrossRef]
  4. Zhang, Q.; Zhang, Y.; Huang, K.; Tasiu, I.A.; Lu, B.; Meng, X.; Liu, Z.; Sun, W. Modeling of regenerative braking energy for electric multiple units passing long downhill section. IEEE Trans. Transp. Electrif. 2022, 8, 3742–3758. [Google Scholar] [CrossRef]
  5. Wang, X.; Wang, R.; Shu, G.Q.; Tian, H.; Zhang, X.A. Energy management strategy for hybrid electric vehicle integrated with waste heat recovery system based on deep reinforcement learning. Sci. China Technol. Sci. 2022, 65, 713–725. [Google Scholar] [CrossRef]
  6. Mei, P.; Karimi, H.R.; Yang, S.; Xu, B.; Huang, C. An adaptive fuzzy sliding-mode control for regenerative braking system of electric vehicles. Int. J. Adapt. Control. Signal Process. 2022, 36, 391–410. [Google Scholar] [CrossRef]
  7. Abdelaal, A.S.; Mukhopadhyay, S.; Rehman, H. Battery energy management techniques for an electric vehicle traction system. IEEE Access 2022, 10, 84015–84037. [Google Scholar] [CrossRef]
  8. Zhang, H.; Li, S.; Chen, F.; Pan, X.F.; Feng, H.X.; Sun, Y.F. Battery voltage fault diagnosis for electric vehicles considering driving condition variation. IET Intell. Transp. Syst. 2024, 18, 574–590. [Google Scholar] [CrossRef]
  9. Pardhi, S.; Deshmukh, A.; Ajrouche, H. Modelling of detailed vehicle dynamics and quantitative impact of electric motor placement on regenerative braking. Int. J. Veh. Perform. 2023, 9, 16–40. [Google Scholar] [CrossRef]
  10. Suyanto; Darwito, P.A.; Wahyuono, R.A.; Arifin, M.S.; Sudarmanta, B. Design of regenerative braking system for electric motorcycle based on supercapacitor with fuzzy PID. Int. J. Automot. Technol. 2023, 24, 187–194. [Google Scholar] [CrossRef]
  11. Zhang, Y.; Wang, W.; Xiang, C.; Yang, C.; Peng, H.; Wei, C. A swarm intelligence-based predictive regenerative braking control strategy for hybrid electric vehicle. Veh. Syst. Dyn. 2022, 60, 973–997. [Google Scholar] [CrossRef]
  12. Teoh, J.Y.; Yahya JA, F. Switching scheme for regenerative braking mode for BLDC motor driver. Evol. Electr. Electron. Eng. 2022, 3, 801–807. [Google Scholar]
  13. Luo, N.; Yu, H.; You, Z.; Li, Y.; Zhou, T.; Jiao, Y.; Han, N.; Liu, C.; Jiang, Z.; Qiao, S. Fuzzy logic and neural network-based risk assessment model for import and export enterprises: A review. J. Data Sci. Intell. Syst. 2023, 1, 2–11. [Google Scholar] [CrossRef]
  14. Hao, T.P.; Ramdan, M.I.; Idris, K.A.; Rashid MS, A.; Patilah MH, H.; Ismail, M.A.; Rahim IF, A. Performance on regenerative braking system on a through-the-road hydraulic hybrid vehicle. J. Adv. Res. Fluid Mech. Therm. Sci. 2022, 91, 62–71. [Google Scholar]
  15. Pozna, C.; Precup, R.E.; Horváth, E.; Petriu, E.M. Hybrid particle filter–particle swarm optimization algorithm and application to fuzzy controlled servo systems. IEEE Trans. Fuzzy Syst. 2022, 30, 4286–4297. [Google Scholar] [CrossRef]
  16. Kasruddin Nasir, A.N.; Ahmad, M.A.; Tokhi, M.O. Hybrid spiral-bacterial foraging algorithm for a fuzzy control design of a flexible manipulator. J. Low Freq. Noise Vib. Act. Control. 2022, 41, 340–358. [Google Scholar] [CrossRef]
  17. Asadi, H.; Bellmann, T.; Mohamed, S.; Lim, C.; Khosravi, A.; Nahavandi, S. Adaptive motion cueing algorithm using optimized fuzzy control system for motion simulators. IEEE Trans. Intell. Veh. 2022, 8, 390–403. [Google Scholar] [CrossRef]
  18. Gharehchopogh, F.S.; Namazi, M.; Ebrahimi, L.; Abdollahzadeh, B. Advances in sparrow search algorithm: A comprehensive survey. Arch. Comput. Methods Eng. 2023, 30, 427–455. [Google Scholar] [CrossRef] [PubMed]
  19. Awadallah, M.A.; Al-Betar, M.A.; Doush, I.A.; Makhadmeh, S.N.; Naymat, G.A. Recent versions and applications of sparrow search algorithm. Arch. Comput. Methods Eng. 2023, 30, 2831–2858. [Google Scholar] [CrossRef] [PubMed]
  20. Yue, Y.; Cao, L.; Lu, D.; Hu, Z.; Xu, M.; Wang, S.; Li, B.; Ding, H. Review and empirical analysis of sparrow search algorithm. Artif. Intell. Rev. 2023, 56, 10867–10919. [Google Scholar] [CrossRef]
Figure 1. Circuit diagram of braking energy recovery.
Processes 12 02919 g001
Figure 2. Total braking energy reduction factors.
Processes 12 02919 g002
Figure 3. Functional relationship between motor speed and motor torque.
Processes 12 02919 g003
Figure 4. Relationship between SOC and charging current.
Processes 12 02919 g004
Figure 5. Fuzzy control strategy rule design.
Processes 12 02919 g005
Figure 6. Blurring and changing trend of variables.
Processes 12 02919 g006
Figure 7. Variation of vehicle speed with time under two working conditions.
Processes 12 02919 g007
Figure 8. Fitness curve and iterative error curve of Schaffer function.
Processes 12 02919 g008
Figure 9. SOC comparison results of batteries under different working conditions.
Processes 12 02919 g009
Figure 10. Comparison results of motor output torque changes under different working conditions.
Processes 12 02919 g010
Table 1. Relevant parameters under the two working conditions of UDDS and NYCC.
Main ParameterUDDSNYCCMain ParameterUDDSNYCC
Run time (s)1327609Mileage (km)12.102.01
Maximum speed (km)92.645.69Average speed (km)32.6228.08
Maximum acceleration (m/s2)1.592.79Maximum deceleration (m/s2)1.592.75
Number of stops1617Parking time (s)271221
Table 2. Data results of feedback energy.
Main ParameterIFCADVISOR Strategy
UDDSNYCCUDDSNYCC
Total energy consumption (kJ)7834.242198.367932.422196.44
Vehicle braking energy (kJ)1929.46594.151929.17604.75
Energy recovery (kJ)906.41294.45507.47147.16
Braking energy recovery rate (%)49.0048.5427.1323.04
Effective energy recovery (%)11.7113.676.456.30
Table 3. Effects of driver acceleration and braking behavior on regenerative energy recovery.
Driving StyleTotal Energy
Consumption (kJ)
Regenerative Braking Energy (kJ)Energy Recovery Rate (%)
Aggressive Driving (UDDS)8123.4700.58.64
Aggressive Driving (NYCC)2300.5200.38.72
Smooth Driving (UDDS)7672.71200.215.79
Smooth Driving (NYCC)2184.4420.1519.24
Disclaimer/Publisher’s Note: The statements, opinions and data contained in all publications are solely those of the individual author(s) and contributor(s) and not of MDPI and/or the editor(s). MDPI and/or the editor(s) disclaim responsibility for any injury to people or property resulting from any ideas, methods, instructions or products referred to in the content.

