Article

Experimental and Kinetic Study of Biochar in N-Absorption Reaction of Chemical Looping Ammonia Generation

School of Metallurgy, Northeastern University, No. 11, Lane 3, WenHua Road, HePing District, Shenyang 110819, China
*
Author to whom correspondence should be addressed.
Processes 2024, 12(12), 2870; https://doi.org/10.3390/pr12122870
Submission received: 30 October 2024 / Revised: 9 December 2024 / Accepted: 13 December 2024 / Published: 15 December 2024
(This article belongs to the Special Issue Green Metallurgical Process and Technology)

Abstract

:
The study conducted isothermal tests for biochar-based N-absorption reaction in Chemical Looping Ammonia Generation to investigate the factors affecting biochar conversion, the kinetic model, and the reaction mechanism. The results show that the N2 gas flows had little effect on biochar conversion. Raising the reaction temperature and the molar ratio of α-Al2O3 to C enhanced the conversion of biochar. When the N2 flow rate was set to 200 mL/min, the reaction temperature to 1600 °C, and the α-Al2O3/C molar ratio to 3:3, the biochar conversion reached its peak at 95.45%. After evaluating several kinetic models, the D1 diffusion model was found to provide the closest match to the biochar conversion. The activation energy decreased from 241.91 kJ/mol at a 1:3 α-Al2O3/C molar ratio to 146.77 kJ/mol at a 3:3 ratio with an increasing α-Al2O3/C molar ratio. The biochar’s high specific surface area and abundant pore structure facilitated a rapid reaction between carbon and oxygen on the carbon surface. Additionally, the diffusion of oxygen produced during the decomposition of α-Al2O3 became the limiting factor in the N-absorption reaction.

1. Introduction

Produced annually in quantities of 176 million tons, ammonia is one of the key synthetic chemicals in contemporary industry [1]. It is widely used in fertilizer synthesis and the chemical, food, and pharmaceutical industries [2,3]. Ammonia is an efficient hydrogen carrier, with 17.6% hydrogen content, a volumetric hydrogen-carrying efficiency 1.5 times greater than hydrogen, easy liquefaction at −33 °C, and ease of transport [4,5]. Meanwhile, ammonia is also a potential clean fuel due to the non-polluting production of N2 and H2O during complete combustion, with no carbon emissions [6,7]. It is foreseeable that the demand for NH3 will continue to increase due to increasing population, greater industrial demand, and new uses as an energy carrier.
The Haber–Bosch process produces 90% ammonia from high-purity N2 and H2 [8]. The stability of the N≡N bond in N2 leads to challenging reaction conditions, with temperatures of 350~550 °C and pressures of 10~30 MPa required, along with an Fe-based catalyst [9]. Furthermore, the Haber–Bosch process utilizes hydrogen sourced from fossil fuels and requires stringent reaction conditions to synthesize ammonia. These factors contribute to several major drawbacks, including significant carbon dioxide emissions (ranging between 1.9 and 16.7 tons of CO2 per ton of NH3 produced), considerable energy usage (28 to 166 gigajoules per ton of NH3, which represents approximately 1–2% of the global annual energy output), and relatively low reaction efficiency (10–15%) [9,10]. Therefore, a new ammonia preparation method is needed to cope with the greater demand in the future from the view of environmental protection and the economy.
Galvez et al. introduced the Chemical Looping Ammonia Generation (CLAG) method, which employs aluminum-based nitrogen carriers. This process uses carbon and water as primary inputs and incorporates Al2O3/AlN as nitrogen carriers to produce ammonia through alternating N-absorption (R1) and N-desorption (R2) reactions [11]. It has advantages in terms of environmental protection and economy: it reacts at atmospheric pressure, does not require a catalyst, gets rid of the relatively expensive H2 as a raw material, and has good recyclability and zero CO2 emissions, thus attracting much attention [12,13,14].
N-absorption reaction:
Al 2 O 3 + 3 C + N 2 2 AlN + 3 CO             Δ H 0 25 = 708 . 1   kJ   mol 1
N-desorption reaction:
2 AlN + 3 H 2 O Al 2 O 3 + 2 NH 3             Δ H 0 25 = 274 . 1   kJ   mol 1
As a consumable in the CLAG, carbon is completely converted to CO in the N-absorption reaction and can be collected and utilized, e.g., to produce methanol [14]. Thus, the added value of carbon is increased. The reactivity and reaction mechanisms of different carbon sources in the N-absorption reaction are variable. Forslund et al. investigated the mechanism of the N-absorption reaction with carbon black and concluded that Al2O3 was first converted to Al2O(g) and then reacted with N2 to form AlN [15,16]. In contrast, Lefort et al. indicated that Al2O3 undergoes an initial conversion into Al(g) and O2. Subsequently, the produced O2 reacts with C to generate CO, while Al(g) engages with N2 to produce AlN, as experimentally proved [17]. Calvez et al. investigated carbon black and petcoke comparatively [18]. They fitted the reaction curves with diffusion and shrinking core models and concluded with carbon black as a diffusion model and petcoke as a shrinking core model. Zhang et al. investigated the carbon black and graphite reactivity and believed that the poor reactivity of graphite was due to the low degree of disorder [19]. Feng et al. utilized coal coke through pyrolysis in the CLAG process and evaluated how different pyrolysis conditions influence its reactivity [20]. Since the presence of SiO2 within coal hinders the N-absorption reaction [21], it is necessary to use hydrogen fluoride and hydrochloric acid to get rid of SiO2 in the process of coke preparation from coal.
Biomass has much lower SiO2 than coal [22,23] and can be used in biochar preparation without removing SiO2, making it a promising carbon source for applications in CLAG. Furthermore, biomass contains less sulfur than coal and offers benefits such as widespread availability, renewability, and environmental friendliness compared to traditional fossil fuel carbon sources [24,25]. Produced through slow pyrolysis, biochar possesses a more extensive specific surface area and a more developed pore structure compared to petcoke and coal coke, resulting in enhanced reactivity [26,27]. In our previous research, we successfully pyrolyzed biomass into biochar for use in the N-absorption reaction of CLAG. We determined the pyrolysis parameters for producing highly reactive biochar: under a CO2 atmosphere, with a heating rate of 10 °C/min, a pyrolysis temperature of 700 °C, and a resident time of 30 min [28]. However, when evaluating the reactivity of biochar, the reaction conditions for the N-absorption reaction were fixed. To optimize the reaction conditions for N-absorption reaction, it is essential to investigate how these conditions affect the conversion rate of biochar. Additionally, to quantitatively describe the reaction process of biochar-based N-absorption reaction, kinetic studies are also required. However, comprehensive studies in this area remain limited.
The primary goal of this research was to examine the kinetics of biochar in CLAG’s N-absorption reaction. Because carbon acts as a consumable material, any portion that remains unreacted during N-absorption must undergo a carbon removal step (via water vapor) before proceeding to the N-desorption reaction [18,29], carbon conversion has to be increased from the economic point of view. Furthermore, appropriately enhancing the conversion rate of carbon can boost the amount of nitrogen carrier per unit of carbon processed, thereby increasing overall efficiency [30]. Therefore, the effects of the gas flow rate, reaction temperature, and Al2O3/C molar ratio on carbon conversion were first investigated. Then, the kinetic model of the biomass was established. Finally, the mechanism of N-absorption reaction based on biochar was investigated, which provided theoretical guidance for practical production.

2. Experiments

2.1. Feedstock

As α-Al2O3 is formed during the N-desorption reaction, alumina remains in the CLAG cycle in its α-phase [12,31]. The nitrogen carrier was chosen to be α-Al2O3 (99.9% purity, with a particle size of 10 μm from Ningbo Beigaer New Materials Corporation (Ningbo, Zhejiang, China)) in this study. The biomass was selected as birch sawdust, which is common in Northeast China. Birch sawdust underwent pyrolysis in a CO2 atmosphere, heating at 10 °C/min to reach 700 °C, with a residence time of 30 min [28]. The biochar was processed by grinding in a mortar and subsequently sieved to obtain particles no larger than 75 μm. Table 1 shows the ultimate analysis (Optima 4300DV, Perkin Elmer Corporation (Waltham, MA, USA)) and pore structure (TriStar II 3020, Micromeritics Instrument Corporation (Norcross, GA, USA)) of the biochar. According to Table 1, the biochar contained a significant carbon level and a well-developed pore structure.

2.2. Experiment Process

Figure 1 illustrates the experimental setup for the biochar-based N-absorption reaction. A constant amount of biochar (0.72 g) was maintained, while the quantity of α-Al2O3 was adjusted to achieve varying α-Al2O3/C molar ratios. To ensure uniformity, biochar and α-Al2O3 were thoroughly pulverized using a mortar. The homogenized mixture was then transferred to a graphite crucible and placed inside a tube furnace for heating. During the initial heating phase, Ar gas was introduced at a 200 mL/min flow rate. Once the desired temperature was attained, the gas supply was switched to N2 to initiate the reaction. Upon completion, the atmosphere was reverted to Ar, and the temperature was gradually decreased. The entire process was conducted for a duration of three hours.
Biochar conversion was utilized to quantify the extent of the reaction. The biochar conversion rate was calculated from the amount of CO produced as follows:
X c = 12 × φ co Q d t 22.4 × 1000 × m c × 100 %
where Q stands for the volume flow rate of the gas, ml/min; φ C O refers to the CO volume fraction in the produced gas, measured by a gas analyzer, %; and mc is the mass of biochar introduced before the reaction, g.

2.3. Kinetic Calculation

Table 2 shows the kinetic models used for the N-absorption reaction based on biochar. These models provide insights into the mechanisms governing the reaction process [32,33]. The nucleus production model describes reactions where new reaction sites (nuclei) form and grow on the surface of reactants, often applicable to solid-state transformations. The shrinking core model assumes a reaction progresses inward from the outer surface of a solid particle, with an unreacted core shrinking over time, frequently used in heterogeneous reactions. In the dimensional diffusion model, the reaction rate is dictated by the diffusion process of reactants or products within the system, which is relevant when reactants must traverse a medium (e.g., gas or liquid phase) to reach the reaction interface. The phase boundary reaction model assumes that the reaction occurs at the interface between two phases, with the rate determined by the movement or transformation of this boundary. These models describe different mechanisms governing solid-state or gas–solid reactions.
The biochar reaction rate was characterized by the reaction rate coefficient and the differential form of the mechanism function (seen in Equation (3)). Then, through Equation (3), it can be deduced that the mechanism function integral form was proportional to time at a certain temperature. Thus, in comparing the model fits in Table 2, the kinetic model for biochar’s N-absorption reaction can be identified.
x = X c 100
r = d x d t = k ( T ) f ( x )
F ( x ) = k ( T ) t
where x denotes the proportion of biochar that has been consumed, r is the reaction rate, t represents the time during the reaction, k(T) is the reaction rate constant, T refers to the temperature of the reaction, and f(x) and F(x) correspond to the differential and integral forms of the mechanism, respectively.
The relationship between the activation energy and the reaction rate coefficient was determined with Arrhenius’ equation (Equation (5)). ln(k(T)) and 1/T were linearly related, so the frequency factor and activation energy can be calculated by linear regression analysis.
ln ( k ( T ) ) = E a R T + ln ( A )
where A is the frequency factor, R is the universal molar gas constant, and Ea is the activation energy.

3. Results and Discussion

3.1. Aspects Influencing Biochar Conversion Efficiency

3.1.1. Gas Flow Rate

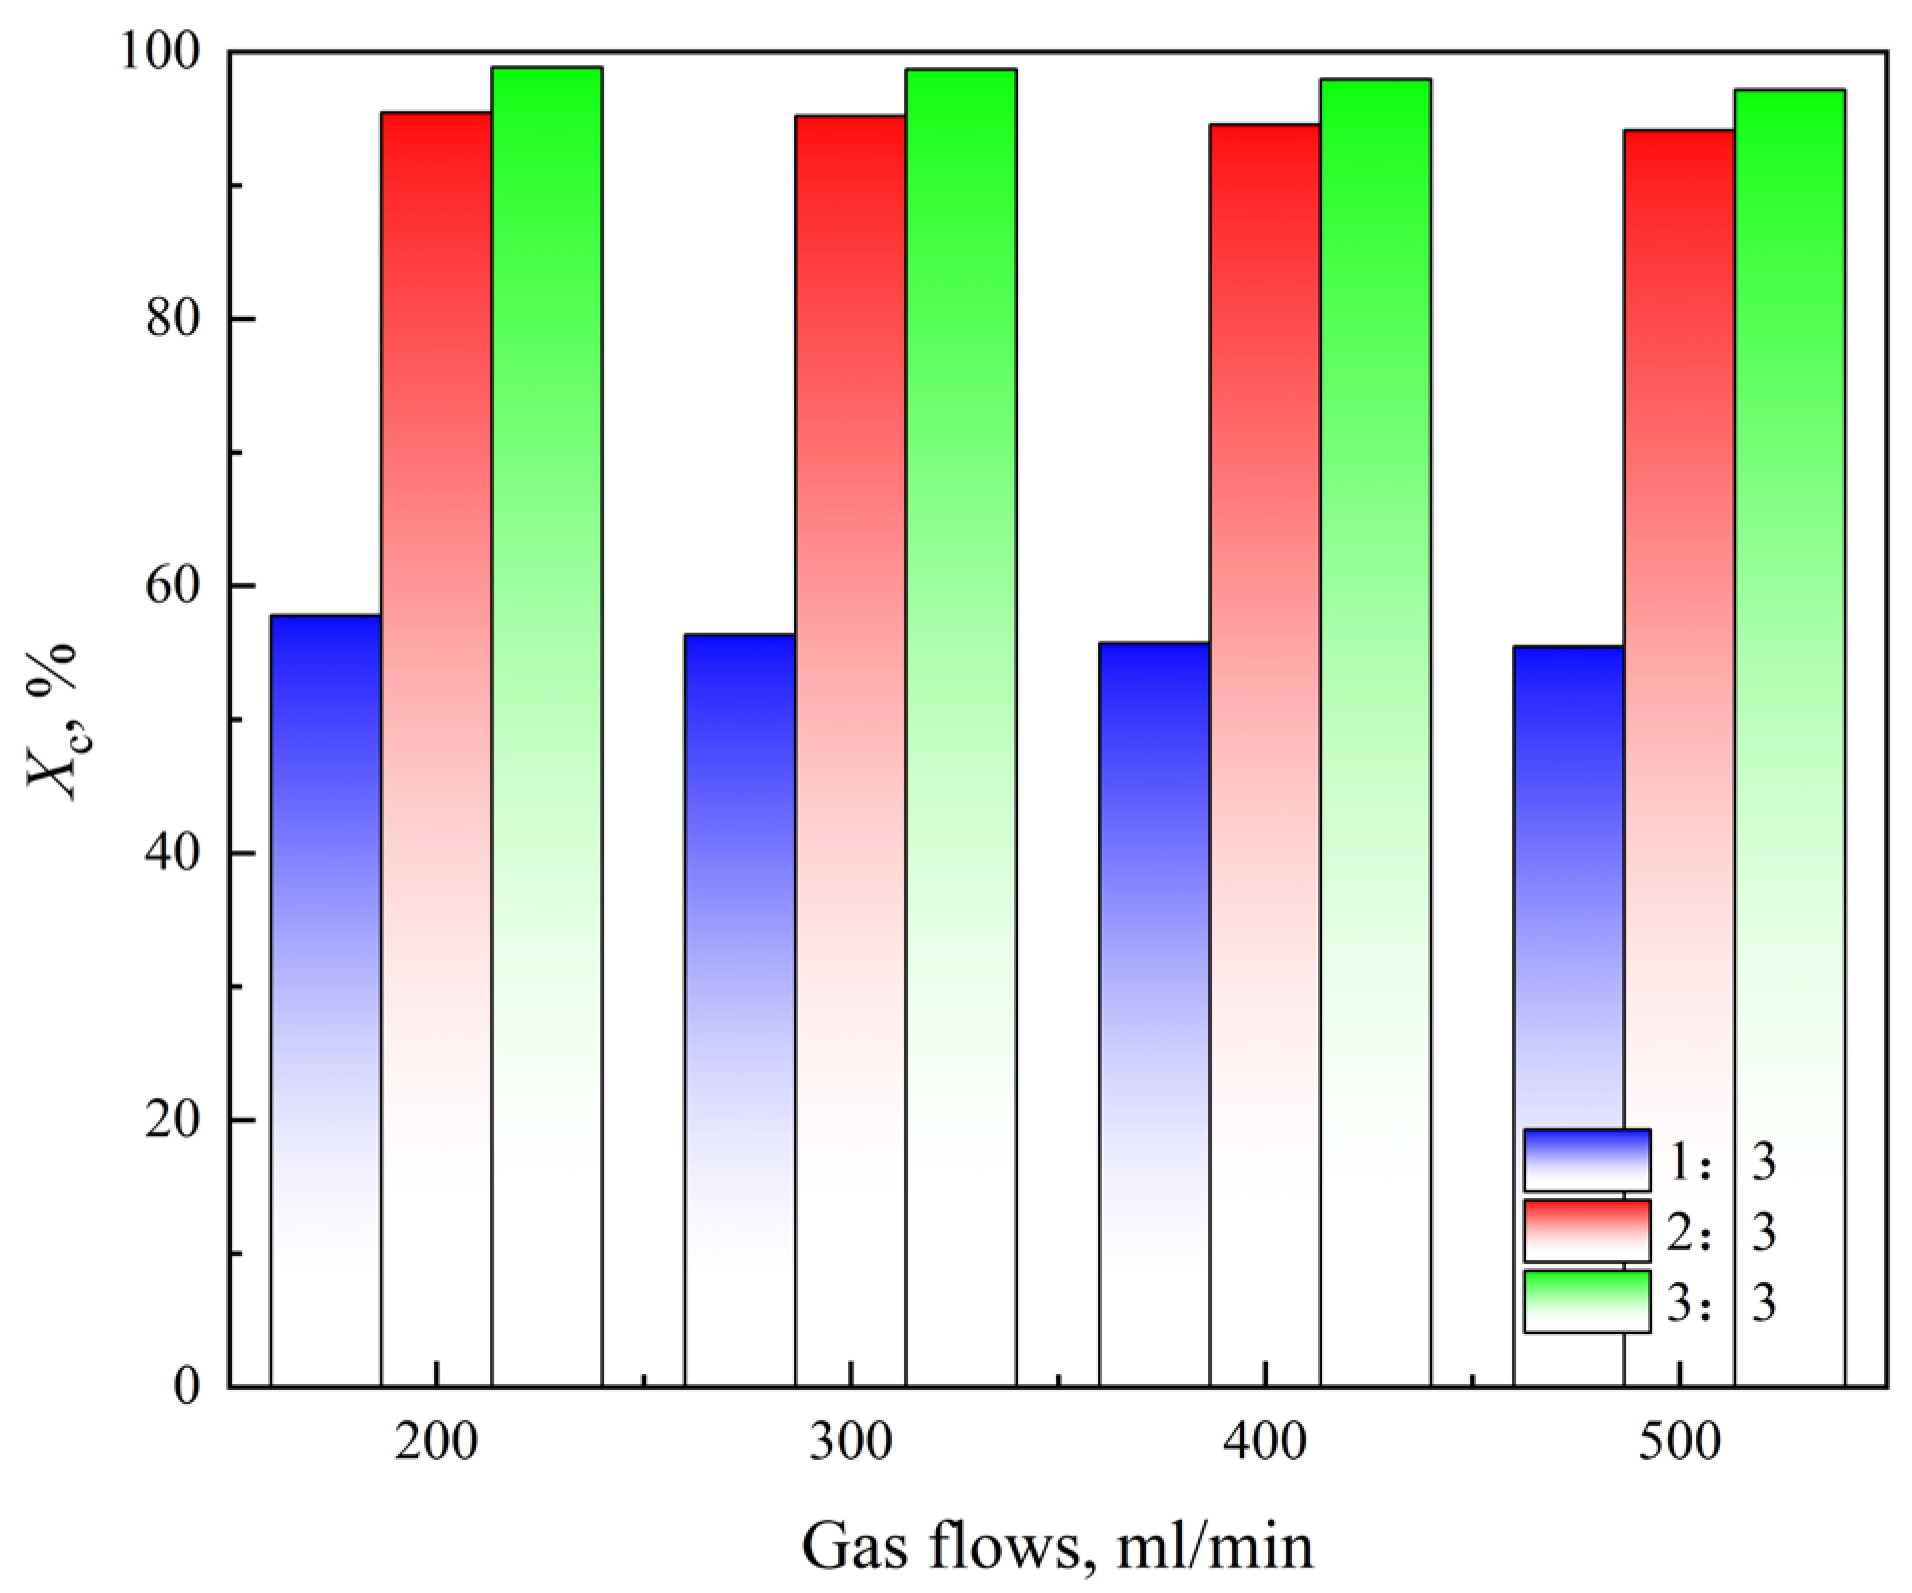
Figure 2 illustrates how gas flow rates influence biochar conversion at various α-Al2O3/C molar ratios. Regardless of the α-Al2O3/C molar ratios, the influence of the gas flow rate on biochar conversion followed the same trend. As the flow rate of N2 gas increased, the conversion of biochar declined. This is because the time that gas molecules continued interacting with the solid reactants was shortened at higher flow rates, leading to a reduced reaction degree [15]. When the N2 gas flow rose from 200 to 500 mL/min, the reduction in biochar conversion was minimal, peaking at 2.34%. This suggests that the influence of N2 flow on biochar conversion was insignificant. In the kinetic study in the next section, the gas flow rate selected was 200 mL/min.

3.1.2. Reaction Temperature

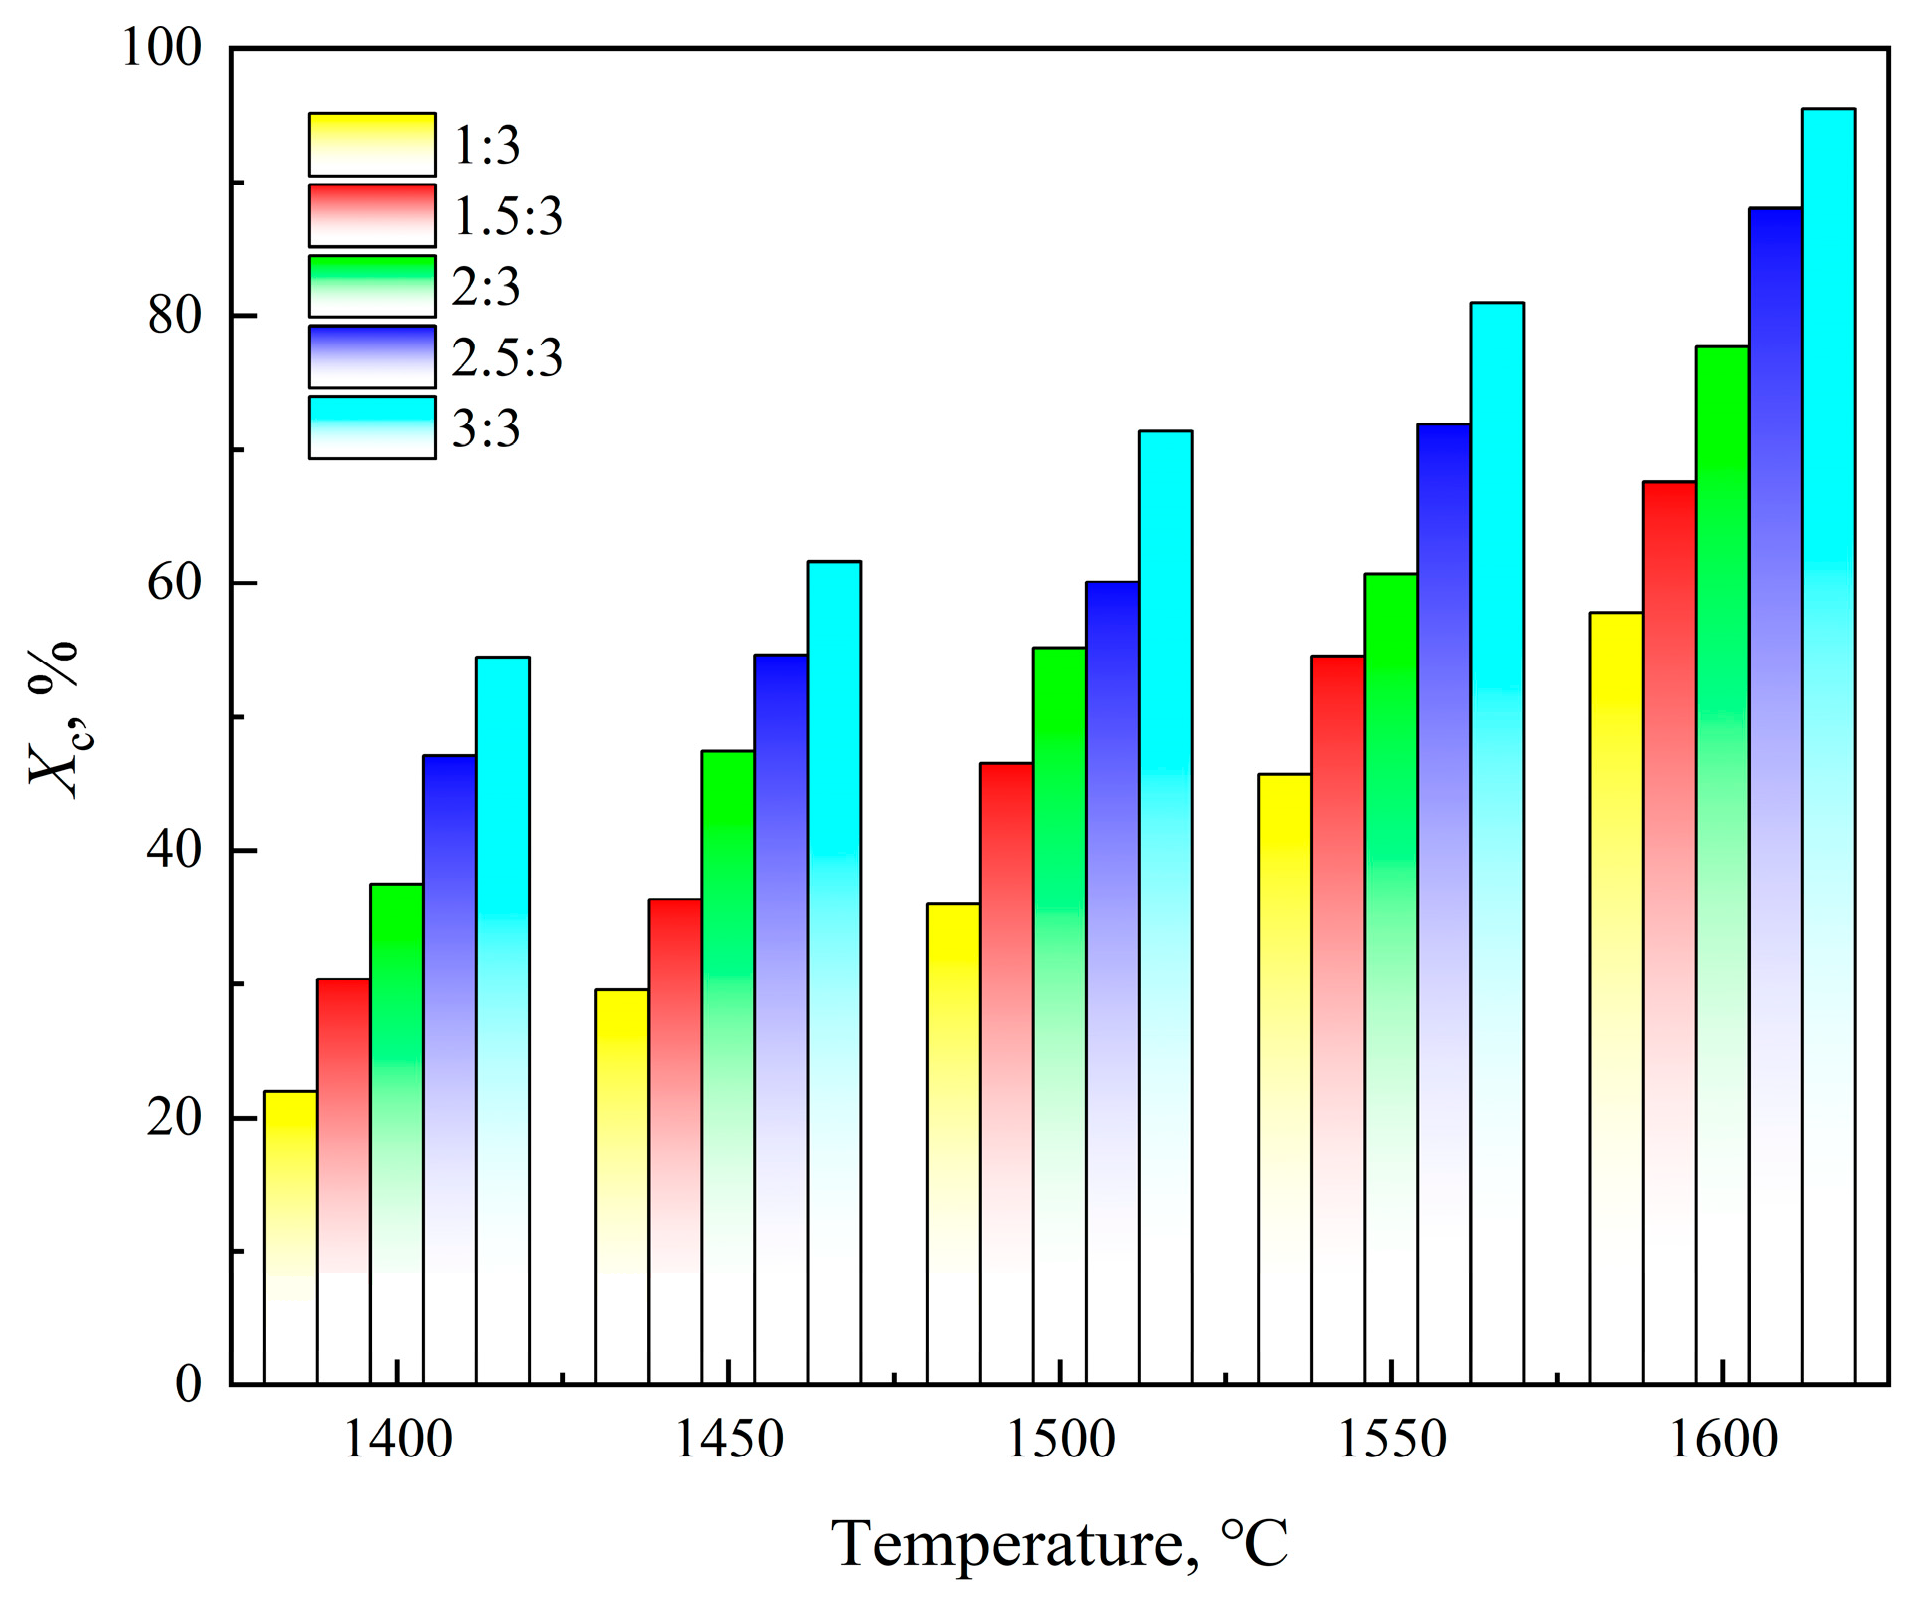
Figure 3 illustrates how reaction temperature influences biochar conversion across various α-Al2O3/C molar ratios. At varying α-Al2O3/C molar ratios, biochar conversion rose as the temperature increased. This occurred because the N-absorption reaction (R1) was an endothermic process (ΔH > 0), so increasing temperature was favorable for the reaction. The biochar conversion reached 95.45% at a reaction temperature of 1600 °C and an α-Al2O3/C molar ratio of 3:3.

3.1.3. α-Al2O3/C Molar Ratio

Figure 4 illustrates how the α-Al2O3/C molar ratio impacts biochar conversion under varying reaction temperatures. When the α-Al2O3/C molar ratio was adjusted from 1:3 to 3:3, the biochar conversion rate increased, indicating that a higher ratio effectively enhances the conversion process. Additionally, α-Al2O3 addition supported the N-absorption reaction. Figure 5 illustrates how the α-Al2O3/C molar ratio influences α-Al2O3 conversion under various reaction temperatures. As the α-Al2O3/C molar ratio increased, the α-Al2O3 conversion decreased and leveled off. Furthermore, as the α-Al2O3/C molar ratio shifted from 1:3 to 3:3, the reduction in α-Al2O3 conversion became more pronounced with higher reaction temperatures. As the α-Al2O3/C molar ratio increased, biochar conversion increased, while α-Al2O3 conversion decreased, making the impact of this ratio on N-absorption reaction efficiency unclear. To assess the efficiency of biochar in CLAG, the turnover number (TON) was defined [30]. TON represents the ratio of moles of Al atoms converted to moles of C atoms consumed during the cycle, as shown below:
T O N = Δ n Al Δ n C
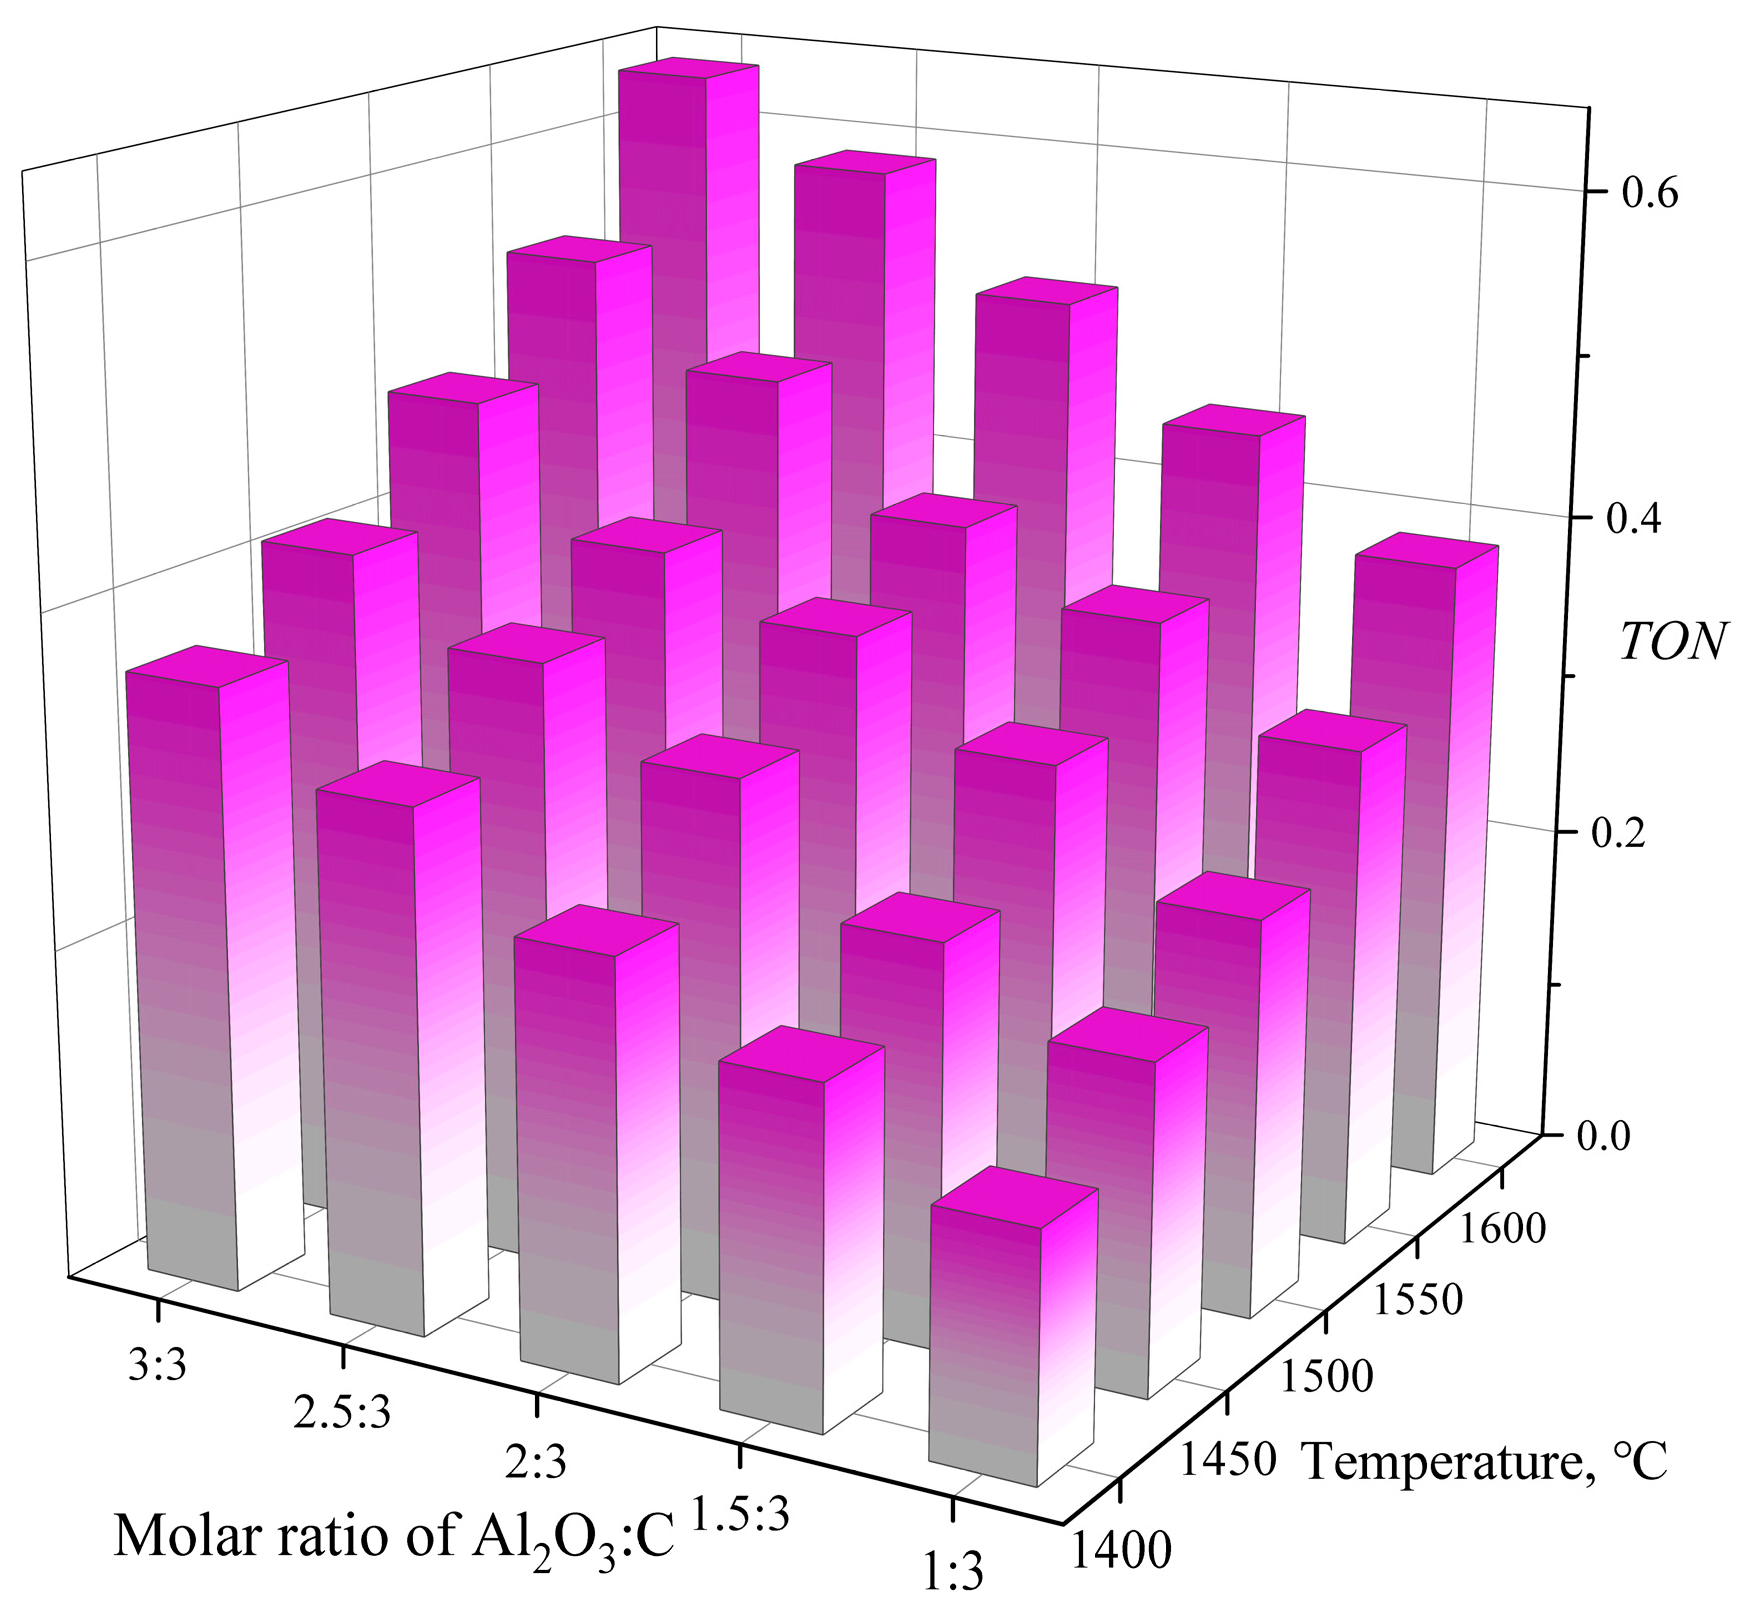
where ΔnC corresponds to the moles of C atoms involved in the CLAG cycle (the initial moles of C in the N-absorption reaction); ΔnAl represents the moles of Al atoms transformed from Al2O3 to AlN, respectively. Figure 6 illustrates how the α-Al2O3/C molar ratio influences TON at various reaction temperatures. As the Al2O3/C molar ratio increased, TON also rose, indicating that optimizing the ratio enhances biochar utilization efficiency in CLAG.

3.2. Kinetic Modeling of Biochar-Based N-Absorption Reaction

3.2.1. Kinetic Model of Biochar-Based N-Absorption Reaction

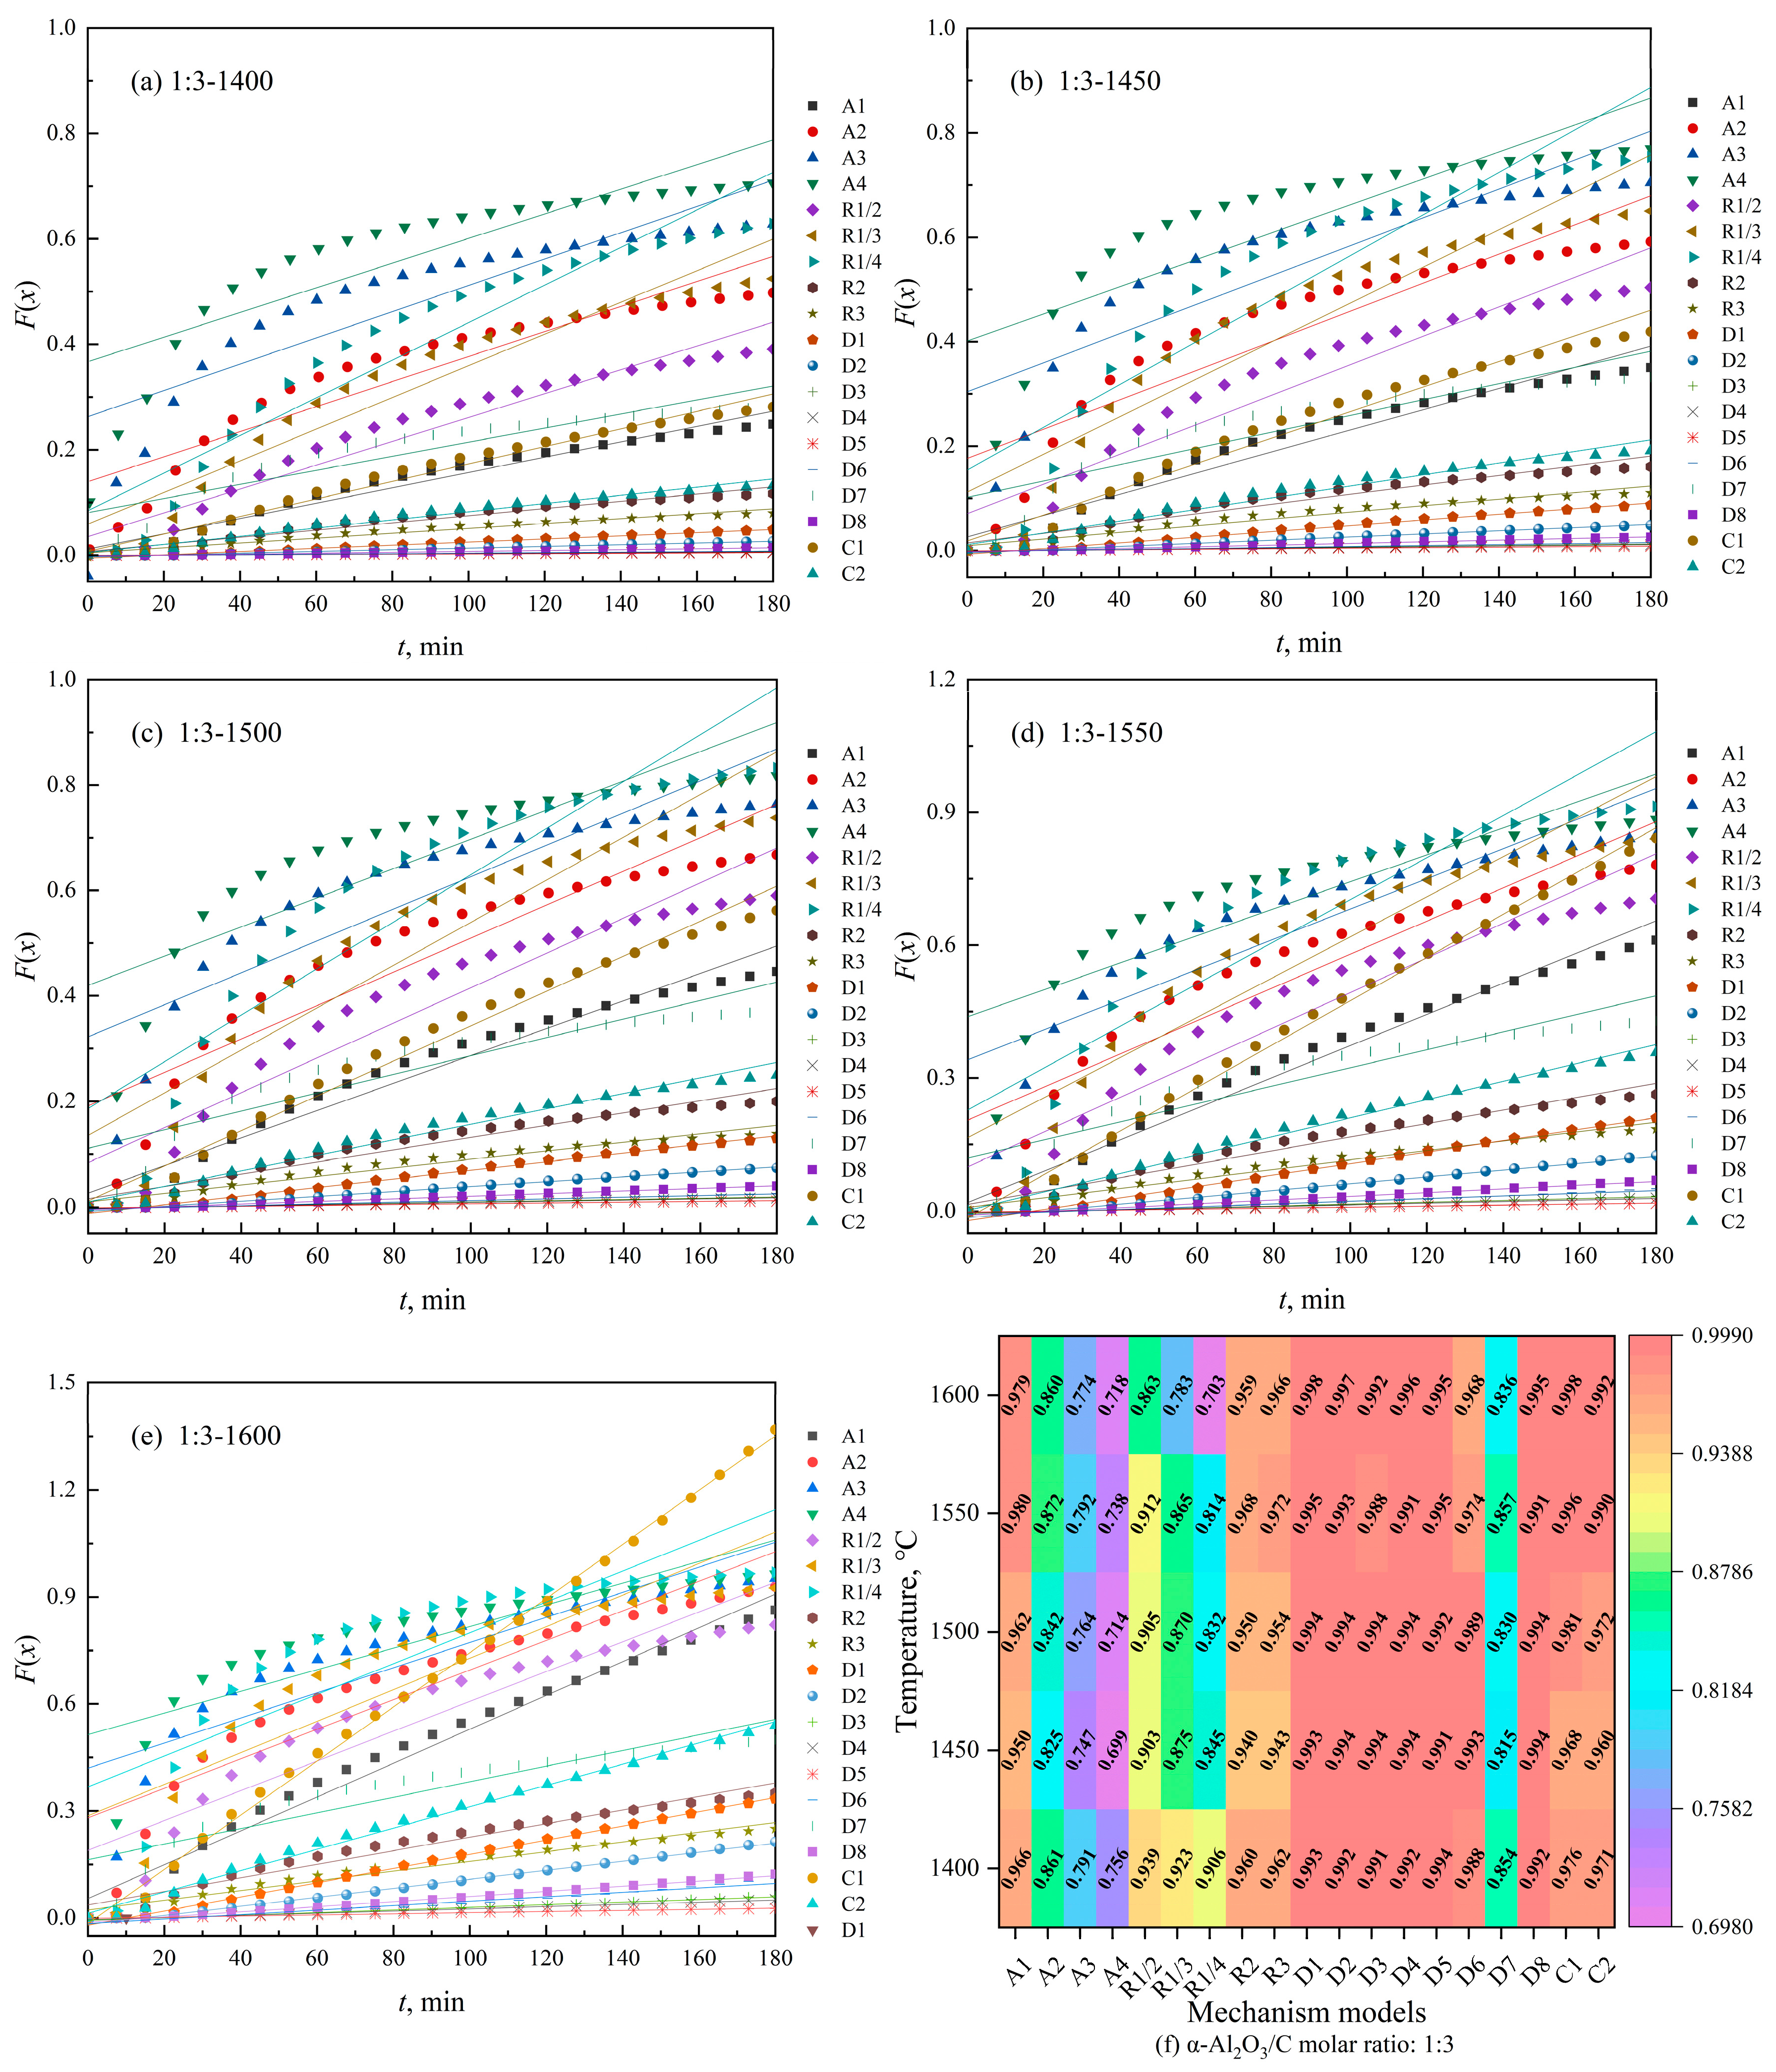
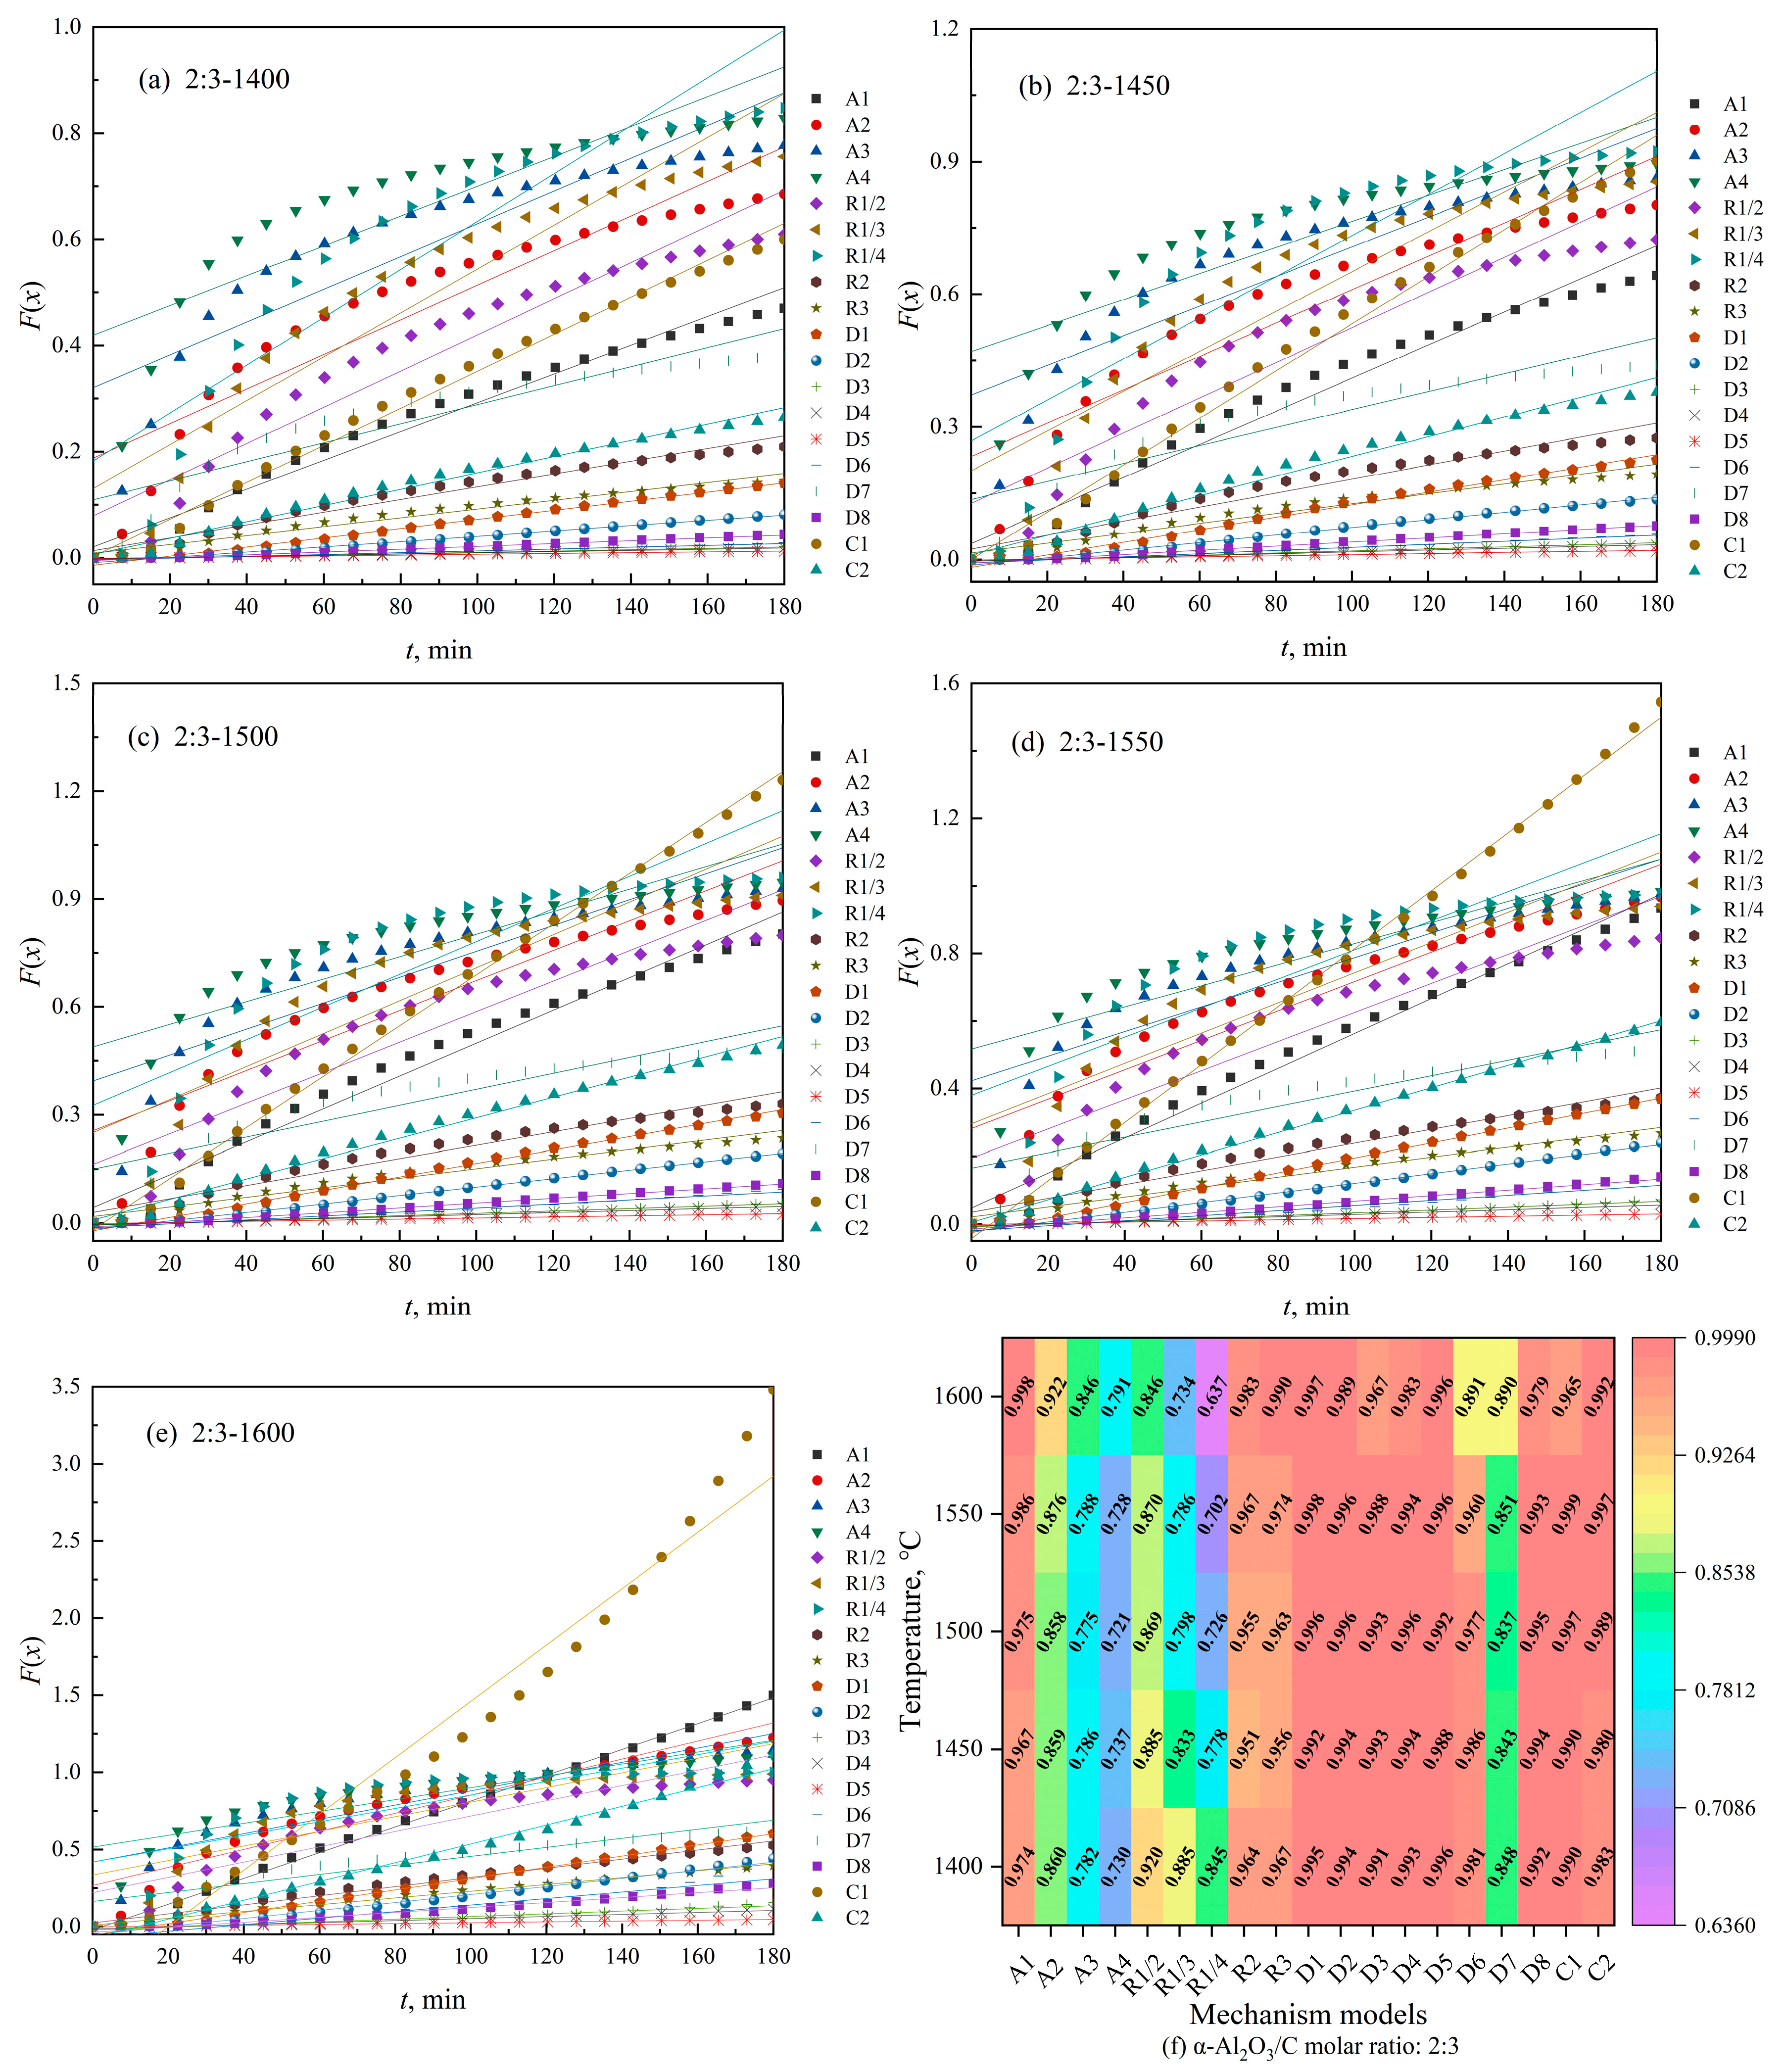
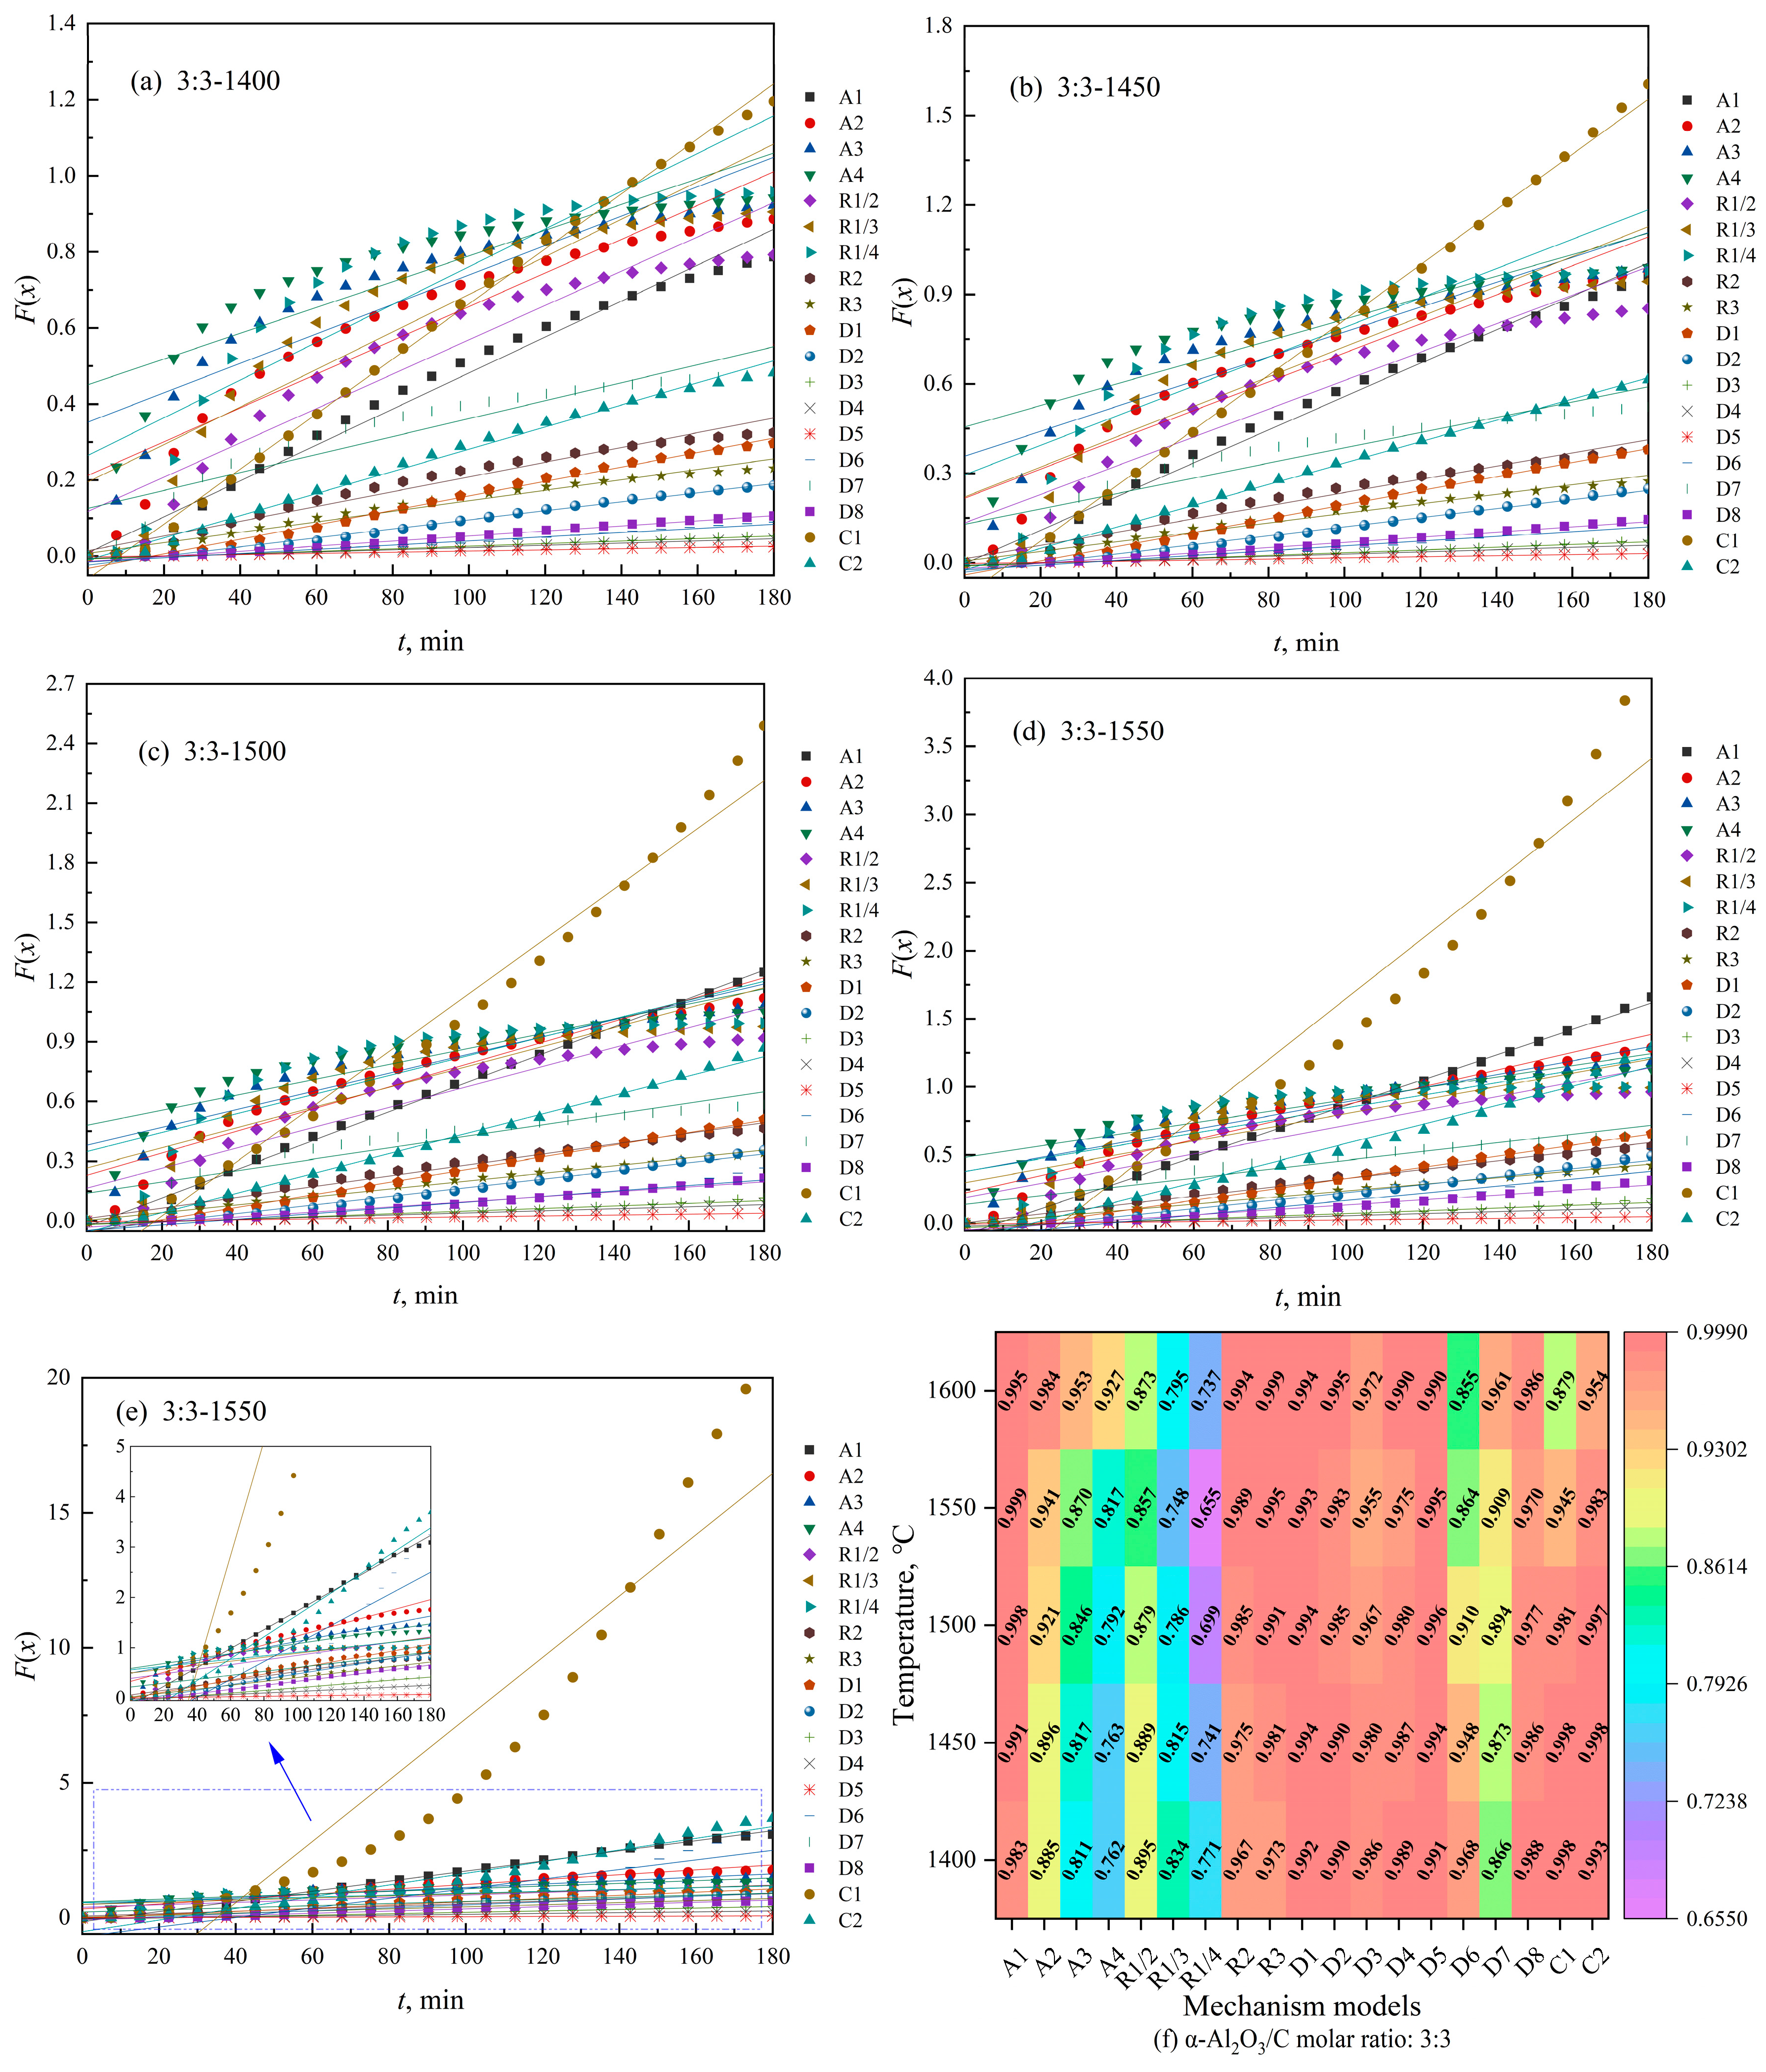
As shown in Equation (4), when the initial conditions (α-Al2O3/C molar ratio and reaction temperature) are kept constant, the integral expression of the mechanism function (F(x)) shows a linear dependence on reaction time (t). To analyze this relationship, we applied the least squares method to linearly fit the conversion rates corresponding to F(x) and t at different molar ratios of α-Al2O3/C and reaction temperatures (data points in Figure 7, Figure 8 and Figure 9). The fitting results are represented as straight lines in Figure 7, Figure 8 and Figure 9.
Given the difficulty of visually assessing the compatibility of different kinetic models with the data, R2 values were adopted as a measure of how well the models match the experimental results, as defined by
R 2 = 1 [ i = 1 n ( Y i Y i ¯ ) 2 i = 1 n Y i 2 ( i = 1 n Y i ) 2 / n ]
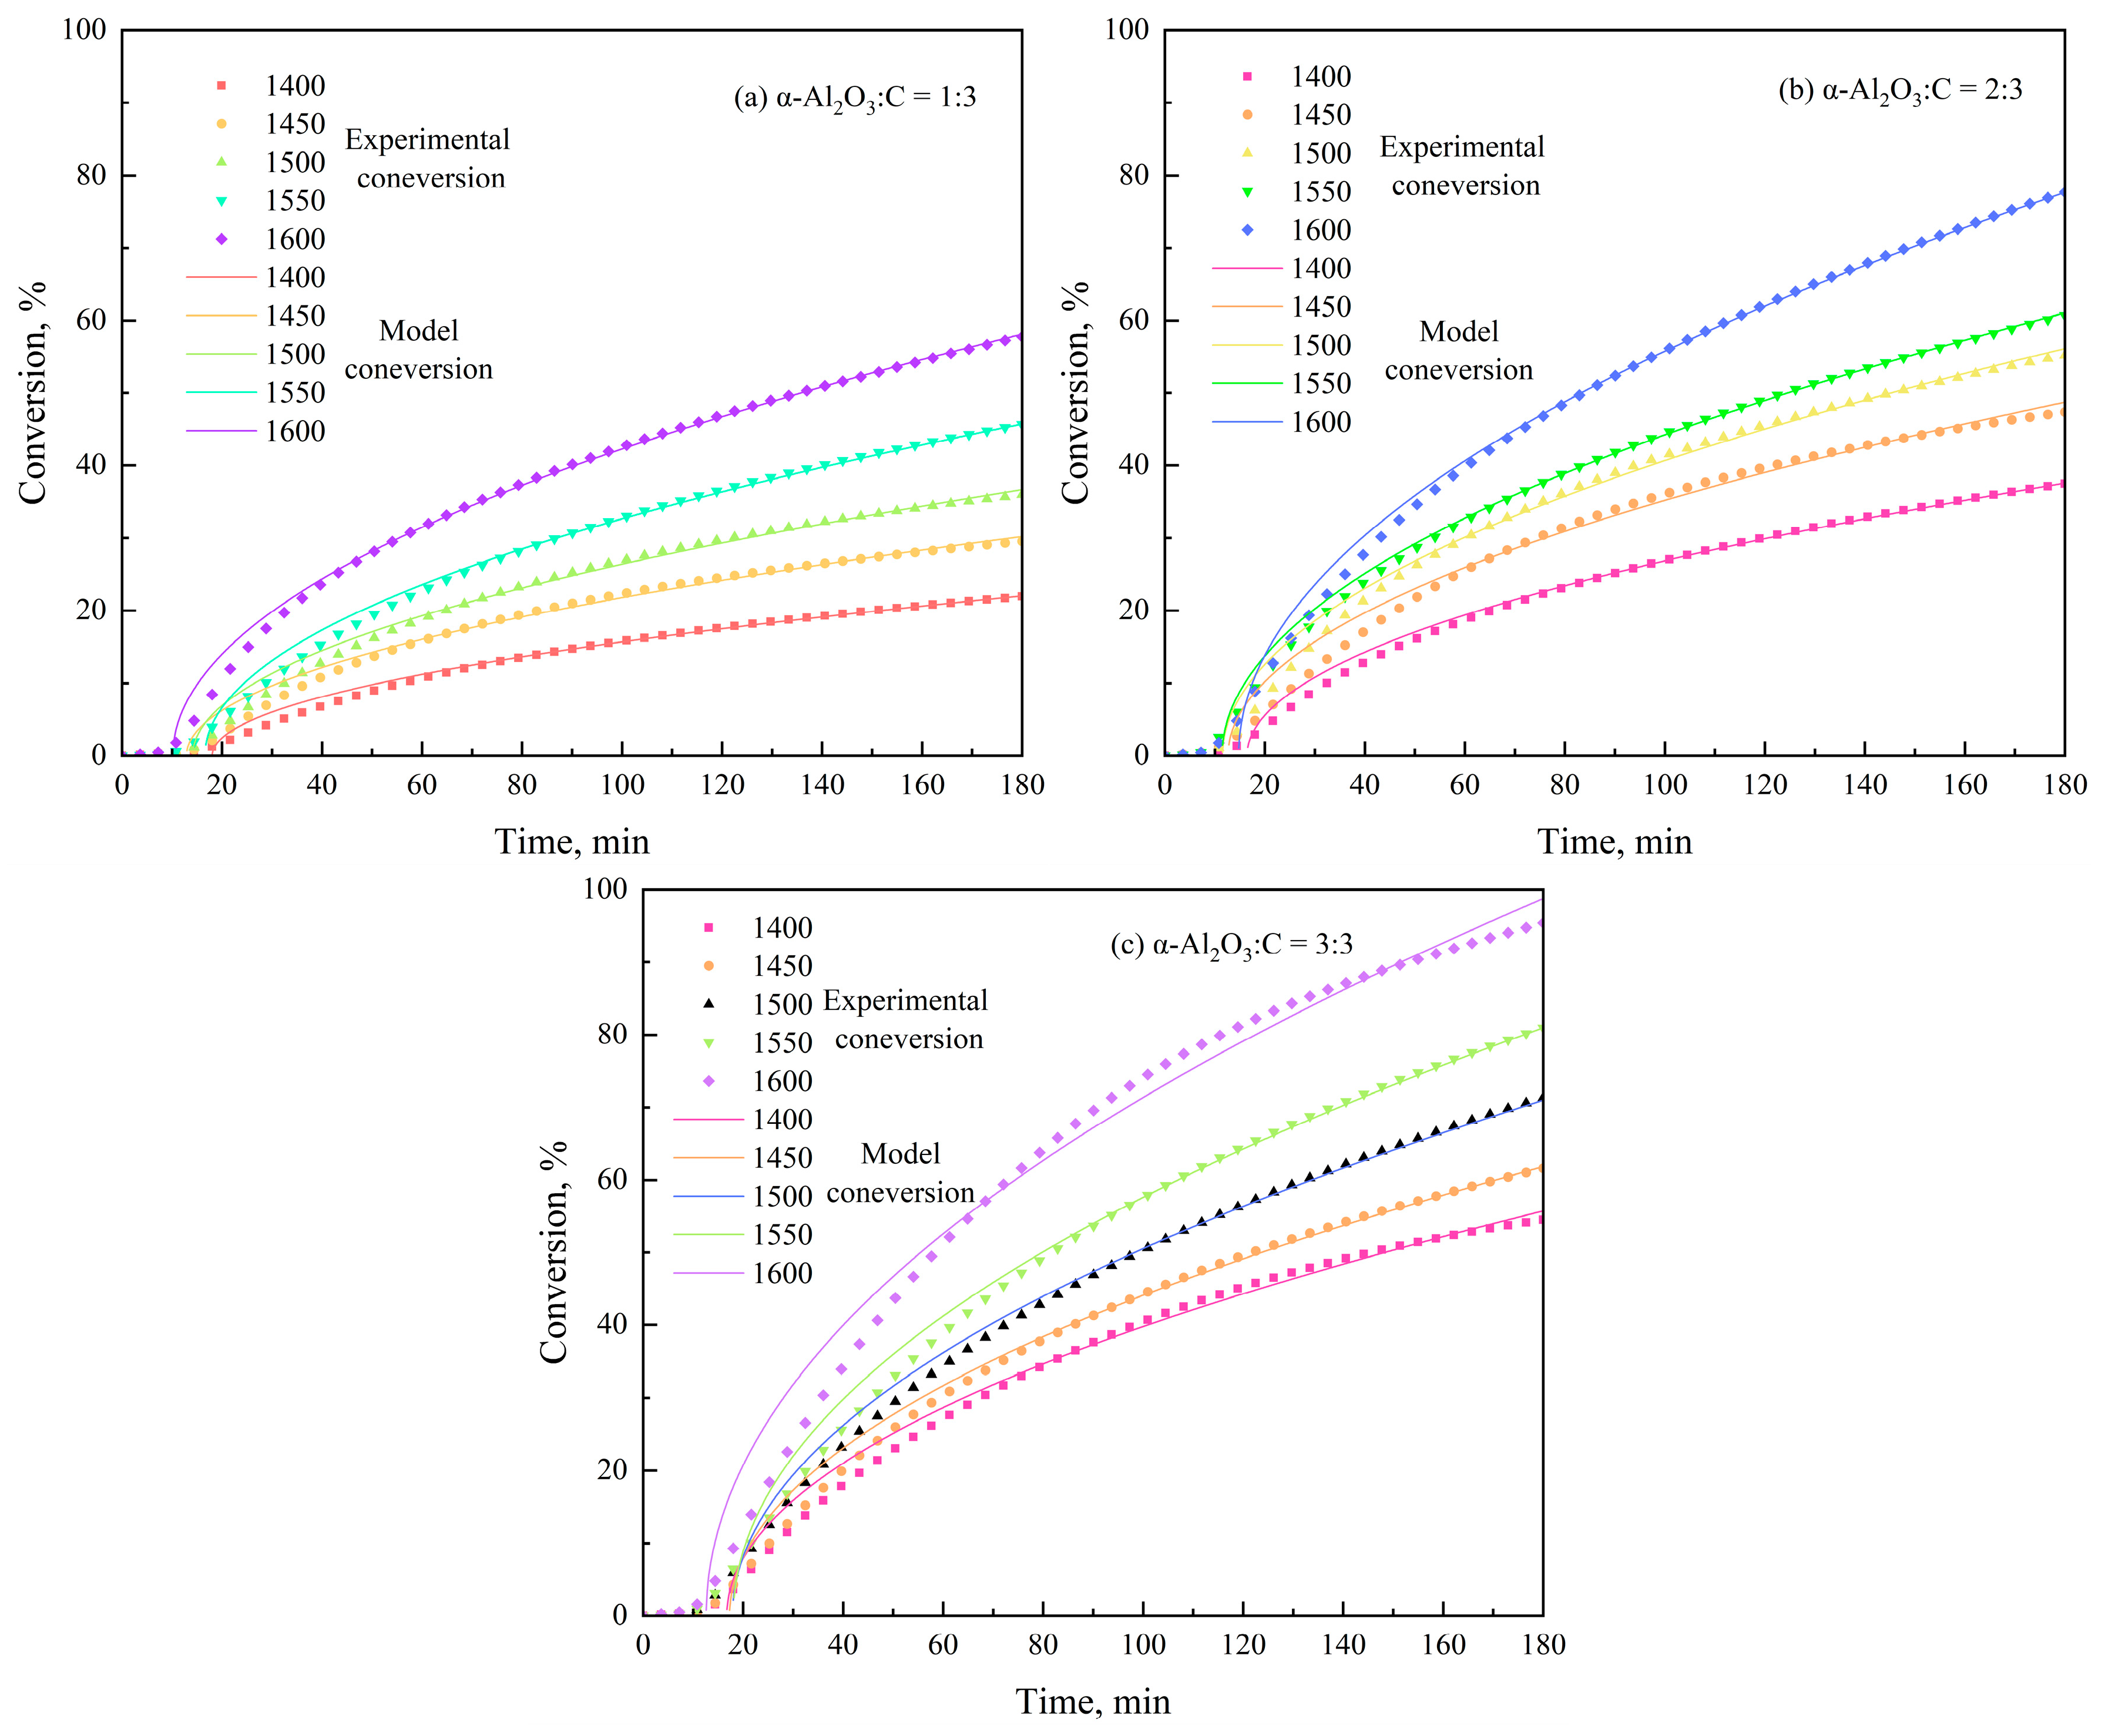
where n is the data point number, Yi denotes experimental values, and Y i ¯ denotes the calculated values, respectively. Figure 7, Figure 8 and Figure 9 show the fits of different kinetic models for α-Al2O3/C molar ratios of 1:3, 2:3, and 3:3, respectively. We applied a color mapping method, where models with the highest R2 values are represented with increasingly red colors. The averaged R2 values over the whole temperature for the diffusion model (D1) were highest when the α-Al2O3/C molar ratios were 1:3, 2:3, and 3:3. Thus, the D1 diffusion model was selected as the kinetic model. Figure 10 shows the conversion curves for biochar-based N-absorption reaction and calculated conversion with the selected model at different temperatures and α-Al2O3/C molar ratios. The conversion curves predicted by the D1 diffusion model align closely with the experimental results

3.2.2. The Activation Energy and the Reaction Rate Coefficient

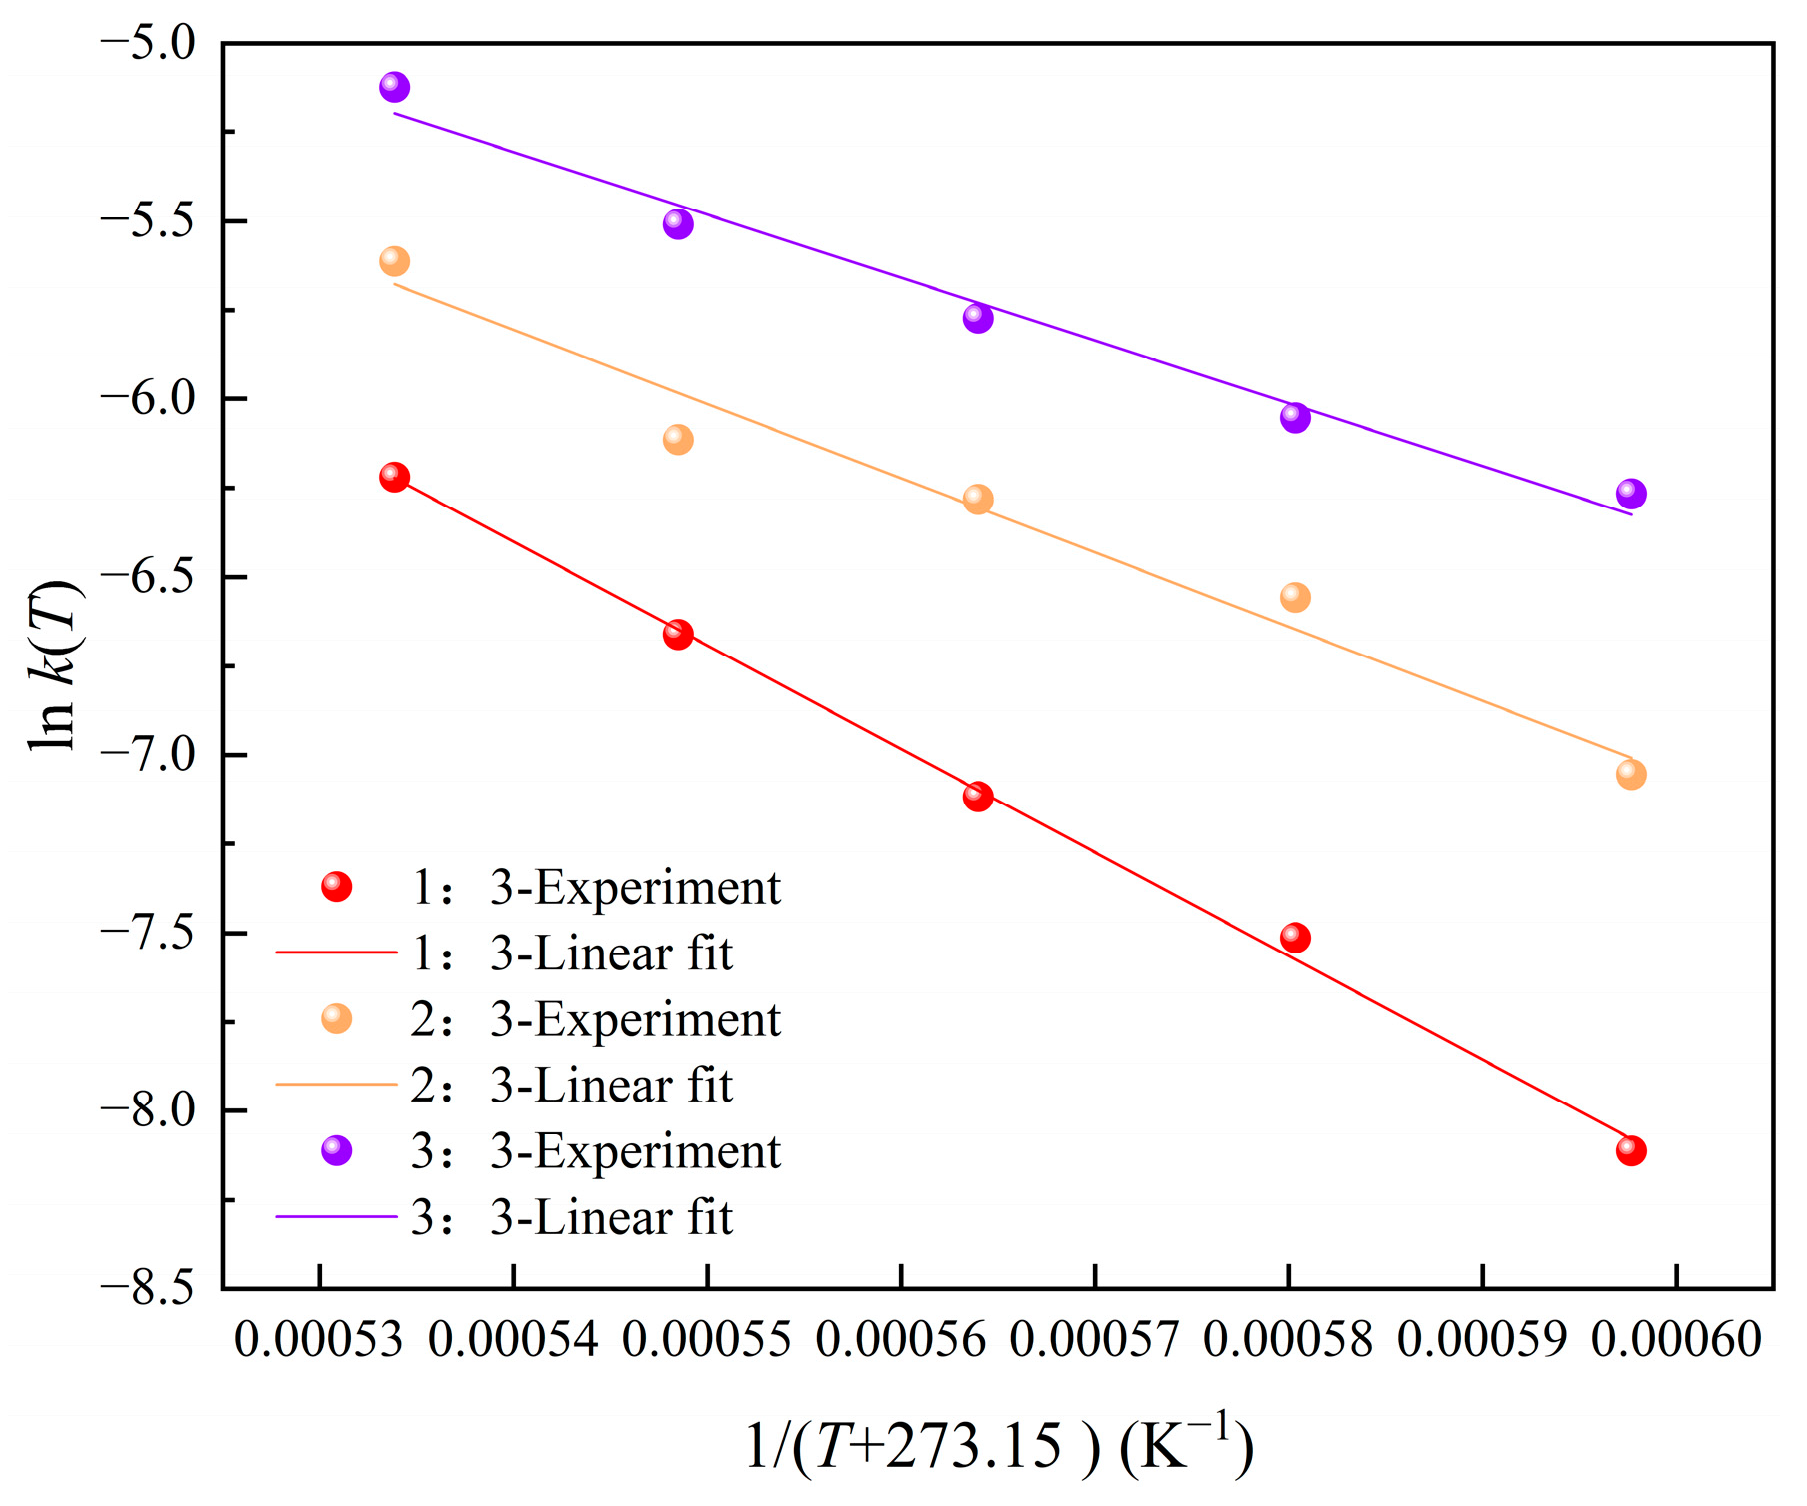
Figure 11 illustrates the plots of the biochar-based N-absorption reaction derived from the D1 diffusion model at various α-Al2O3/C molar ratios using the Arrhenius equation. Table 3 shows the Arrhenius kinetic parameters corresponding to Figure 11. When the α-Al2O3/C molar ratio was constant, ln k(T) and 1/(T + 273.15) were strongly linearly correlated (R2 value close to 1), which also illustrates that the D1 diffusion model could well describe the N-absorption reaction based on the biochar. The α-Al2O3/C molar ratio obviously influenced the Arrhenius plot. As the α-Al2O3/C molar ratio increased, Ea decreased, indicating that α-Al2O3 promoted the N-absorption reaction. Table 4 illustrates the kinetic equations for various α-Al2O3/C molar ratios obtained by combining the kinetic parameters of Table 3 and the selected D1 kinetic model.

3.3. Interpretation of the Kinetic Model

The N-absorption reaction of biochar followed the diffusion model (D1); however, the N-absorption reaction of petcoke [18] and coal coke [20] followed the shrinking core model (R3). The reason for this was the difference in the reaction mechanism of the different carbon sources. According to the theory of Lefort et al. [17], the N-absorption reaction was carried out according to the following reactions:
Al 2 O 3 = 2 Al ( g ) + 3 2 O 2
3 C + 3 2 O 2 3 CO
2 Al ( g ) + N 2 = 2 AlN
Figure 12 shows a schematic of the reaction mechanism of the biochar-based N-absorption reaction. Initially, Al2O3 was heated to decompose into Al(g) and O2. The O2 molecules then diffused to the C surface, leading to the formation of CO, while Al(g) reacted with N2 to produce AlN. The reaction between C and O2 proceeded slowly, potentially resulting in the formation of CO2 as an intermediate product. The reaction of Al(g) and N2 to form AlN was relatively fast [17]. Thus, two steps governed the N-absorption reaction rate: the O2 diffusion from the vapor interface near the Al2O3 spherical shell toward the C spherical shell and the O2 reaction with the C at the intersection between the vapor interface and the C spherical shell. The reaction rate between C and O2 was related to the surface structure of C [26,34]. A high specific surface area and microporosity enhance the surface reaction rate of C [35,36]. The specific surface area of biochar was 341.03 m2/g, and the microporosity was 0.79 (Table 1). The specific surface area of petcoke was 6.2 m2/g [18], and that of coal coke was 7.61 m2/g [20]. Both had a poor pore structure. When C (biochar) had an abundant pore structure and high specific surface area, the reaction rate between C and O2 was faster, and the diffusion of O2 controlled the N-absorption reaction rate, so the kinetic model was a diffusion model. Furthermore, when the specific surface area of C (petcoke and coal coke) was small and the pore structure was poor, the reaction rate between C and O2 was slower, and it was a rate-controlling step for the N-absorption reaction, so the kinetic model was a shrinking core model.
In conclusion, different carbon surface structures affected the surface reaction rate of C, thus resulting in different reaction mechanisms. The results were manifested in different reaction kinetic models. This mechanism also explains well why the addition of α-Al2O3 can promote the C conversion: due to the increase in the amount of α-Al2O3, which led to the increase in O2(g) in the reaction system, O2(g) diffused more easily into the intersection and reacted with C, thus promoting the reaction.

4. Conclusions

We comprehensively examined how reaction conditions influence the biochar-based N-absorption reaction. We demonstrated that the influence of the gas flow rate on biochar conversion was negligible, while increasing the reaction temperature and the α-Al2O3/C molar ratio significantly enhanced carbon conversion. Among the tested kinetic models, the D1 diffusion model was found to best describe the N-absorption reaction. Moreover, raising the α-Al2O3/C molar ratio significantly lowered the reaction’s activation energy. The diffusion of O2, derived from the decomposition of α-Al2O3, was the rate-controlling step of the reaction.
This research enhances the use of biochar in Chemical Looping Ammonia Generation. The derived kinetic model provides a solid foundation for further chemical process simulations. It is important to note that this study focused on deriving the kinetic model based on experimental data, without delving into the microscopic molecular dynamics of the reaction. Future research could focus on studying the molecular-level structural and energy changes during the reaction process using density functional theory.

Author Contributions

Z.L.: conceptualization, formal analysis, and writing—review and editing. Q.Y.: conceptualization, supervision, and methodology. H.X.: formal analysis, supervision, and methodology. J.G.: data curation and formal analysis. J.Z.: writing—original draft. All authors have read and agreed to the published version of the manuscript.

Funding

This research was supposed by the National Key Research and Development Program of China (2017YFB0603603) and LiaoNing Revitalization Talents Program (XLYC1802003).

Data Availability Statement

The data that support the findings of this study are available on request from the corresponding author.

Conflicts of Interest

The authors declare no conflicts of interest.

References

  1. Gezerman, A.O. A Critical Assessment of Green Ammonia Production and Ammonia Production Technologies. Kem. U Ind. 2022, 71, 57–66. [Google Scholar] [CrossRef]
  2. Wang, Y.; Yao, Z.; Wang, Y.; Yan, G.; Janz, B.; Wang, X.; Zhan, Y.; Wang, R.; Zheng, X.; Zhou, M.; et al. Characteristics of annual NH(3) emissions from a conventional vegetable field under various nitrogen management strategies. J. Environ. Manag. 2023, 342, 118276. [Google Scholar] [CrossRef] [PubMed]
  3. Chi, W.; Yang, Q.; Chen, X.; Liu, G.; Zhao, Y.; Li, L. Performance evaluation of NH3/CO2 cascade refrigeration system with ejector subcooling for low-temperature cycle. Int. J. Refrig. 2022, 136, 162–171. [Google Scholar] [CrossRef]
  4. Penkuhn, M.; Tsatsaronis, G. Comparison of different ammonia synthesis loop configurations with the aid of advanced exergy analysis. Energy 2017, 137, 854–864. [Google Scholar] [CrossRef]
  5. Pingkuo, L.; Xue, H. Comparative analysis on similarities and differences of hydrogen energy development in the World’s top 4 largest economies: A novel framework. Int. J. Hydrogen Energy 2022, 47, 9485–9503. [Google Scholar] [CrossRef]
  6. Lesmana, H.; Zhang, Z.; Li, X.; Zhu, M.; Xu, W.; Zhang, D. NH3 as a transport fuel in internal combustion engines: A technical review. J. Energy Resour. Technol. 2019, 141, 070703. [Google Scholar] [CrossRef]
  7. Boretti, A.; Castelletto, S. NH3 Prospects in Combustion Engines and Fuel Cells for Commercial Aviation by 2030. ACS Energy Lett. 2022, 7, 2557–2564. [Google Scholar] [CrossRef]
  8. Smith, C.; Hill, A.K.; Torrente-Murciano, L. Current and future role of Haber-Bosch ammonia in a carbon-free energy landscape. Energy Environ. Sci. 2020, 13, 331–344. [Google Scholar] [CrossRef]
  9. Vojvodic, A.; Medford, A.J.; Studt, F.; Abild-Pedersen, F.; Khan, T.S.; Bligaard, T.; Nørskov, J.K. Exploring the limits: A low-pressure, low-temperature Haber–Bosch process. Chem. Phys. Lett. 2014, 598, 108–112. [Google Scholar] [CrossRef]
  10. Rafiqul, I.; Weber, C.; Lehmann, B.; Voss, A. Energy efficiency improvements in ammonia production—Perspectives and uncertainties. Energy 2005, 30, 2487–2504. [Google Scholar] [CrossRef]
  11. Galvez, M.E.; Halmann, M.; Steinfeld, A. Ammonia production via a two-step Al2O3/AlN thermochemical cycle. 1. Thermodynamic, environmental, and economic analyses. Ind. Eng. Chem. Res. 2007, 46, 2042–2046. [Google Scholar] [CrossRef]
  12. Wu, Y.; Gao, Y.; Zhang, Q.; Cai, T.; Chen, X.; Liu, D.; Fan, M. Promising zirconia-mixed Al-based nitrogen carriers for chemical looping of NH3: Reduced NH3 decomposition and improved NH3 yield. Fuel 2020, 264, 116821. [Google Scholar] [CrossRef]
  13. Wang, X.; Su, M.; Zhao, H. Process design and exergy cost analysis of a chemical looping ammonia generation system using AlN/Al2O3 as a nitrogen carrier. Energy 2021, 230, 120767. [Google Scholar] [CrossRef]
  14. Weng, Q.; Toan, S.; Ai, R.; Sun, Z.; Sun, Z. Ammonia production from biomass via a chemical looping-based hybrid system. J. Clean. Prod. 2021, 289, 125749. [Google Scholar] [CrossRef]
  15. Forslund, B.; Zheng, J. Carbothermal synthesis of aluminium nitride at elevated nitrogen pressures: Part I Effect of process parameters on conversion rate. J. Mater. Sci. 1993, 28, 3125–3131. [Google Scholar] [CrossRef]
  16. Forslund, B.; Zheng, J. Carbothermal synthesis of aluminium nitride at elevated nitrogen pressures: Part II Effect of process parameters on particle size and morphology. J. Mater. Sci. 1993, 28, 3132–3136. [Google Scholar] [CrossRef]
  17. Lefort, P.; Billy, M. Mechanism of AlN formation through the carbothermal reduction of Al2O3 in a flowing N2 atmosphere. J. Am. Ceram. Soc. 1993, 76, 2295–2299. [Google Scholar] [CrossRef]
  18. Gálvez, M.; Hischier, I.; Frei, A.; Steinfeld, A. Ammonia Production via a Two-Step Al2O3/AlN Thermochemical Cycle. 3. Influence of the Carbon Reducing Agent and Cyclability. Ind. Eng. Chem. Res. 2008, 47, 2231–2237. [Google Scholar] [CrossRef]
  19. Zhang, Q.; Wu, Y.; Gao, Y.; Chen, X.; Liu, D.; Fan, M. High-performance mesoporous (AlN/Al2O3) for enhanced NH3 yield during chemical looping ammonia generation technology. Int. J. Hydrogen Energy 2020, 45, 9903–9913. [Google Scholar] [CrossRef]
  20. Feng, M.; Zhang, Q.; Wu, Y.; Liu, D. Using Coal Coke for N-Sorption with an Al-based Nitrogen Carrier during Chemical Looping Ammonia Generation. Energy Fuels 2020, 34, 12527–12534. [Google Scholar] [CrossRef]
  21. Komeya, K.; Mitsuhashi, E.; Meguro, T. Synthesis of AlN Powder by Carbothermal Reduction-Nitridation Method Effect of Additives on Reaction Rate. J. Ceram. Soc. Jpn. 1993, 101, 377–382. [Google Scholar] [CrossRef]
  22. Variny, M.; Varga, A.; Rimár, M.; Janošovský, J.; Kizek, J.; Lukáč, L.; Jablonský, G.; Mierka, O. Advances in Biomass Co-Combustion with Fossil Fuels in the European Context: A Review. Processes 2021, 9, 100. [Google Scholar] [CrossRef]
  23. Kang, Q.; Appels, L.; Tan, T.; Dewil, R. Bioethanol from Lignocellulosic Biomass: Current Findings Determine Research Priorities. Sci. World J. 2014, 2014, 298153. [Google Scholar] [CrossRef] [PubMed]
  24. Cha, J.S.; Park, S.H.; Jung, S.-C.; Ryu, C.; Jeon, J.-K.; Shin, M.-C.; Park, Y.-K. Production and utilization of biochar: A review. J. Ind. Eng. Chem. 2016, 40, 1–15. [Google Scholar] [CrossRef]
  25. Tripathi, M.; Sahu, J.N.; Ganesan, P. Effect of process parameters on production of biochar from biomass waste through pyrolysis: A review. Renew. Sustain. Energy Rev. 2016, 55, 467–481. [Google Scholar] [CrossRef]
  26. Leng, L.; Xiong, Q.; Yang, L.; Li, H.; Zhou, Y.; Zhang, W.; Jiang, S.; Li, H.; Huang, H. An overview on engineering the surface area and porosity of biochar. Sci. Total Environ. 2021, 763, 144204. [Google Scholar] [CrossRef]
  27. Yang, C.D.; Liu, J.J.; Ying, H.C.; Lu, S.G. Soil pore structure changes induced by biochar affect microbial diversity and community structure in an Ultisol. Soil Tillage Res. 2022, 224, 10. [Google Scholar] [CrossRef]
  28. Liu, Z.; Yu, Q.; Gao, J.; Zhao, J.; Duan, W. Effect of pyrolysis parameters on the biochar reactivity in the N-absorption reaction of chemical looping ammonia generation. Energy 2024, 310, 133321. [Google Scholar] [CrossRef]
  29. Galvez, M.E.; Frei, A.; Halmann, M.; Steinfeld, A. Ammonia production via a two-step Al2O3/AlN thermochemical cycle. 2. Kinetic analysis. Ind. Eng. Chem. Res. 2007, 46, 2047–2053. [Google Scholar] [CrossRef]
  30. Liu, Z.; Yu, Q.; Wang, H.; Wu, J.; Tao, S. Selecting nitrogen carriers used for chemical looping ammonia generation of biomass and H2O by thermodynamic method. Int. J. Hydrogen Energy 2023, 48, 4035–4051. [Google Scholar] [CrossRef]
  31. Gao, Y.; Wu, Y.; Zhang, Q.; Chen, X.; Jiang, G.; Liu, D. N-desorption or NH3 generation of TiO2-loaded Al-based nitrogen carrier during chemical looping ammonia generation technology. Int. J. Hydrogen Energy 2018, 43, 16589–16597. [Google Scholar] [CrossRef]
  32. Duan, W.; Yu, Q.; Liu, J.; Wu, T.; Yang, F.; Qin, Q. Experimental and kinetic study of steam gasification of low-rank coal in molten blast furnace slag. Energy 2016, 111, 859–868. [Google Scholar] [CrossRef]
  33. Yao, X.; Yu, Q.; Wang, K.; Xie, H.; Qin, Q. Kinetic characterizations of biomass char CO2 -gasification reaction within granulated blast furnace slag. Int. J. Hydrogen Energy 2017, 42, 20520–20528. [Google Scholar] [CrossRef]
  34. Doǧu, T. The importance of pore structure and diffusion in the kinetics of gas-solid non-catalytic reactions: Reaction of calcined limestone with SO2. Chem. Eng. J. 1981, 21, 213–222. [Google Scholar] [CrossRef]
  35. Bar-Ziv, E.; Kantorovich, I.I. Mutual effects of porosity and reactivity in char oxidation. Prog. Energy Combust. Sci. 2001, 27, 667–697. [Google Scholar] [CrossRef]
  36. Kim, Y.; Oh, J.-I.; Vithanage, M.; Park, Y.-K.; Lee, J.; Kwon, E.E. Modification of biochar properties using CO2. Chem. Eng. J. 2019, 372, 383–389. [Google Scholar] [CrossRef]
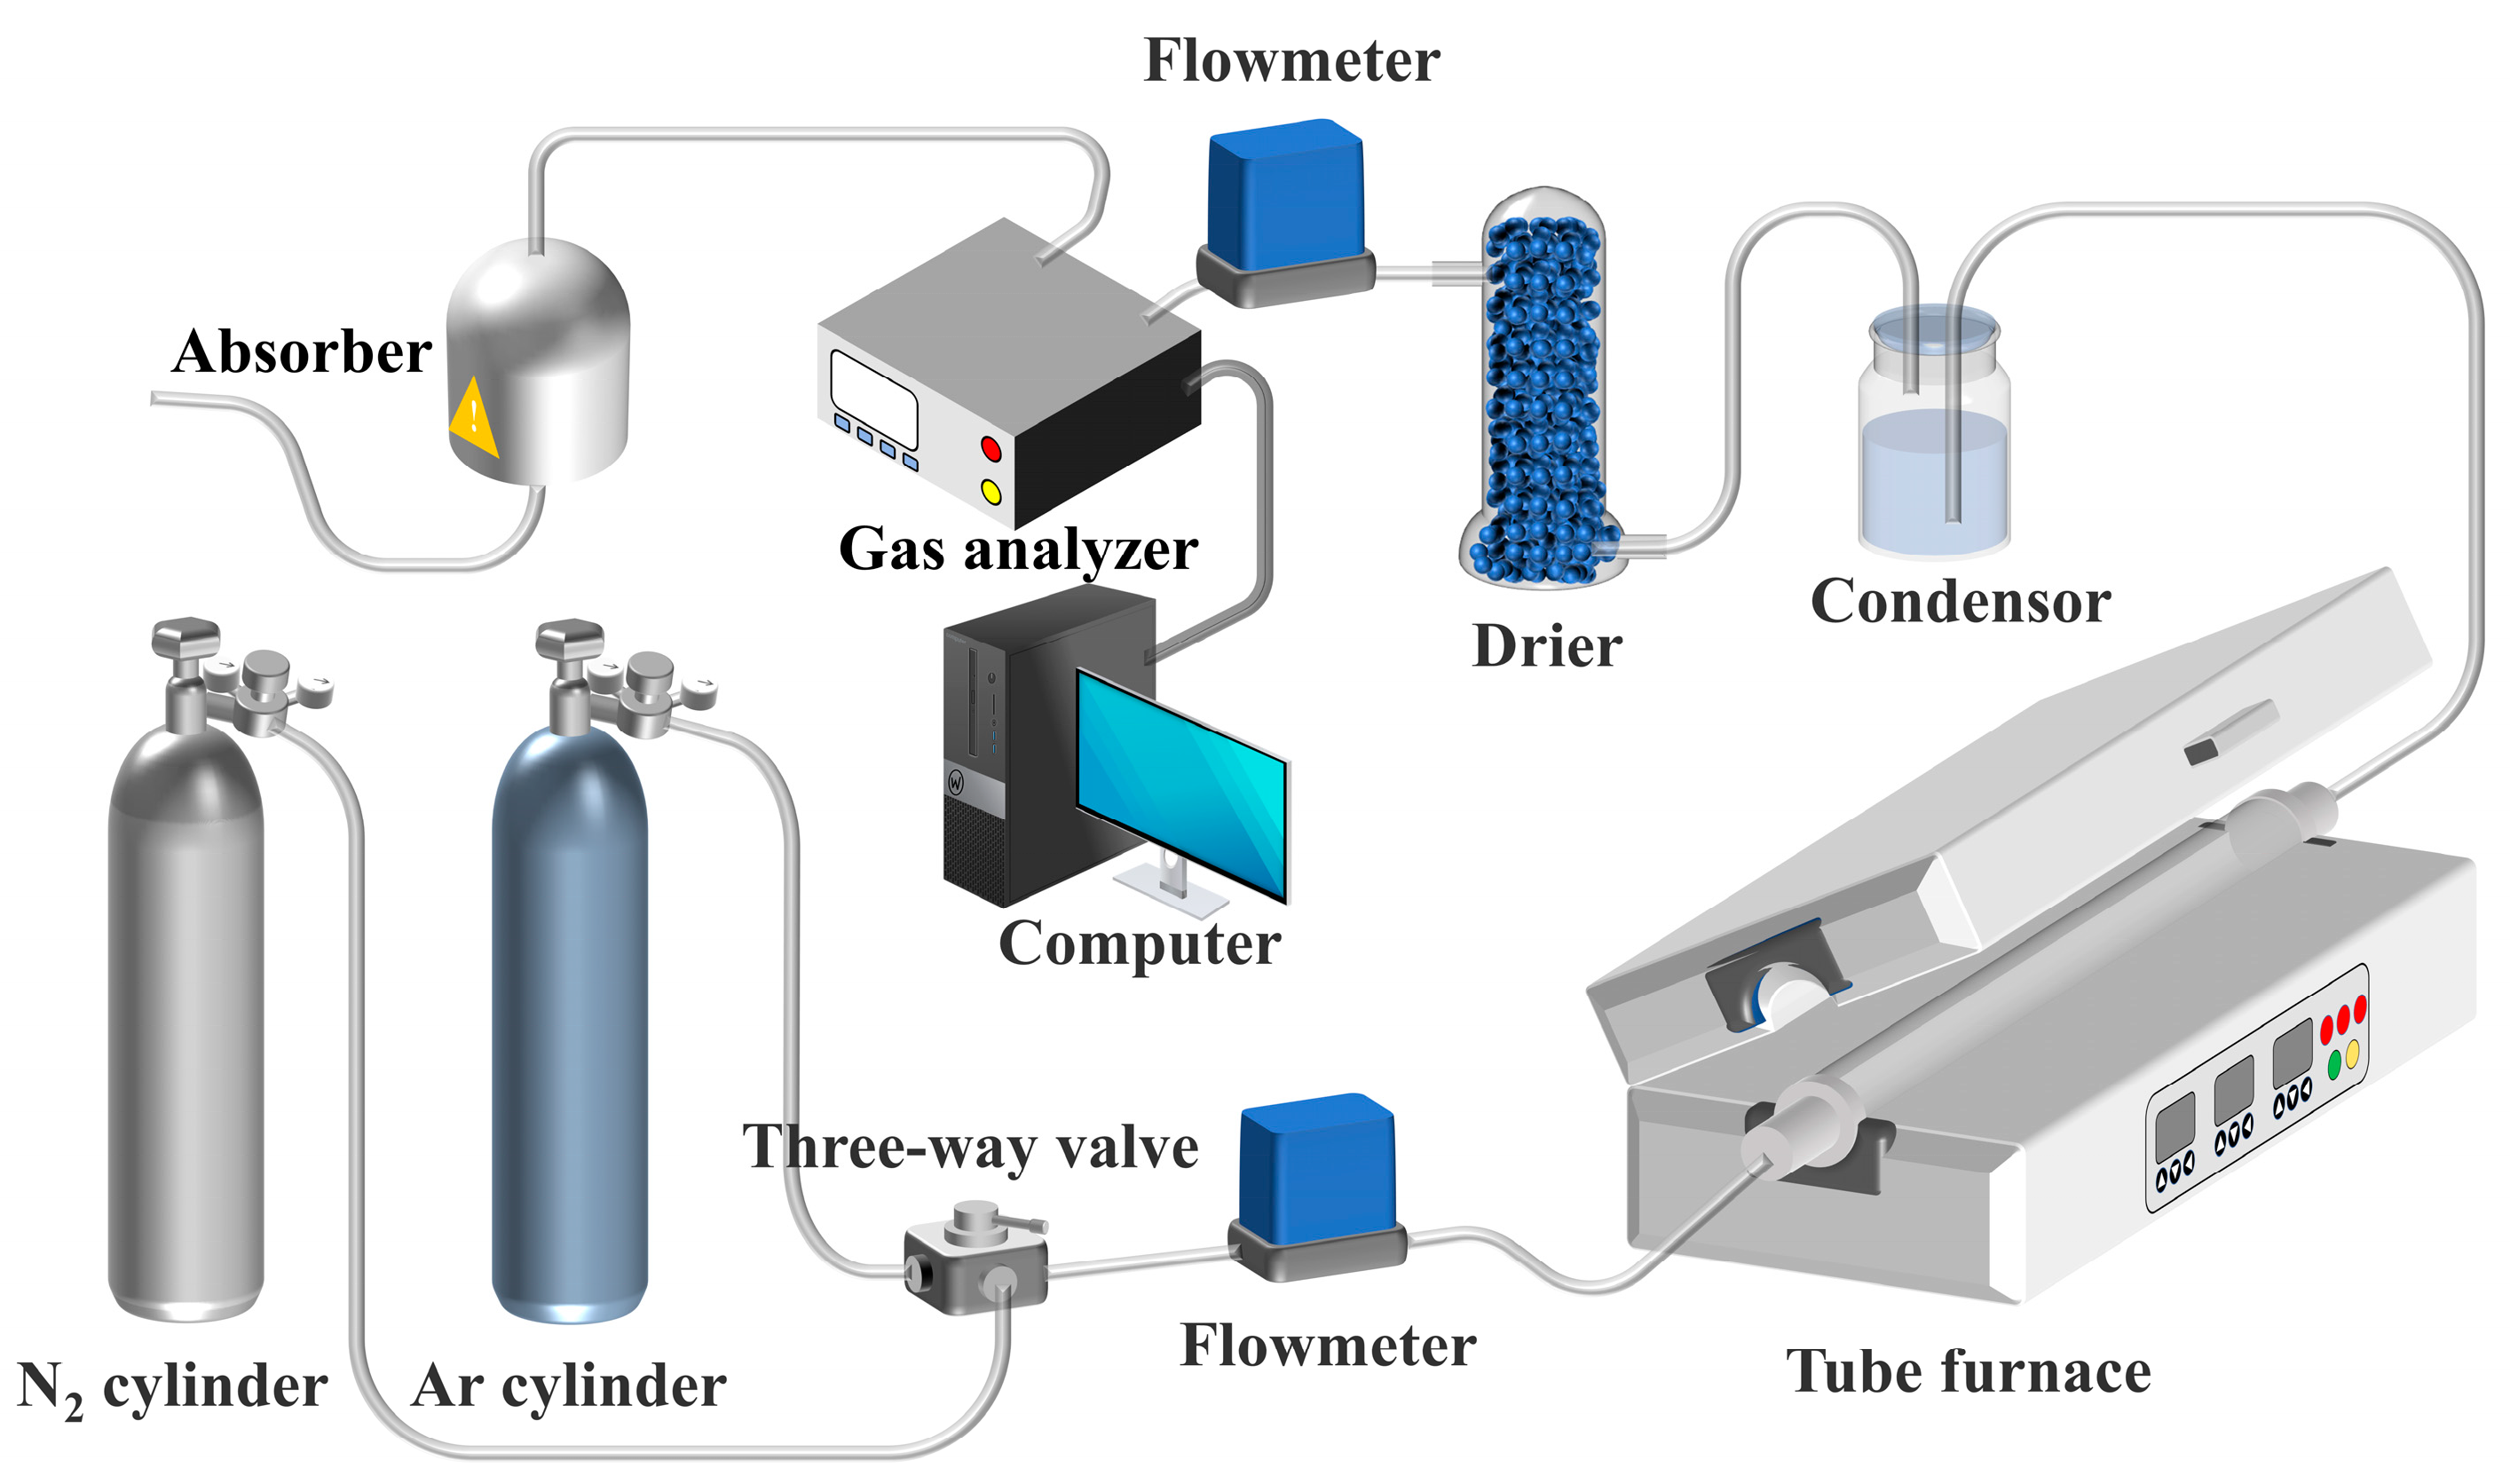
Figure 1. The experimental setup of the N-absorption reaction based on biochar.
Processes 12 02870 g001
Figure 2. Effect of gas flows on biochar conversion at different α-Al2O3/C molar ratios.
Processes 12 02870 g002
Figure 3. How reaction temperature influences biochar conversion across various α-Al2O3/C molar ratios.
Processes 12 02870 g003
Figure 4. How the α-Al2O3/C molar ratio impacts biochar conversion under varying reaction temperatures.
Processes 12 02870 g004
Figure 5. How the α-Al2O3/C molar ratio influences α-Al2O3 conversion under various reaction temperatures.
Processes 12 02870 g005
Figure 6. How the α-Al2O3/C molar ratio influences TON at various reaction temperatures.
Processes 12 02870 g006
Figure 7. The relationship and degree of linear correlation between the mechanism function and time when the α-Al2O3/C molar ratio was 1:3: (a) 1400 °C, (b) 1450 °C, (c) 1500 °C, (d) 1550 °C, (e) 1600 °C, (f) the R2 values for different kinetic model fits.
Processes 12 02870 g007
Figure 8. The relationship and degree of linear correlation between the mechanism function and time when the α-Al2O3/C molar ratio was 2:3: (a) 1400 °C, (b) 1450 °C, (c) 1500 °C, (d) 1550 °C, (e) 1600 °C, (f) the R2 values for different kinetic model fits.
Processes 12 02870 g008
Figure 9. The relationship and degree of linear correlation between the mechanism function and time when the α-Al2O3/C molar ratio was 3:3: (a) 1400 °C, (b) 1450 °C, (c) 1500 °C, (d) 1550 °C, (e) 1600 °C, (f) the R2 values for different kinetic model fits.
Processes 12 02870 g009
Figure 10. Conversion curves for biochar-based N-absorption reaction and calculated conversion with the selected model at different temperatures and α-Al2O3/C molar ratios.
Processes 12 02870 g010
Figure 11. Arrhenius plots of the biochar-based N-absorption reaction obtained by applying the D1 diffusion model at different α-Al2O3/C molar ratios.
Processes 12 02870 g011
Figure 12. Schematic of the reaction mechanism of biochar-based N-absorption reaction.
Processes 12 02870 g012
Table 1. Ultimate analysis and pore structure of biochar.
Ultimate Analysis (d.b.)wt%Pore Structure
C96.5SBET (m2/g)341.0305
H1.2Smic (m2/g)308.4343
O (by difference)1.84Sext (m2/g)32.5962
N0.45Dave (nm)1.8016
S0.01Vmic (cm3/g)0.1213
Vtotal (cm3/g)0.1536
Vmic/Vtotal0.7897
Table 2. Kinetic models used for the N-absorption reaction based on biochar.
CodeReaction ModelDifferential f(x)Integral F(x)
AmNucleus production model m 1 x ln 1 x m 1 m ln 1 x 1 m
A1m = 11 − x−ln(1 − x)
A2m = 22(1 − x)[−ln(1 − x)]1/2[−ln(1 − x)]1/2
A3m = 33(1 − x)[−ln(1 − x)]2/3[−ln(1 − x)]1/3
A4m = 44(1 − x)[−ln(1 − x)]1/4[−ln(1 − x)]1/4
RmShrinking core model m 1 x m 1 m 1 1 x 1 m
R1/2m = 1/2(1/2)(1 − x)−11 − (1 − x)2
R1/3m = 1/3(1/3)(1 − x)−21 − (1 − x)3
R1/4m = 1/4(1/4)(1 − x)−31 − (1 − x)4
R2m = 22(1 − x)1/21 − (1 − x)1/2
R3m = 33(1 − x)2/31 − (1 − x)1/3
DmDimensional diffusion model
D1Dimensional diffusion1/2x−1x2
D2Two-dimensional diffusion[−ln(1 − x)]−1x + (1 − x)ln(1 − x)
D3Three-dimensional diffusion(3/2)(1 − x)2/3[1 − (1 − x)1/3]−1[1 − (1 − x)1/3]2
D4Three-dimensional diffusion(3/2)[(1 − x)−1/3 − 1]−11 − 2/3x − (1 − x)2/3
D53-D (Anti-Jander)(3/2)(1 + x)2/3[(1 + x)1/3 − 1]−1[(1 + x)1/3 − 1]2
D63-D (ZLT)(3/2)(1 − x)4/3[(1 − x)−1/3 − 1]−1[(1 − x)−1/3 − 1]2
D73-D (Jander)6(1 − x)2/3[1 − (1 − x)1/3]1/2[1 − (1 − x)1/3]1/2
D82-D (Jander)(1 − x)1/2[1 − (1 − x)1/2]−1[1 − (1 − x)1/2]2
CnPhase boundary reaction 1 x n 1 1 x 1 n 1 n
C1Reaction order: n = 2(1 − x)2(1 − x)−1 − 1
C2Reaction order: n = 3/22(1 − x)3/2(1 − x)−1/2 − 1
Table 3. Arrhenius kinetic parameters for the biochar-based N-absorption reaction at different α-Al2O3/C molar ratios.
α-Al2O3/C Molar RatioInterceptSlopeEa (kJ/mol)k0 (min−1)R2
1:39.31−29,096.66241.9111,061.430.99754
2:35.45−20,850.46173.35233.580.97167
3:34.23−17,653.34146.7768.490.98175
Table 4. Kinetic equations of the biochar-based N-absorption reaction at different α-Al2O3/C molar ratios.
α-Al2O3/C Molar RatioKinetic Equations of the Biochar-Based N-Absorption Reaction
1:3 d x / d t = 5530.71 × exp ( 241.91 / R T ) x 1
2:3 d x / d t = 116.79 × exp ( 173.35 / R T ) x 1
3:3 d x / d t = 73.39 × exp ( 68.49 / R T ) x 1
Disclaimer/Publisher’s Note: The statements, opinions and data contained in all publications are solely those of the individual author(s) and contributor(s) and not of MDPI and/or the editor(s). MDPI and/or the editor(s) disclaim responsibility for any injury to people or property resulting from any ideas, methods, instructions or products referred to in the content.