
Enabling Manual Workplace Optimization Based on Cycle Time and Musculoskeletal Risk Parameters

 , , ,
, , ,
Abstract
1. Introduction
2. Materials and Methods
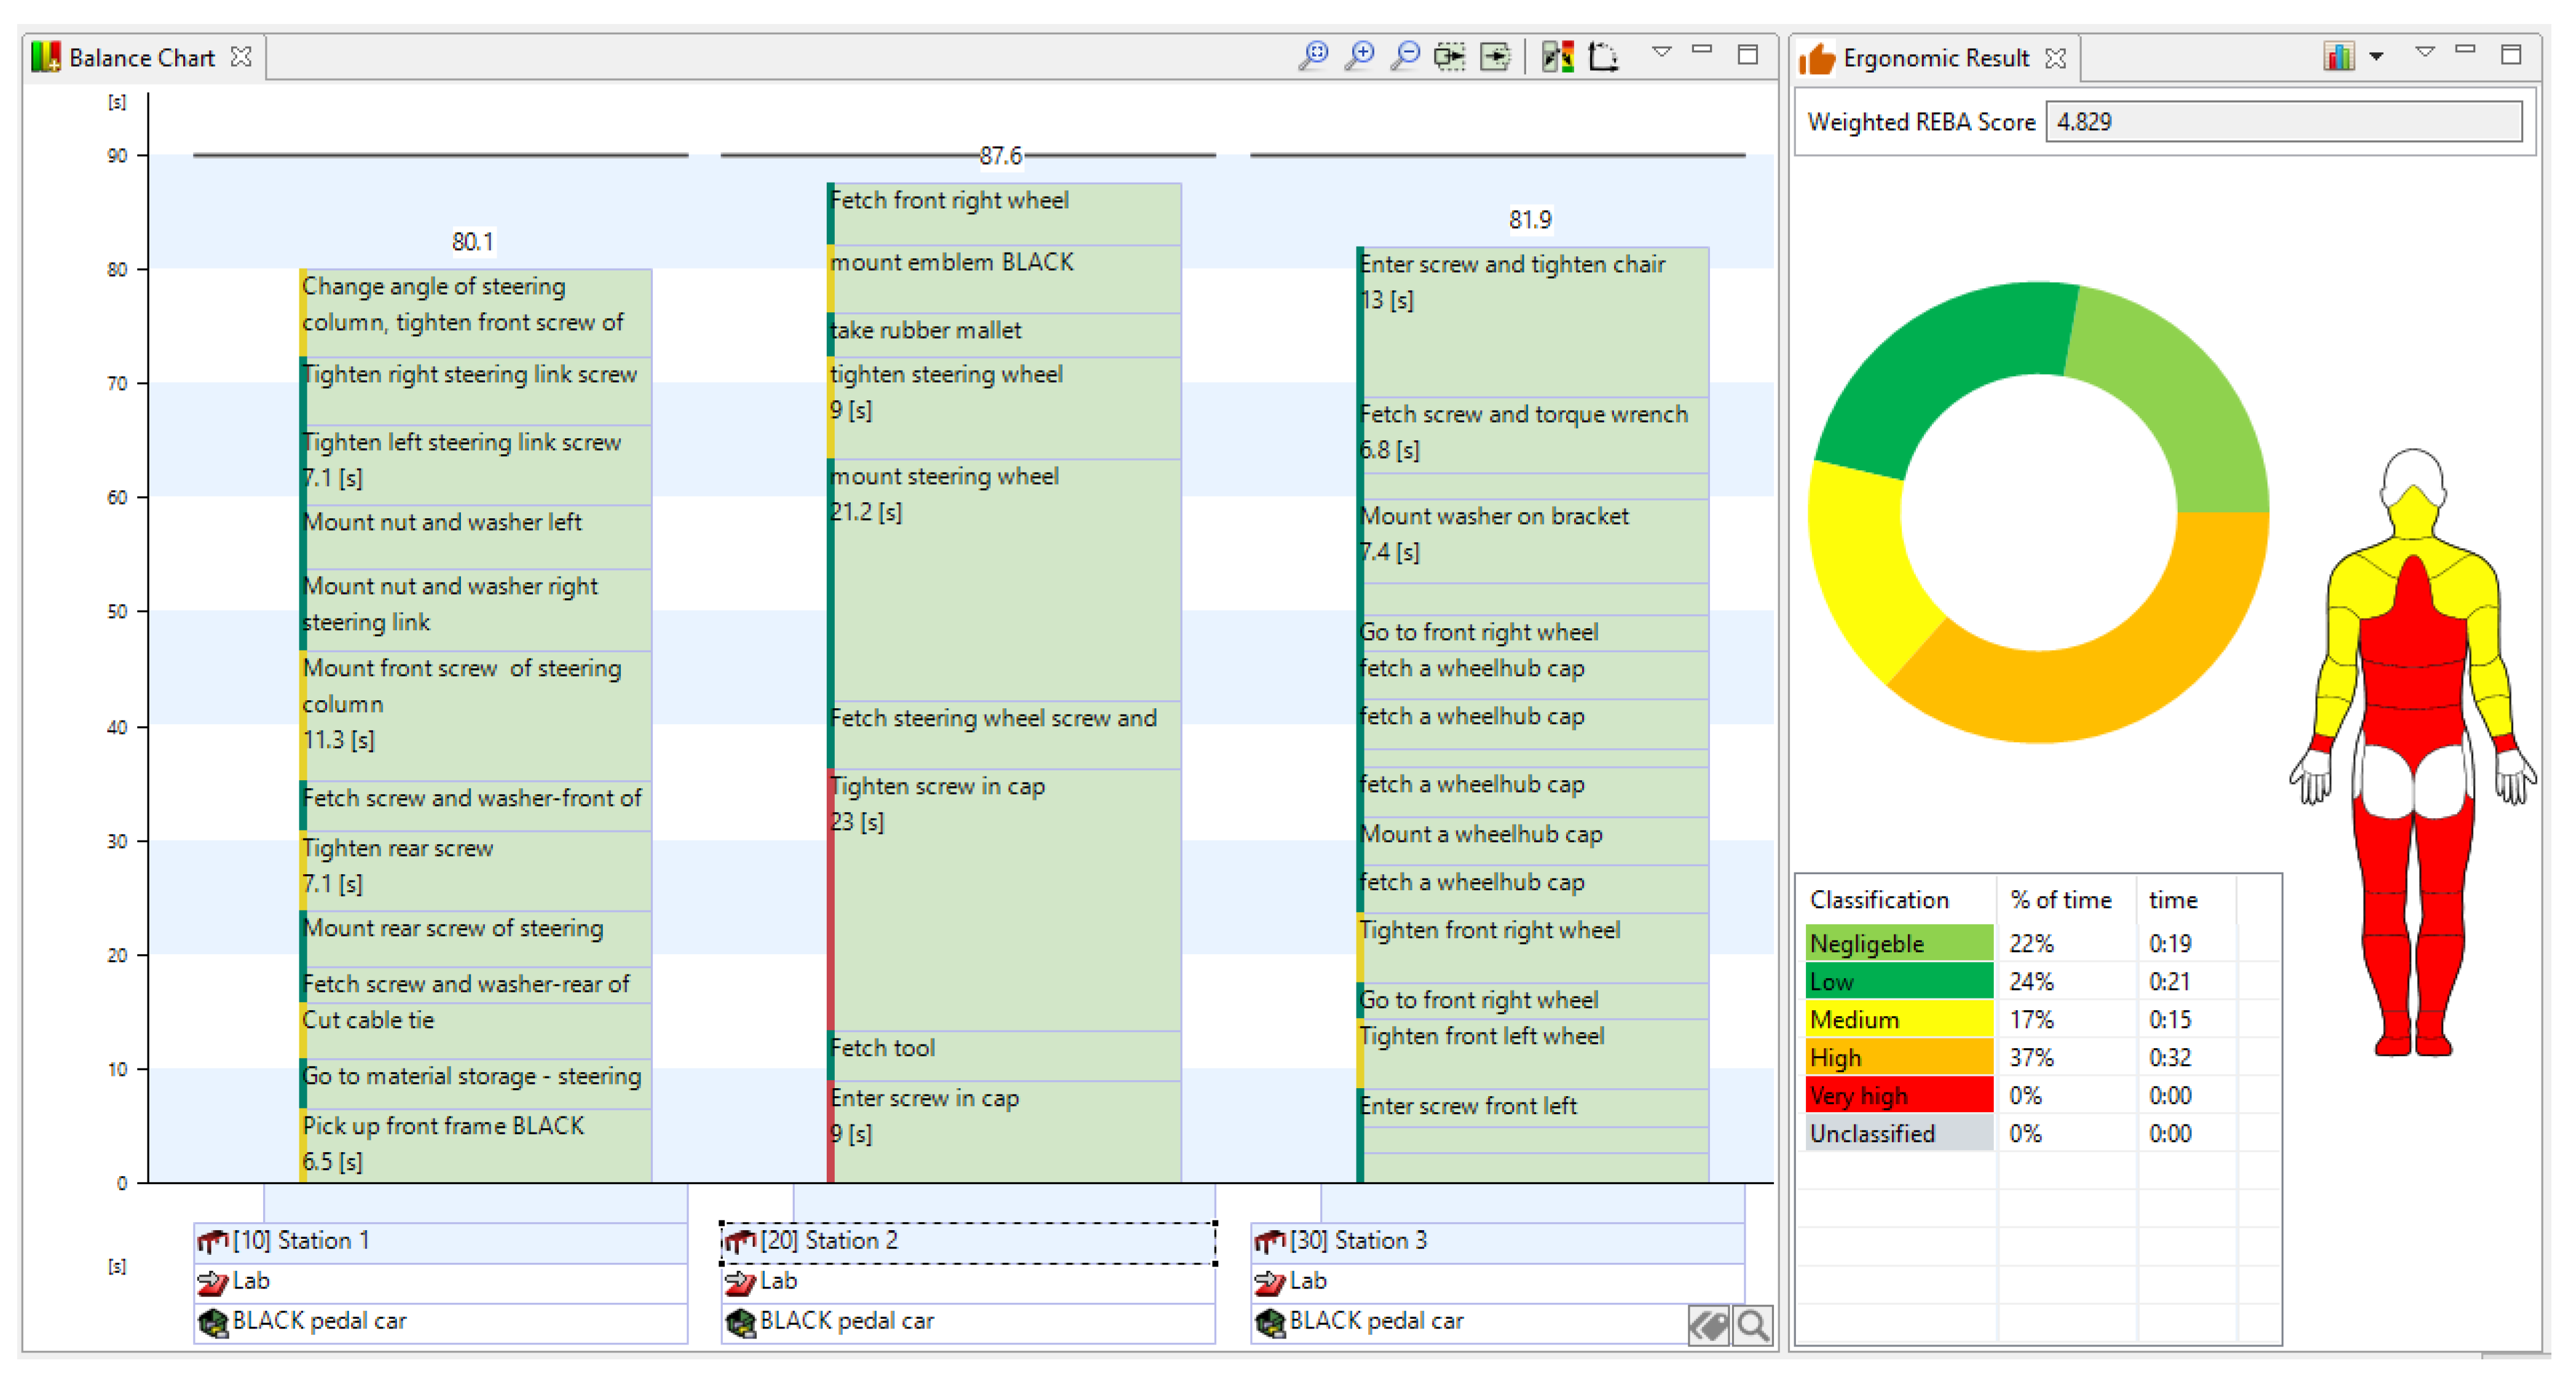
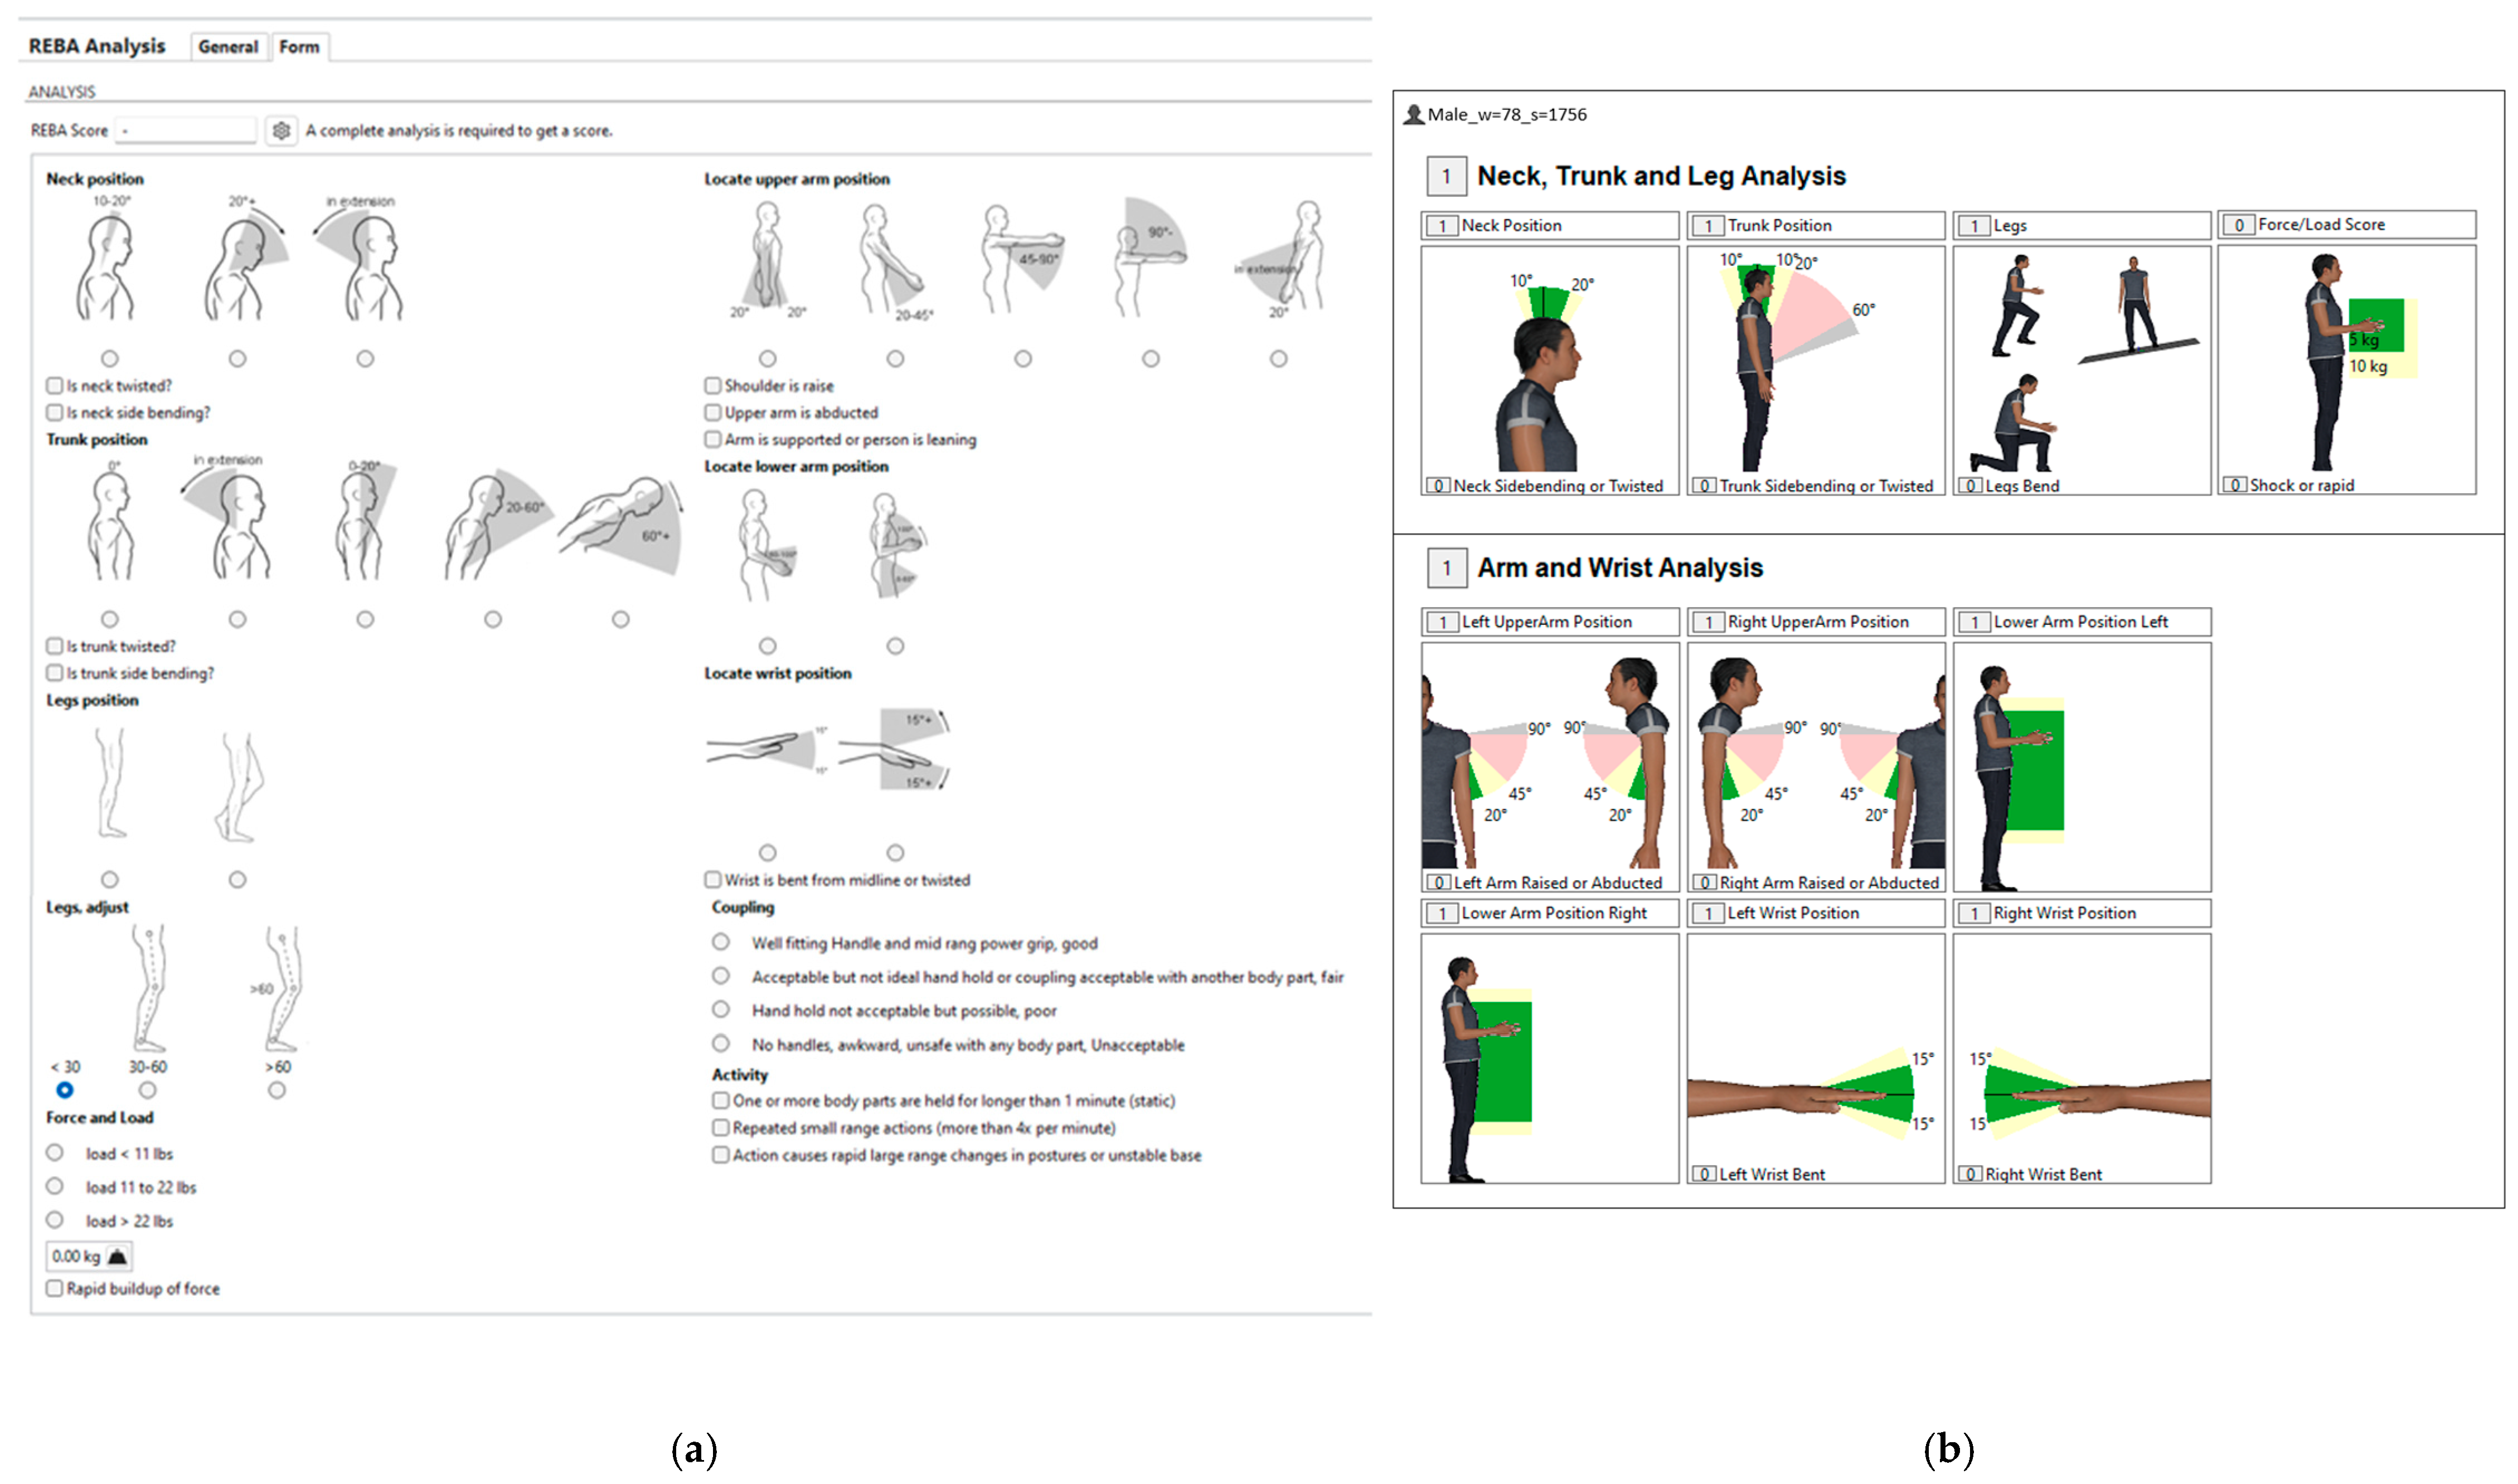
2.1. Software Demonstrator
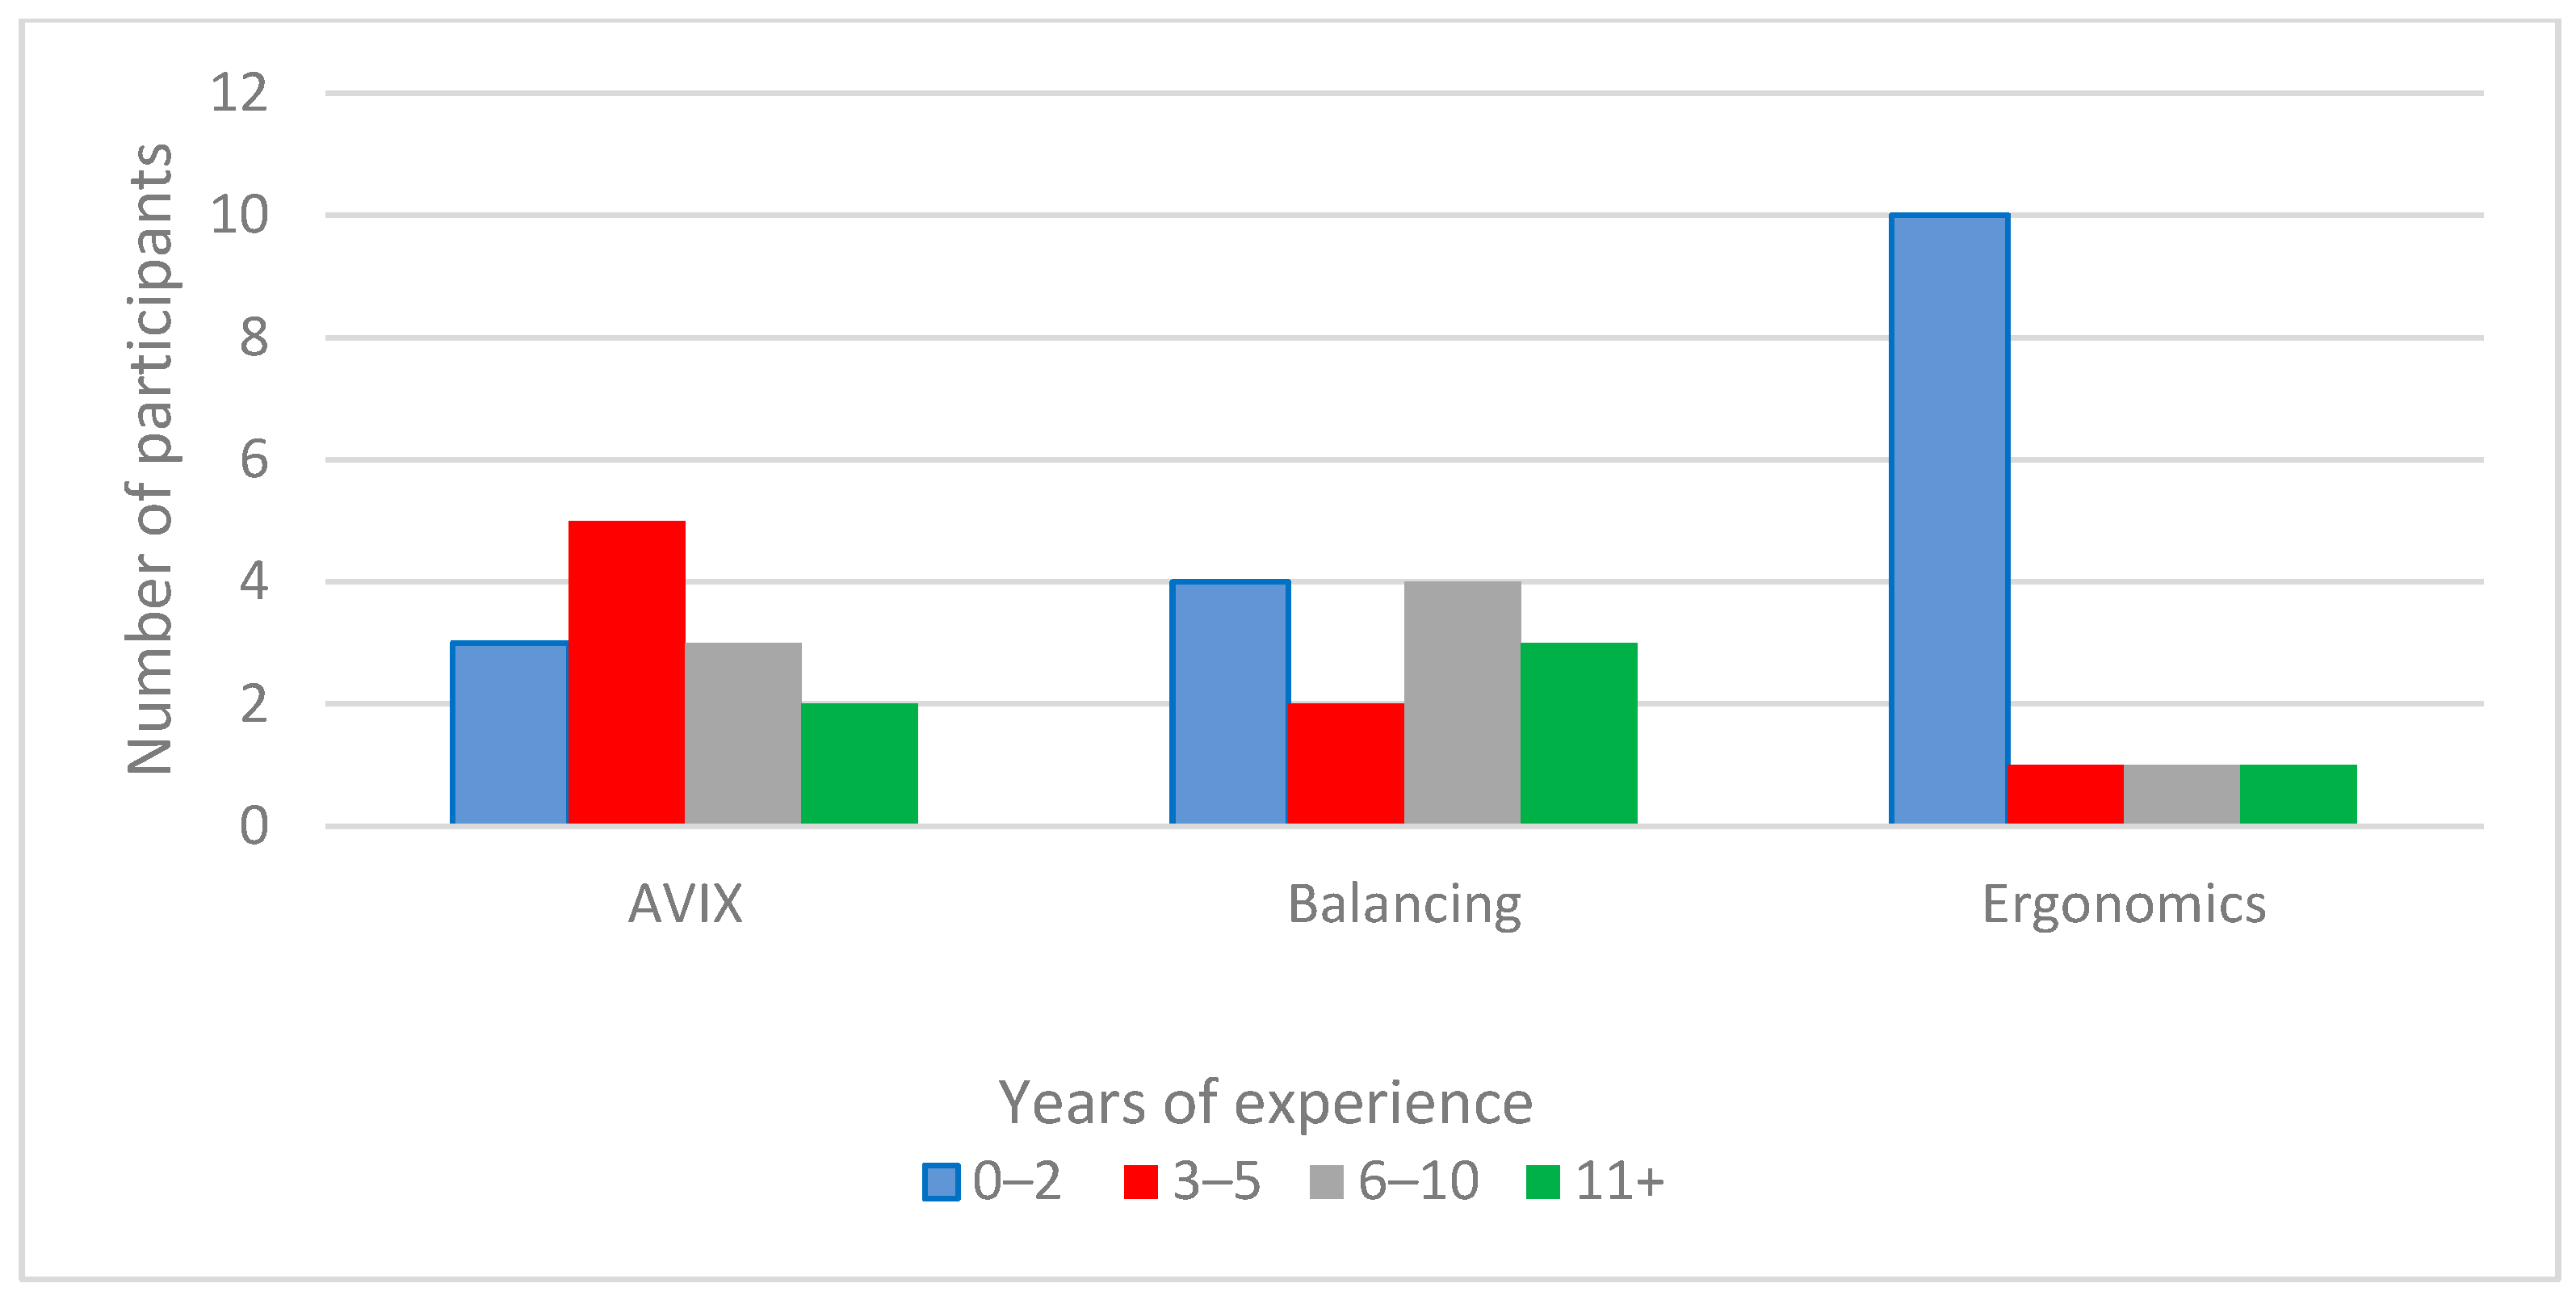
2.2. Test Subjects
2.3. Use Case
2.4. Procedure
2.5. Data Analysis
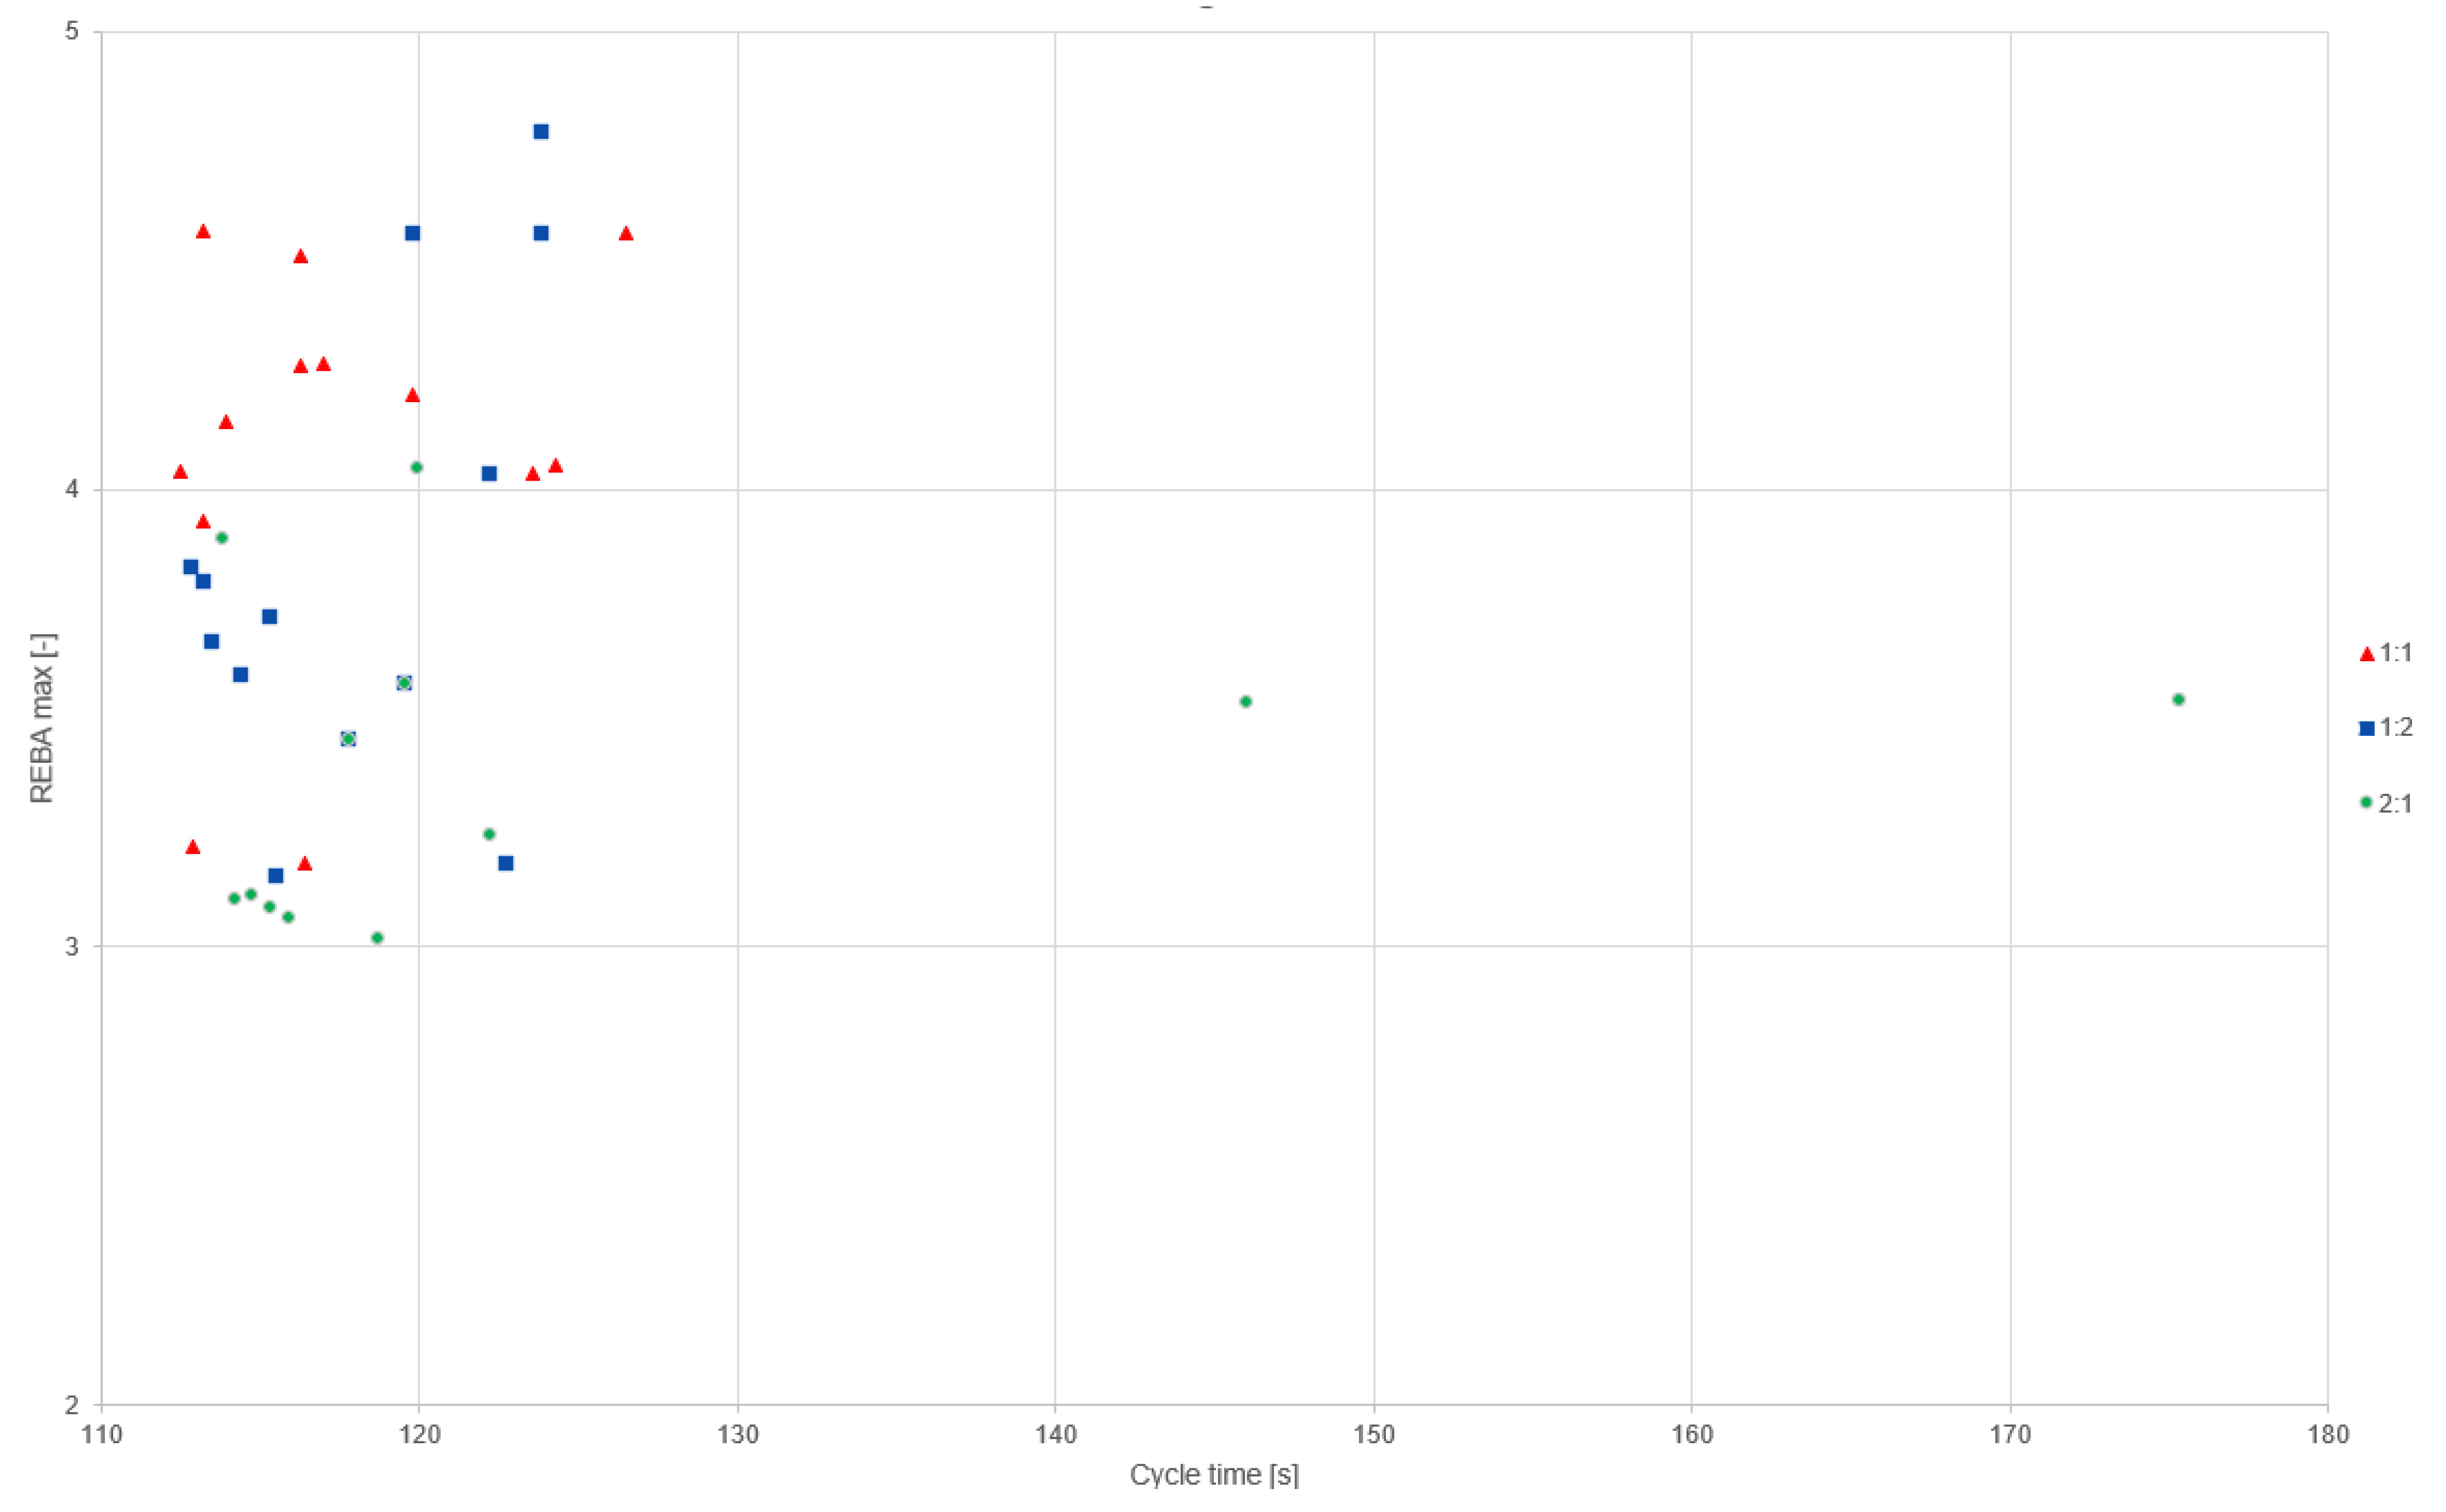
3. Results
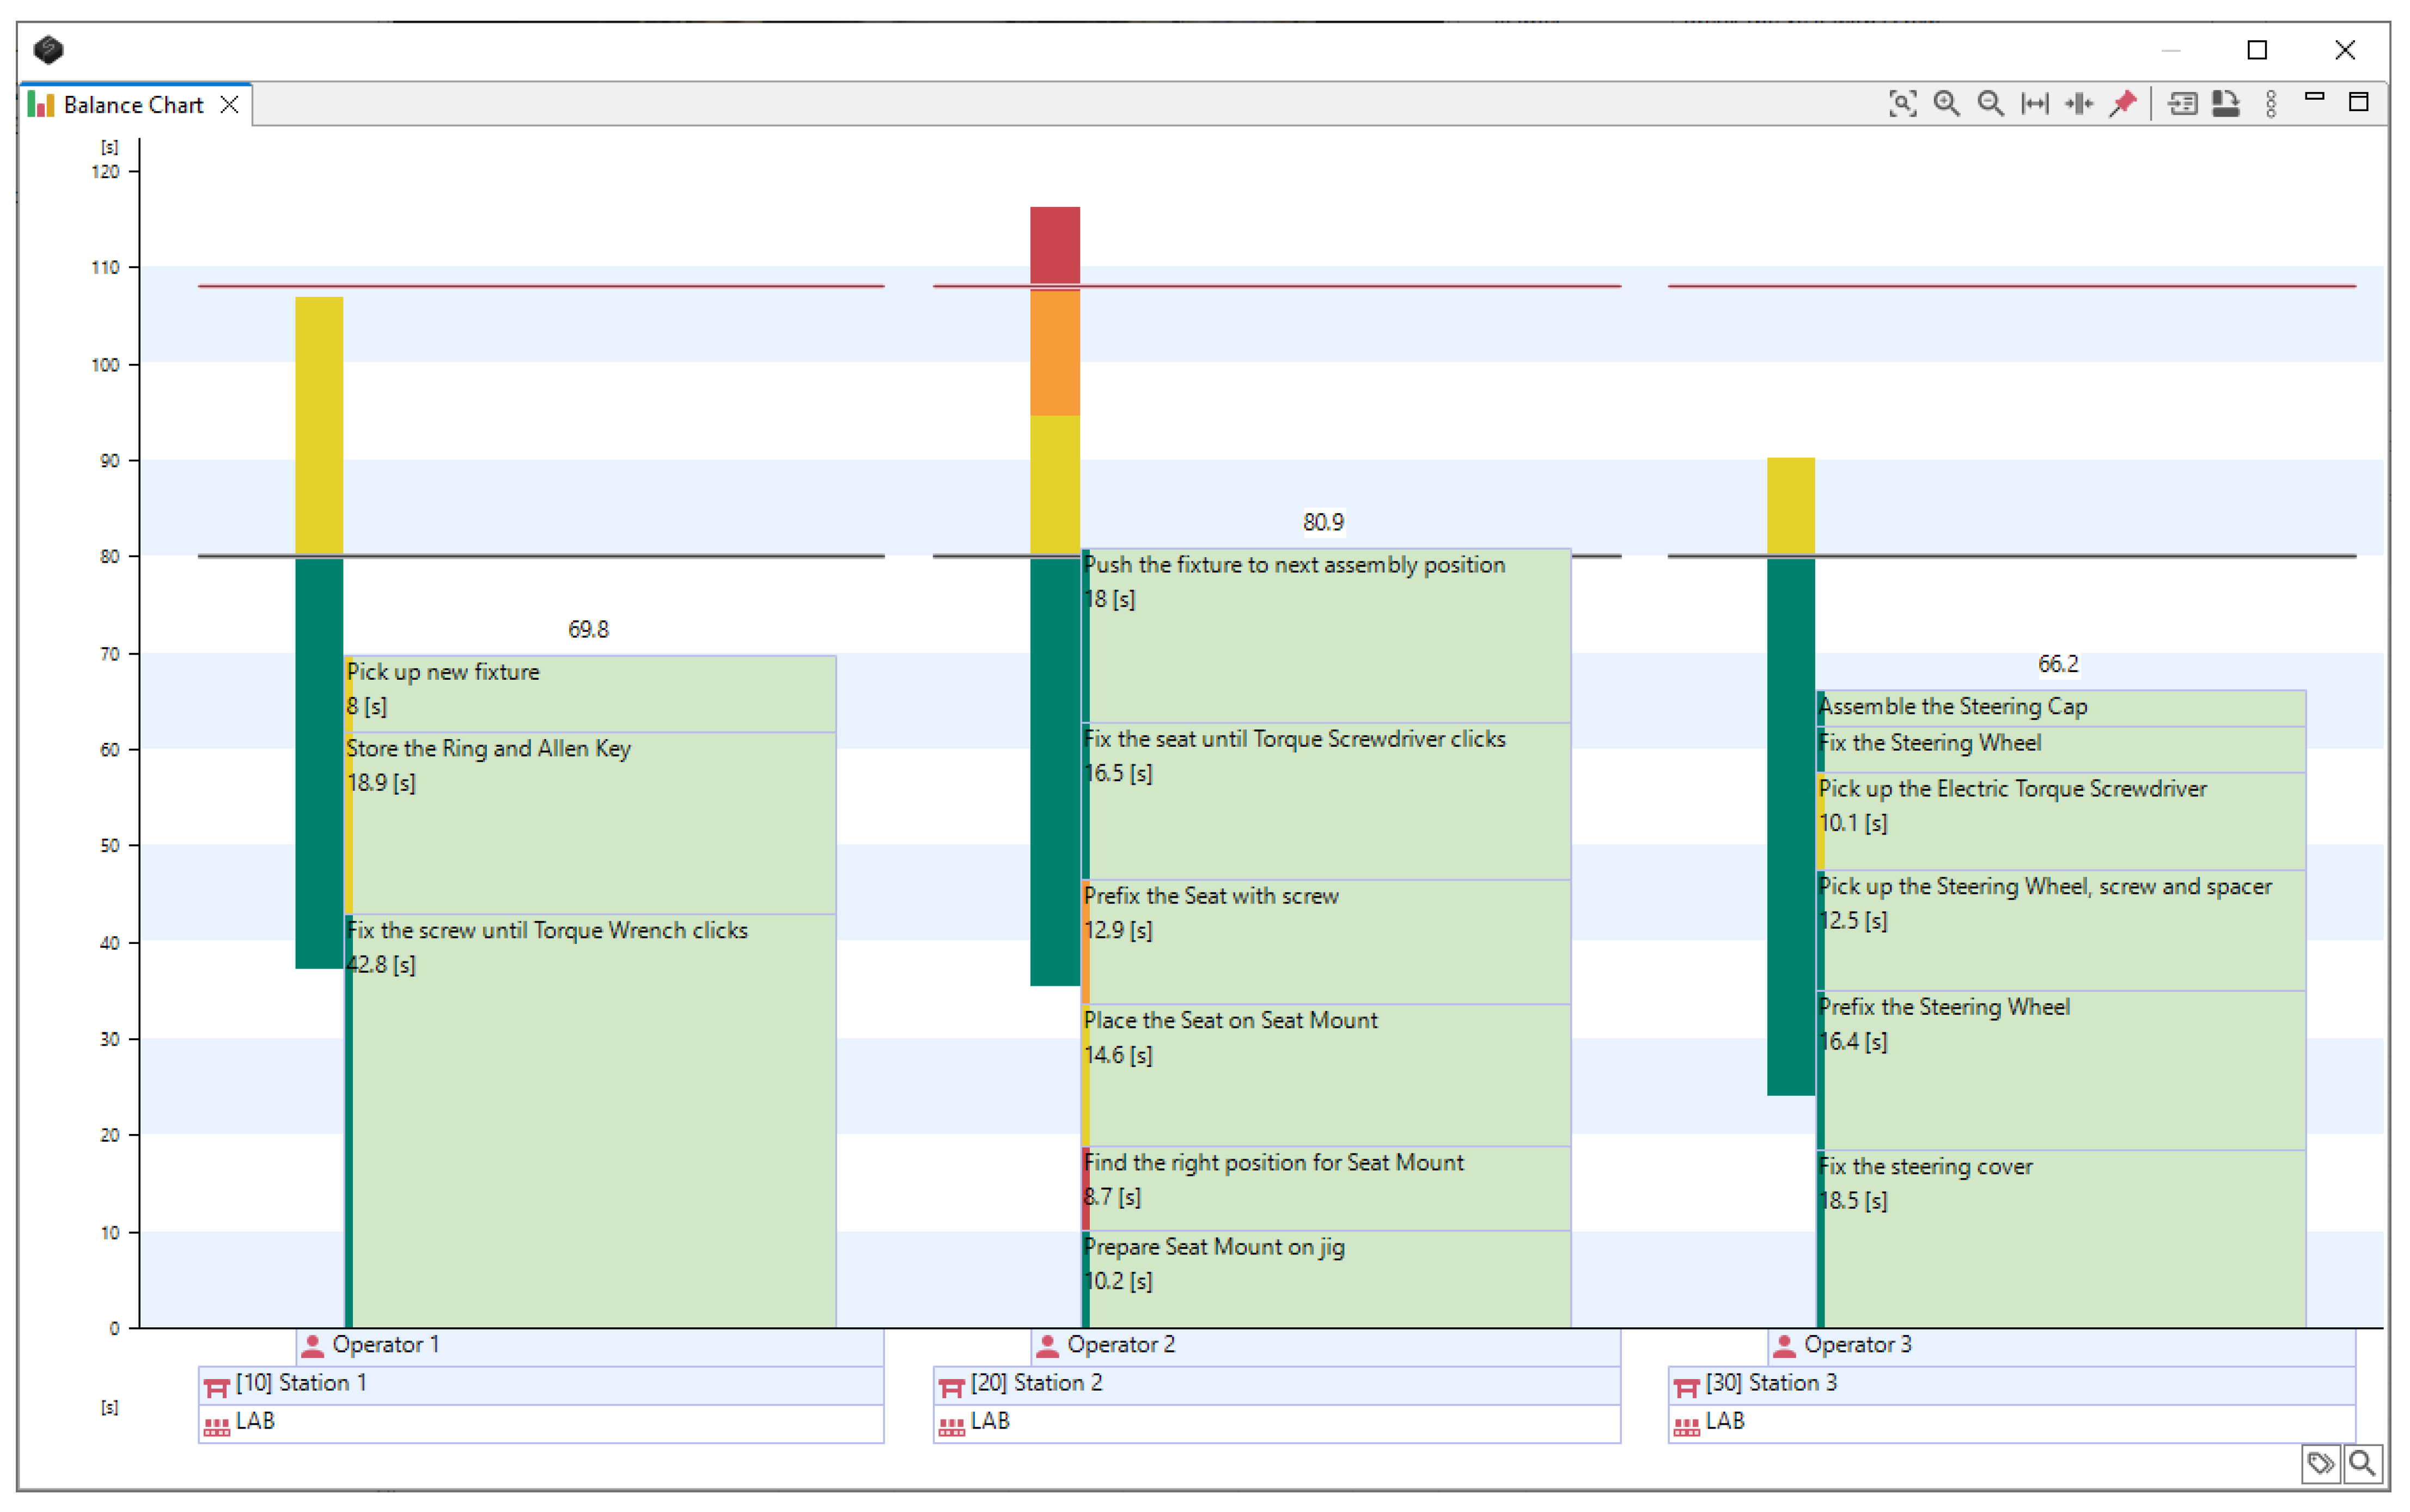
Final Demonstrator
4. Discussion
4.1. Result Considerations
4.2. Method Considerations
4.3. Future Research
5. Conclusions
Author Contributions
Funding
Data Availability Statement
Conflicts of Interest
References
- Falck, A.-C.; Örtengren, R.; Högberg, D. The impact of poor assembly ergonomics on product quality: A cost–benefit analysis in car manufacturing. Hum. Factors Ergon. Manuf. Serv. Ind. 2010, 20, 24–41. [Google Scholar] [CrossRef]
- Wilson, J.R. Fundamentals of ergonomics in theory and practice. Appl. Ergon. 2000, 31, 557–567. [Google Scholar] [CrossRef]
- Neumann, W.P.; Dul, J. Human factors: Spanning the gap between OM & HRM. Int. J. Oper. Prod. Manag. 2010, 30, 923–950. [Google Scholar]
- Andreasen, M.M.; Olsson, F. Integrated product development: New potential products. In Design Policy, Proceedings of the an International Conference on Design Policy Held at the Royal College of Art, London, UK, 20–23 July 1982; Langdon, R., Ed.; Design Council: London, UK, 1984; pp. 86–94. [Google Scholar]
- Rosin, F.; Forget, P.; Lamouri, S.; Pellerin, R. Impacts of Industry 4.0 technologies on Lean principles. Int. J. Prod. Res. 2019, 58, 1644–1661. [Google Scholar] [CrossRef]
- Nahavandi, S. Industry 5.0—A Human-Centric Solution. Sustainability 2019, 11, 4371. [Google Scholar] [CrossRef]
- Negahban, A.; Smith, J.S. Simulation for manufacturing system design and operation: Literature review and analysis. J. Manuf. Syst. 2014, 33, 241–261. [Google Scholar] [CrossRef]
- Abdel-Malek, K.; Arora, J.; Bhatt, R.; Farrell, K.; Murphy, C.; Kriegel, K. Santos: An integrated human modeling and simulation platform. In DHM and Posturography; Scataglini, S., Paul, G., Eds.; Academic Press: Cambridge, MA, USA, 2019; pp. 63–77. [Google Scholar]
- Feyen, R.; Liu, Y.; Chaffin, D.; Jimmerson, G.; Joseph, B. Computer-aided ergonomics: A case study of incorporating ergonomics analyses into workplace design. Appl. Ergon. 2000, 31, 291–300. [Google Scholar] [CrossRef] [PubMed]
- Badler, N.I.; Phillips, C.B.; Webber, B.L. Simulating Humans: Computer Graphics Animation and Control; Oxford University Press: New York, NY, USA, 1993. [Google Scholar]
- Seidl, A. RAMSIS—A New CAD-Tool for Ergonomic Analysis of Vehicles Developed for the German Automotive Industry; SAE Technical Paper 970088; SAE International: Warrendale, PA, USA, 1997. [Google Scholar]
- Högberg, D.; Hanson, L.; Bohlin, R.; Carlson, J.S. Creating and shaping the DHM tool IMMA for ergonomic product and production design. Int. J. Digit. Hum. 2016, 1, 132–152. [Google Scholar] [CrossRef]
- McCauley Bush, P.; Gaines, S.; Gammoh, F.; Wooden, S. A Comparison of Software Tools for Occupational Biomechanics and Ergonomics Research. In Ergonomics: A Systems Approach; Nunes, I.L., Ed.; InTech: Rijeka, Croatia, 2012; pp. 65–118. [Google Scholar]
- Demirel, H.O.; Ahmed, S.; Duffy, V.G. Digital Human Modeling: A Review and Reappraisal of Origins, Present, and Expected Future Methods for Representing Humans Computationally. Int. J. Hum. Comput. Interact. 2022, 38, 897–937. [Google Scholar] [CrossRef]
- Otto, A.; Scholl, A. Incorporating ergonomic risks into assembly line balancing. Eur. J. Oper. Res. 2011, 212, 277–286. [Google Scholar] [CrossRef]
- Waters, T.R.; Baron, S.L.; Piacitelli, L.A.; Anderson, V.P.; Skov, T.; Haring-Sweeney, M.; Fine, L.J. Evaluation of the revised NIOSH lifting equation: A cross-sectional epidemiologic study. Spine 1999, 24, 386–394. [Google Scholar] [CrossRef]
- Occhipinti, E. OCRA: A concise index for the assessment of exposure to repetitive movements of the upper limbs. Ergonomics 1998, 41, 1290–1311. [Google Scholar] [CrossRef] [PubMed]
- Akyol, S.D. Baykasoğlu, A. ErgoALWABP: A multiple-rule based constructive randomized search algorithm for solving assembly line worker assignment and balancing problem under ergonomic risk factors. J. Intell. Manuf. 2019, 30, 291–302. [Google Scholar] [CrossRef]
- Falkenauer, E. Line balancing in the real world. In Proceedings of the International Conference on Product Life Cycle Management (PLM’05); Inderscience Enterprises: Geneva, Switzerland, 2005; pp. 360–370. [Google Scholar]
- Laring, J.; Christmansson, M.; Kadefors, R.; Örtengren, R. ErgoSAM: A preproduction risk identification tool. Hum. Factors Ergon. Manuf. Serv. Ind. 2005, 15, 309–325. [Google Scholar] [CrossRef]
- Perez, J.; Neumann, W.P. Ergonomists’ and Engineers’ Views on the Utility of Virtual Human Factors Tools. Hum. Factors Ergon. Manuf. Serv. Ind. 2015, 25, 279–293. [Google Scholar] [CrossRef]
- Hedman, R.; Almström, P. A state of the art system for managing time data in manual assembly. Int. J. Comput. Integr. Manuf. 2017, 30, 1060–1071. [Google Scholar] [CrossRef]
- Maynard, H.B.; Stegemerten, G.J.; Schwab, J.L. Methods–Time Measurement; McGraw-Hill: New York, NY, USA, 1948. [Google Scholar]
- Matias, A.C. Work Measurement: Principles and Techniques. In Handbook of Industrial Engineering: Technology and Operations Management, 3rd ed.; Salvendy, G., Ed.; John Wiley & Sons: New York, NY, USA, 2001; pp. 1409–1462. [Google Scholar]
- Ljung, O.; Pascual, A.I.; Högberg, D.; Delfs, N.; Forsberg, T.; Johansson, P.; Dahlvik, J.; Sánchez, J.L.J.; Hanson, L. Integration of Simulation and Manufacturing Engineering Software—Allowing Work Place Optimization Based on Time and Ergonomic Parameters. In Proceedings of the 6th International Digital Human Modeling Symposium, DHM2020, Skövde, Sweden, 31 August–2 September 2020; Hanson, L., Högberg, D., Brolin, E., Eds.; IOS Press: Amsterdam, The Netherlands, 2020; pp. 342–347. [Google Scholar]
- Hignett, S.; McAtamney, L. Rapid entire body assessment (REBA). Appl. Ergon. 2000, 31, 201–205. [Google Scholar] [CrossRef]
- de Vin, L.J.; Jacobsson, L.; Odhe, J. Game-based Lean Production training of university students and industrial employees. Procedia Manuf. 2018, 25, 578–585. [Google Scholar] [CrossRef]
- Karhu, O.; Kansi, P.; Kuorinka, I. Correcting working postures in industry: A practical method for analysis. Appl. Ergon. 1977, 8, 199–201. [Google Scholar] [CrossRef] [PubMed]
- McAtamney, L.; Corlett, E.N. RULA: A survey method for the investigation of work-related upper limb disorders. Appl. Ergon. 1993, 24, 91–99. [Google Scholar] [CrossRef] [PubMed]
- Schaub, K.G.; Mühlstedt, J.; Illmann, B.; Bauer, S.; Fritzsche, L.; Wagner, T.; Bullinger-Hoffmann, A.C.; Bruder, R. Ergonomic assessment of automotive assembly tasks with digital human modelling and the ‘ergonomics assessment worksheet’ (EAWS). Int. J. Hum. Factors Model. Simul. 2012, 3, 398–426. [Google Scholar] [CrossRef]
- Caragnano, G.; Fisher, H. MTM—First Time Right; International MTM Directorate; German MTM Association: Hamburg, Germany, 2005. [Google Scholar]


| Time Weighted REBA Score | |||||
|---|---|---|---|---|---|
| Test | Optimization Time [min] | Cycle Time [s] | Sum | Max | |
| A1 | Min | 10 | 113 | 8.9 | 3.2 |
| Mean | 44 | 117 | 9.0 | 4.1 | |
| SD | 34 | 5 | 0.1 | 0.5 | |
| Max | 120 | 127 | 9.3 | 4.6 | |
| A2 | Min | 5 | 113 | 9.0 | 3.2 |
| Mean | 22 | 118 | 9.1 | 3.8 | |
| SD | 14 | 4 | 0.1 | 0.5 | |
| Max | 60 | 124 | 9.5 | 4.8 | |
| B1 | Min | 5 | 114 | 8.6 | 3.0 |
| Mean | 33 | 128 | 8.9 | 3.4 | |
| SD | 20 | 22 | 0.2 | 0.3 | |
| Max | 75 | 175 | 9.1 | 4.1 | |
| A1–A2 | 22 | −1 | −0.1 | 0.3 | |
| A1–B1 | 11 | −11 *** | 0.1 *** | 0.7 *** | |
| A2–B1 | −11 | −10 *** | 0.2 | 0.4 *** | |
| No of Comments Out of 13 | Comments | |
|---|---|---|
| After test 1:1 and 1:2 | 6 | considering only cycle time is the normal way of working |
| 3 | difficult to let go of usual reality restrictions | |
| 3 | hard to work with the precedence graph | |
| 4 | hard to work with uncommon tasks | |
| 6 | normally we only consider cycle time | |
| After test 2:1 | 8 | the way of working is interesting and useful |
| 4 | difficult to optimize several objectives in parallel | |
| 1 | not have enough ergonomics knowledge | |
| Comparing test 1:1 and 1:2 with test 2:1 | 9 | preferred the parallel way of working (2.1) |
| 3 | results were as expected: longer cycle time and improved human well-being in 2.1 | |
| 2 | cycle time becomes too long when musculoskeletal risks are considered at the same time |
Disclaimer/Publisher’s Note: The statements, opinions and data contained in all publications are solely those of the individual author(s) and contributor(s) and not of MDPI and/or the editor(s). MDPI and/or the editor(s) disclaim responsibility for any injury to people or property resulting from any ideas, methods, instructions or products referred to in the content. |
© 2024 by the authors. Licensee MDPI, Basel, Switzerland. This article is an open access article distributed under the terms and conditions of the Creative Commons Attribution (CC BY) license (https://creativecommons.org/licenses/by/4.0/).
Share and Cite
Hanson, L.; Ljung, O.; Högberg, D.; Vollebregt, J.; Jiménez Sánchez, J.-L.; Johansson, P. Enabling Manual Workplace Optimization Based on Cycle Time and Musculoskeletal Risk Parameters. Processes 2024, 12, 2871. https://doi.org/10.3390/pr12122871
Hanson L, Ljung O, Högberg D, Vollebregt J, Jiménez Sánchez J-L, Johansson P. Enabling Manual Workplace Optimization Based on Cycle Time and Musculoskeletal Risk Parameters. Processes. 2024; 12(12):2871. https://doi.org/10.3390/pr12122871
Chicago/Turabian StyleHanson, Lars, Oskar Ljung, Dan Högberg, Janneke Vollebregt, Juan-Luis Jiménez Sánchez, and Pierre Johansson. 2024. "Enabling Manual Workplace Optimization Based on Cycle Time and Musculoskeletal Risk Parameters" Processes 12, no. 12: 2871. https://doi.org/10.3390/pr12122871
APA StyleHanson, L., Ljung, O., Högberg, D., Vollebregt, J., Jiménez Sánchez, J.-L., & Johansson, P. (2024). Enabling Manual Workplace Optimization Based on Cycle Time and Musculoskeletal Risk Parameters. Processes, 12(12), 2871. https://doi.org/10.3390/pr12122871