Article

Study of Mixed Combustion Behavior of Pulverized Municipal Solid Waste and Anthracite Coal

State Key Laboratory of Advanced Metallurgy, University of Science and Technology Beijing, Beijing 100083, China
*
Author to whom correspondence should be addressed.
Processes 2024, 12(12), 2853; https://doi.org/10.3390/pr12122853
Submission received: 18 November 2024 / Revised: 6 December 2024 / Accepted: 10 December 2024 / Published: 12 December 2024
(This article belongs to the Section Environmental and Green Processes)

Abstract

:
The substitution of municipal solid waste (MSW) for pulverized coal reduces the dependence on fossil fuels, lowers production costs in energy-intensive industries, and helps decrease carbon emissions. The primary method of utilizing MSW as fuel is mixed combustion with pulverized coal. This paper employs a thermogravimetric analysis to study the combustion characteristics and perform a kinetic analysis of a mixture of MSW and pulverized anthracite coal. The simulated MSW is composed of three representative components: polyvinyl chloride (PVC), polyethylene (PE), and straw (a typical biomass). The experimental results indicate that the combustion process of MSW is more complex than that of anthracite. The initial ignition temperature of MSW is 334 °C, whereas that of anthracite is 551 °C. As the proportion of MSW increases, the weight loss stages in the combustion curve of the mixture become more numerous, and the ignition temperature gradually decreases. Moreover, the combustion performance of the MSW–anthracite mixture improves, with the combustibility index Rm rising from 0.131 to 0.235. The combustion process of MSW–anthracite mixtures was analyzed using the random pore model (RPM), the unreacted core model (URCM), and the volumetric model (VM). Among these, the VM was found to be the most suitable kinetic model for the combustion process. The activation energies for the combustion processes of anthracite, 20% MSW-80% anthracite, 40% MSW-60% anthracite, 60% MSW-40% anthracite, 80% MSW-20% anthracite, and MSW were calculated to be 152.05 kJ/mol, 80.51 kJ/mol, 51.05 kJ/mol, 40.87 kJ/mol, 33.41 kJ/mol, and 32.17 kJ/mol, respectively. The obtained results indicate that MSW is a high-performance fuel with significant application potential.

1. Introduction

In 2023, China generated 254 million tons of MSW, which is the largest in the world [1]. Issues such as excessive land use and severe secondary pollution from waste disposal processes have become significant factors affecting the quality of life of residents [2,3,4]. Currently, the primary methods for MSW disposal in China are landfilling, thermochemical conversion (including incineration, pyrolysis, and gasification), and biological conversion (such as aerobic composting and anaerobic digestion) [5,6]. It has been estimated that the energy contained in 200 million tons of MSW is equivalent to approximately 50 million tons of standard coal. Therefore, MSW represents an important secondary energy source, and thermochemical conversion methods are particularly suitable for energy recovery [7].
MSW that has undergone a crushing pretreatment exhibits advantages such as improved transport properties, a higher energy density, and faster reaction rates during the thermochemical conversion process [8,9]. Lin et al. [10] conducted a hydrothermal treatment of MSW particles with an initial particle size of 1–2 mm, followed by grinding the MSW to a size of 0.1–0.18 mm. The study found that the hydrothermal treatment could convert MSW into a uniform powder with a low moisture content, regular shapes, and high bulk density. Additionally, the energy content per unit mass of hydrothermally treated MSW increased by 1.01 to 1.41 times. However, the hydrothermal treatment process is discontinuous, and the wastewater produced is challenging to treat. García et al. [11] employed extrusion pelletizing (working pressure of 1.3 MPa) to convert MSW with a particle size of less than 10 mm into refuse-derived fuel pellets with a diameter of 6 mm and a length of 30 mm. This process improved the durability and calorific value of MSW, but the conversion efficiency remained poor when the particle size was larger. The above studies shown that the pretreatment and crushing of MSW can enhance subsequent thermochemical conversion processes. However, challenges such as discontinuous operation, the large particle size, and poor safety hinder its stable application in the blast furnace ironmaking process. The group proposes the “Atmosphere Protection—Low Temperature Heat Treatment—Crushing” process to convert MSW into pulverized fuel. This fuel exhibits weaker jet characteristics and similar fluidity compared to traditional pulverized coal, making it a suitable substitute for pulverized coal in blast furnace injection. The process aims to reduce both costs and carbon emissions in the ironmaking process in blast furnaces [12,13,14].
However, the combustion mechanism of MSW remains unclear. Therefore, this study focuses on investigating the combustion behavior of pulverized MSW fuel, both independently and in combination with pulverized anthracite coal, using a thermogravimetric analyzer. Additionally, the RPM, URCM, and VM models are employed to conduct a kinetic analysis of the combustion reaction of pulverized MSW. This research provides a theoretical foundation for enhancing the efficient utilization of MSW in the blast furnace injection process for ironmaking, as well as in other related industries.

2. Materials and Methods

2.1. Raw Materials

Based on the primary composition of MSW in Beijing [15] shown in Table 1, in this experiment, polyvinyl chloride (PVC) and polyethylene (PE) (China Petroleum and Chemical Co., Ltd., Maoming, China) are used to simulate plastic components. In China, PVC and PE are the main plastic components in MSW, and their contents are almost equal. Straw is used to represent cellulose components such as paper, wood, and bamboo, which are the second largest components after plastic components in MSW. Kitchen waste has not been considered in this paper, as kitchen waste will be sorted out and disposed separately. There are almost no combustible components anymore except for plastic components and cellulose components in China’s MSW. The PVC used in this study is a building model material with a thickness of 1 mm, while the PE is high-density polyethylene transparent cloth. Prior to the experiment, the PVC plates were cut into fragments approximately 5 × 5 mm, and the PE film was cut into fragments of approximately 20 × 20 mm. Wheat straw, the biomass used, was crushed to less than 10 mm to facilitate mixing with the waste plastics. The morphology of the raw materials is shown in Figure 1. All raw materials were dried at 100 °C for 10 h before the experiment.

2.2. Experimental Methods

2.2.1. Heat Treatment and Crushing and Screening

The heat treatment was conducted using a tube furnace. The raw materials were heated at 330 °C in an N2 atmosphere for 30 min, with a mass ratio of PVC/PE/straw of 5 g:5 g:1 g. After heat treatment, the cooled heated sample was crushed for 20 s in a crusher continuously with a rotating speed of 20,000 rpm. The crushed sample was screened and a size smaller than 0.18 mm was used as the raw material for the combustion test. For detailed methods, please refer to the author’s previously published work [14]. During heat treatment, the raw material experienced a weight loss of 5% due to the partial decomposition of the PVC and straw. After cooling to room temperature, the heat-treated product was crushed using a continuous crusher and then sieved with a 45-mesh sieve. The properties of the pulverized heat-treated MSW product and pulverized anthracite are presented in Table 2.

2.2.2. Thermogravimetric Analysis

In this experiment, several test samples were prepared, including 100% MSW (simulated thermally treated pulverized product of MSW), 20% MSW-80% anthracite, 40% MSW-60% anthracite, 60% MSW-40% anthracite, 80% MSW-20% anthracite, and 100% anthracite. These samples were analyzed using a thermogravimetric analyzer (SDT Q600, TA Instruments, New Castle, DE, USA). For each test, 10 mg of the sample (grain size smaller than 0.18 mm) was placed in a corundum crucible (4 mm in diameter and 5 mm in height). The samples were heated from room temperature to 900 °C in air at a heating rate of 10 °C/min, with an air flow rate of 100 mL/min. Additionally, 100 mL/min of argon was introduced as a protective gas during the experiment.
The conversion rate of the sample during the reaction process is defined by the following formula:
x = m 0 m t m 0 m × 100 %
where m0, mt, and m represent the initial mass of the sample, the mass of the sample at time t, and the mass of the residual substance after the reaction, respectively.
To visually illustrate the differences in combustion performance between MSW and anthracite, as well as the impact of MSW on the combustion characteristics of pulverized anthracite, an analysis of the combustion behavior of MSW was first conducted with respect to its ignition temperature (Ti). The definitions used to determine these parameters are provided in the referenced literature [16]. Additionally, the combustion reactivity of each material was evaluated using the method proposed by Okoroigwet [17], as shown in specific Formula (2):
R m = 100 r m a x T m a x
where Rm represents the combustion reactivity index, %·min−1·°C−1; rmax denotes the maximum weight loss rate at various stages, %·min−1; and Tmax indicates the temperature corresponding to the maximum weight loss rate, °C.

2.2.3. Kinetic Model

The random pore model (RPM), volumetric model (VM), and unreacted core model (URCM), which are usually used for kinetic analyses of gas–solid reaction [18,19,20], were employed to study the combustion kinetics of simulated MSW with anthracite. Assuming that the heating rate of the sample is β, the temperature T is
T = T 0 + β t
By substituting Equation (3) into the three models and simplifying, the relationships between the conversion rate x and temperature T for each model can be obtained.
x = 1 exp A T T 0 β exp E R T 1 + A 4 φ T T 0 β exp E R T
x = 1 1 A T T 0 3 β exp E R T 3
x = 1 exp A T T 0 β exp E R T
By combining the above formulas with the combustion test data, the kinetic parameters (E, A, and φ) are determined using nonlinear fitting methods. In the RPM, φ can be directly obtained, while parameters such as L0, ε0, and S0 are not directly involved in the calculations. The obtained kinetic parameters (E, A, and φ) are then substituted into Equations (4)–(6) to calculate the values of x, denoted as xcal,i. The reliability of the kinetic models is evaluated by comparing the calculated values xcal,i with the experimental values xexp,i. The deviation between the experimental and calculated x values can be written as follows:
D E V x = i = 1 N x e x p , i x c a l , i 2 N 1 2 max x e x p × 100 %
where DEV(x) is the relative error, xexp,i is the experimental value of x, xcal,i is the value of x calculated by the three models, and max(x)exp is the maximum value of xexp,i.

3. Results and Discussion

3.1. Comparative Analysis of the Combustion Curves of a Single Fuel

The thermogravimetric curves and ignition temperature analysis of the combustion processes of MSW and anthracite are shown in Figure 2. The thermogravimetric curve for MSW combustion is shown in Figure 2a. The weight loss curve is relatively smooth, indicating that the three components, after heat treatment and crushing, have formed a fuel with relatively uniform physicochemical properties. However, the DTG (derivative thermogravimetric) curve reveals that the combustion process is still divided into multiple weight loss stages with varying rates, each corresponding to different chemical reactions. In contrast, the combustion curve for anthracite (Figure 2b) is very smooth, exhibiting only one weight loss stage throughout the entire combustion process. The initial ignition temperature reflects the ease of ignition of a fuel and serves as an important indicator for evaluating its combustion characteristics [21]. Point A represents the highest peak of the DTG curve. A vertical line is drawn from point A to intersect the TG curve at point B, which corresponds to the point with the maximum slope on the TG curve. A tangent line is drawn at point B to intersect the parallel line of the initial weight loss stage of the TG curve at point C. The temperature corresponding to point C is defined as the initial ignition temperature. It is observed that the initial ignition temperature of MSW is 334 °C, while that of anthracite is 551 °C. This clearly indicates that MSW is significantly more flammable than anthracite.
During the preparation of pulverized MSW products, the raw materials undergo a degree of pyrolysis. Due to the relatively low temperature, the loss of volatile matter is minimal. The volatile matter content of MSW remains high at 75.81%. Consequently, the combustion process of MSW first involves a pyrolysis reaction, and the properties of the different raw materials affect the combustion behavior of MSW. The pyrolysis behaviors of PE, PVC, and straw are shown in Figure 3. Based on the combustion curve of MSW and the pyrolysis weight loss curves for PE, PVC, and straw, the weight loss process during the combustion of MSW can be divided into three distinct stages. The weight loss in the first stage is primarily attributed to the release of volatile matter from PVC and straw. In the second stage, the weight loss is mainly due to the rapid combustion of the pyrolysis char. The weight loss observed in the third stage is primarily caused by the reaction of PVC. However, since the combustion of pyrolysis char is not fully complete before this stage, the combustion of pyrolysis char also contributes to the weight loss in this phase. According to the authors’ previous research, the reaction of PVC in the third stage primarily involves the decomposition of carbonates [22].

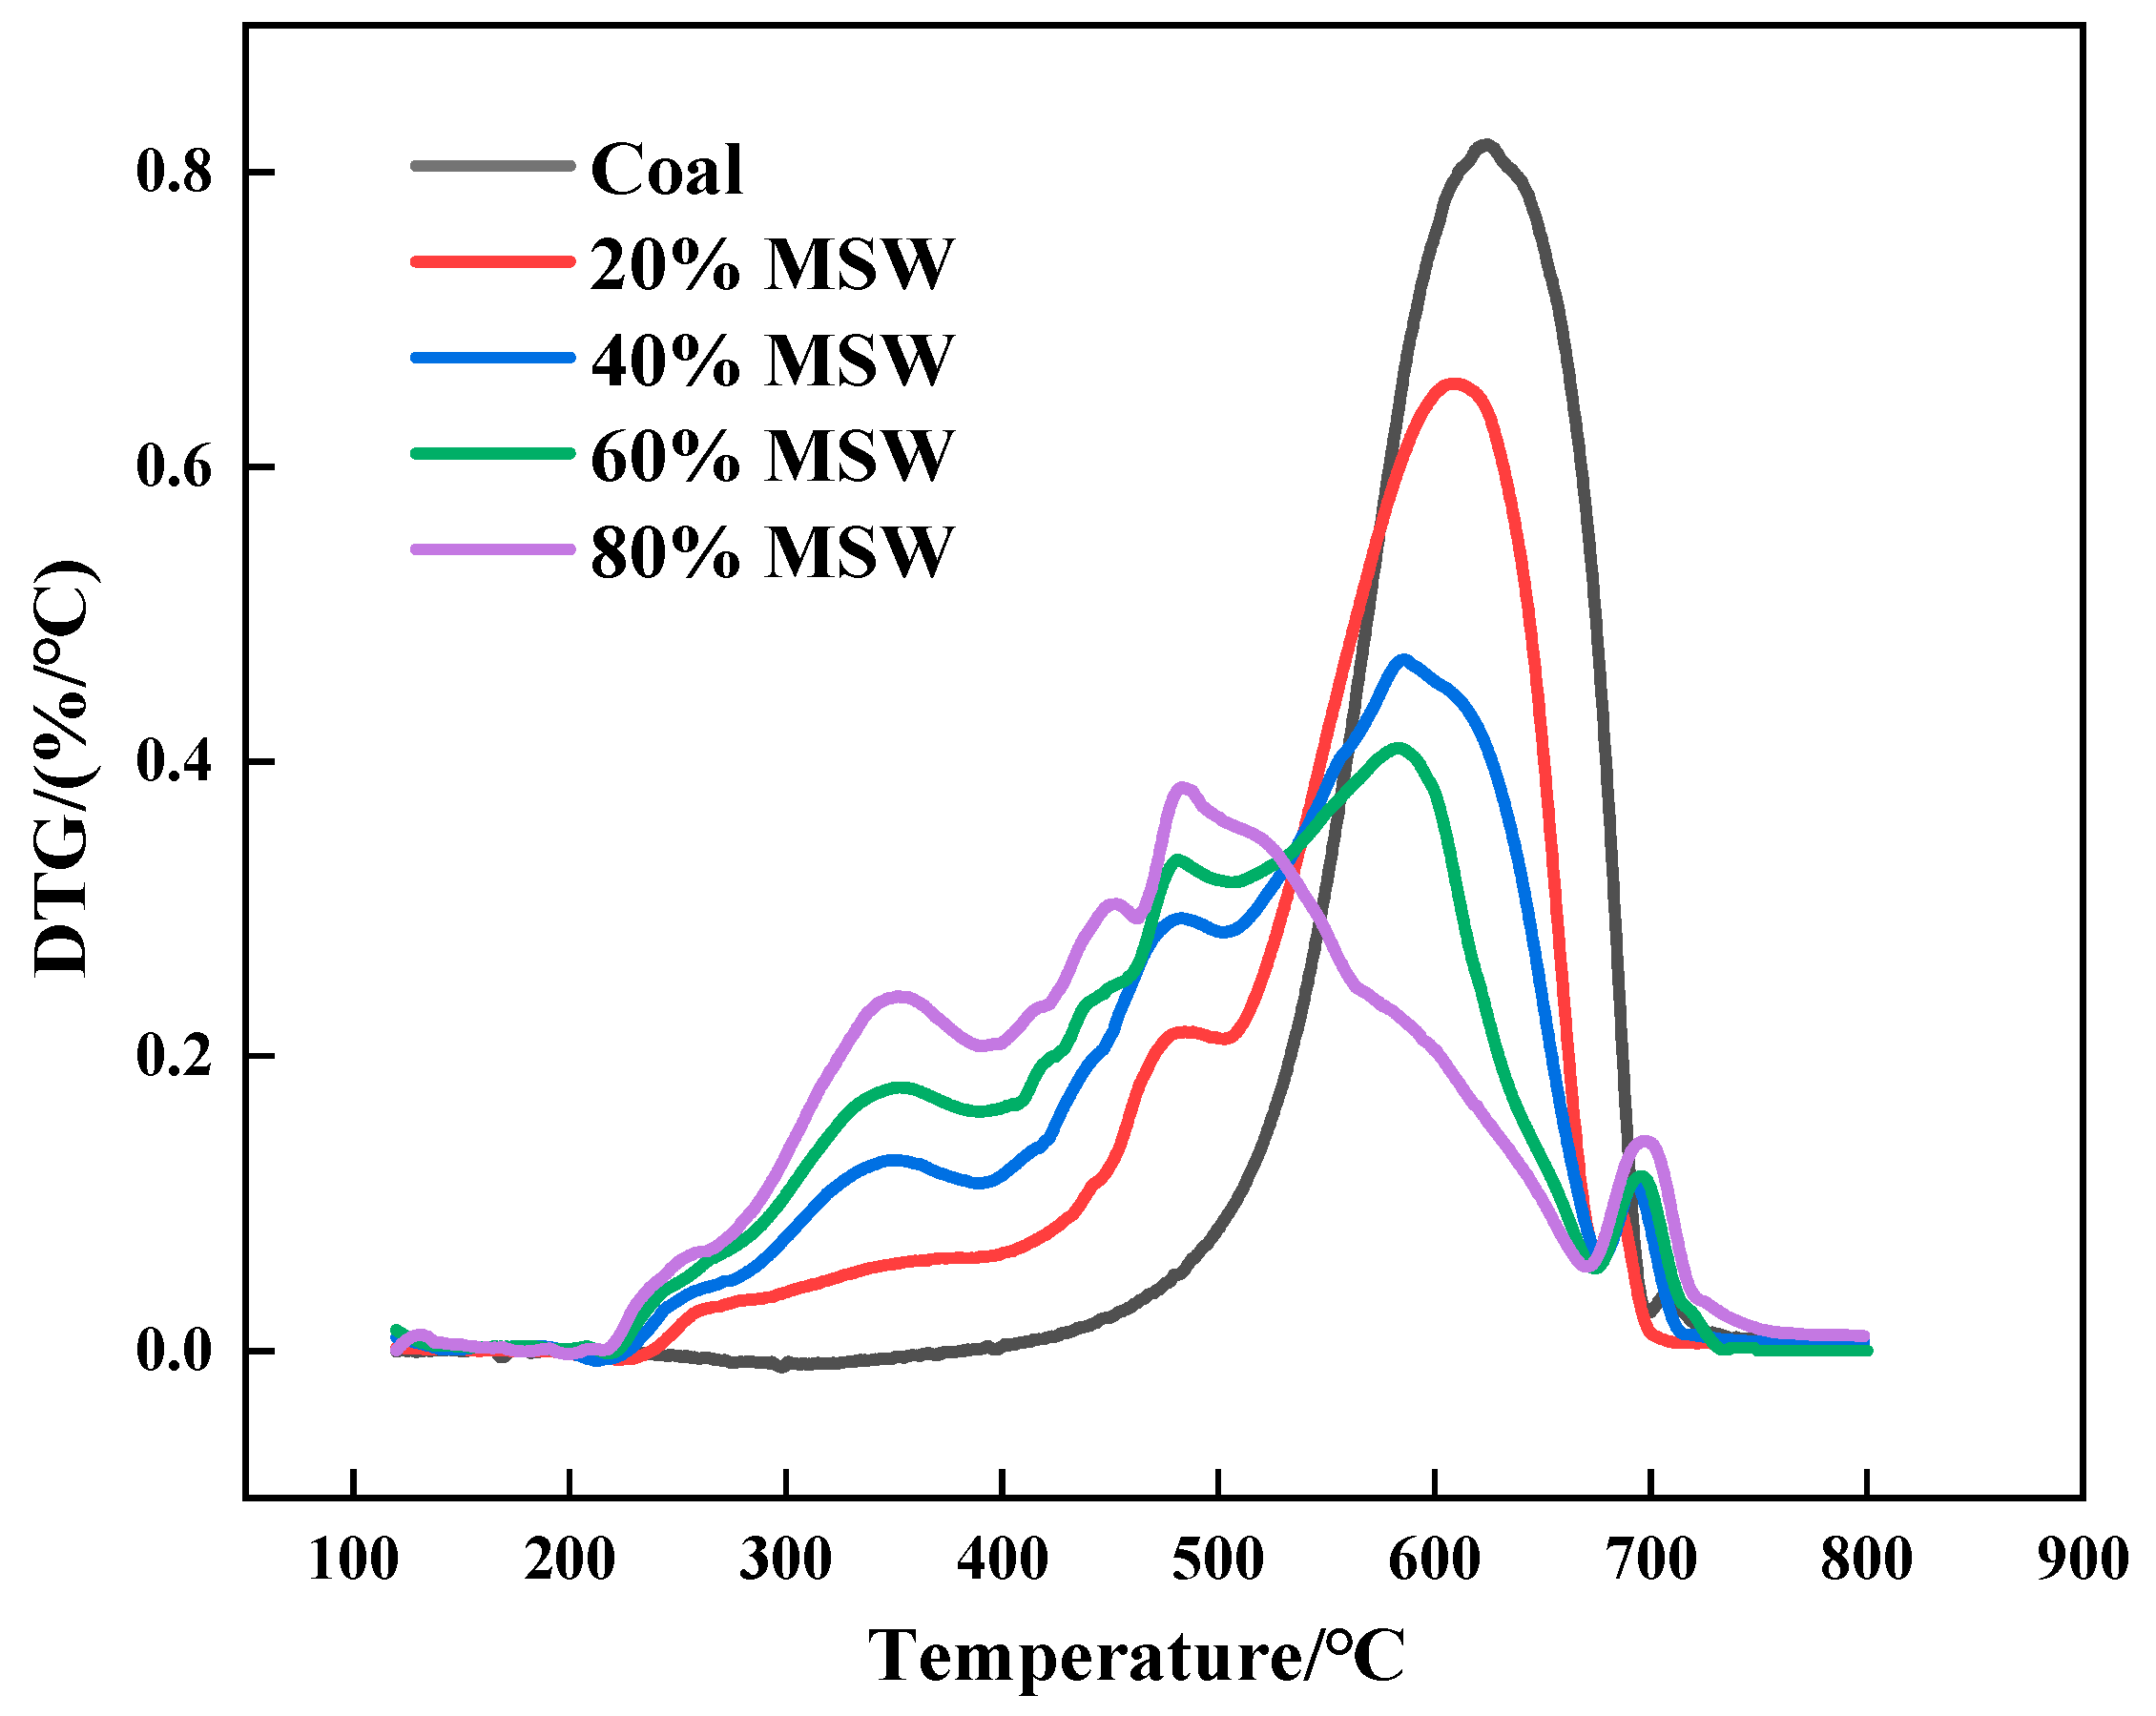
3.2. Characteristic Analysis of the Combustion Curves of MSW–Pulverized Anthracite Mixtures

The conversion rate curves for the combustion of mixtures of MSW and anthracite are shown in Figure 4. The combustion curve of a 20% MSW and 80% anthracite mixture closely resembles that of anthracite. However, as the proportion of MSW increases, the number of weight loss stages in the combustion curve also increases. For samples containing 40% MSW-60% anthracite, 60% MSW-40% anthracite, and 80% MSW-20% anthracite, the weight loss due to the combustion of volatile matter increases compared to anthracite, which primarily burns its fixed carbon. The volatile matter promotes combustion at lower temperatures, leading to the formation of two distinct combustion phases: the combustion of volatile matter and the combustion of fixed carbon. Additionally, when the MSW content is high, even with uniform mixing with anthracite, MSW may combust separately [23].
With the increase in the proportion of MSW, the ignition temperature gradually decreases. Similar results have also been obtained in other studies of the co-combustion of anthracite and MSW [21,24]. The high volatile content in MSW causes the combustibles on the particle surface to accumulate significantly during the initial heating process. Therefore, a mixture of MSW and anthracite can reach the ignition state at a relatively low temperature. Moreover, as the amount of MSW in the mixture increases, the reduction in the ignition temperature of the mixture becomes more significant. This is because the early combustion of volatiles in MSW raises the particle surface temperature, facilitating the premature release and combustion of volatiles in anthracite [21]. Furthermore, by comparing the reaction rates of anthracite at 500 °C and a mixture of 20% MSW-80% anthracite, we can roughly assess the influence of MSW on the combustibility of pulverized anthracite. At 500 °C, the reaction rates of anthracite and a mixture of 20% MSW-80% anthracite are 0.01 and 0.21, respectively. In other words, at this point, the anthracite has just begun to combust, while the mixture sample of 20% MSW-80% anthracite has already combusted by 20%. The MSW has not completely combusted at 500 °C, and the combustible components of the 20% MSW-80% anthracite only account for 18.43% of the mixture. Therefore, it can be inferred that at 500 °C, a significant proportion of the anthracite in the 20% MSW-80% anthracite mixture sample has already begun to combust. Compared to anthracite, the components of MSW exhibit high reactivity, which accelerates the combustion rate of the anthracite when mixed with MSW [25,26]. Additionally, an analysis of the endpoint of the combustion curves reveals that the proportion of MSW has little impact on the burnout temperature of anthracite.

3.3. Quantitative Analysis of the Effect of MSW on the Combustibility of Pulverized Anthracite

A differential thermogravimetric (DTG) analysis was conducted on the combustion conversion curves of the MSW–anthracite mixtures, as shown in Figure 5. Based on Equation (2), the weight loss process during the reaction is segmented according to changes in the reaction rate, which results in several peaks on the differential curve. Due to the differing combustion characteristics of the raw materials, both the number of segments and the temperature ranges for each segment vary. For example, the combustion process of anthracite consists of only one segment. As the proportion of granulated MSW products increases, the temperature at which the maximum weight loss rate occurs gradually decreases. The increase in the number of segments in the weight loss rate, which corresponds to the number of peaks on the differential curve, indicates that the combustion process becomes increasingly complex as the proportion of MSW increases.
The characteristic combustion parameters for different proportions of MSW are presented in Table 3. Taking the DTG curve of the gasification of an 80% MSW-20% anthracite mixture as an example, Tmax1, Tmax2, Tmax3, and Tmax4 represent the temperatures corresponding to the maximum weight loss rates of the first, second, third, and fourth peaks, respectively. rmax1, rmax2, rmax3, and rmax4 are the maximum weight loss rates corresponding to the first, second, third, and fourth peaks, respectively. Rm represents the combustion reactivity, %/(min·°C). Rm characterizes the combustion properties of each sample, providing an overview of the entire process from the ignition to the burnout of the material. A higher Rm value indicates better fuel combustion performance. The order of Rm values from highest to lowest is as follows: 80% MSW > 60% MSW > 40% MSW > 20% MSW > anthracite. With the increase in the mixing ratio of MSW, the index Rm exhibits an upward trend, rising from 0.131 to 0.235. This indicates that increasing the proportion of MSW significantly improves the combustion performance of the mixed fuel; in other words, the combustion performance of anthracite is enhanced.

3.4. Kinetic Analysis of the Combustion Process of MSW–Pulverized Anthracite Mixtures

By employing nonlinear fitting methods to fit the combustion process data for MSW–anthracite, we can obtain the kinetic parameters of the three models, including the activation energy E, pre-exponential factor A, reaction mechanism function φ, and coefficient of determination R². The specific values of these kinetic parameters are listed in Table 4. In this paper, the square of the correlation coefficient, R², is used to evaluate the goodness of fit of each kinetic model. It can be observed that the R² value of the URCM is the lowest, indicating that this model is not suitable for describing the combustion reaction of MSW and anthracite. On the other hand, the R² value of the VM model is slightly higher than that of the RPM, suggesting that the VM is the most suitable for describing the combustion reaction of the mixed MSW and anthracite system. The URCM model assumes that the particle is a solid sphere or cylinder, and when the outer surface of the particle is completely reacted, a layer of ash forms, with the reaction surface advancing toward the unreacted core of the particle. The gasifying agent only reacts at the particle surface and does not penetrate into the interior of the particle. The URCM model fails to consider the evolution of the pore structure during the reaction [27]. As a porous material, coal has a pore surface area far exceeding its outer particle surface area. The results of this study indicate that pores need to be considered in the combustion process of MSW–anthracite mixtures. Furthermore, the raw materials used in this study are relatively fine in particle size, and MSW enhances the combustion of coal dust, resulting in a faster reaction rate. Therefore, the VM model and the RPM model are more suitable for describing the combustion reaction of MSW–anthracite mixtures.
Furthermore, to more clearly illustrate the difference between the experimental and calculated conversion rates, this study quantifies the deviation between the two by comparing the experimental and calculated conversion curves. The relative errors are shown in Table 5. The URCM exhibits the largest relative error, which agrees well with the results in Table 4. The relative errors of the VM and RPM models are relatively close, with the VM model displaying a slightly lower relative error.
As shown in Table 4, the activation energies calculated using the VM model are as follows: 152.05 kJ/mol for anthracite, 80.51 kJ/mol for the 20% MSW-80% anthracite mixture, 51.05 kJ/mol for the 40% MSW-60% anthracite mixture, 40.87 kJ/mol for the 60% MSW-40% anthracite mixture, 33.41 kJ/mol for the 80% MSW-20% anthracite mixture, and 32.17 kJ/mol for MSW. The activation energy of MSW is the lowest, and the activation energy of the anthracite–MSW mixture decreases significantly as the proportion of MSW increases. Furthermore, as the proportion of MSW increases, the activation energy of the mixture gradually decreases. A lower activation energy indicates better combustibility, and so MSW enhances the combustibility of anthracite. The obtained activation energy values can be used for a subsequent numerical simulation and analysis of the tuyere raceway zone during the process of the blast furnace injection of MSW–anthracite mixtures.

4. Conclusions

The combustion behavior of pulverized MSW with pulverized anthracite coal at different percentages has been investigated in this paper by TGA and a kinetic analysis to help with the efficient utilization of MSW as alternative fuel. The main results and conclusions are as follows:
(1)
Compared to anthracite, the weight loss curve for the combustion process of MSW, though smooth, is divided into multiple stages, whereas anthracite experiences weight loss in only one stage. This indicates that the combustion process of MSW is more complex. The initial ignition temperature of MSW is 334 °C, while that of anthracite is 551 °C, suggesting that MSW has better combustibility than anthracite.
(2)
As the proportion of MSW increases, the number of weight loss stages in the combustion curve of the mixture increases, and the ignition temperature gradually decreases. When the MSW proportion is 20%, the combustion curve closely resembles that of anthracite. The injection of MSW promotes the combustion of anthracite powder.
(3)
By calculating the Rm, the co-combustion process of MSW and anthracite has been quantitatively characterized. As the mixing ratio of MSW increases, the index Rm exhibits an upward trend, rising from 0.131 to 0.235. By increasing the proportion of MSW in the mixture, the combustion performance of the mixed fuel is significantly enhanced.
(4)
The combustion process of MSW and anthracite mixture was fitted using the RPM, URCM, and VM. The results indicate that the VM is the most suitable for describing the co-combustion process of MSW and anthracite. As the proportion of MSW increases, the activation energy of the combustion process gradually decreases from 152.05 kJ/mol to 32.17 kJ/mol.

Author Contributions

X.Z. performed the experiments and prepared the original draft. G.W. designed the experiments and results analysis, acquired the funding, and prepared the draft. J.W. and Q.X. administrated the project, supervised the experiments, and reviewed the manuscript. All authors have read and agreed to the published version of the manuscript.

Funding

The work was supported by the National Natural Science Foundation of China, grant number 51804024, and the Fundamental Research Funds for the Central Universities, grant number FRF-IC-20-09.

Data Availability Statement

The data presented in this study are available upon request.

Acknowledgments

The authors wish to acknowledge the contributions of our associates and colleagues at University of Science and Technology Beijing.

Conflicts of Interest

The authors declare no conflicts of interest.

References

  1. National Bureau of China. Available online: https://www.stats.gov.cn/sj/ndsj/2024/indexch.htm (accessed on 18 November 2024).
  2. Zhang, G.; Liu, K.; Lv, L.; Gao, W.; Li, W.; Ren, Z.; Yan, W.; Wang, P.; Liu, X.; Sun, L. Enhanced landfill process based on leachate recirculation and micro-aeration: A comprehensive technical, environmental, and economic assessment. Sci. Total Environ. 2023, 857, 159535. [Google Scholar] [CrossRef] [PubMed]
  3. He, J.N.; Liu, Y.L.; Li, L.L.; Qiu, Z.W. Energy consumption analysis of municipal solid waste classification and transportation. Environ. Eng. 2021, 39, 136–142. [Google Scholar]
  4. Deng, H.; Zhang, D.; Yu, H.; Man, Y.; Wang, Y. Assessing life-cycle GHG emissions of recycled paper products under imported solid waste ban in China: A case study. Sci. Total Environ. 2023, 891, 164407. [Google Scholar] [CrossRef]
  5. Liu, J.; Zheng, L. Structure characteristics and development sustainability of municipal solid waste treatment in China. Ecol. Indic. 2023, 152, 110391. [Google Scholar] [CrossRef]
  6. Moya, D.; Aldás, C.; López, G.; Kaparaju, P. Municipal solid waste as a valuable renewable energy resource: A worldwide opportunity of energy recovery by using Waste-To-Energy Technologies. Energy Procedia 2017, 134, 286–295. [Google Scholar] [CrossRef]
  7. Agarwal, M.; Tardio, J.; Venkata Mohan, S. Critical analysis of pyrolysis process with cellulosic based municipal waste as renewable source in energy and technical perspective. Bioresour. Technol. 2013, 147, 361–368. [Google Scholar] [CrossRef] [PubMed]
  8. Wei, L.; Xu, S.; Zhang, L.; Zhang, H.; Liu, C.; Zhu, H.; Liu, S. Characteristics of fast pyrolysis of biomass in a free fall reactor. Fuel Process. Technol. 2006, 87, 863–871. [Google Scholar] [CrossRef]
  9. Hernández, J.J.; Aranda-Almansa, G.; Bula, A. Gasification of biomass wastes in an entrained flow gasifier: Effect of the particle size and the residence time. Fuel Process. Technol. 2010, 91, 681–692. [Google Scholar] [CrossRef]
  10. Lu, L.; Namioka, T.; Yoshikawa, K. Effects of hydrothermal treatment on characteristics and combustion behaviors of municipal solid wastes. Appl. Energy 2011, 88, 3659–3664. [Google Scholar] [CrossRef]
  11. García, R.; González-Vázquez, M.; Rubiera, F.; Pevida, C.; Gil, M. Co-pelletization of pine sawdust and refused derived fuel (RDF) to high-quality waste-derived pellets. J. Clean. Prod. 2021, 328, 129635. [Google Scholar] [CrossRef]
  12. Wang, G.; Wang, J.S.; Xue, Q.G. Efficient utilization of waste plastics as raw material for metallic iron and syngas production by combining heat treatment pulverization and direct reduction. Process Saf. Environ. Prot. 2020, 137, 49–57. [Google Scholar]
  13. Zhang, H.; Wang, G.; Wang, J.S.; Xue, Q.G. Low-temperature treatment of polyethylene plastics and semi-coke mixture and CO2 gasification of finely ground products. Fuel 2021, 285, 119215. [Google Scholar] [CrossRef]
  14. Nie, Z.; Wang, G.; Zhang, H.; Wang, J.; Xue, Q. New technology of efficient pulverization of simulated municipal solid waste based on low temperature heat treatment and properties of pulverized product for blast furnace injection. Fuel 2023, 337, 127245. [Google Scholar]
  15. Li, Y.; Wu, X.; Sun, C.S.; Geng, Z.; Zhang, Q. Optimization of Beijing municipal solid waste treatment model based on low-carbon development. Resour. Sci. 2021, 43, 1574–1588. [Google Scholar]
  16. Li, X.-G.; Ma, B.-G.; Xu, L.; Hu, Z.-W.; Wang, X.-G. Thermogravimetric analysis of the co-combustion of the blends with high ash coal and waste tyres. Thermochim. Acta 2006, 441, 79–83. [Google Scholar] [CrossRef]
  17. Prabowo, B.; Aziz, M.; Umeki, K.; Susanto, H.; Yan, M.; Yoshikawa, K. CO2-recycling biomass gasification system for highly efficient and carbon-negative power generation. Appl. Energy 2015, 158, 97–106. [Google Scholar] [CrossRef]
  18. Zhang, F.; Xu, D.P.; Wang, Y.G.; Argyle, M.D.; Fan, M. CO2 gasification of powder River Basin coal catalyzed by a cost-effective and environ-mentally friendly iron catalyst. Appl. Energy 2015, 145, 295–305. [Google Scholar]
  19. Wang, G.W.; Zhang, J.L.; Hou, X.M.; Shao, J.; Geng, W. Study on CO2 gasification properties and kinetics of biomass chars and anthracite char. Bioresour. Technol. 2015, 177, 66–73. [Google Scholar]
  20. Wang, G.W.; Zhang, J.L.; Shao, J.G.; Li, K.; Zuo, H. Investigation of non-isothermal and isothermal gasification process of coal char using different kinetic model. Int. J. Min. Sci. Technol. 2015, 25, 15–21. [Google Scholar]
  21. Liao, X.J.; Singh, S.; Yang, H.; Wu, C.; Zhang, S. A thermogravimetric assessment of the tri-combustion process for coal, biomass and polyethylene. Fuel 2021, 287, 119355. [Google Scholar]
  22. Wang, G.; Zhang, H.Q.; Wang, J.S.; Xue, Q.G. Gasification kinetics of char formed from waste polyvinyl chloride for efficient utilization in ironmaking process. J. Iron Steel Res. Int. 2022, 29, 1535–1544. [Google Scholar] [CrossRef]
  23. Muthuraman, M.; Namioka, T.; Yoshikawa, K. A comparative study on co-combustion performance of municipal solid waste and Indonesian coal with high ash Indian coal: A thermogravimetric analysis. Fuel Process. Technol. 2010, 91, 550–558. [Google Scholar] [CrossRef]
  24. Arias, B.; Pevida, C.; Rubiera, F.; Pis, J. Effect of biomass blending on coal ignition and burnout during oxy-fuel combustion. Fuel 2008, 87, 2753–2759. [Google Scholar] [CrossRef]
  25. Chen, Y.; Mori, S.; Pan, W.-P. Estimating the Combustibility of Various Coals by TG-DTA. Energy Fuels 1995, 9, 71–74. [Google Scholar] [CrossRef]
  26. Wang, Q.; Wang, G.W.; Zhang, J.L.; Lee, J.Y.; Wang, H.; Wang, C. Combustion behaviors and kinetics analysis of coal, biomass and plastic. Thermochim. Acta 2018, 669, 140–148. [Google Scholar]
  27. Ding, L.; Wang, P.Y.; Kong, L.X.; Bai, J.; Yu, G.; Li, W.; Wang, F. Progress on reaction models for coal gasification processes. Chem. Ind. Eng. Prog. 2024, 43, 3593–3612. [Google Scholar]
Figure 1. Morphology of the raw materials ((a) PE; (b) PVC; and (c) straw).
Processes 12 02853 g001
Figure 2. Comparative analysis of single fuel combustion curves: (a) MSW and (b) anthracite.
Processes 12 02853 g002
Figure 3. Pyrolysis curves of the three raw materials used for MSW preparation.
Processes 12 02853 g003
Figure 4. Conversion curves for the mixed combustion of MSW and anthracite.
Processes 12 02853 g004
Figure 5. DTG curves for the mixed gasification of mixtures of different proportions of MSW and anthracite.
Processes 12 02853 g005
Table 1. Main components of MSW in Beijing/%.
Kitchen WastePaperPlasticsTextilesWoodDustGlassesMetalOthers
50.6520.9821.620.473.530.231.670.350.53
Table 2. Properties of the pulverized MSW product and pulverized anthracite.
SampleProximate Analysis/%Ultimate Analysis/%LHV/(kJ/kg)
VdAdFCdCHONSCl
Pulverized MSW 75.817.8516.3465.709.708.260.380.382.6328,829
Anthracite10.939.5679.5277.711.218.190.551.120.1225,558
Note: FCd was fixed carbon on a dry basis, Vd was the volatiles on a dry basis, and Ad was the ash on a dry basis.
Table 3. Characteristic combustion parameters for different proportions of MSW.
SampleTmax1rmax1Tmax2rmax2Tmax3rmax3Tmax4rmax4Rm
Anthracite----6240.82--0.131
20% MSW-80% anthracite--4800.216100.666850.100.167
40% MSW-60% anthracite3460.124790.295880.476930.120.192
60% MSW-40% anthracite3480.184800.335840.416960.120.208
80% MSW-20% anthracite3530.244520.314850.386990.140.235
Table 4. Kinetic parameters calculated by the three models.
SampleAnthracite20% MSW-80% Anthracite40% MSW-60% Anthracite60% MSW-40% Anthracite80% MSW-20% AnthraciteMSW
RPME (kJ/mol)152.0577.7350.4640.6733.4332.32
A1.13 × 107961.0528.598.623.653.81
φ−1.03 × 1026−7.11 × 1025−3.58 × 1025−1.05 × 1028−3.07 × 10289.44 × 1024
R20.999690.996870.997170.998180.999490.99768
URCME (kJ/mol)50.3637.3130.6526.4422.5119.93
A11.082.791.360.870.570.44
R20.956780.979110.991670.994860.995850.99008
VME (kJ/mol)152.0580.5151.0540.8733.4132.17
A1.13 × 1071.41 × 10331.108.893.653.71
R20.999690.996920.997180.998190.999490.99768
Table 5. Relative error between the experimental and calculated values of the conversion rate.
SampleDEV(x)/%
RPMURCMVM
Anthracite0.799.300.79
20% MSW-80% anthracite2.426.262.40
40% MSW-60% anthracite2.223.822.22
60% MSW-40% anthracite1.752.951.75
80%MSW-20% anthracite0.912.610.91
MSW1.964.051.96
Disclaimer/Publisher’s Note: The statements, opinions and data contained in all publications are solely those of the individual author(s) and contributor(s) and not of MDPI and/or the editor(s). MDPI and/or the editor(s) disclaim responsibility for any injury to people or property resulting from any ideas, methods, instructions or products referred to in the content.

