Article

A Comparative Study of the Performance of Orbitally Shaken Bioreactors (OSRs) and Stirred Tank Bioreactors (STRs)

1
Shenzhen Key Laboratory of High Performance Nontraditional Manufacturing, College of Mechatronics and Control Engineering, Shenzhen University, Shenzhen 518060, China
2
Natural Science Foundation of Guangdong, College of Mechatronic Engineering, Guangdong Polytechnic Normal University, Zhongshan Ave West 293, Guangzhou 510665, China
*
Author to whom correspondence should be addressed.
Processes 2024, 12(12), 2849; https://doi.org/10.3390/pr12122849
Submission received: 28 October 2024 / Revised: 25 November 2024 / Accepted: 9 December 2024 / Published: 12 December 2024

Abstract

Bioreactors are crucial for biopharmaceutical engineering, and their properties have an important impact on cell cultivation. Orbitally shaken bioreactors (OSRs) are gradually gaining more and more attention because of their special operational advantages and suitability for disposable cultivation. In this paper, the performance of OSRs is analyzed in comparison to stirred tank bioreactors (STRs). CFD models were established to investigate the difference in fluid dynamics between OSRs and STRs at the same power input levels. The CFD and experiment data showed that mixing and oxygen transfer needed less energy in OSRs than in STRs. Moreover, the shear stress was still at a low level for agitation behaviors in both OSRs and STRs.

1. Introduction

In the field of contemporary biomedical scholarship, the biopharmaceutical sector is regarded as a fundamental industry of the 21st century, playing a pivotal role in accelerating the development of the social economy in modern society [1]. As a key device during in vitro animal cell culture, bioreactors can provide a simulated physiological environment that nourishes cellular growth and metabolism. Therefore, bioreactors play an important role in the biopharmaceutical industry [2].
Stirred tank bioreactors (STRs) have seen extensive use in the cultivation of plant cells, animal cells, and various microbial hosts, with the current scale extending up to 20,000 L [3]. Despite such capabilities, the intricate operation, enlargement challenges, and exorbitant research and development costs are shortcomings of STRs. In contrast, orbitally shaken bioreactors (OSRs) are known as an economical, user-friendly, and efficient option, with the cultivation capacity extending up to 2000 L [4,5]. However, comparative research on the performance of these two reactor types still remains sparse.
Yamamoto et al. [6] conducted a numerical simulation study to analyze the distribution of the cell assemblies in an OSR and an STR by modeling the cell clusters in the culture solution as rigid spherical solid particles. The findings suggested that the maximum shear stress exerted on particles in the STR was higher than that in the OSR. Monteil et al. [5] compared the impact on CHO cells’ growth and metabolism when choosing different parameters in an OSR and an STR with similar   k L a values. The results showed that the cell growth rate and activity in the STR were inferior compared to those in the OSR.
The specific power consumption ( P / V L ) refers to the energy required to maintain the fluid movement for each unit of volume. It is considered one of the key parameters for characterizing and scaling up culture volumes since its magnitude can reflect an integrated view of mixing performance, oxygen solubility, and cell damage levels [7,8,9]. Comparing performances at the same power consumption provides a more comprehensive understanding of energy utilization efficiency and relative efficiency among different bioreactors. This can assist in selecting the optimal bioreactor design to achieve maximum economic benefit and high energy utilization rates in practical applications.
Computational fluid dynamics (CFD) represents a branch of hydrodynamics that employs numerical computation methods to simulate and analyze fluid mechanics issues [10]. CFD has maturely evolved with the progression of computer technology, consistently enhancing the reliability of its outcomes. It can deliver numerous data within a brief period and visualize the details of the fluid movement, thereby facilitating the comparison and optimization of different design alternatives by researchers [11].
CFD has been extensively utilized in the design of bioreactors. Zhu et al. [12] proposed a novel baffle structure model used in an OSR and utilized CFD to develop a three-dimensional fluid model. They analyzed the baffle’s effect on the reactor’s flow environment, volumetric mass transfer coefficient ( k L a ), and specific power consumption. Similarly, Amer et al. [13] employed a CFD model that incorporates an overall balance equation to simulate gas–liquid mixing and bubble distribution within a 50 L disposable bioreactor vessel, aiming to predict the effect of bioreactor geometry on k L a . Emre et al. [14] devised a horizontal twin-impeller bioreactor (LSB-R) characterized by low shear stress and used CFD to compare the fluid environment with that of a stirred tank bioreactor (STR) while maintaining equivalent mixing times (23 ± 2) s. They found that the average shear stress in the LSB-R was 0.8 Pa, which is 100 times lower compared to the STR’s interior setting.
The current study employs both CFD simulation and experimental methods to comparatively analyze key characteristics such as fluid velocity field distribution, mixing efficiency, oxygen solubility capacity, and shear stress distribution in an OSR and an STR.

2. Materials and Methods

The performances of an STR and an OSR were compared using a combination of simulation and experimental methods. By establishing theoretical models for energy consumption, oxygen transfer rate, and other parameters of the bioreactors, their respective advantages and limitations were analyzed.

2.1. Bioreactor

In the present investigation, the experimental model was based on a stirred tank bioreactor (STR) characterized by a diameter of 160 mm, a maximum operational volume of 5 L, and featured Rushton-type impellers mounted at a height of 1 3 h (where h refers to the liquid level height in the static state of the reactor), as shown in Figure 1. There were no baffles installed, and a flat-bottomed cylindrical tank design was chosen. The eccentric distance was set to 50 mm, and the OSR was oscillated with this amplitude. An orbitally shaken bioreactor (OSR) of identical dimensions and configuration was designed to conduct a comparative study.

2.2. CFD Models

The continuity equation (Equation (1)) and momentum equation (Equation (2)) were used to control the fluid flow:
ρ t + ρ u = 0
  ρ t + ρ u u = p + τ + ρ g + F
where ρ denotes the phase density, u denotes the velocity vector, p denotes the pressure, τ denotes the stress tensor, ρ g denotes the gravitational force, and F encompasses external body forces and model source terms. For the computation of shear stress in hydrodynamics, the expression is articulated as shown in Equation (3):
τ = μ u x y + u y x 2 + u y z + u z y 2 + u z x + u x z 2 1 2
where u x , u y ,   a n d   u z represent the three components of fluid velocity and μ denotes the liquid viscosity.
In this study, the min size of the grid was 2 mm, and the max size of the grid was 5 mm. An unstructured grid was used in the simulations. Furthers, a volume of fluid (VOF) model was used to solve the interface problem. To solve the dynamic equations of the flow field during orbital shaking, the Renormalization Group k-epsilon (RNG k-ε) model was adopted as the turbulence model. All of the calculations were executed using the FLUENT in ANSYS 15.0 (ANSYS Inc., Canonsburg, PA, USA).

2.3. Determination of Bioreactor Power Consumption

Bioreactor power consumption ( P / V L ) refers to the energy required to maintain the fluid movement for each unit of volume. Current experimental methodologies for measuring power consumption in bioreactors primarily include the torque method, thermal method, electrical power method, etc. Additionally, computational simulation is also an option to assess power consumption [15,16,17,18,19,20].
In the case of an OSR, the vessel walls are the exclusive source of energy for fluid motion within the basin. The efficiency and magnitude of power consumption at the walls decisively influence the performance index within the bioreactor. Thus, the power consumption for such a bioreactor can be determined by calculating the work performed by the vessel walls. In contrast, the impeller blades are the source of energy for the motion of fluid within the basin for an STR, so the power consumption for STRs can be determined by calculating the work performed by the impeller blades. Therefore, the power consumption for both OSRs and STRs can be calculated using Equation (4):
P V L = 2 π N s h a k i n g / i m p e l l e r M 60 V L × 1 0 3 = U I V L
where P V L denotes the bioreactor power consumption, N s h a k i n g / i m p e l l e r denotes the shaking velocity, M denotes the torque exerted by the bioreactor on the fluid region, and V L denotes the filling volume.

2.4. Determination of Oxygen Transfer Rate

Sufficient oxygen is important for the growth and metabolism of animal cells. Hence, the oxygen transfer rate (OTR) is considered one of the key parameters in the dynamics of bioreactors [21]. The OTR can be determined by Equation (5):
OTR = k L a     ( C * C L )
a   = A V L = s u r f a c e   a r e a l i q u i d   v o l u m e
where   k L denotes the mass transfer coefficient, a denotes the specific surface area, C L denotes the oxygen concentration in the liquid phase, and C * denotes the saturated oxygen concentration in the liquid phase.
This investigation determined the volumetric mass transfer coefficient ( k L a ) by using the dynamic gassing out method, employing a fluorescence oxygen meter (Microx4) to establish the measurement platform [22,23]. Additionally, the following mass balance equation (Equation (7)) can be utilized to calculate the value of k L a :
d C L d t = k L a C * C L
During the k L a measuring process, a predetermined volume of deionized water was pumped into the bioreactor vessel, and an optical oxygen sensor (PreSens GmbH, Regensburg, Germany) was used to record the saturated oxygen concentration C * in the liquid phase. Nitrogen gas was then sparged into the liquid phase until the percent air saturation reached about zero, following which the bioreactor was initiated, recording the rising curve of the oxygen concentration in the liquid phase. The term d C L d t can be obtained according to the slope of the curve, which allows for the determination of k L a as deduced from the mass balance equation.

2.5. Determination of Mixing Time

The mixing time refers to the temporal duration needed for the substance within the bioreactor to transition from the initiation of mixing to the state of homogeneity, acting as an integral parameter that characterizes the mixing trait of the bioreactor [24,25]. The double indicator colorimetric method was employed in this research to measure the mixing time [21,26].
During the mixing time measuring process, a predetermined volume of deionized water was added into the bioreactor vessel, followed by the addition of a specified quantity of 1 g / L methyl red and thymol blue indicators, shifting the solution color to yellow, thereby indicating a pH value between 6.6 and 7.9. Then, the bioreactor was initiated and 10 μL of 1   M / L hydrochloric acid was added to the solution, until a complete color change to red was achieved. Subsequently, 10 μL of 1   M / L sodium hydroxide was dripped into the central part of the bioreactor vessel to restore the pH value. When the solution achieved a state of homogeneity, the color of the solution reverted to its initial yellow state. The elapsed time from the dropping of sodium hydroxide denoted the mixing time. The entire process of measuring the mixing time was carried out through human observation. In order to reduce the error caused by the experiment, we conducted multiple experiments and took the average value.

3. Results and Discussion

To compare the performances of the two bioreactors, we analyzed their velocity field distributions and compared their k L a performance, mixing times, and shear force characteristics. Additionally, to ensure the reliability of the simulations, we also verified grid independence.

3.1. Mesh Independence Validation

The validation of mesh independence was required to ensure the accuracy of the collected data prior to the analysis of the simulation results. In general, an increase in the mesh number correlates with simulation outputs that more closely approximate the actual conditions. However, an appropriate mesh number is beneficial for conserving computational resources. Mesh numbers of 1.0 × 10 5 , 3.0 × 10 5 , and 5.0 × 10 5 were used for the simulation of OSR operation in this study. The independence of the mesh numbers was tested by comparing simulated liquid heights at different mesh numbers. The simulated maximum value of liquid height almost did not change when the mesh number was higher than 3.0 × 10 5 , indicating the attainment of mesh independence (depicted in Figure 2a). Similarly, the validation of mesh independence for the STR could be achieved by comparing the magnitude of the simulated average velocity at different mesh numbers. When the mesh number exceeded 4.0 × 10 5 , the simulated average velocity remained substantially constant, signifying that mesh independence had been achieved (see Figure 2b).

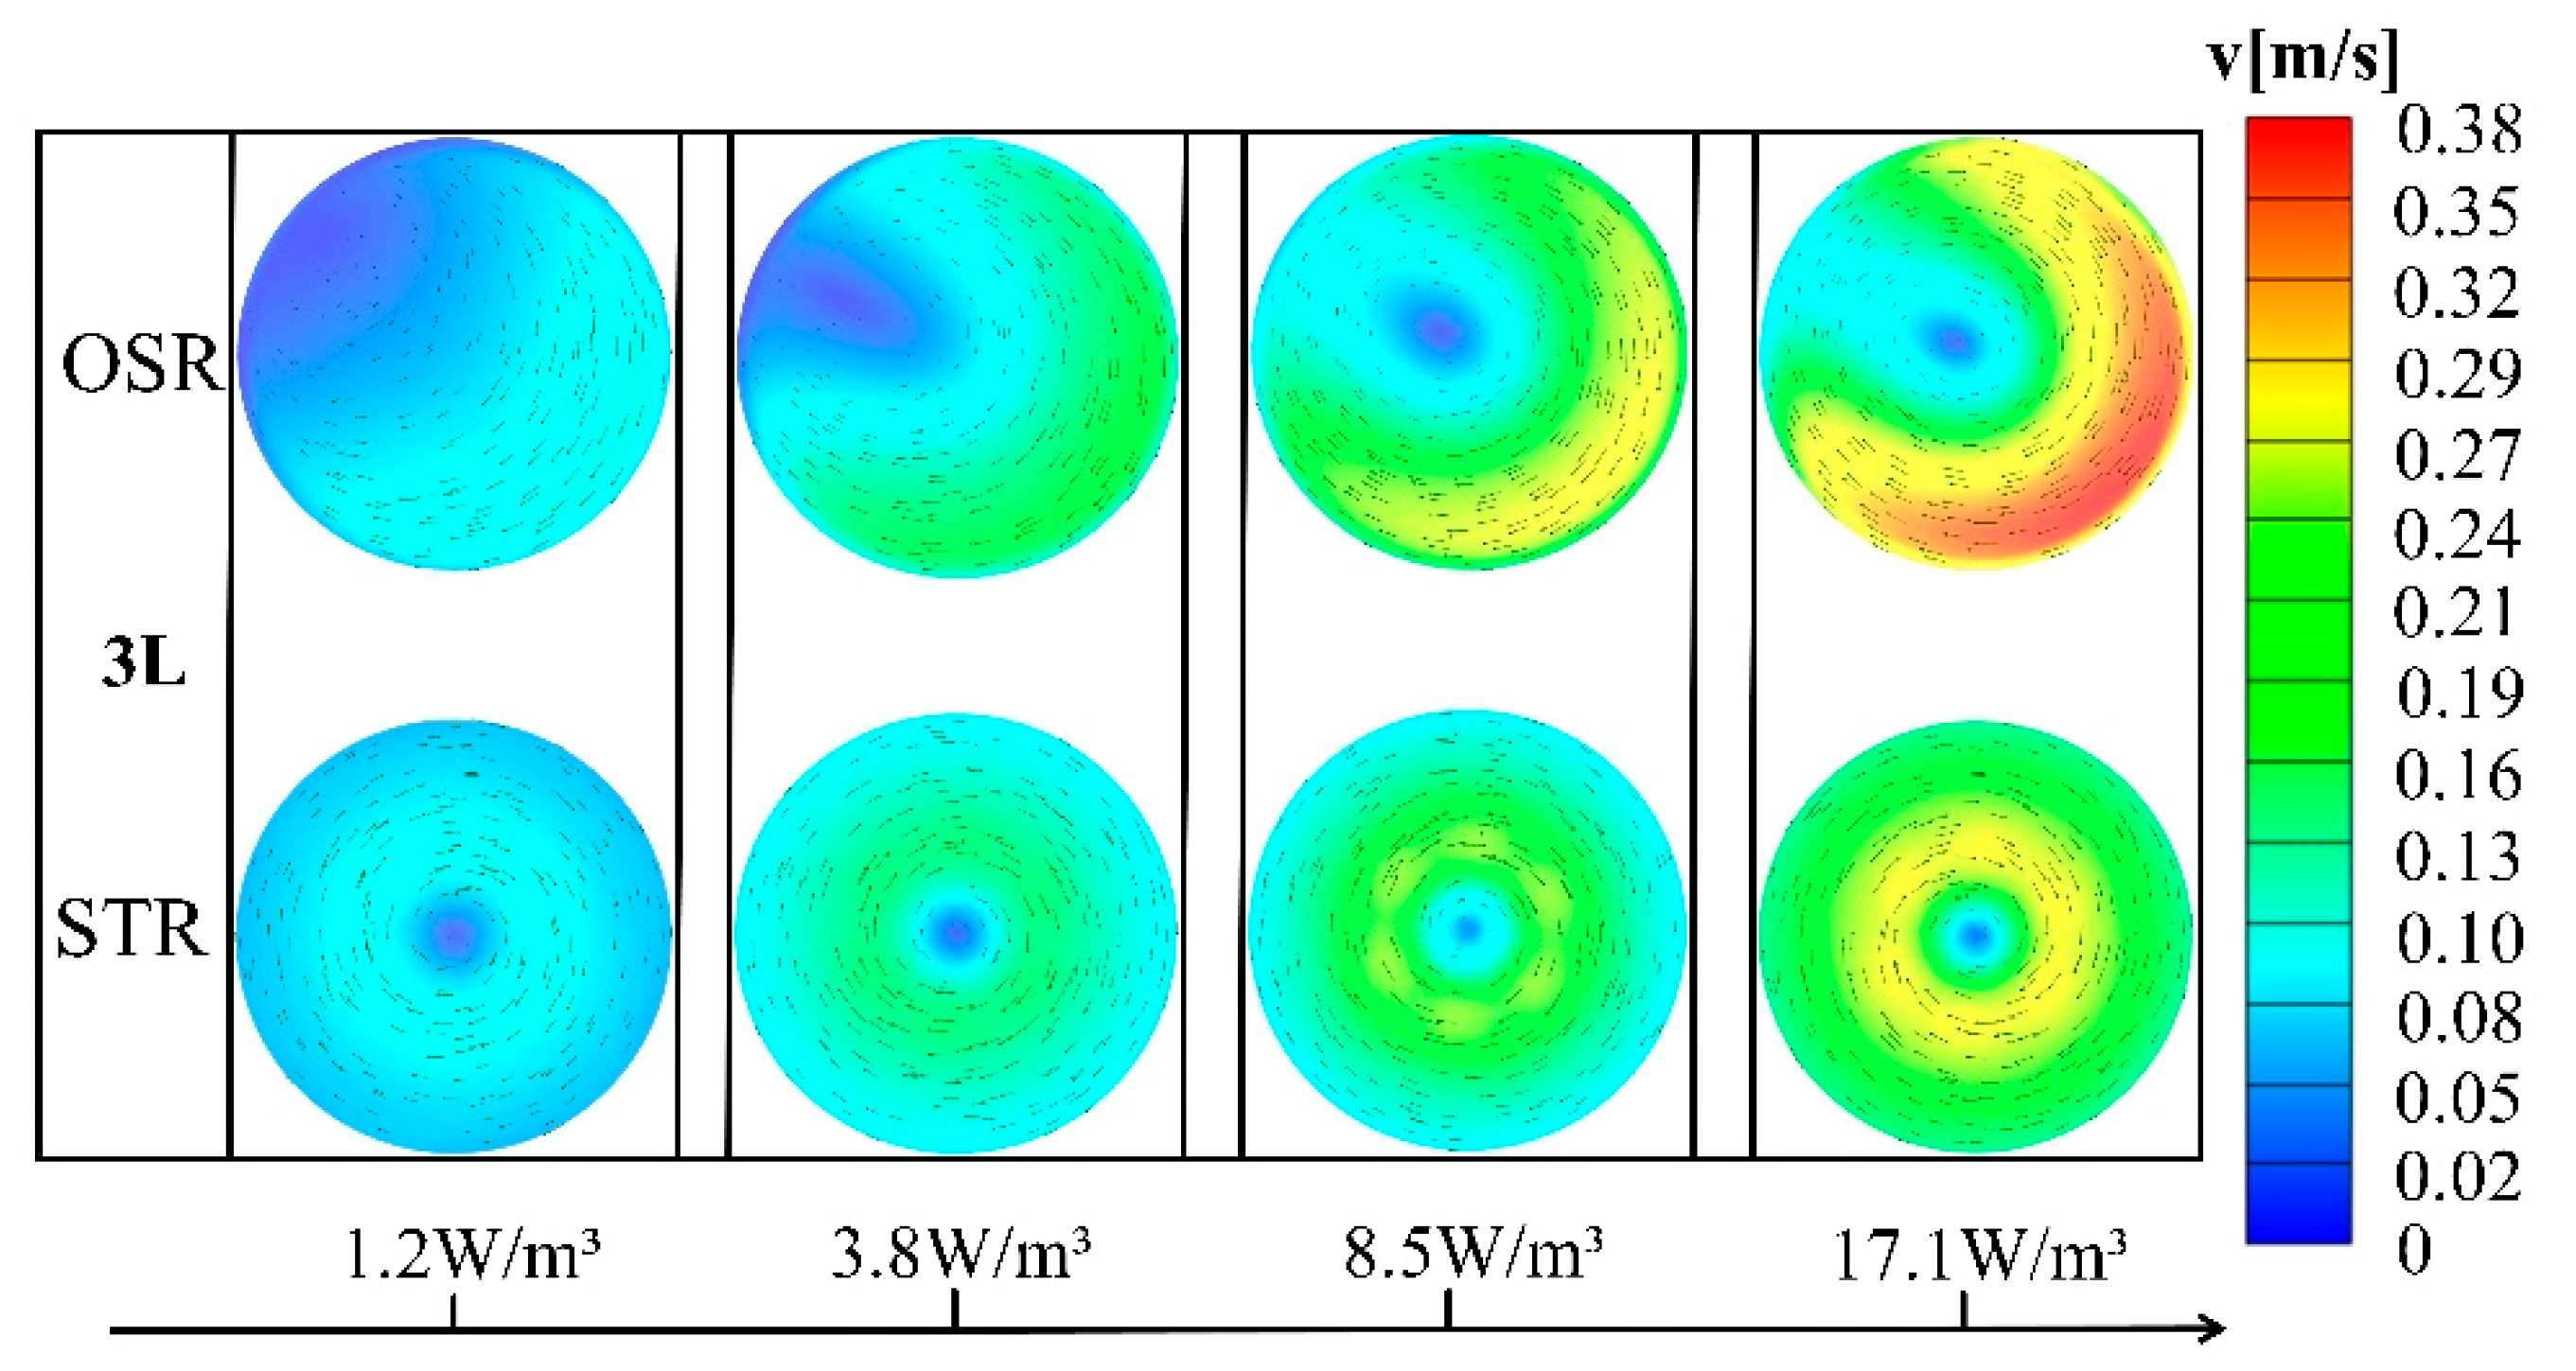
3.2. Comparison of Velocity Vector Field

The velocity vector field constitutes fundamental information about a flow field and reflects the mixing effects to a certain extent [27,28]. To perform an in-depth analysis of the flow dynamics within the OSR and STR under equivalent power consumption conditions (depicted in Figure 3), velocity fields at vertical (A1-A1 and B1-B1) and horizontal (A2-A2 and B2-B2) cross-sections of the bioreactors were selected. The power consumption of the bioreactors could be calculated using Equation (4).
From the velocity vector distribution in a designated volumetric range (3 L) and various ranges (4.5 L, 3.5 L, 2.5 L, and 1.5 L), as shown in Figure 4 and Figure 5, it was observed that there was a large vortex on every vertical section plane in the OSR. This vortex propelled the fluid from the left side to the right, serving as the primary impetus of the fluid flow in material and energy transfer. As a dimensionless driving parameter, higher Froude numbers corresponded to enhanced driving capabilities. The distribution of the velocity vector on the vertical sections in the STRs revealed four vortexes symmetrically distributed about the stirring shaft on every vertical section plane, with the upper two vortexes being larger than the lower ones. This asymmetry was a result of the lower volume of fluid beneath the impeller blades compared to that above. It could also be observed from the figures that the two upper vortexes in the STR facilitated mixing by driving the fluid within the bioreactor upward, while the lower vortexes promoted downward movement. Additionally, the maximum value of fluid velocity within the STR was found near the impeller blades, as the driving force in such bioreactors originates from the rotating blades.
Moreover, as depicted in Figure 4 and Figure 5, the magnitude of the flow field velocity in both the OSR and the STR increased with the power consumption. The extent of the vortexes’ influence also expanded with the increase in power consumption, progressively diminishing the regions of low velocity within the bioreactor. Beyond these findings, it was apparent that the OSR exhibited high velocities and smaller regions of low velocity compared to the STR under equivalent power conditions. It is worth mentioning that the low-velocity areas in the OSR were predominantly located at the central region of the bioreactor, while those in the STR counterpart were primarily concentrated near the bioreactor walls. This phenomenon might stem from the different transmission mechanisms and locations of power source units of these two bioreactor types.
As visualized in Figure 6 and Figure 7, both types of bioreactors exhibited a large radial vortex in the horizontal sectional velocity fields, and the minimum flow field velocity was positioned at the vortex core. However, the maximum flow field velocities for the OSR were near the walls, while in the STR, they abutted the impeller blades. What is more, despite the rise in velocity magnitudes in both the OSR and the STR when the power consumption increased, the flow field velocity in the OSR experienced a more pronounced increase. With the power consumption having risen, the vortex center in the OSR consistently aligned with the impeller center, while the vortex center in the STR gradually shifted towards the geometrical center. Additionally, it was also apparent that the OSR exhibited a higher flow field velocity, smaller low-velocity area, and more distinguished velocity gradients under equivalent power conditions, which signified that the OSR configuration could be a better option to enhance material mixing at identical power consumptions.

3.3. Comparison of Aeration Performance

To analyze the differences and similarities in the oxygen dissolution performance of the OSR and STR under equivalent power consumption, the volumetric mass transfer coefficient ( k L a ) was measured for the same volume range (3 L) and varying volume ranges (4.5 L, 3.5 L, 2.5 L, and 1.5 L), as shown in Figure 8. The parameter vvm represents the aeration rate, indicating the ratio of air volume supplied per minute ( L / m i n ) to the volume of fluid filled in the vessel (L). For the OSR, the surface aeration method was employed for air supply, whereas the submerged bubbling method was utilized in the STR, which is a process not suitable for excessive aeration rates due to the potential for extensive bubble formation.
The overall trend shown in Figure 8 suggests that the k L a values for both the OSR and the STR escalated with increasing power consumption. The difference was that the k L a value for the OSR exhibited a more pronounced increase, while that for the STR increased slowly and tended to plateau. Although the k L a values for both bioreactors could be very close under the lower power consumption condition, the k L a value of the STR decreased significantly compared to that of the OSR with increasing power, which may be correlated with the fluid motion velocity within the flow fluid and the oxygen supply method of the reactors. To be precise, the flow field velocities of both the OSR and the STR accelerated with increasing power consumption, with the velocity of the OSR increasing more significantly. Despite the increase in velocity in the STR, the ascending speed of the oxygen bubbles increased concurrently, reducing their residence time and thus resulting in a more gradual k L a value increase.
Additionally, concerning aeration methods, the submerged bubbling method was utilized in the STR for oxygen supply, while the surface aeration method was implemented in the OSR. Submerged bubbling typically provides a higher oxygen supply efficiency compared to surface aeration, but the OSR still possessed superior k L a values. This seemingly unreasonable phenomenon suggests that the OSR exhibited a heightened capability for external oxygen absorption owing to a larger gas–liquid interface area. Furthermore, it also indicates that oxygen may have shown a superior dissolving speed in the OSR, which was associated with the greater fluid velocity and more pronounced velocity gradients difference in the OSR. Consequently, for ex vivo animal cell cultivation, the submerged bubbling method was employed to supply pure oxygen for the STR, whereas the OSR merely necessitated the surface aeration method for air supply.

3.4. Comparison of Mixing Characteristics

To analyze the differences and similarities in the mixing performances of the OSR and STR under equivalent power conditions, the mixing times for the same volume (3 L) and differing volumes (4.5 L, 3.5 L, 2.5 L, and 1.5 L), as depicted in Figure 9, were measured. As evident from Figure 9, the mixing times for both the STR and the OSR diminished with increasing power consumption since the energy input to the fluid increased at the same time, which accelerated the material mixing process within the flow field. The figure also reveals that the OSR exhibited superior mixing efficiency compared to the STR under equivalent power conditions. This disparity could stem from the larger flow field velocity gradient in the OSR under equivalent power conditions, which better facilitated the mixing of materials. Another explanation might be the superior conversion efficiency of the OSR as it could convert the input power more effectively into kinetic energy for fluid motion. In summary, under equivalent power consumption conditions, the OSR exhibited a superior mixing performance compared to the STR.

3.5. Comparison of Shear Damage

To evaluate the level of shear-induced cell damage within the OSR and the STR under equivalent power conditions, the distribution of shear forces for the same volume (depicted in Figure 10a and Figure 11a) and varying volumes (depicted in Figure 10b and Figure 11b) was analyzed [29]. As delineated in Figure 10, the maximum shear force was located near the bioreactor wall in the OSR, likely due to the wall being the sole source of energy for liquid motion within the flow domain, resulting in significant velocity gradient discrepancies near the wall and, hence, elevated shear forces. Conversely, the maximum shear force within the flow field for the STR was positioned near the impeller blades, as the rotation of the blades could generate substantial shear force. Figure 10 also indicates that the shear force values for both bioreactor types increased with rising power consumption.
Furthermore, the shear force magnitude distribution interval diagrams (Figure 11) indicate that the shear force values for both the OSR and the STR were primarily concentrated within the 0–0.03 Pa range, with the STR exhibiting a higher proportion above 0.1 Pa. Additionally, as shown in Figure 10 and Figure 11, the OSR showed lower shear forces compared to the STR under equivalent power conditions, suggesting a reduced risk of shear-induced damage within the flow field.

4. Conclusions

In the present research, experimental and simulation methods were employed to comparatively analyze the performance characteristics of an OSR and an STR under equivalent power consumption conditions.
Initially, the analysis of the velocity vector distribution of fluids at identical and varying volumes indicated that the magnitude of flow field velocity increased with rising power consumption in both the STR and the OSR. Under the same power conditions, the OSR had a higher flow field velocity. Additionally, the OSR exhibited significant differences in velocity gradients.
Subsequently, the assessment of the oxygen transfer ratio and mixing capabilities of these two types of bioreactors suggested that k L a values increased with rising power consumption in both the STR and the OSR. However, the k L a values for the OSR experienced a more dramatic increase and remained higher when the power consumption kept increasing, whereas the k L a values for the STR demonstrated a gradual plateau at a certain value. Additionally, the mixing times for both the OSR and the STR diminished with increasing power consumption. The OSR demonstrated excellent material mixing efficiency.
Finally, to investigate the level of shear-induced cell damage within the OSR and STR under equivalent power conditions, the distributions of shear forces for identical and divergent volumes were analyzed. The analysis delineated that the values of shear force for both types of bioreactors increased with rising power consumption. However, the OSR manifested lower shear force values compared to its STR counterpart.

Author Contributions

Methodology, M.S. and H.H.; software, Y.O. and M.S.; validation, X.C. and H.Y.; formal analysis, Y.O. and X.C.; investigation, Y.L., Z.W. and J.L.; writing—original draft preparation, Y.L.; writing—review and editing, L.Z. and H.H.; visualization, J.L., Z.W. and S.W.; supervision, L.Z.; project administration, L.Z. All authors have read and agreed to the published version of the manuscript.

Funding

This work received support from the New introduction of high-precision shortage talents to start the project (000737), Guangdong HUST Industrial Technology Research Institute, Guangdong Provincial Key Laboratory of Manufacturing Equipment Digitization (2023B1212060012), and the Natural Science Foundation of Guangdong (2023A1515011785).

Data Availability Statement

The data presented in this study are available on request from the corresponding author.

Conflicts of Interest

The authors declare that they have no known competing financial interests or personal relationships that could have appeared to influence the work reported in this paper.

References

  1. Yang, R.; Yang, S.C.; Ren, J.S.; Epstein, R.T. Current situation and future development of the biopharmaceutical industry in China: A mixed-method study. Front. Bioeng. Biotechnol. 2022, 13, 911165. [Google Scholar] [CrossRef] [PubMed]
  2. Dobson, J.; Cartmell, S.H.; Keramane, A.; Alicia, E.H. Principles and Design of a Novel Magnetic Force Mechanical Conditioning Bioreactor for Tissue Engineering, Stem cell Conditioning, and Dynamic in Vitro Screening. IEEE Trans. NanoBioscience 2006, 5, 173–177. [Google Scholar] [CrossRef] [PubMed]
  3. Jossen, V.; Eibl, R.; Pörtner, R.; Kraume, M.; Eibl, D. Stirred Bioreactors: Current State and Developments, With Special Emphasis on Biopharmaceutical Production Processes. Curr. Dev. Biotechnol. Bioeng. 2017, 7, 179–215. [Google Scholar] [CrossRef]
  4. Zhu, L.K.; Song, B.Y.; Wang, Z.L. Developing an orbitally shaken bioreactor featuring a hollow cylinder vessel wall. J. Chem. Technol. Biotechnol. 2019, 94, 2212–2218. [Google Scholar] [CrossRef]
  5. Monteil, D.T.; Juvet, V.; Paz, J.; Moniatte, M.; Baldi, L.; Hacker, D.L.; Wurm, F.M. A comparison of orbitally-shaken and stirred-tank bioreactors: pH modulation and bioreactor type affect CHO cell growth and protein glycosylation. Biotechnol. Prog. 2016, 32, 1174–1180. [Google Scholar] [CrossRef]
  6. Yamamoto, T.; Yano, M.; Okano, Y.; Masahiro, K.O. Numerical investigation for the movement of cell colonies in bioreactors: Stirring and orbital shaking tanks. J. Chem. Eng. Jpn. 2018, 51, 423–430. [Google Scholar] [CrossRef]
  7. Hortsch, R.; Dirk, W.B. Power Consumption and maximum energy dissipation in a milliliter-scale bioreactor. Biotechnol. Prog. 2009, 26, 595–599. [Google Scholar] [CrossRef]
  8. Schaffer, M.A.; Marchildon, E.K.; McAuley, K.B.; Cunningham, M.F. Assessment of Mixing Performance and Power Consumption of a Novel Polymerization Reactor System. Chem. Eng. Technol. Ind. Chem.-Plant Equip.-Process Eng. Biotechnol. 2015, 24, 401–408. [Google Scholar] [CrossRef]
  9. Eikenhorst, G.V.; Thomassen, Y.E.; Leo, V.A.; Bakker, A.M. Assessment of mass transfer and mixing in rigid lab-scale disposable bioreactors at low power input levels. Biotechnol. Prog. 2014, 30, 1269–1276. [Google Scholar] [CrossRef]
  10. Sert, C.; Nakiboglu, G. Use of Computational Fluid Dynamics (CFD) in teaching fluid mechanics. In Proceedings of the ASEE Annual Conference and Exposition, Conference Proceedings, Honolulu, HI, USA, 24 June 2007. [Google Scholar] [CrossRef]
  11. Zhao, W.N.; Pan, J.Z.; Chen, S.X.; Zhang, S.L.; Zhuang, Y.P. CFD simulation of stirred bioreactor and its application in the inosine production. J. East China Univ. Sci. Technol. 2006, 5, 548–551. [Google Scholar]
  12. Zhu, L.K.; Song, B.Y.; Wang, Z.L. Analyzing the suitability of a baffled orbitally shaken bioreactor for cells cultivation using the computational fluid dynamics approach. Biotechnol. Prog. 2018, 35, e2746. [Google Scholar] [CrossRef] [PubMed]
  13. Amer, M.; Feng, Y.; Ramsey, J.D. Using CFD simulations and statistical analysis to correlate oxygen mass transfer coefficient to both geometrical parameters and operating conditions in a stirred-tank bioreactor. Biotechnol. Prog. 2019, 35, e2785. [Google Scholar] [CrossRef] [PubMed]
  14. Emre, D.T.; Kose, A.; Celik, Y.; Oncel, S.S. Design of a horizontal-dual bladed bioreactor for low shear stress to improve hydrodynamic responses in cell cultures: A pilot study in Chlamydomonas reinhardtii. Biochem. Eng. J. 2021, 169, 107970. [Google Scholar] [CrossRef]
  15. Büchs, J.; Maier, U.; Milbradt, C.; Zoels, B. Power consumption in shaking flasks on rotary shaking machines: I. power consumption measurement in unbaffled flasks at low liquid viscosity. Biotechnol. Bioeng. 2000, 68, 589–593. [Google Scholar] [CrossRef]
  16. Büchs, J.; Raval, K. Extended method to evaluate power consumption in large disposable shaking bioreactors. J. Chem. Eng. Jpn. 2008, 41, 1075–1082. [Google Scholar] [CrossRef]
  17. Kato, Y.; Peter, C.P.; Akgün, A.; Büchs, J. Power consumption and heat transfer resistance in large rotary shaking vessels. Biochem. Eng. J. 2004, 21, 83–91. [Google Scholar] [CrossRef]
  18. Kato, Y.; Hiraoka, S.; Tada, Y.; Koh, S.T.; Lee, Y.S. Mixing time and power consumption for a liquid in a vertical cylindrical vessel, shaken in a horizontal circle. Trans. Icheme Part A 1996, 74, 451–455. [Google Scholar]
  19. Klöckner, W.; Tissot, S.; Wurm, F.M.; Büchs, J. Power input correlation to characterize the hydrodynamics of cylindrical orbitally shaken bioreactors. Biochem. Eng. J. 2012, 65, 63–69. [Google Scholar] [CrossRef]
  20. Gill, N.K.; Appleton, M.; Baganz, F.; Lye, G.J. Quantification of power consumption and oxygen transfer characteristics of a stirred miniature bioreactor for predictive fermentation scale-up. Biotechnol. Bioeng. 2008, 100, 1144–1155. [Google Scholar] [CrossRef]
  21. Tissot, S.; Farhat, M.; Hacker, D.L.; Anderlei, T.; Kühner, M.; Comninellis, C.; Wurm, F.M. Determination of a scale-up factor from mixing time studies in orbitally shaken bioreactors. Biochem. Eng. J. 2010, 52, 181–186. [Google Scholar] [CrossRef]
  22. Zhang, T.W.; Wang, T.F.; Wang, J.F. Analysis and measurement of mass transfer in airlift loop reactors. Chin. J. Chem. Eng. 2006, 14, 604–610. [Google Scholar] [CrossRef]
  23. Clarke, K.G.; Correia, L.D.C. Oxygen transfer in hydrocarbon aqueous dispersions and its applicability to alkane-based bioprocesses. Biochem. Eng. J. 2008, 39, 405–429. [Google Scholar] [CrossRef]
  24. Schilling, B.M.; Pfefferle, W.; Bachmann, B.; Leuchtenberger, W.; Deckwer, W.D. A special reactor design for investigations of mixing time effects in a scaled-down industrial L-lysine fed-batch fermentation process. Biotechnol. Bioeng. 2000, 64, 599–606. [Google Scholar] [CrossRef]
  25. Bürgin, T.; Coronel, J.; Hagens, G.; Hagens, G.; Keebler, M.V.; Genzel, Y.; Reichl, U.; Anderlei, T. Orbitally shaken single-use bioreactor for animal cell cultivation: Fed-batch and perfusion mode. In Animal Cell Biotechnology: Methods and Protocols; Humana: New York, NY, USA, 2020; pp. 105–123. [Google Scholar] [CrossRef]
  26. Shiue, A.; Chen, S.C.; Jeng, J.C.; Zhu, L.; Leggett, G. Mixing performance analysis of orbitally shaken bioreactors. Appl. Sci. 2020, 10, 5597. [Google Scholar] [CrossRef]
  27. You, X.Y.; Li, S.H. Effects of Surface Etch Hole Fault on the Velocity Field in Microchannel Reactors. Chin. J. Chem. Eng. 2009, 17, 919–924. [Google Scholar] [CrossRef]
  28. Zhu, L.; Chen, W.; Zhao, C. Analysis of hollow wall effect on the fluid dynamics in the orbitally shaken bioreactors. Sci. Rep. 2022, 12, 9596. [Google Scholar] [CrossRef]
  29. Ding, N.; Li, C.; Guo, M.J.; Zhang, S.L.; Ali, M. Numerical simulation of scaling-up an inverted frusto-conical shaking bioreactor with low shear stress for mammalian cell suspension culture. Cytotechnology 2019, 71, 671–678. [Google Scholar] [CrossRef]
Figure 1. Schematic diagram of the OSR.
Processes 12 02849 g001
Figure 2. Mesh independence results for the OSR (a) and STR (b).
Processes 12 02849 g002
Figure 3. Simulated fluid waves of the OSR and STR.
Processes 12 02849 g003
Figure 4. Power consumption influence on fluid velocity distribution for the OSR and STR with the same filling volume.
Processes 12 02849 g004
Figure 5. Power consumption influence on fluid velocity distribution for the OSR and STR with different filling volumes.
Processes 12 02849 g005
Figure 6. Fluid velocity distribution on cross-section for OSR and STR with different filling volumes.
Processes 12 02849 g006
Figure 7. Fluid velocity distribution on cross-section for OSR and STR with the same filling volume.
Processes 12 02849 g007
Figure 8. Oxygen transfer rates for the OSR and STR at the same filling volume (a) and at different filling volumes (b).
Processes 12 02849 g008
Figure 9. Mixing times for the OSR and STR at the same filling volume (a) and at different filling volumes (b).
Processes 12 02849 g009
Figure 10. Shear stress distributions for the OSR and STR at the same filling volume (a) and at different filling volumes (b).
Processes 12 02849 g010
Figure 11. Shear stress distributions for the OSR and STR at the same filling volume (a) and at different filling volumes (b).
Processes 12 02849 g011
Disclaimer/Publisher’s Note: The statements, opinions and data contained in all publications are solely those of the individual author(s) and contributor(s) and not of MDPI and/or the editor(s). MDPI and/or the editor(s) disclaim responsibility for any injury to people or property resulting from any ideas, methods, instructions or products referred to in the content.

