1. Introduction
Accurately monitoring the flow of water injected into the ground is an important step in oil exploration. If the flow direction of injected water can be accurately monitored, well placement and timely adjustments in production can be made, which improves production efficiency and reduces costs. The existing detection methods cannot be used to obtain accurate flow information of water in complex oil and gas reservoirs, especially when there are various factors such as fractures and faults within the same reservoir. Thus, it is more difficult to use physical logging methods [
1,
2,
3], and their efficiency is low, which has a negative impact on the development of oilfields. Finding other new detection methods has very important practical significance for improving the evaluation accuracy of complex oil and gas layers at this stage.
For secondary oil recovery, the method of water injection is generally adopted. In the tertiary development of oilfields, polymer flooding and other methods of injecting liquid into the oil layer are widely used. The process of reservoir injection development is that of reservoir fluid seepage in rock pores under the action of an external force, which is also the process of generating streaming potential in the fluid.
Saad F. Alkafeef and V. Allègre et al. studied the flow potential characteristics of carbonate rock cores in water and non-water liquids [
4,
5,
6,
7,
8]. Some experts have studied the electrochemical factors of reservoir rocks during water injection and the flow potential characteristics of rocks [
9,
10,
11,
12,
13,
14,
15,
16]. Gangxiang Song and Mehdi Ghommem et al. studied the application of potential dynamic monitoring technology in oilfield reservoir monitoring [
11,
17,
18,
19,
20,
21,
22]. Hong Li et al. studied the fracture characteristics and influencing factors of shale and sandstone [
23,
24,
25]. Thanh Luong Duy and Sadeqi-Moqadam et al. carried out a study on the streaming potential model of porous media [
26,
27,
28,
29]. If it is possible to infer the flow of fluids by monitoring the different flow potentials produced at different locations in the reservoir, then theoretically, the efficiency of oil extraction can be greatly improved. The important research of these experts provides scientific support for the use of flow potential monitoring to understand the flow patterns of groundwater.
2. Theoretical Model
The size of the streaming potential can be calculated theoretically via the Fitterman formula [
30], but the calculation of the size of the streaming potential generated by the fluid flow in the rock mass is relatively complicated.
where
ES is the flow potential (V),
C is the streaming potential coefficient (V/Pa), Δ
P is the pressure difference in the liquid (Pa),
ε is the dielectric constant of the fluid (F/m),
ζ is the central potential (Zeta potential) (V),
δ is the electrical conductivity of the fluid, which is the reciprocal of resistivity (S/m), and
η is the viscosity of the fluid (Pa·S).
Rock pores are spaces for fluid to be stored in the rock, and the throat is an important channel for fluid to seep into the rock. The size distributions of pores and throats and their geometries are the main factors that affect the differences in fluid seepage in reservoirs. In the pore structure of reservoir rock, different pore and throat geometries, sizes, distributions and connectivities result in different streaming potential phenomena. In fact, the pores of rocks can also be regarded as very small cracks, which are connected to channels of water flow.
If fractures and faults are present in a formation, plane anisotropy of the rock reservoir can occur. The sealing and opening of fractures and faults, as well as the direction and length of extension, play a role in guiding and redirecting seepage, controlling the distribution of reservoirs and remaining oil, and changing the direction of seepage of injected water. Owing to the existence of fractures and faults, the directionality of the permeability of the reservoir is increased. After water is injected into the fractured sandstone reservoir, the injected water can easily infiltrate along fractures and faults.
Theoretical analysis shows that different geological reservoir structures should be accompanied by different streaming potential phenomena. Monitoring the change laws of the streaming potentials corresponding to different areas in the process of water injection and oil recovery can provide effective guidance for ground work, improve the efficiency of water injection and oil recovery operations, and reduce unit oil production costs.
Many documents suggest that the variation in streaming potential is mainly related to the pressure of the fluid and the structure of the rock mass, and it has no direct relationship with the depth at which the rock mass is located.
To prove the proposed theory, indoor and field experiments were conducted using the theory of streaming potential to test the real-time state of the streaming potential during the injection of fluid into the rock mass. In the indoor experiments, two kinds of sandstones with different porosities were used as cores. Fluid injection experiments have been conducted under different injection pressures and injection fluids with different salinities. In the field experiments, liquid was injected into the sandstone layer to monitor the changes in the streaming potential. Through indoor and field experiments we studied the movement of underground fluids by observing changes in the streaming potential within fluids.
3. Test Design
3.1. Experimental System
To match the measurement conditions in the streaming potential chamber in the field, sandstone samples from two oilfield reservoirs were used, with liquid salinities ranging from 20 to 20,000 mg/L. This interval basically covers the range of the actual formation environment. By injecting fluids with different salinities into the core under formation conditions, the streaming potential in the core can be studied under different injection pressure conditions. Moreover, the differences among cores with different porosity structures under the same conditions are studied. The overall model of the experimental test system is designed according to the purpose of the streaming potential test experiment, as shown in
Figure 1.
The main equipment and functions of the streaming potential laboratory system were as follows:
The pressure vessel had a maximum ultimate pressure of 20 MPa, and the material was special steel. Cores with a diameter of 50–100 mm and a height of 100 mm could be placed inside. The axial pressure and confining pressure in the pressure vessel were controlled by a pressure regulating device.
Water injection pump: The water injection flow rate was 0.001~200 mL/min. The flow rate and flow pressure could be controlled by a computer. The maximum injection pressure of the controller could be adjusted to 25 MPa, and any specified value could be adjusted between 0 and 25 MPa.
Data control equipment: the data transmission equipment was controlled by a computer.
According to the research goals of integrating all relevant components, an indoor core flow potential test system was designed, as shown in
Figure 2.
3.2. Material
Rock sample A used in the laboratory experiment was from a sandstone formation at a depth of 1700 m in an oilfield, and sandstone sample B was from another oilfield at a depth of 1800 m. The core was well cemented, and the mud content was low.
The process of core preparation was carried out according to the following procedures:
First, the core was cut and polished into a cylinder with a diameter of 50 mm and a length of 100 mm, and both ends were perpendicular to the end face.
The rock sample was washed with oil and salt, dried in a constant-temperature box for 24 h, and then dried under vacuum at room temperature.
The relevant physical parameters of the core were obtained at room temperature.
To compare and study the streaming potential phenomenon of sandstones with different porosities, indoor streaming potential core experiments were carried out on sandstones A and B, respectively. The specific physical parameters of the two cores are shown in
Table 1.
The difference in rock microstructure between sandstone A and sandstone B was determined by slicing the two cores and observing and photographing them under a microscope.
Figure 3 shows a photograph of the thin section structure of sandstone A under a microscope, and
Figure 4 shows a photograph of the thin-section structure of sandstone B from a microscope.
The photomicrograph of sandstone A shows that the particle size distribution is relatively uniform, the mineral particles are sub angular, and the average pore size is uniform. The pore throat distribution is dominated by moderate pore throats, and the rock type is medium sandstone. The micrograph of sandstone B shows that the particle size distribution is uneven, the roundness of the mineral particles is poor, and the pore size distribution is uneven. The pore throat distribution is dominated by coarse pore throats, and the rock type is coarse sandstone.
3.3. Parameters
The confining pressure was set to 20 MPa, simulating the pressure environment of the actual core sampling depth. The saturated cores were fused into KCl solutions with salinities of 20, 200, 2000 and 20,000 mg/L, and an injection fluid with the same salinity as the saturated core was used to inject the cores, as were the streaming potentials, which were collected at different injection pressures.
The injection pressures of the injected cores were set to 0, 200, 400, 600, 800, and 1000 kPa, a staged pressure rise experiment was carried out, and finally, the injection pressure was decreased to 0 kPa. The specific situation of the corresponding flow potential changes in each pressure change stage was observed.
3.4. Procedure
The specific steps of this mobile potential measurement experiment are as follows: (1) polarize the electrode of the rock sample, connect the data line, waterproof and cure, and embed it in a high-pressure container; (2) add the confining pressure of the simulated formation, add an appropriate axial pressure, and inject a solution with a certain degree of salinity until the core is completely saturated; (3) prepare brine solutions with different salinities and add them to the water pump and inject brine into the core in different orders of axial pressure; (4) during the collection experiment, (5) use a combination of multiple working conditions to perform the flow potential measurement experiment and obtain the experimental data; and (6) analyze the obtained data of the flow potential and injection pressure changes and determine their correlation with the correlation of injection conditions.
Figure 5 shows the electrode treatment of the sandstone core before pressurization. After the electrodes are treated, it is fully waterproofed with resin.
Figure 6 shows that the sandstone core is placed in the high-pressure vessel. After the high-pressure sealing, the water injection test can begin.
4. Results of Laboratory Tests
The flow potential relationship was determined via analysis of the experimental data, as shown in
Figure 7 (sandstone A) and
Figure 8 (sandstone B). In
Figure 7, A20 refers to the streaming potential curve when a 20 mg/L KCl solution is injected into Sample A. In
Figure 8, B20 refers to the streaming potential curve when a 20 mg/L KCl solution is injected into Sample B. The experimental results of the two core liquid injection displacement streams are as follows: (1) when the injection pressure is 0, the streaming potential is also 0; (2) when the injection pressure changes, it is accompanied by a change in streaming potential; (3) the greater the injection pressure is, the greater the streaming potential generated; and (4) under the same injection pressure, the streaming potential increases with decreasing salinity of the injected liquid.
Figure 7 and
Figure 8 show that the salinity, injection pressure and streaming potential of different injection solutions are linearly related. In all the core experiments conducted, the streaming potential increases linearly with increasing injection pressure, and there is a proportional correlation between the streaming potential and the injection pressure. Moreover, the streaming potential increases with decreasing salinity of the injected fluid.
Two experimental results show that in medium and coarse sandstones, the phenomenon of streaming potential generated by fluid injection is obvious. Since the streaming potential of the fluid changes greatly when the water is injected with a lower salinity, it can be considered that in actual energy development, it is relatively easier to observe and collect streaming potential data via fresh water injection. The results for sandstone A and sandstone B with different porosities under the same experimental conditions used for the indoor streaming potential test were compared (
Figure 9). Core B, which has a high porosity, produces a more obvious streaming potential under the same conditions.
5. Test Verification in the Field
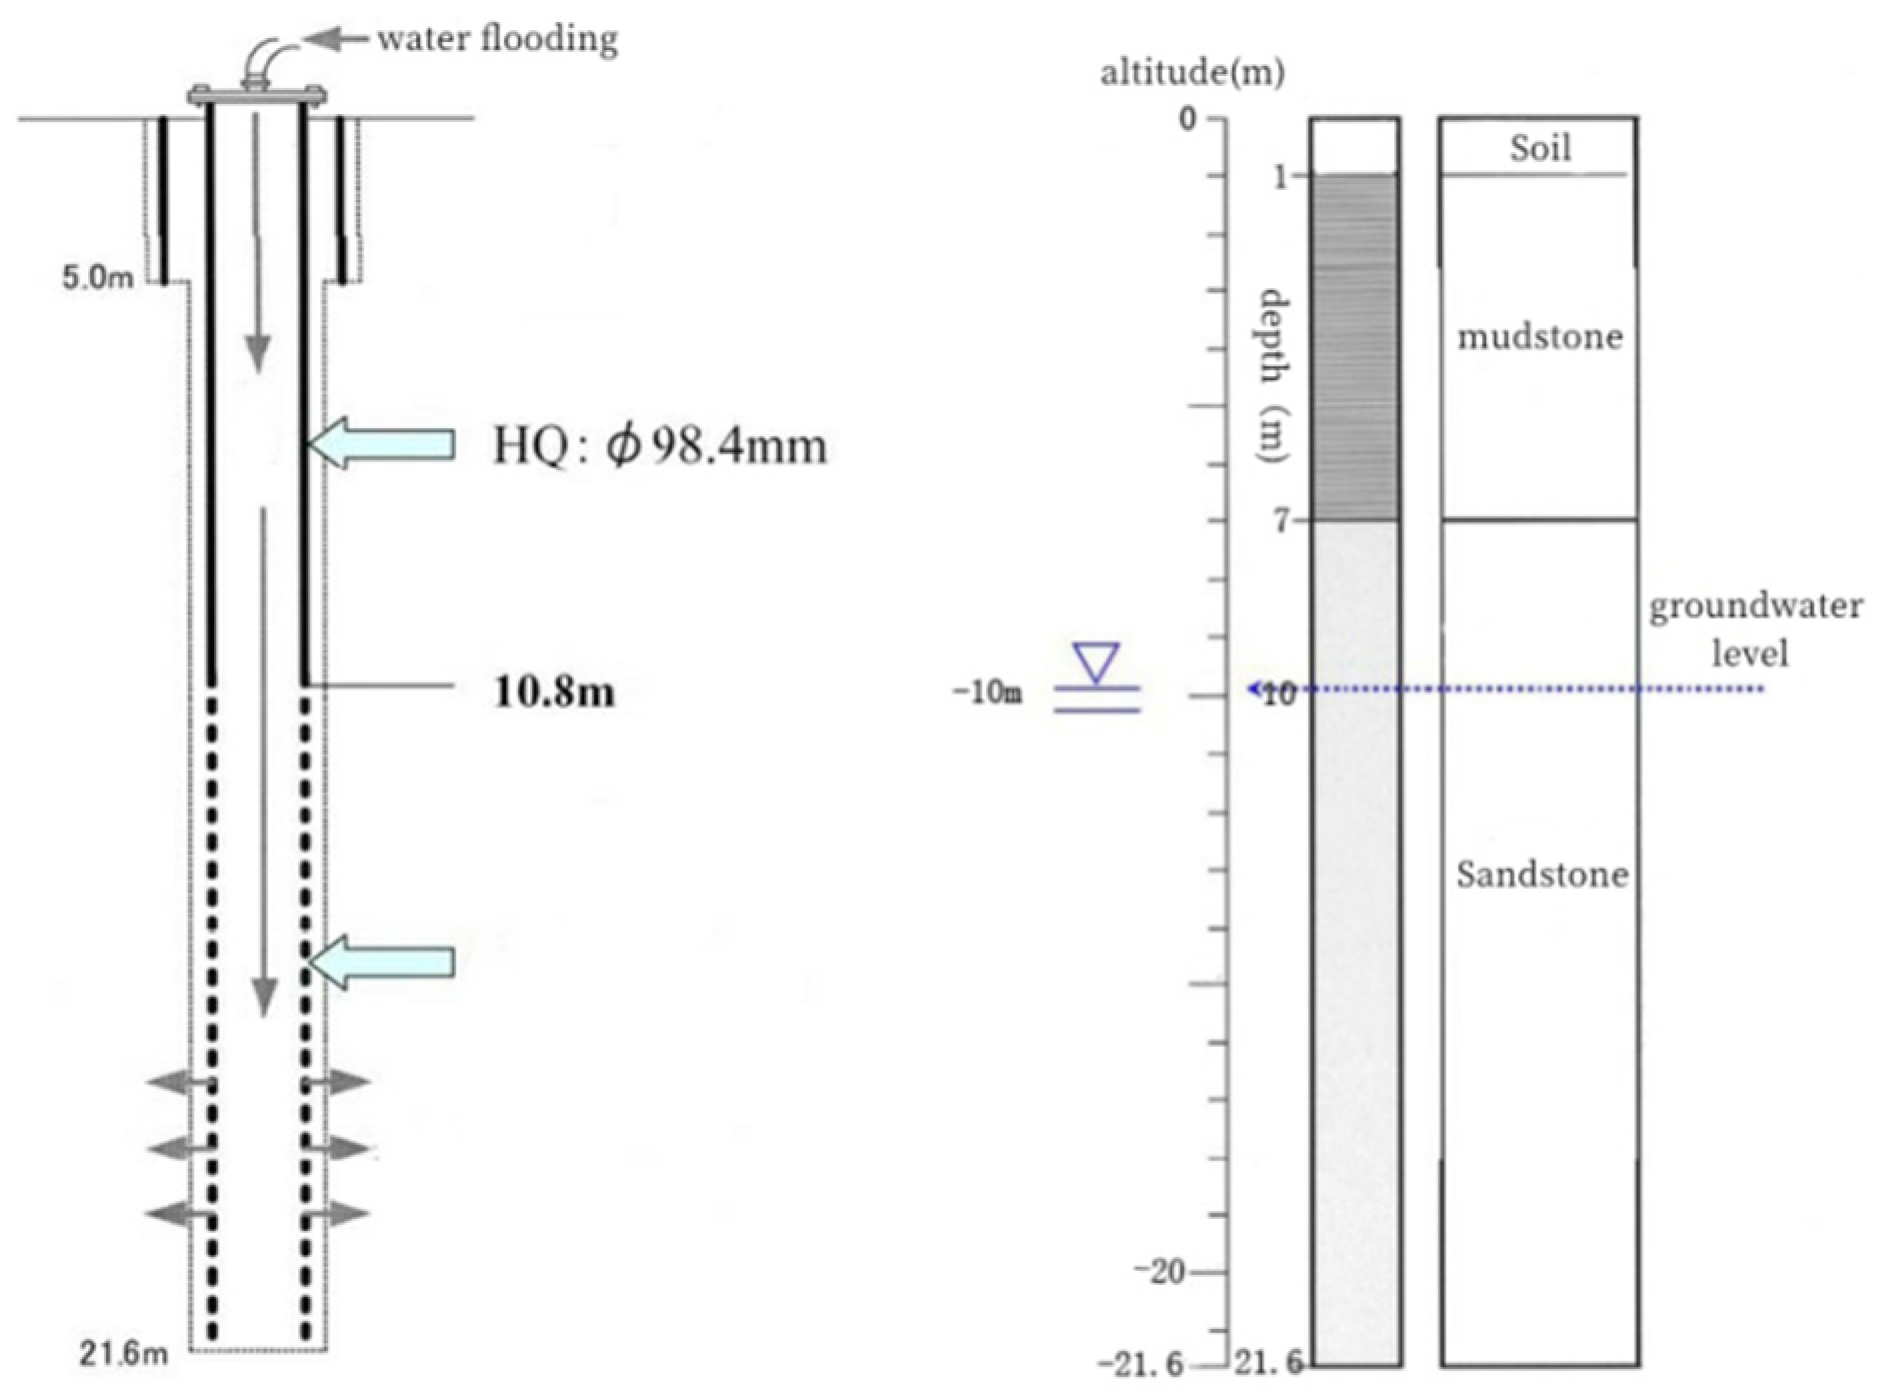
To study the actual situation of the streaming potential during underground water injection in the field, a small-scale water injection test was carried out. First, a bore hole with a diameter of 10 cm and a depth of 21.6 m was drilled. The stratum exposed by the drill hole was 1 m of cultivated soil, the mudstone stratum was 1–7 m deep, the medium sandstone stratum was below the mudstone stratum, the groundwater level was located 10 m underground, and the water injection test was carried out in the sandstone stratum.
With the drill hole as the midpoint of the test, two lines were arranged perpendicular to each other. Measuring line 1 was 128 m long in total, with an interval of 2 m. A total of 64 electrodes were arranged. In accordance with the field conditions, measuring line 2 was arranged with 62 electrodes, with an interval of 2 m.
During the test, a flower tube was inserted at −10.8 m in the borehole, and the water injection pressure was set to 0.13 MPa. The 10 m water head above the groundwater level was equivalent to one atmospheric pressure (approximately 0.1 MPa), and the total injection pressure was 0.23 MPa. The injection flow rate was 144 L/min, and the water was injected for 16 min in total. The experimental injection water was fresh water (
Figure 10).
We measured the natural potential of the test field using an underground electric field collector. The field potential measured after the experiment and the initial natural potential data were differentially processed to obtain the changing values of the streaming potential of the borehole at different times in the water injection experiment, and the distributions of the changes in the streaming potential are shown in
Figure 11a–d.
Figure 11a–d show the following: (1) At the beginning of water injection, there is an obvious change in the streaming potential around the water injection hole. (2) The change in the streaming potential is the largest at the beginning of water injection, and then it gradually decreases with increasing time (actually equivalent to the decrease in the pressure change). (3) After sixteen minutes of water injection, the streaming potential change can still be observed at approximately twenty minutes. This is because although the surface water injection has ended, the water still flows underground under the pressure of the water head, and the groundwater balance state is still being adjusted. (4) The results indicate that the streaming potential changes relatively uniformly around the borehole, and there is no obvious difference in all directions, indicating that the stratigraphic structure changes little. The results revealed by the streaming potential test are consistent with the actual distribution of underground rock formations. Monitoring of the streaming potential can visually indicate the direction of the flow diffusion.
6. Conclusions
The designed indoor high-pressure experimental system was used to measure the fluid streaming potential of sandstone cores with different porosities under simulated formation conditions. A small-scale field sandstone water injection verification experiment was carried out. The experimental results confirmed that the streaming potential was generated during the actual injection process in the rock mass. The experimental results show that the larger the core pore is, the more the streaming potential will be generated under the same conditions. In addition, during the injection process, the higher the ground injection pressure is, the easier the streaming potential can be found, and the easier it is to monitor the flow state of the injected liquid. The lower the salinity of the injected liquid during the injection process is, the more obvious the generated streaming potential is. The experimental results show that monitoring the changes in streaming potential can monitor the flow of subsurface fluids.
In this study, the flow state of underground fluid is monitored by the phenomenon that surface fluid injection generates current potential in the underground rock mass. This idea provides a new research direction for energy development and is expected to improve the efficiency of energy exploitation.


