Article

The Effect of a Photoactivated Ruthenium Nitrocomplex [RuCl(NO2)(dppb)(4,4-2 Mebipy)] on the Viability of Eukaryotic and Prokaryotic Cells, Including Bacterial Biofilms

by
Alexandre L. Andrade
1,
Aryane A. Pinheiro
1,
Ellen A. Malveira
1,
Isa M. F. Azevedo
1,
Ana C. S. Gondim
2,
Alzir A. Batista
3,
João H. A. Neto
3,
Eduardo E. Castellano
4,
Alda K. M. Holanda
2,
Mayron A. Vasconcelos
1,5,* and
Edson H. Teixeira
1,*
1
Laboratório Integrado de Biomoléculas, Departamento de Patologia e Medicina Legal, Universidade Federal do Ceará, Fortaleza 60430-160, CE, Brazil
2
Laboratório de Bioinorgânica, Departamento de Química Orgânica e Inorgânica, Universidade Federal do Ceará, P.O. Box 12200, Fortaleza 60440-900, CE, Brazil
3
Departamento de Química, Universidade Federal de São Carlos, P.O. Box 676, São Carlos 13565-905, SP, Brazil
4
Departamento de Física e Informática, Instituto de Física de São Carlos, Universidade de São Paulo, P.O. Box 369, São Carlos 13560-970, SP, Brazil
5
Faculdade de Educação de Itapipoca, Universidade Estadual do Ceará, Itapipoca 62500-000, CE, Brazil
*
Authors to whom correspondence should be addressed.
Processes 2024, 12(12), 2841; https://doi.org/10.3390/pr12122841
Submission received: 19 October 2024 / Revised: 28 November 2024 / Accepted: 9 December 2024 / Published: 11 December 2024
(This article belongs to the Special Issue Microbial Biofilms: Latest Advances and Prospects)

Abstract

:
Antimicrobial resistance (AMR) is a critical global public health problem. Many bacterial pathogens use biofilm formation as their main pathogenicity mechanism, a practical tactic for surviving in natural settings and colonized host tissues. Research using ruthenium(II) complexes has demonstrated antibacterial action linked to photodynamic therapy, an alternate method of microbial control. Thus, in this work, the photosensitive nitro complex [RuCl(NO2)(dppb)(4,4-Mebipy)] (I) was prepared and the X-ray structure was determined. Then, we investigated the antibacterial and antibiofilm activities, antibiotic-associated effects, and cytotoxicity. The results showed that complex I exhibited promising antimicrobial activity with MIC values ranging from 4 to 256 µg/mL and MBC from 4 to 32 µg/mL. The antimicrobial activity of this nitro complex was significantly enhanced with blue light irradiation, as confirmed by agarose gel electrophoresis of the pBR322 DNA, which must be related to the DNA cleavage promoted by the photorelease of NO. A synergistic effect against Staphylococcus aureus and Staphylococcus epidermidis strains was observed when combined with ampicillin, which exhibited FICI values from 0.186 to 0.311. Interestingly, complex I associated with tetracycline showed a synergistic effect only on Escherichia coli. Regarding biofilms, the irradiated complex I showed antibacterial activity against biofilm formation and mature biofilms. Furthermore, SEM and confocal analyses revealed changes in cell morphology and damage to the wall and plasma membrane. Complex I presented a percentage of hemolysis between 2 and 4%, and no cytotoxic effect was observed against murine dermal fibroblasts. In conclusion, the photoactivated ruthenium(II) complex showed antibacterial and antibiofilm activity against relevant bacteria.

1. Introduction

Antimicrobial resistance (AMR) is responsible for a growing global public health crisis and represents one of the most serious health challenges of the 21st century [1]. Recent estimates showed that in 2019, 4.95 million people died from diseases in which AMR played a significant role [2]. Furthermore, predictions for a worst-case scenario suggest that this number will increase to 10 million by 2050 if we continue on the current path, a fact that could send humanity toward one death every three seconds if urgent measures are not taken immediately [3]. AMR is an escalating issue in hospital settings, particularly in intensive care units (ICUs), where continuous exposure to antimicrobials creates intense selective pressure. In hospitals, AMR-associated infections are frequently reported in high-risk areas such as ICUs and surgical wards, where immunocompromised patients and invasive procedures increase susceptibility to infections [4]. Common infections associated with AMR in these settings include respiratory tract infections, urinary tract infections, and bloodstream infections [2]. Methicillin-resistant Staphylococcus aureus (MRSA), Escherichia coli, Klebsiella pneumoniae, Pseudomonas aeruginosa, and Acinetobacter baumannii are some of the most problematic strains. These strains are of particular interest for this study due to their high prevalence and potential for resistance in hospital environments, accounting for more than 80% of the million deaths directly attributed to AMR in 2019 [2,5]. Staphylococcus epidermidis, a representative of coagulase-negative staphylococci (CoNS), is also considered one of the main causes of healthcare-associated infections (HAIs) of the bloodstream, whose frequency is around 30 to 40% [6].
Among the ways to resist and tolerate exposure to antimicrobials, the formation of biofilms is one of the main virulence factors associated with AMR and plays an important role in survival, colonization of environments, and establishment of microbial infections [7]. Bacterial biofilms are estimated to contribute to over 80% of bacterial illnesses, with 65% of hospital infections linked to biofilm formation on implantable medical devices [8]. Biofilms have been associated with numerous chronic and refractory disorders, including endocarditis, cystic fibrosis, pneumonia, periodontitis, chronic rhinosinusitis, and otitis media, among others [9,10,11,12].
In this context, novel antimicrobial agents, some of which exhibit effective penetration into biofilms, have been suggested as alternatives to conventional antibiotics [13]. Regarding strategies to combat AMR, natural and synthetic compounds have emerged as the most promising candidates for new antimicrobial drugs [14].
Among the antimicrobial alternatives, ruthenium complexes have been investigated as promising antimicrobial agents or as adjuvant alternatives to more traditional antibiotics [15,16,17,18]. The mechanism of ruthenium complexes primarily involves: (i) their functional and structural roles, wherein the Ru metal center binds to biological targets; (ii) the metal center serving as a carrier for active ligands to enhance pharmaceutical efficacy; (iii) the metal complex functioning as a catalyst for glutathione oxidation and the induction of reactive oxygen species (ROS); and (iv) acting as a photosensitizer to produce singlet oxygen [19,20].
In addition, photodynamic therapy (PDT), demonstrating reduced vulnerability to bacterial antimicrobial resistance mechanisms owing to its free-radical-generating capabilities, is particularly noteworthy. PDT has proven to be effective against microbial proliferation when utilized in conjunction with compounds possessing biologically significant properties upon light irradiation, such as ruthenium complexes [21]. Furthermore, the therapeutic uses of nitric oxide (NO) as antibacterial agents have spurred significant research interest in NO donor chemicals and associated materials that can effectively deliver NO to targeted locations [22,23,24]. Transition-metal nitrosyl compounds, like those of ruthenium (Ru-NO), serve as photolabile nitric oxide donors, enabling the controlled release of nitric oxide through light application. The majority of Ru-NO complexes demonstrate photoactivation under UV light (<400 nm), accompanied by comparatively poor quantum yields for NO release [17,25]. The photorelease of nitric oxide using visible light remains a difficulty. In photolysis, certain ruthenium nitro complexes may also emit NO due to the disproportionation of other nitrogen oxides [26,27]. For example, da Silva and co-workers have shown that nitrite ion (NO2) bound to a Ru(II) center could act as a photochemical source of NO, using light as a stimulus (at 355 nm), in complexes of the type cis-[Ru(NO2)L(bpy)2]+, where L = pyridine or picoline [28].
We prepared and investigated the reactivity of [RuCl(NO2)(dppb)(4,4-Mebipy)] named complex I, where dppb = 1,4-bis(diphenylphosphino)butane and 4,4′-Mebipy = 4,4′-dimethyl-2,2-bipyridine. Recently, the synthesis and characterization of complex I were published by Silva et al. [29]. However, the X-ray structure has not been previously reported. Herein, the crystal structure of the nitro complex (I) was successfully elucidated using X-ray crystallography. In addition, the photochemical behaviors of complex I along with the efficiency of DNA photocleavage, cytotoxicity, and antibacterial and antibiofilm activities were investigated.

2. Materials and Methods

2.1. Chemicals

Crystal violet, methanol, acetic acid, dimethyl sulfoxide (DMSO), and LIVE/DEAD™ BacLight™ (L7007) were purchased from Sigma-Aldrich (Darmstadt, Germany). Tryptic soy broth (TSB) and tryptic soy agar (TSA) were purchased from KASVI (Padova, Italy). Ultrahigh-purity water from a Millipore system (model: Millipore Direct Qs 3UV) was used throughout the experiments. All chemicals used were of reagent grade or comparable purity. All chemicals used in the synthesis of the nitro complex were purchased from Sigma/Aldrich/Merck (St. Louis, MO, USA) and were used as received.

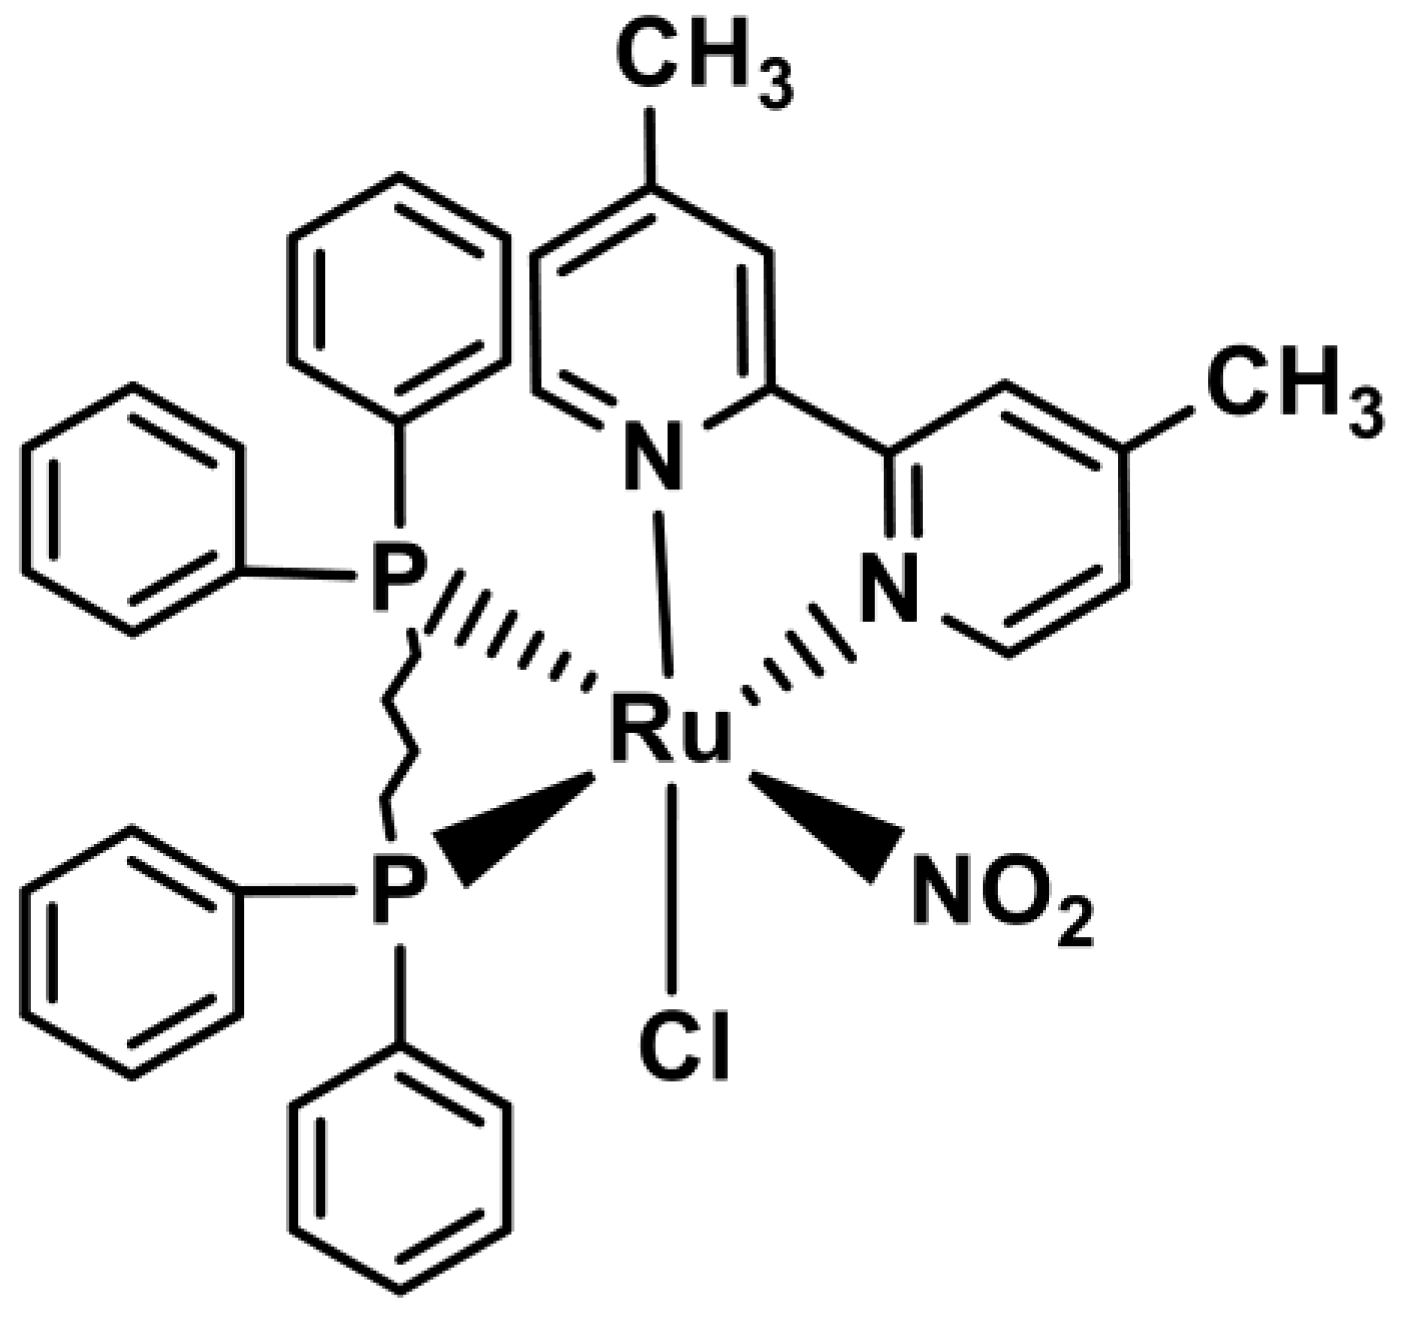
2.2. Synthesis of the Nitro Complex [RuCl(NO2)(dppb)(4,4-Mebipy)]

The nitro complex [RuCl(NO2)(dppb)(4,4-Mebipy)] was prepared according to a previously published procedure [29]. First, the complex was synthesized by adding 0.050 g (0.0639 mmol) of the precursor [RuCl2(dppb)(4,4′-Mebipy)] to 15 mL of previously deaerated methanol in a 50 mL flask. Subsequently, 0.013 g (0.192 mmol) of the sodium nitrite ligand (NaNO2) was added in a 1:3 precursor/ligand ratio to ensure excess. After 1 h of reaction under magnetic stirring and an inert atmosphere, an orange precipitate was formed, which was filtered and washed with deaerated methanol and distilled water to remove the excess nitrite and then with ether. Yield was 82.88% (0.045 g). Furthermore, all remnants of the reagents utilized in the manufacture of compound I (methanol and distilled water) were entirely eliminated after filtration, rotary evaporation, and vacuum drying. Figure 1 illustrates the chemical structure of the ruthenium nitro complex.

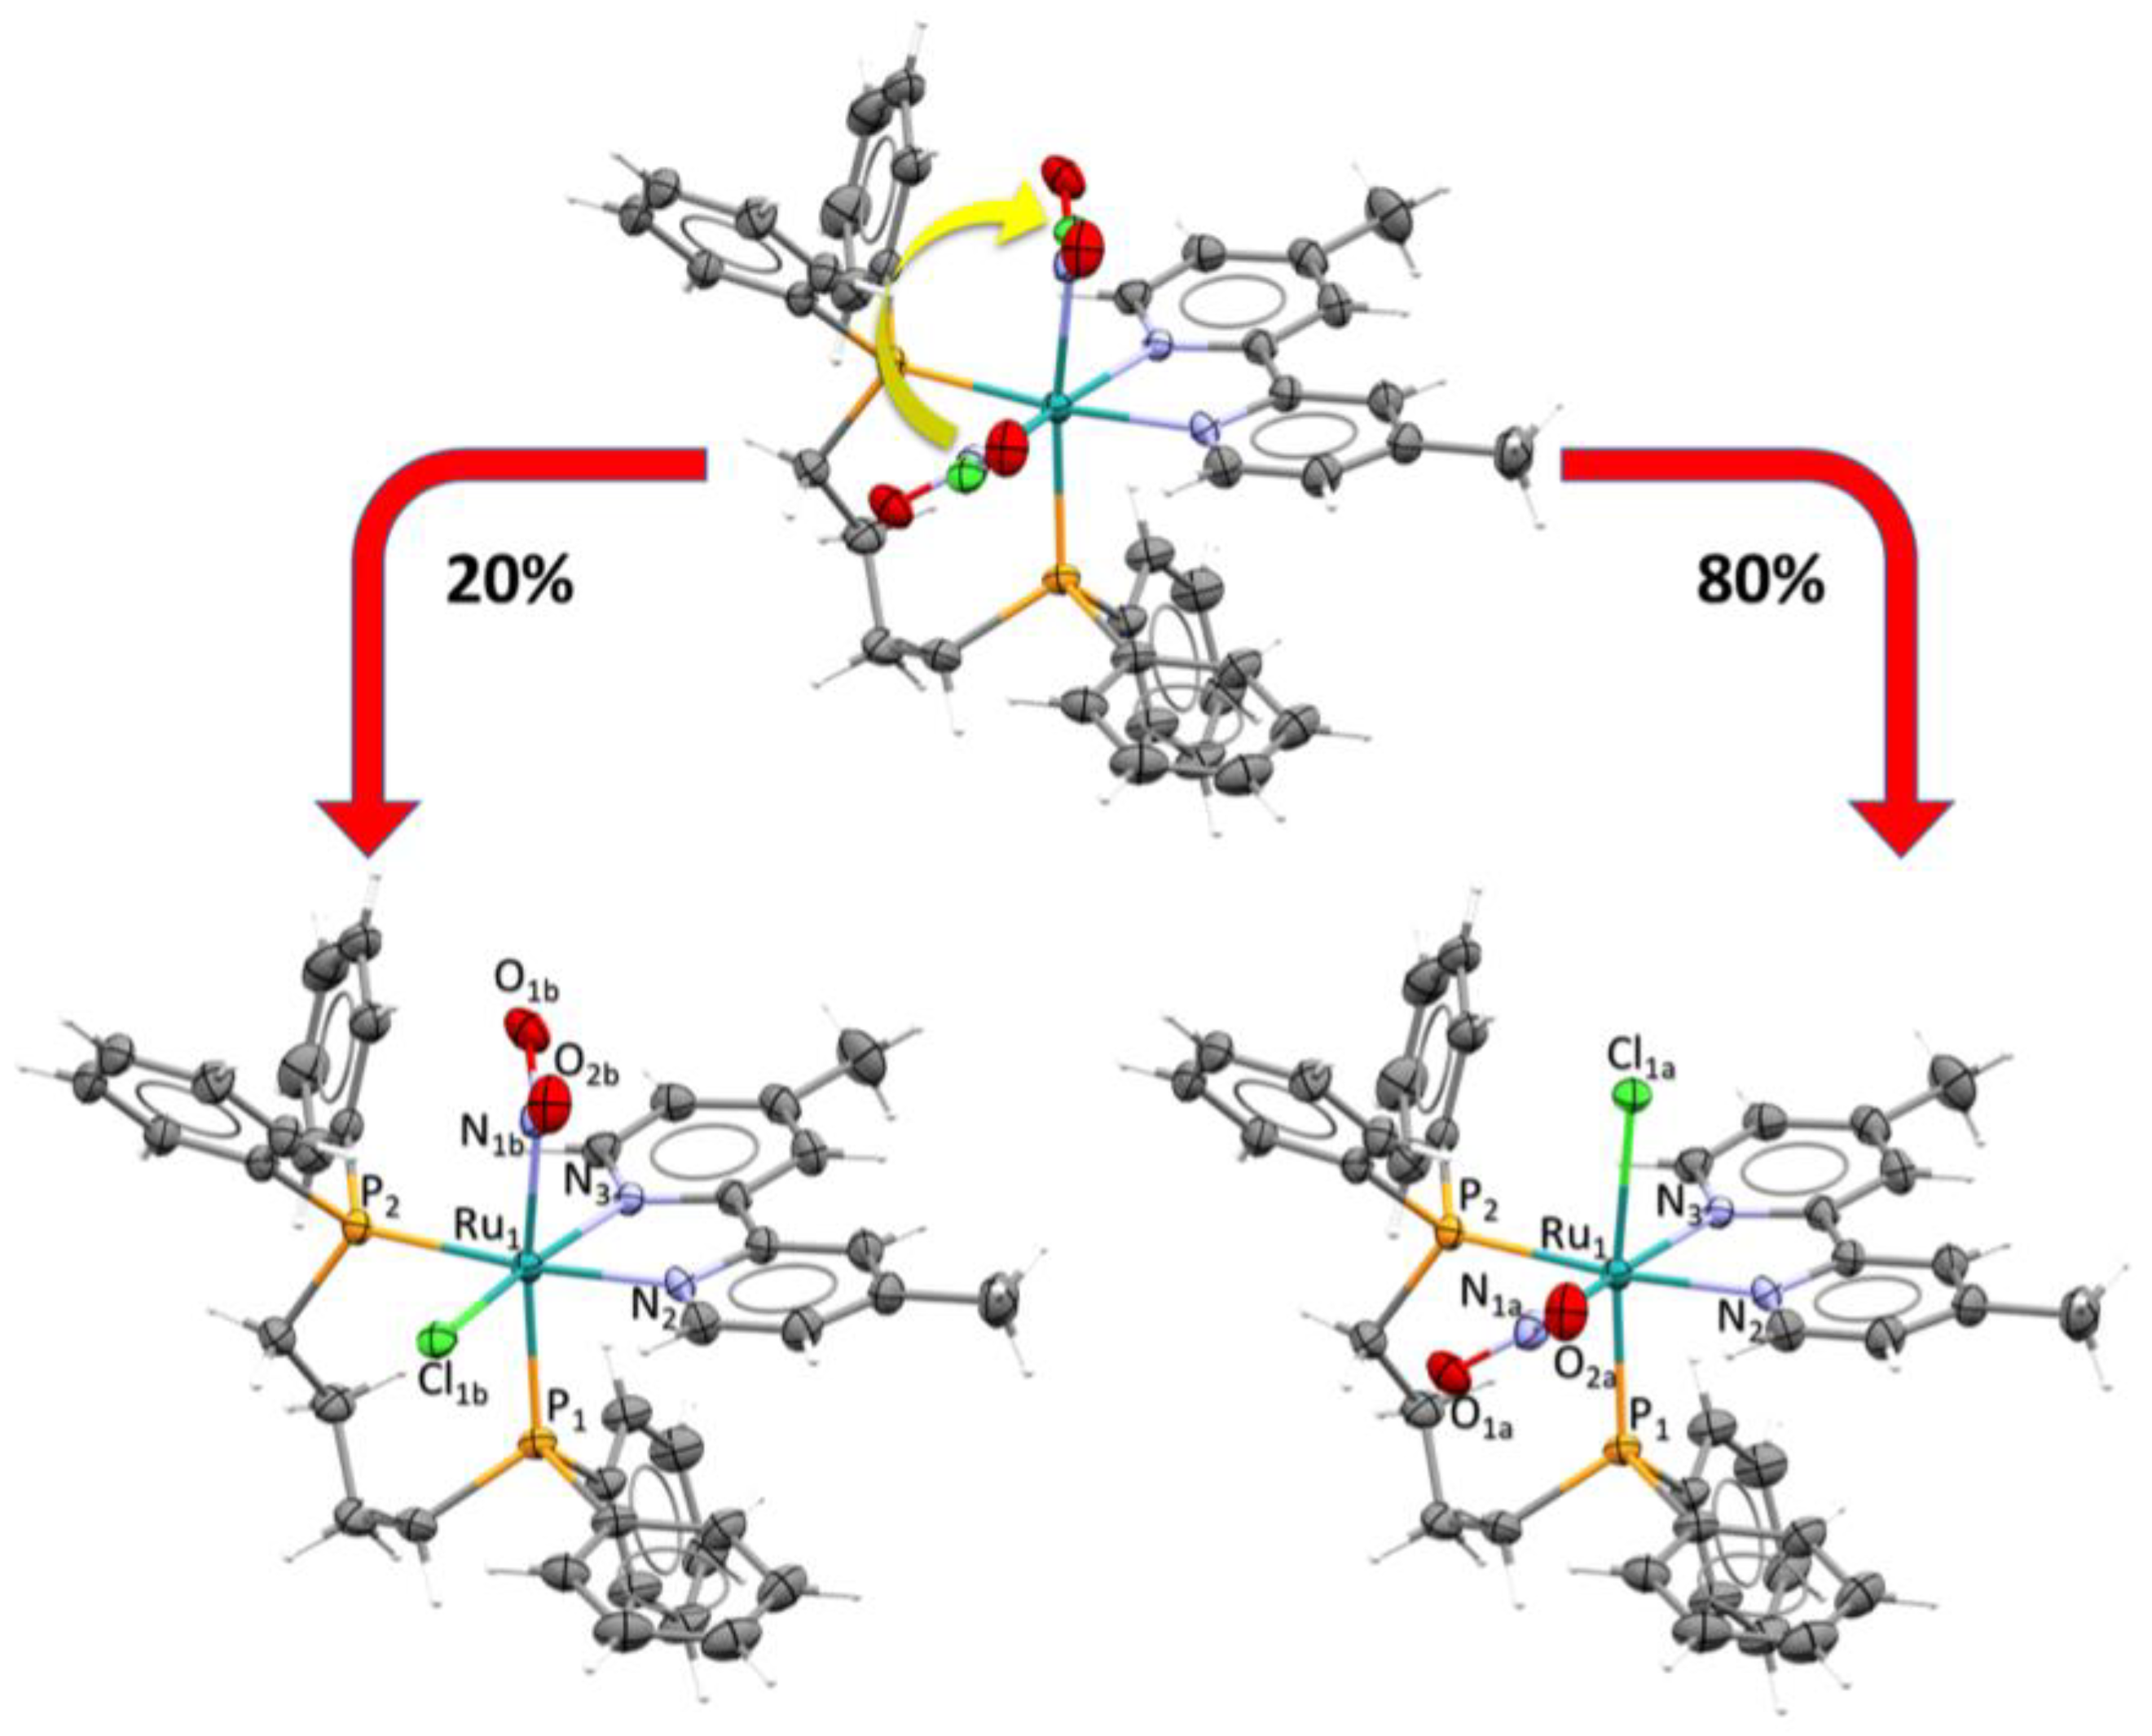
2.3. X-Ray Structure Determination

X-ray diffraction experiments were conducted on a Rigaku XtaLAB mini II diffractometer with a graphite monochromator using Mo Kα radiation (λ = 0.71073 Å) at room temperature (293 K). Cell refinement, data integration, and reduction were performed using CrysAlisPro Version 1.171.35.15 (Agilent Technologies, Oxfordshire, UK) [30]. The crystal structures were solved by SHELXT2014 and refined by SHELXL2014 [31], from the OLEX2 suite [32]. The multiscan method was used for the absorption corrections [33]. Tables and structure representation were generated by OLEX2 and MERCURY [34], respectively. In this complex, the NO2 and chloride ligands are disordered in the asymmetric unit. All these disordered groups were observed in two positions (PART1—NO2 trans to the phosphorous atom of dppb/Cl trans to nitrogen atom of dppb 4,4-Mebipy, PART2—NO2 trans to nitrogen atom of 4,4-Mebipy/Cl trans to phosphorous atom of dppb) which were refined with anisotropic displacement parameters. At the end of the refinement, the occupancy factors for all these disordered moieties were fixed to 0.8 for PART1 and 0.2 for PART2. Some geometric restraints (eADP) were employed to make the disordered atoms more reasonable. CCDC 1908652 contains the supplementary crystallographic data for this paper, these data can be obtained from the Cambridge Crystallographic Data Centre via www.ccdc.cam.ac.uk/data_request/cif (accessed on 18 October 2024). The main crystal data collection and structure refinement parameters are summarized in Table 1 and Table 2.

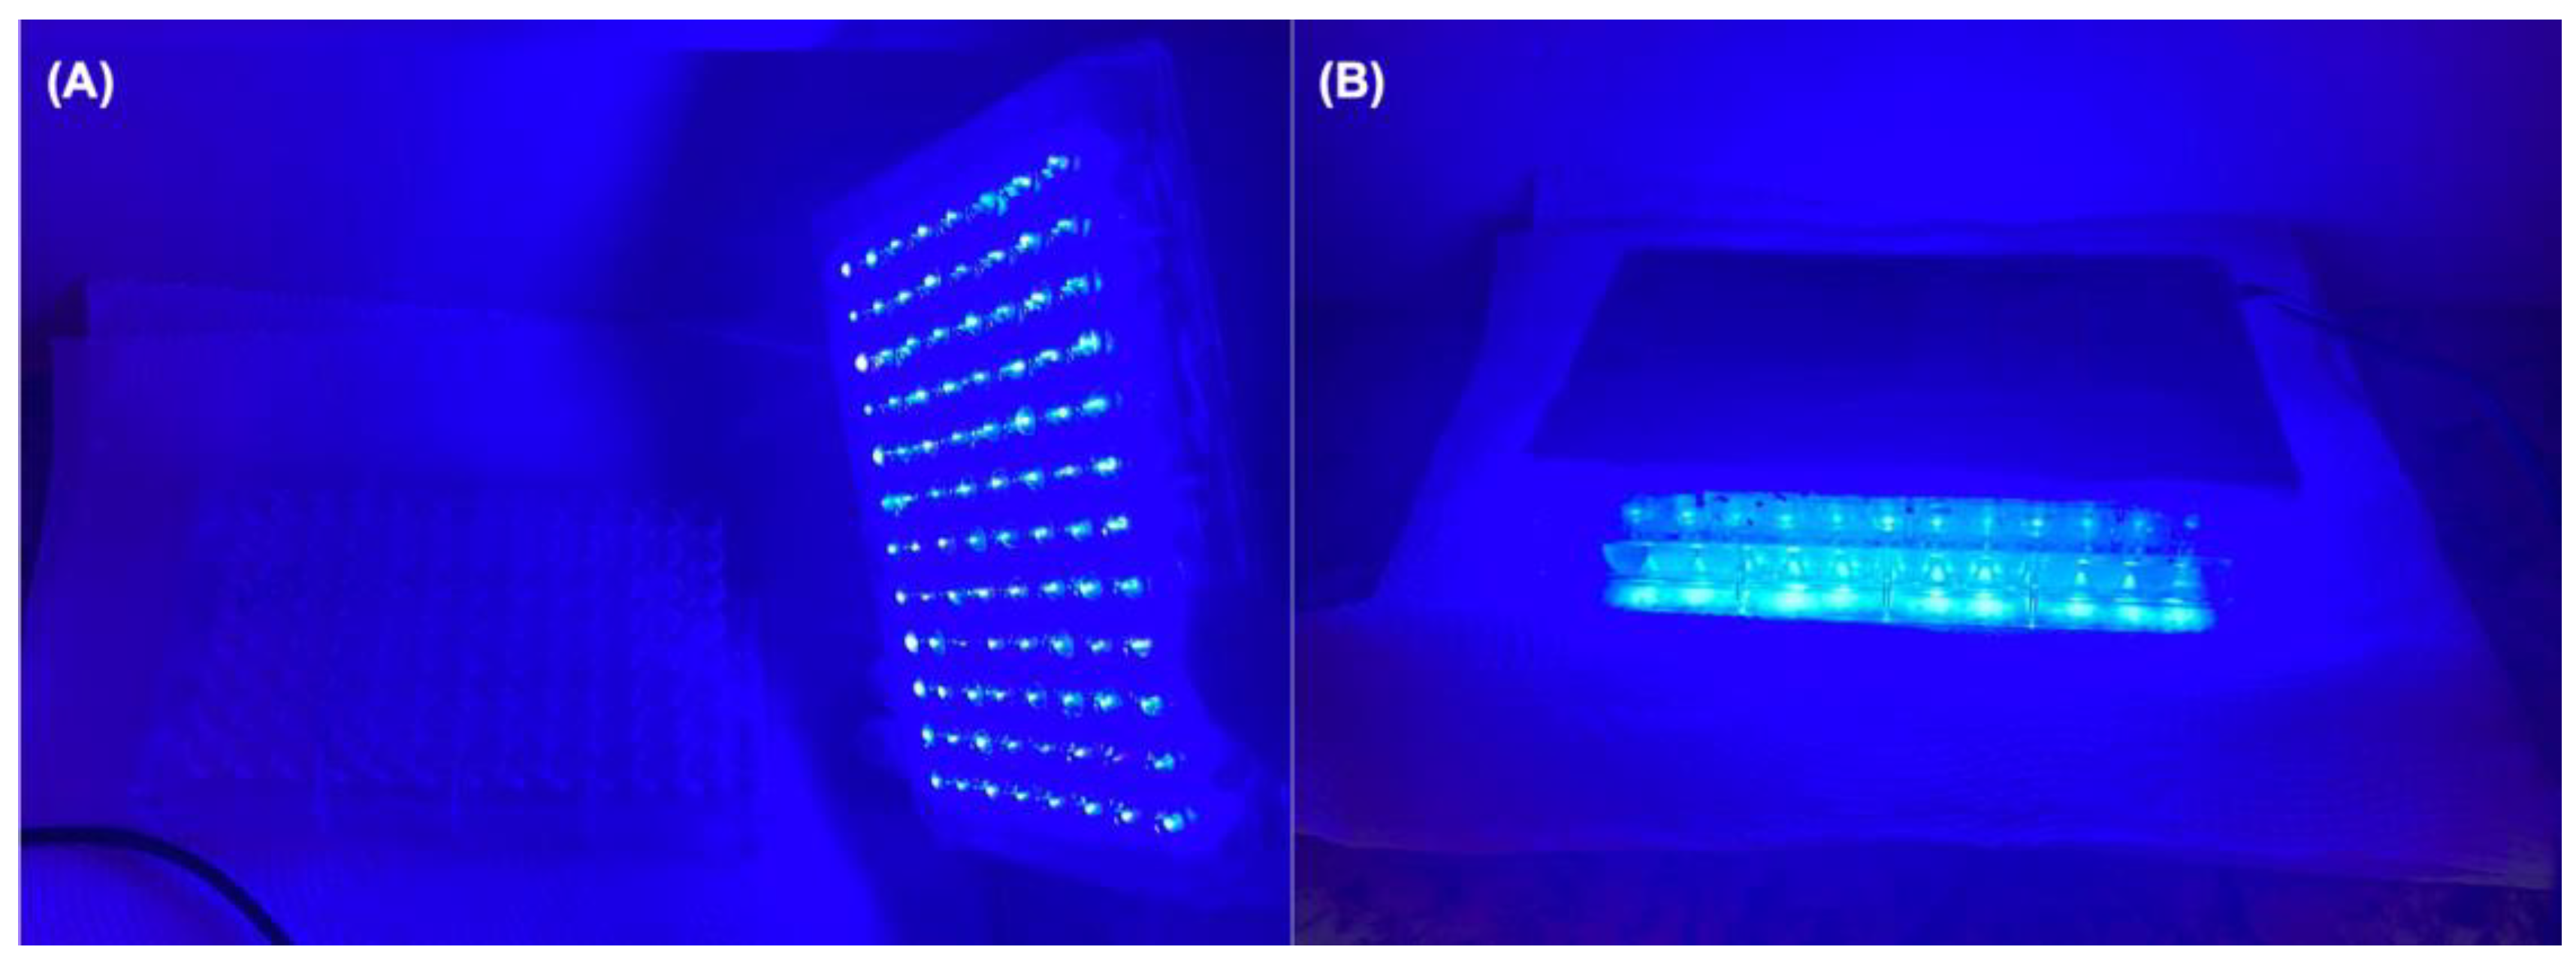
2.4. Continuous Photolysis

Continuous photolysis was conducted utilizing a blue LED (λmax = 463 nm).

2.5. Electrochemical Experiments

Electrochemical tests were conducted using an Epsilon type E2-818 potentiostat (BAS Inc., West Lafayette, IN, USA) at 25 °C. The measurements were conducted in a 0.10 M Na(CF3CO2) aqueous solution (pH 7.0) with a standard three-electrode glass cell, including a glassy carbon electrode (about 0.13 cm2 in geometrical area), a platinum foil, and an Ag/AgCl reference electrode, serving as the working, auxiliary, and reference electrodes, respectively.

2.6. Carboxy-PTIO Reaction to Identify NO

Carboxy-PTIO (2-(4-carboxyphenyl)-4,4,5,5-tetramethylimidazoline-1-oxyl-3-oxide) was employed to investigate nitric oxide production, shown by distinct alterations in the UV-vis spectra. This organic spin-trap was utilized at concentrations of 100–200 μM in a 0.1 M phosphate buffer at pH 6.3, in conjunction with the [RuCl(NO2)(dppb)(4,4-Mebipy)] complex and under light irradiation.

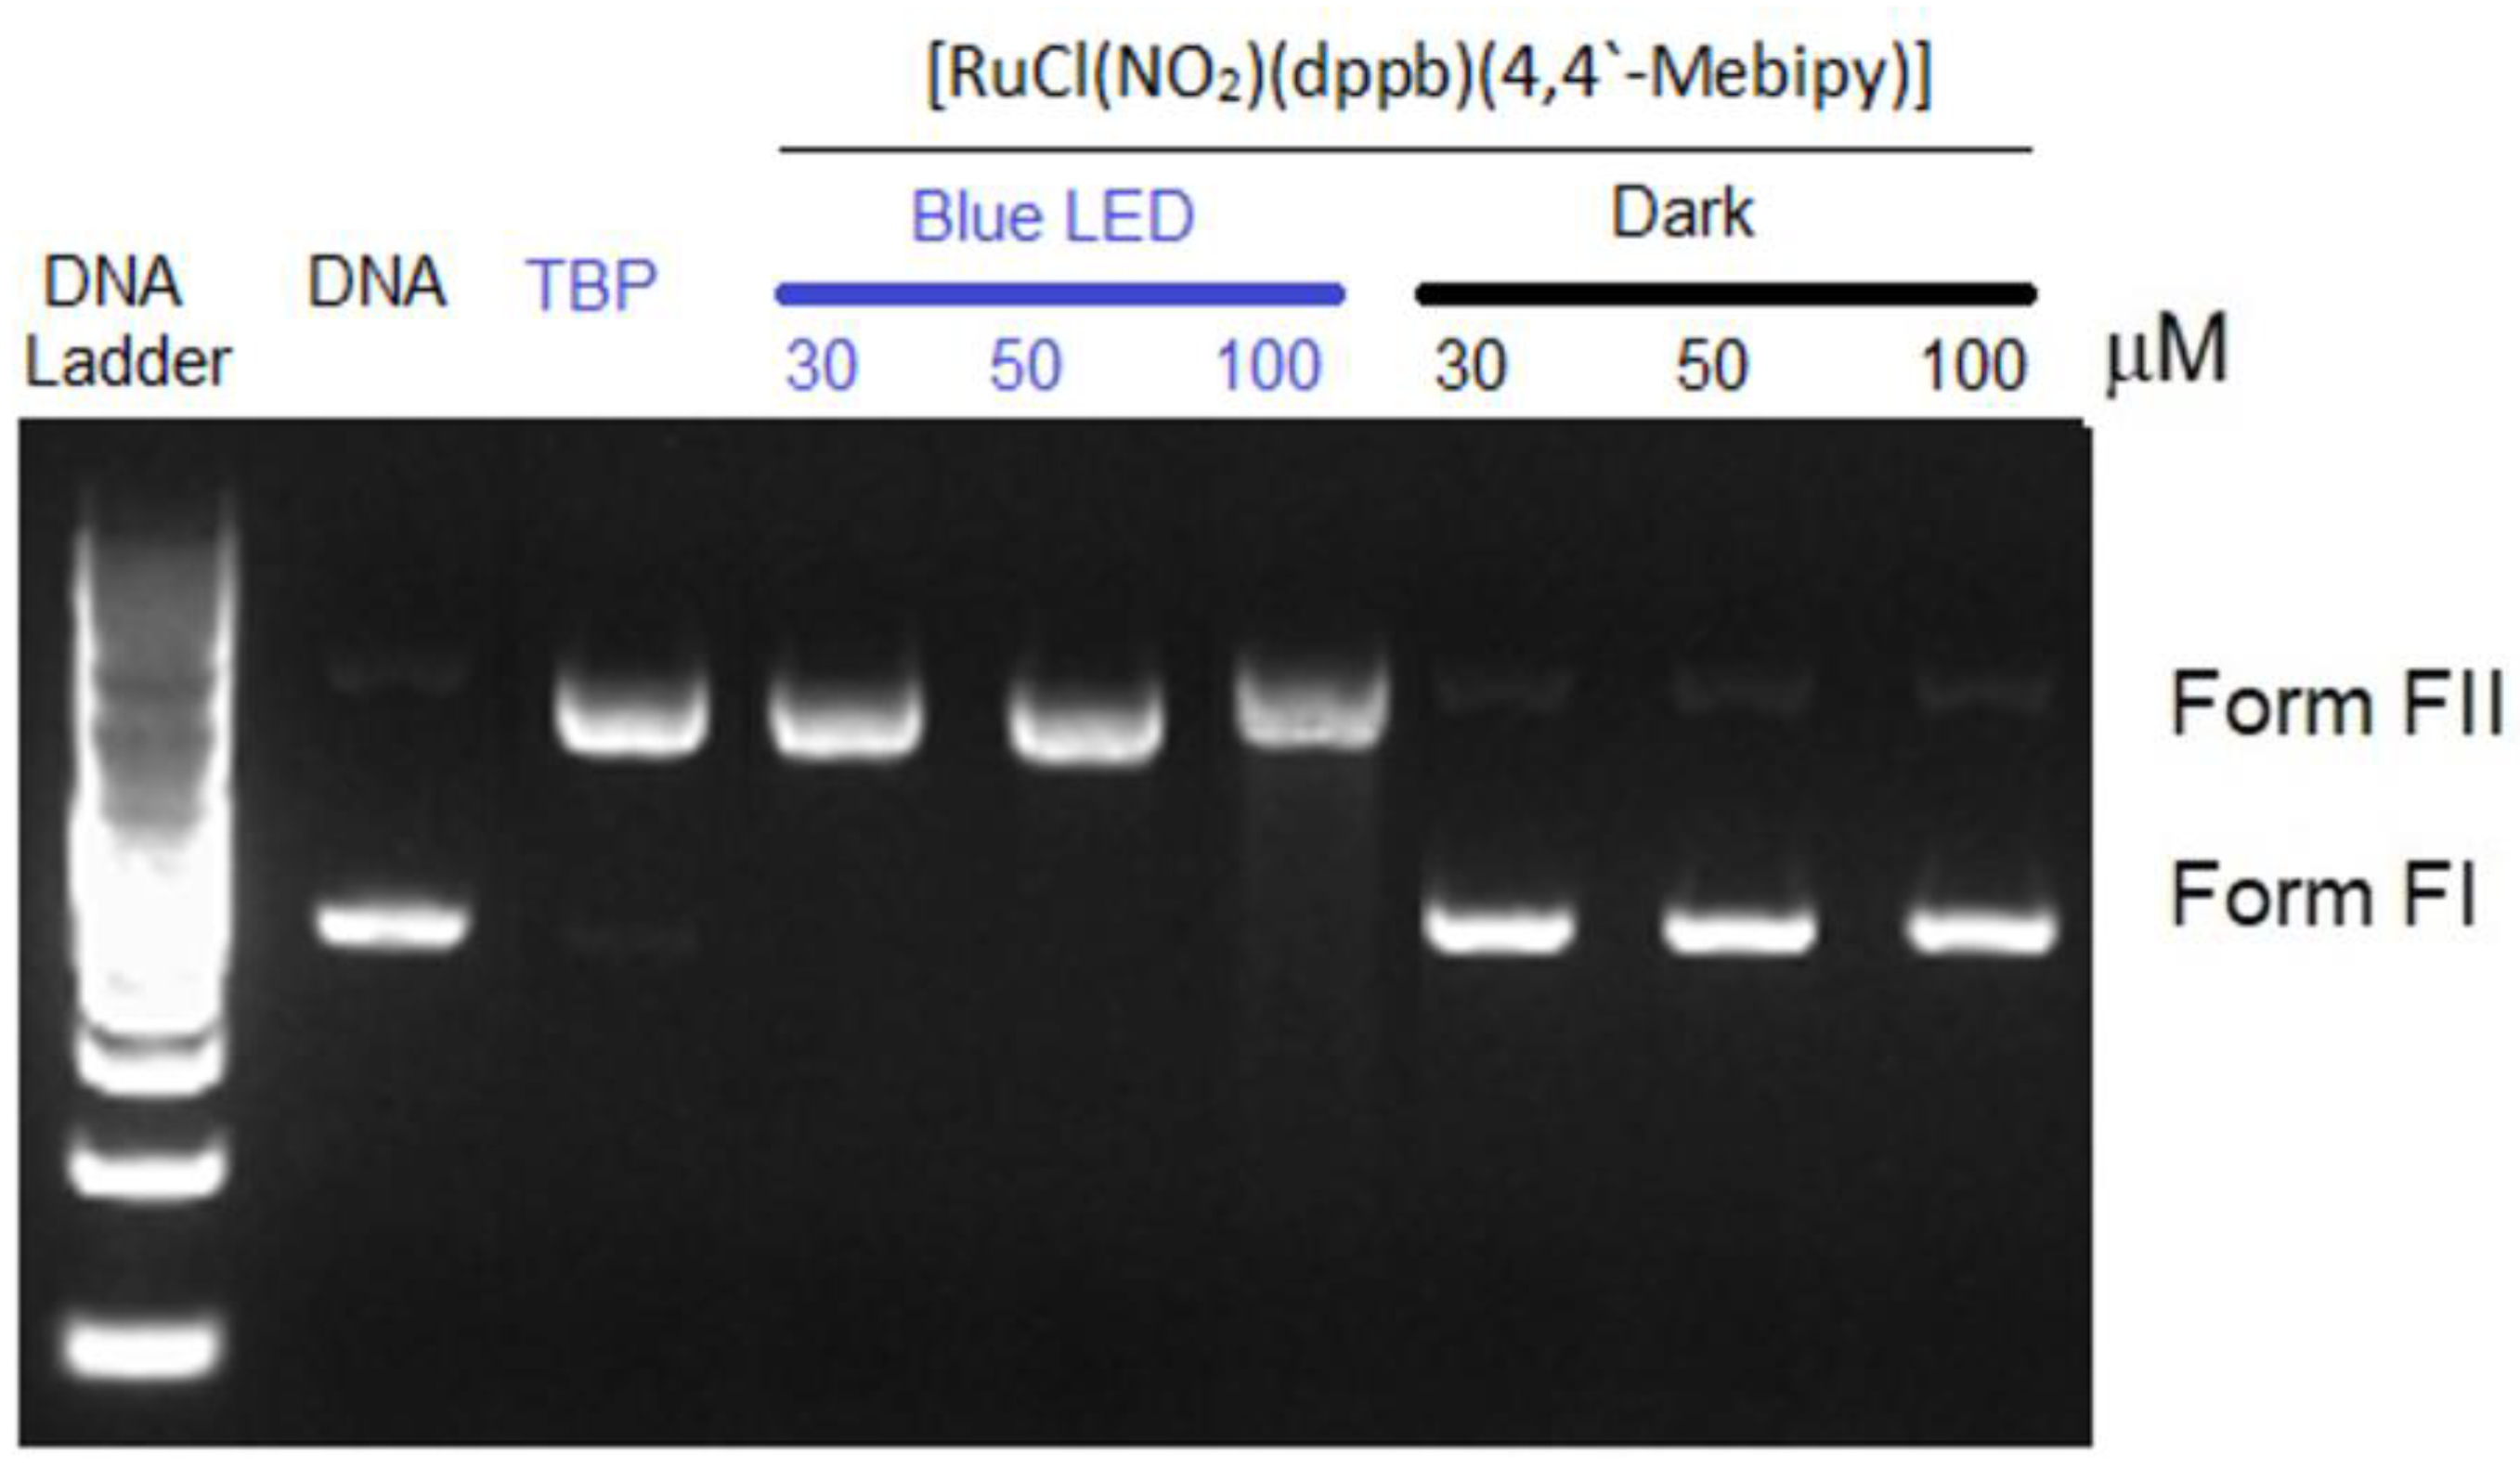
2.7. DNA Photocleavage Assay

The tests were conducted utilizing electrophoresis in agarose gel (0.8% w/v in TAE buffer, pH 8.0). In all investigations, supercoiled pBR322 DNA (21 mmol/L in nucleotide base pairs) was utilized in a 10 mmol/L Tris–HCl solution (pH 8.0), which was combined with complex I and subjected to blue light irradiation for 1 h or incubated in the dark for 1 h. The samples underwent analysis post-electrophoresis by staining with GelRed (1 mg/mL, Biotium, Hayward, CA, USA) for 30 min, and images were captured utilizing a Gel Doc XR + System (Bio-Rad, Hercules, CA, USA). All irradiation studies utilized a Basetech Conrand, 1.7 W (λmax = 463 nm) blue light source.

2.8. Bacterial Strains and Culture Conditions

In this study, the Gram-positive strains Staphylococcus aureus ATCC 25923 (susceptible to methicillin), Staphylococcus aureus ATCC 700698 (resistant to methicillin—MRSA), Staphylococcus epidermidis ATCC 12228, and Staphylococcus epidermidis ATCC 35984 (resistant to methicillin—MRSE) and Gram-negative strains Pseudomonas aeruginosa ATCC 27853 and Escherichia coli ATCC 11303 were used.
Bacterial stocks were preserved in a tryptic soy broth (TSB) solution with 20% glycerol at −80 °C. Petri dishes with tryptic soy agar (TSA) were inoculated with bacteria and incubated for 24 h at 37 °C. Bacterial suspensions were calibrated to a final concentration of 1 × 10⁶ colony-forming units per milliliter (CFU/mL) utilizing turbidimetry (620 nm) and established calibration curves for each strain.

2.9. Minimum Inhibitory Concentration (MIC) and Minimum Bactericidal Concentration (MBC) Determination

The microdilution technique was employed to ascertain the minimum inhibitory concentration (MIC) in accordance with the Clinical and Laboratory Standards Institute M07-A10 [35]. Complex I was diluted in CAMHB medium containing 4% DMSO at concentrations from 128 to 2 µg/mL for Gram-positive bacteria and from 512 to 4 µg/mL for Gram-negative bacteria. Subsequently, 100 µL was distributed into 96-well plates alongside 100 µL of a bacterial suspension previously adjusted to 5 × 10⁵ CFU/mL in CAMHB. The negative control comprised CAMHB medium with 4% DMSO, excluding complex I. Ampicillin and tetracycline were evaluated at doses of 1024 to 0.250 µg/mL and 256 to 0.250 µg/mL, respectively. The plates underwent exposure to light irradiation using a 96-array of LED blue light (λmax = 463 nm; power = 8 mW/cm2) for 1 h or were maintained in darkness for 1 h, followed by incubation for 24 h at 37 °C. An LED light system was employed, specifically modified as a 96-well plate top, featuring a dedicated lamp within each well to guarantee homogeneous irradiation of all samples (Figure 2). The MIC value was established as the minimum concentration of the chemical that exhibited 100% suppression of observable bacterial growth. The optical density of the contents in each well was assessed at 620 nm utilizing a microplate reader (SpectraMax® I3, Molecular Devices, Sunnyvale, CA, USA). The minimum bactericidal concentration (MBC) was assessed by extracting 10 µL of an aliquot from each well exhibiting no apparent growth on agar plates incubated at 37 °C. The MBC was identified as the minimal chemical concentration at which no colony development occurred [36].

2.10. Checkerboard Assay

The evaluations of the resultant effects of the combinations of complex I and antibiotics (ampicillin or tetracycline) were evaluated by checkerboard assay [37]. The MIC, 1/2 × MIC, 1/4 × MIC, 1/8 × MIC, and 1/16 × MIC of both were tested in the combination of complex and antibiotic. The plates were irradiated with blue light (λmax = 463 nm) for 1 h and then incubated for 24 h at 37 °C. The combination effect was evaluated by calculation of the fractional inhibitory concentration index (FICI). The FICI was determined as:
FICI = FIC(A) + FIC(B)
where:
FIC(A) = [(minimum concentration of complex in combination)/(minimum con-centration of complex alone)];
FIC(B) = [(minimum concentration of antibiotics in combination)/(minimum concentration of antibiotics alone)].
The FICI values were interpreted as ≤ 0.5, synergistic (S); >0.5 to ≤4, no interaction (NI); or >4, antagonism (A) effect.

2.11. Biofilm Susceptibility Assay

The biofilm susceptibility assays were conducted on 96-well polystyrene plates following the methodology of Andrade et al. [16], with changes. To assess the effect of the complex on biofilm formation, the wells were filled with 100 μL of each strain at a concentration of 1 × 10⁶ cells/mL, along with 100 μL of the complex at concentrations varying from 256 to 2 µg/mL in TSB containing 4% DMSO. The negative control comprised TSB medium with 4% DMSO, excluding complex I. The plates were exposed to blue light (λmax = 463 nm) for 1 h and thereafter incubated for 24 h at 37 °C. Subsequent to biofilm formation, the wells were rinsed thrice to eliminate loosely adhered cells, and the biofilms were assessed using total biomass measurement and viable cell enumeration.

2.11.1. Quantification of Total Biomass

The biomass of the biofilm was assessed utilizing the crystal violet (CV) technique. Following 24 h of incubation, the plates were washed thrice with sterile distilled water to eliminate loosely attached cells. Thereafter, the wells were filled with 200 μL of 95% methanol for 5 min. Subsequently, 200 μL of 1% crystal violet was introduced to the wells and incubated for 5 min at 25 °C. The surplus color was eliminated, and the plates were washed with distilled water. The residual dye was solubilized in a 33% acetic acid solution. The eluted stain from each well was quantified by assessing the optical density at 590 nm (OD590) with a microplate reader (SpectraMax® I3, Molecular Devices, Sunnyvale, CA, USA).

2.11.2. Viable Cell Count

Subsequent to biofilm formation, the culture media was discarded, and the plates were washed twice with sterile distilled water to eliminate loosely adhering cells. Subsequently, 200 μL of sterile distilled water was introduced into each well, and the plate was sonicated (Cristófoli/EQM-CF, Cristófoli Equipamentos de Biossegurança LTDA, PR, Brazil) for 8 min to dislodge the cells encapsulated in the biofilms. Serial decimal dilutions of the bacterial solution were inoculated into TSA medium and incubated at 37 °C for 24 h. The CFU count was quantified, and the results were presented as log10 CFU/mL.

2.12. Effect of Complex I on Mature Biofilms

The effect of complex I on mature biofilms was assessed as outlined by Andrade et al. [16]. The wells were initially filled with 200 μL of a bacterial suspension (1 × 10⁶ CFU/mL) and incubated for 24 h at 37 °C. Subsequently, the supernatant was removed, and the wells were rinsed twice with 200 μL of sterile distilled water to exclude non-adherent cells. Subsequently, 200 μL aliquots of complex I at concentrations varying from 256 to 2 µg/mL were introduced into the wells. The plates were incubated for 24 h at 37 degrees Celsius. Subsequently, the medium was eliminated, and each well was rinsed three times with 200 μL of sterile distilled water. The impact of the ruthenium complex on mature biofilms was assessed using biomass quantification and viable cell enumeration, as detailed in Section 2.11.

2.13. Scanning Electron Microscopy (SEM)

To evaluate the effects of complex I on bacterial cell structures and biofilm, experiments were conducted using one Gram-positive and one Gram-negative strain. The biofilms of S. aureus ATCC 700698 (MRSA) and E. coli ATCC 11303 were assessed in 24-well plates as outlined by Andrade et al. [16]. To examine the inhibition of biofilm formation, the plates with biofilms were incubated for 24 h with complex I at concentrations of 32 μg/mL for S. aureus and 256 μg/mL for E. coli, followed by 1 h of blue light irradiation. The plates were taken out of incubation, weakly adhered cells were eliminated by rinsing with sterile ultrapure water, and the plates were permitted to dry at 25 °C. Wells containing biofilms were dehydrated in succession using escalating concentrations of ethanol (70% for 10 min, 95% for 10 min, and 100% for 20 min) and permitted to dry at ambient temperature. Before observation, cells were positioned on aluminum holders, coated with gold particles, and subsequently examined using a scanning electron microscope (Quanta 450 FEG, FEI, Waltham, MA, USA).

2.14. Confocal Laser Scanning Microscopy

The effects of complex I treatment on biofilms were also analyzed using confocal laser scanning microscopy according to the methodology described by Castelo Branco et al. [38]. The activity of complex I on biofilm formation and mature biofilms of S. aureus ATCC 700698 (MRSA) was investigated. S. aureus strain 700698 biofilm was chosen because it demonstrated higher susceptibility in the biofilm assays to the complex. In addition, this strain was chosen due to its resistance profile (MRSA) and relevance to clinical settings.
S. aureus biofilms were grown directly on the surface of round glass coverslips (K5-2020, Olen, Kasvi, São José dos Pinhais, PR, Brazil) in a 24-well culture plate and treated with complex I at concentrations of 32 or 64 μg/mL, respectively, and subsequently subjected to irradiation with blue light for 1 h and incubated at 37 °C for 24 (biofilm formation) or 48 h (mature biofilm). After incubation, the plates were washed twice with PBS (pH 7.4), and, subsequently, the biofilms were stained with the LIVE/DEAD fluorescent reagent kit (Invitrogen, Eugene, OR, USA). The coverslips were evaluated using a Nikon C2 confocal microscope at 488 nm for the detection of the SYTO9 dye, which identifies viable cells (in green), and at 561 nm for the detection of propidium iodide, which identifies dead cells or cells with membrane damage.

2.15. Hemolytic Activity Assay

The hemolytic activity assay was conducted according to Jiang et al. [39]. Recently obtained human blood samples (O+) were combined with a heparin anticoagulant solution (0.2 mL). To obtain a pure red cell suspension, the blood samples underwent six washes with sterile 0.15 M NaCl (centrifuged at 3500 RPM for 5 min at 25 °C), resulting in the preparation of a 3% blood solution. Three aliquots of 100 μL each were combined with 100 μL of complex I solubilized in 0.15 M NaCl and 4% DMSO, at concentrations varying from 128 to 2 μg/mL. The tubes were incubated at 37 °C for 1 h while being exposed to blue light irradiation. A positive control for hemolysis (1% SDS) and negative controls of 0.15 M NaCl and 4% DMSO were employed. Subsequent to the incubation period, the tubes were subjected to centrifugation at 3000 RPM for 5 min at ambient temperature. From the liquid supernatant, 150 μL was aliquoted into a 96-well flat-bottom microplate, and the absorbance was assessed by measuring the optical density at 450 nm (OD450) using a microplate reader (SpectraMax® I3, Molecular Devices, Sunnyvale, CA, USA). The percentage of hemolysis was calculated by the following equation:
P e r c e n t a g e   h e m o l y s i s = O D 450   o f   c o m p o u n d   t r e a t e d   s a m p l e O D 450   o f   0.15   M   N a C l O D 450   o f   1 %   S D S O D 450   o f   0.15   M   N a C l × 100

2.16. Cytotoxicity Activity

2.16.1. Cell Line and Culture Conditions

Murine dermal fibroblasts (L929—CCL1™) were acquired from ATCC®. L929 was cultured in T-75 flasks with DMEM, enriched with 10% FBS, 1% L-glutamine, 100 U/mL penicillin, and 100 µg/mL streptomycin (Gibco), at 37 °C in a humidified environment with 5% CO2. The medium was systematically altered every third day or upon cells attaining 90% confluence, and cells were subcultured using trypsinization (0.05% trypsin/0.1% EDTA). In all assays, cells were utilized between the fourth and tenth passage.

2.16.2. Cell Viability Assay

The viability of L929 cells was assessed using a colorimetric approach involving the chemical tetrazolium (3-(4,5-dimethylthiazol-2-yl)-2,5-(diphenyltetrazolium bromide), MTT), specifically the CellTiter 96® AQueous One Solution Cell Proliferation Assay (Promega, Madison, WI, USA). To assess cell viability and proliferation, 5 × 10⁴ cells resuspended in DMEM with 10% FBS were plated per well in 96-well flat-bottom plates and incubated overnight. Complex I was solubilized in culture fluid (DMEM/10% FBS) containing 1% DMSO and diluted to concentrations ranging from 128 to 2 µg/mL, followed by irradiation with blue light for 1 h or incubation in darkness for 1 h. Control cells were cultured in DMEM supplemented with 10% FBS and 1% DMSO only. Three different experiments were conducted, each consisting of three replicates. The MTT assay was conducted according to the manufacturer’s guidelines, and the optical density was measured at 570 nm using a microplate absorbance reader (SpectraMax® I3, Molecular Devices, Sunnyvale, CA, USA) after 24 and 48 h of treatment. The viability was determined using the following equation:
C e l l   v i a b i l i t y   % = A b s ¯ 570   n m   ( C o m p l e x ) A b s ¯ 570 n m   ( c o n t r o l ) × 100 %

2.17. Statistical Analysis

The tests were conducted in triplicate across three separate experimental setups. The disparities between the mean ± SD of the triplicates were assessed utilizing one-way ANOVA accompanied by a Bonferroni post-test. The statistical analyses were conducted utilizing GraphPad Prism version 8.0 for Windows (San Diego, CA, USA). In all studies, p values of ≤0.05 were deemed statistically significant.

3. Results

3.1. Synthesis of the Nitro Complex

Nitro complex I was synthesized according to procedures previously described by Silva et al. [29]. It is important to mention that although the synthesis of the complex has already been described, the X-ray structure has not been previously reported. During the synthesis, crystals of the compound were obtained, and we finally successfully described the crystal structure of the compound. Molecular geometries for complex I are shown in Figure 3.

3.2. Photochemistry

The complex exhibited stability in the solid state and in water for a minimum of 1 h, provided it was shielded from light. Upon blue light irradiation, this compound can release NO in an aquatic environment. The confirmation of NO as a photoproduct of compound I was initially achieved by differential pulse voltammetry (DPV). Figure 4 illustrates the differential pulse voltammogram acquired before and immediately following blue light irradiation of complex I. The anodic process noted at 0.80 V was attributed to the oxidation of the liberated NO, as detailed in prior studies [40,41]. This electrochemical reaction was not detected when complex I was maintained in darkness, even after one hour. This behavior was observed in other comparable nitro compounds documented in the literature [26,27].

3.3. Carboxy-PTIO Reaction to Identify NO

Carboxy-PTIO was utilized to investigate nitric oxide generation following the irradiation of compound I, as evidenced by distinct alterations in their UV-vis spectra. This organic spin-trap served as a probe for nitric oxide detection, demonstrating the presence of NO under light irradiation. Spectroscopic monitoring under blue light irradiation (λmax = 463 nm) has demonstrated the creation of an aqua-complex, implying the release of NO0. UV-vis spectroscopic alterations (Figure 5) were noted, characterized by a characteristic reduction in the bands at 360 and 560 nm, accompanied by the emergence of a faint shoulder at approximately 440 nm. Carboxy-PTIO is extensively utilized by the scientific community not only for the detection of nitric oxide (NO) but also for its capacity to differentiate NO from HNO. The interaction of Carboxy-PTIO with NO produces Carboxy-PTI species, which do not exhibit a band at 560 nm but display another near 440 nm. Conversely, the reaction of HNO with Carboxy-PTIO typically yields c-PTIO-H, which lacks any absorption bands between 420 and 700 nm. Thus, we can ascertain that the spectroscopic profile of Carboxy-PTIO during the photolysis of complex I was characteristic of a reaction with NO.

3.4. DNA Photocleavage

To elucidate the correlation between the chemical structure and the bactericidal mechanism of nitro complex I, we examined the interaction of these molecules with DNA. We conducted agarose gel electrophoresis of pBR322 DNA combined with complex I, subjected to blue LED irradiation (λmax = 463 nm) or incubated in darkness. The [Ru(bpy)3]2+ complex (TBP) served as a control for DNA photocleavage under identical conditions (Figure 6). The DNA control lanes, with or without the [Ru(bpy)3]2+ complex, exhibited intact supercoiled pBR322 plasmid (form I; Figure 6), unless the complex was subjected to light irradiation. Complex I, in the absence of light, exhibited no signs of DNA cleavage, even at concentrations of up to 100 µM of this nitro complex (Figure 6). Conversely, under blue light irradiation, complex I facilitated effective DNA cleavage, resulting in the creation of nicked DNA (form II).

3.5. Antibacterial Activity

The antimicrobial activity results of complex I are summarized in Table 3. In general, the complex demonstrated both bacteriostatic and bactericidal effects against Gram-positive bacteria. In contrast, only bacteriostatic activity was observed against Gram-negative bacteria. When exposed to blue light irradiation, the MIC values ranged from 4 to 8 µg/mL, and the MBC values ranged from 4 to 16 µg/mL for Gram-positive bacteria. For Gram-negative bacteria, the MIC values observed were 256 µg/mL. In the absence of blue light, the MIC values for Staphylococcus strains ranged from 8 to 16 µg/mL, with corresponding MBC values between 8 and 32 µg/mL. For Gram-negative bacteria, the MIC values without blue light also remained at 256 µg/mL.

3.6. Synergistic Effect of Complex I Combined with Antibiotics

The synergistic effect of complex I was assessed in combination with ampicillin and tetracycline, as detailed in Table 4. The combination of complex I and ampicillin exhibited a synergistic effect against all Staphylococcus strains, with FICI values ranging from 0.186 to 0.375. However, no synergistic effects were observed against Gram-negative bacteria for this combination. On the other hand, the combination of complex I and tetracycline showed no interaction effects against Staphylococcus strains, with FICI values ranging from 0.562 to 1.063. Interestingly, the combination of complex I and tetracycline displayed a synergistic effect against Gram-negative bacteria such as E. coli and P. aeruginosa. Notably, the synergistic effect between complex I and tetracycline led to a 1/16 reduction in the MIC values for the complex and a 1/8 reduction in the MIC values for the antibiotic. These results highlight the potential of these combinations to enhance antibacterial efficacy.

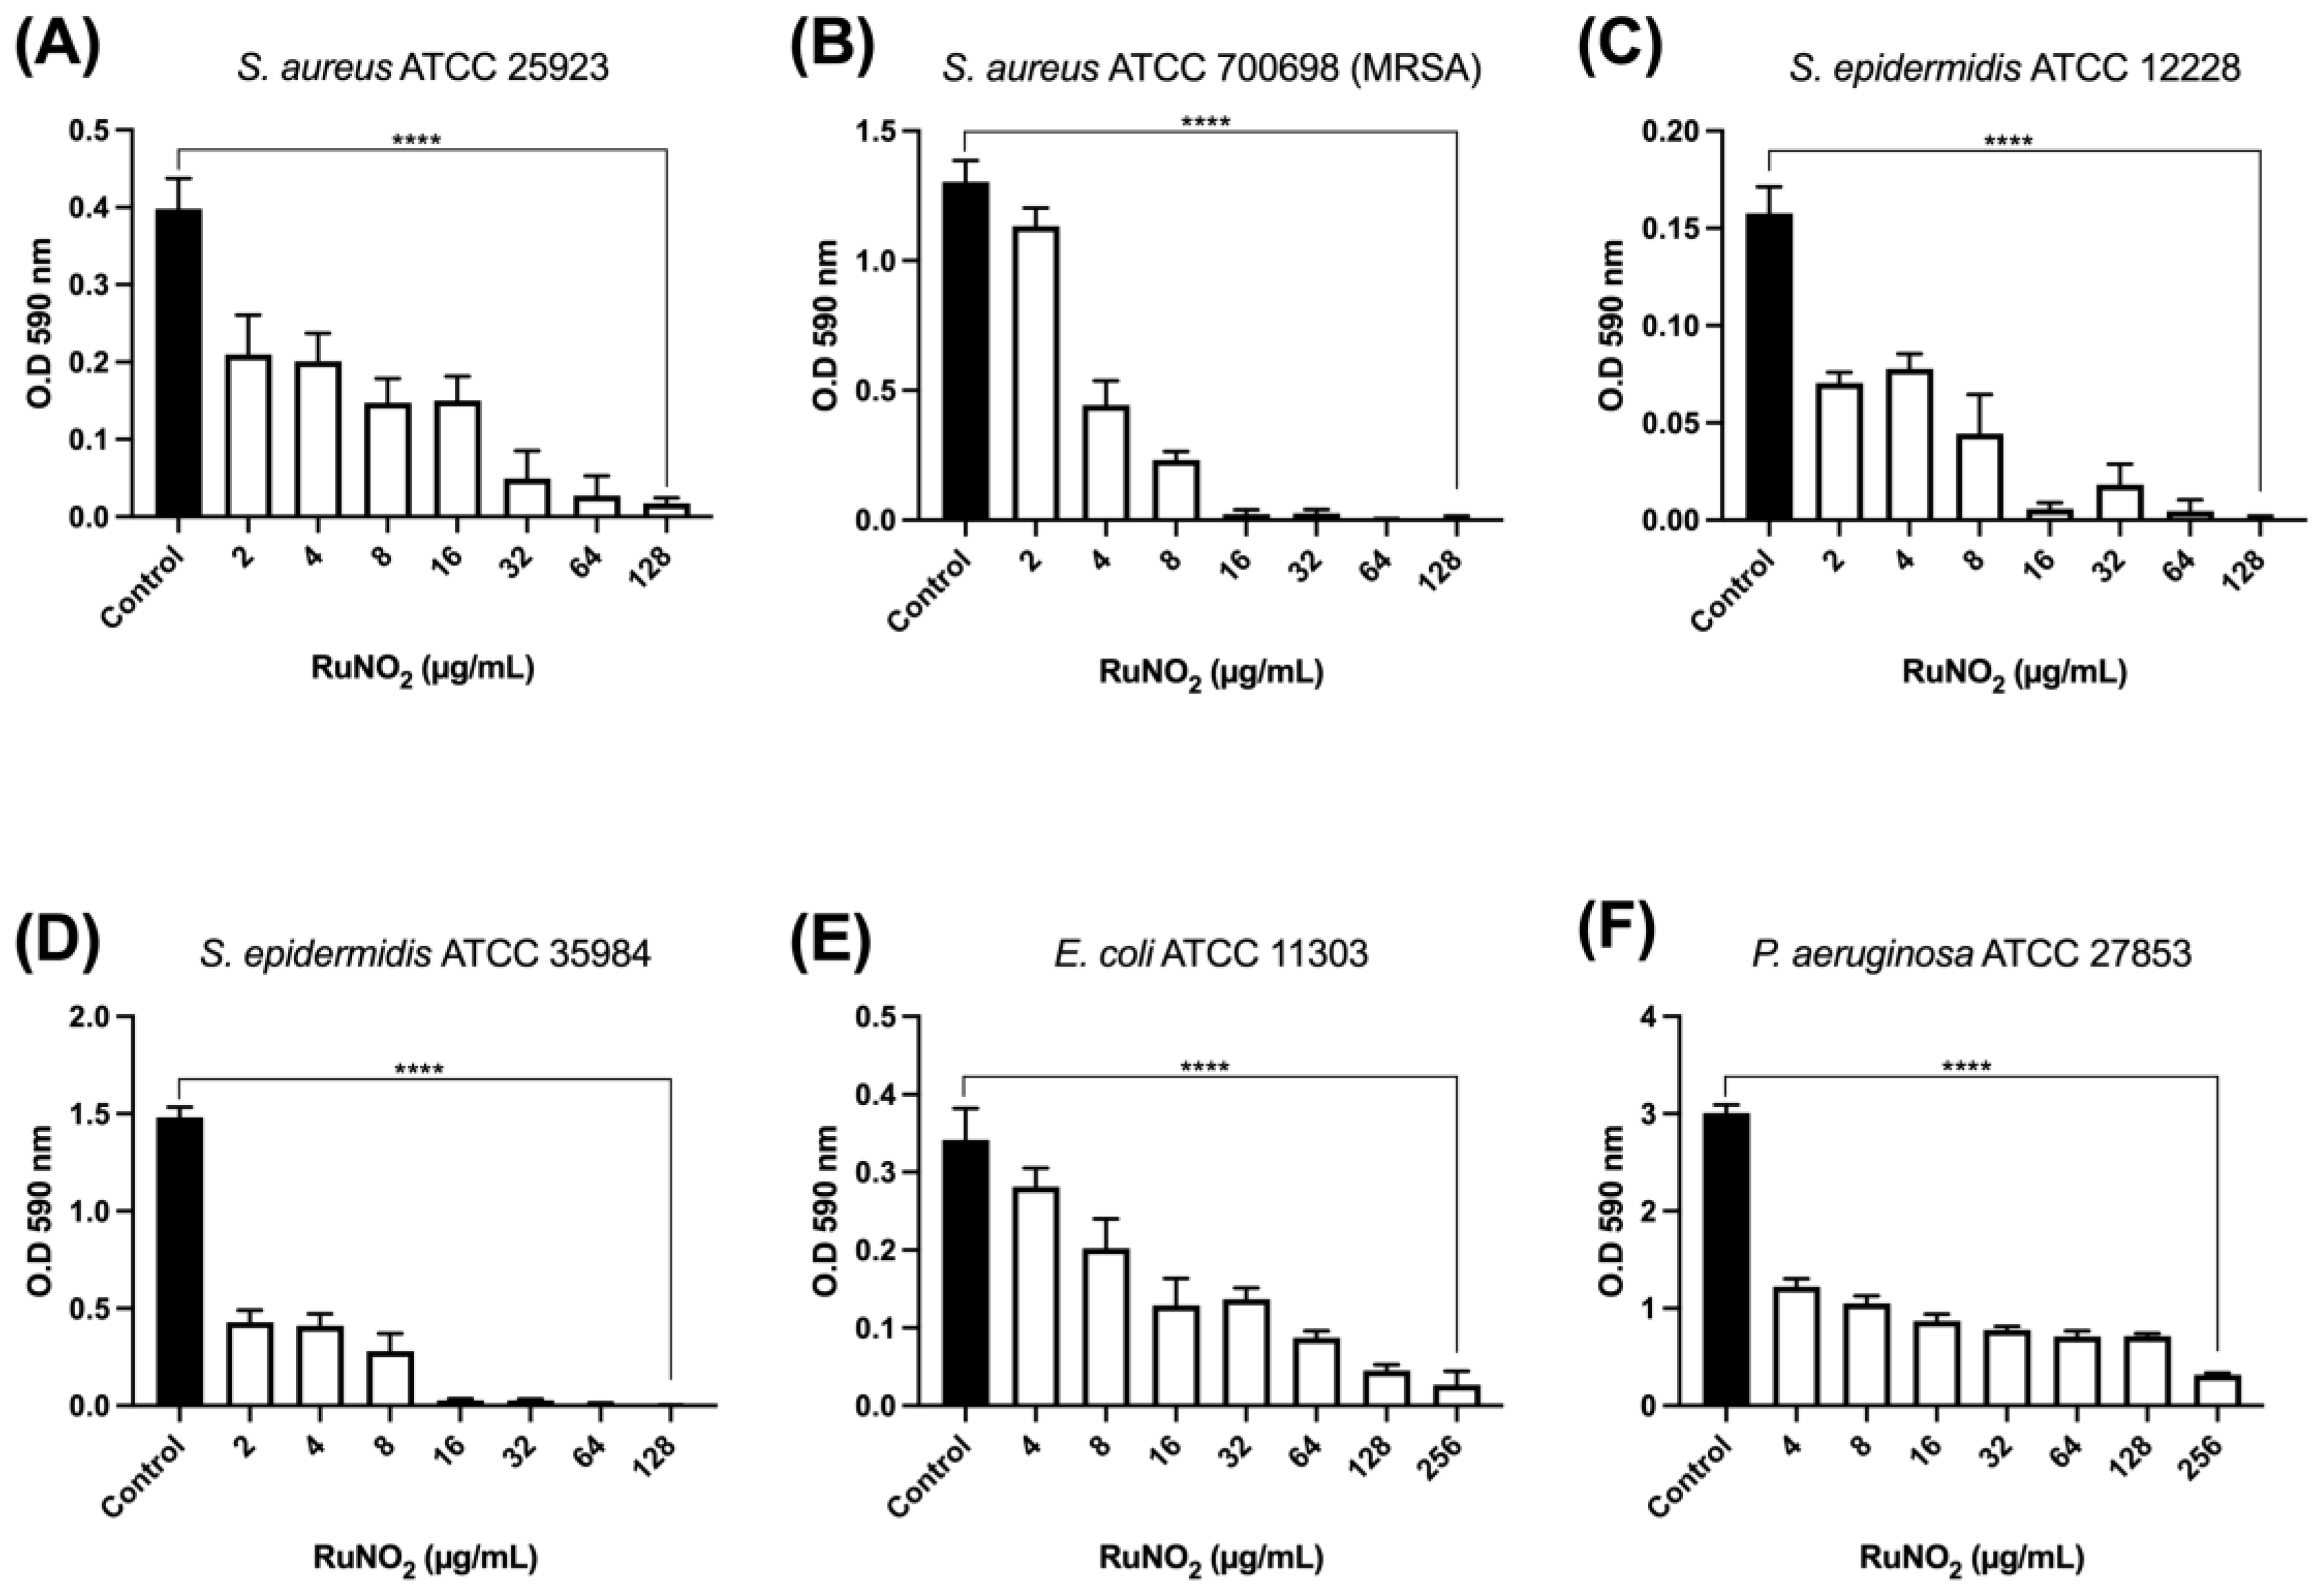
3.7. Effect of Complex I on Biofilm Formation

Figure 7 and Figure 8 show the results of the antibiofilm activity of complex I irradiated by blue light against S. aureus, S. epidermidis, E. coli, and P. aeruginosa biofilm. The antibiofilm effect was evaluated by the crystal violet (CV) assay and counting the number of viable cells in the biofilm. As shown in Figure 7, complex I reduced the biomass of biofilms of all bacterial species with percentages ranging from 13% to 99.9% (Figure 7A–F). The strains S. aureus ATCC 700698 and S. epidermidis ATCC 35984, despite being resistant to ampicillin and other β-lactams, were sensitive to this complex, presenting a reduction of more than 65% of their biomass at a concentration of 4 μg/mL and 99.8% at its highest concentration (128 μg/mL) (Figure 7B,D). For the bacteria E. coli and P. aeruginosa, we observed biomass reduction percentages of around 90% at 256 μg/mL and more than 40% at subinhibitory concentrations, as can be seen in Figure 7E,F.
Regarding the viable cell count assay of the biofilms, all strains tested were susceptible, with a reduction in the number of CFU that varied from one to four orders of magnitude on the logarithmic scale (Figure 8A–F). Among the strains used in this assay, once again S. aureus ATCC 700698 and S. epidermidis ATCC 35984, already reported in the literature as resistant to methicillin and designated MRSA and MRSE, proved to be sensitive to treatment with complex I, as a reduction was observed of more than four orders in the logarithmic scale in the number of viable cells at a concentration of 32 μg/mL (Figure 8B–D), which represents a 10,000-fold decrease in the quantity of these cells within the biofilm. E. coli and P. aeruginosa exhibited about a one-order-of-magnitude reduction compared to the control when subjected to complex I at a concentration of 256 μg/mL (Figure 8E,F).

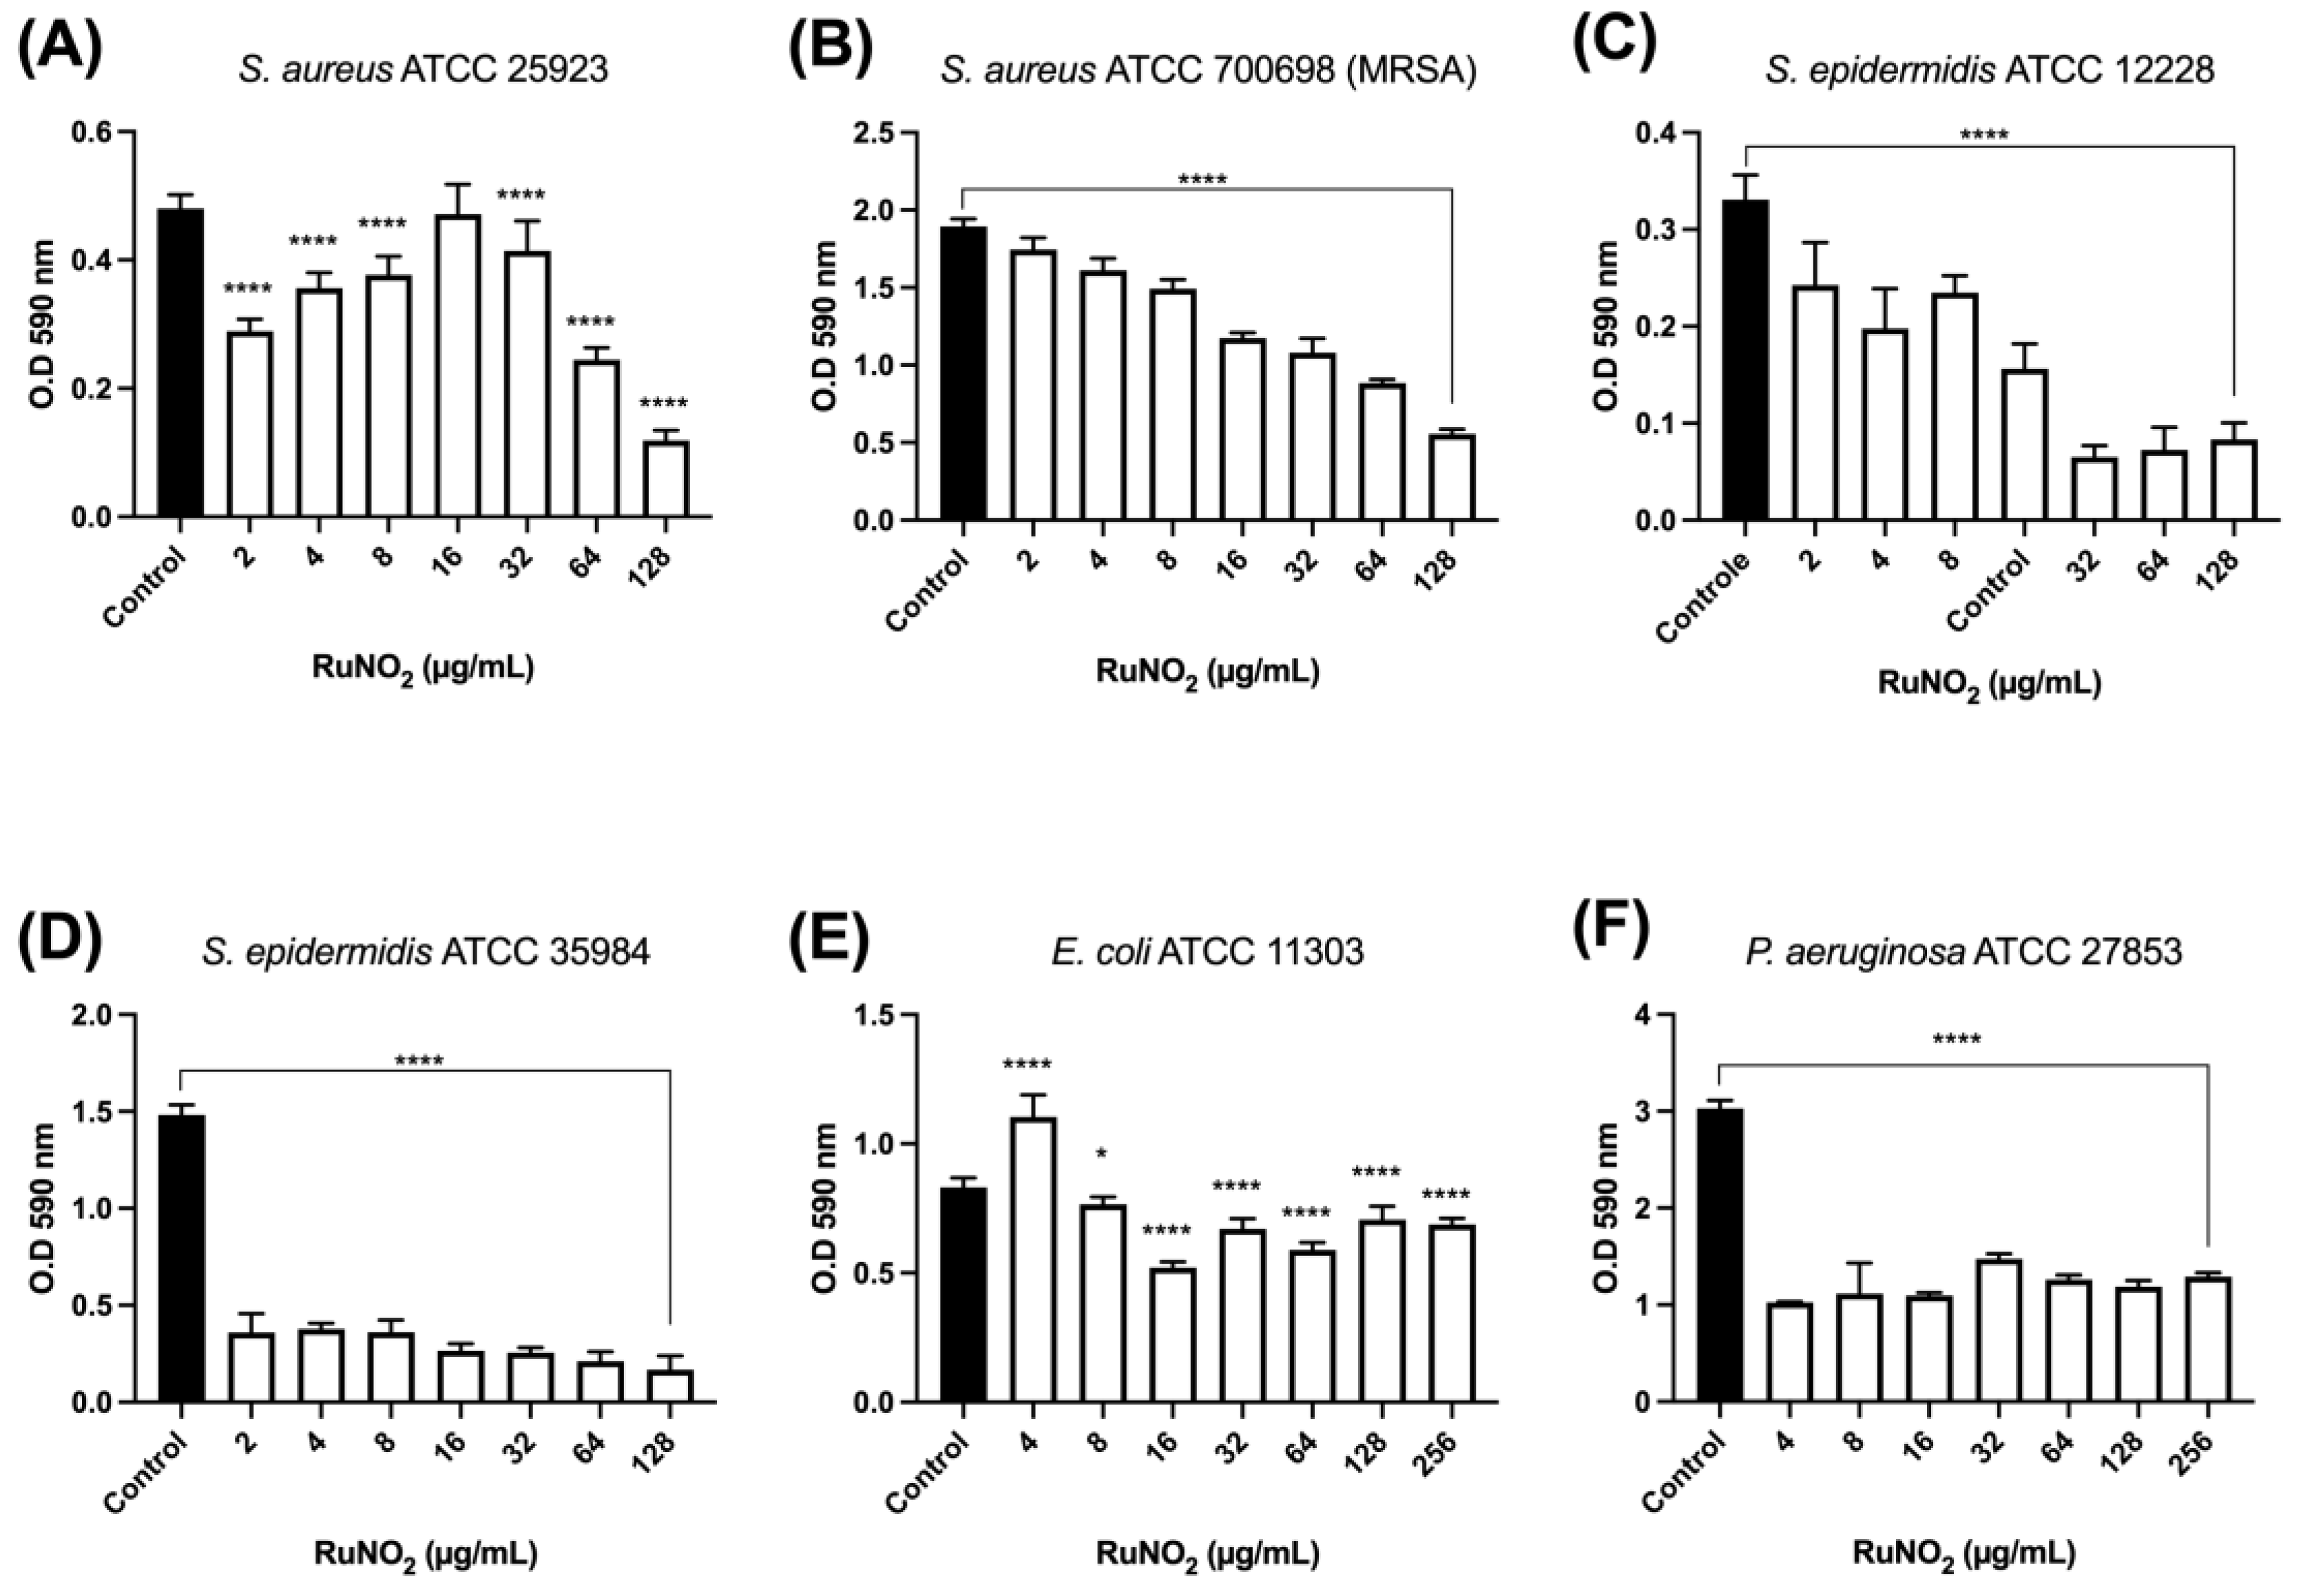
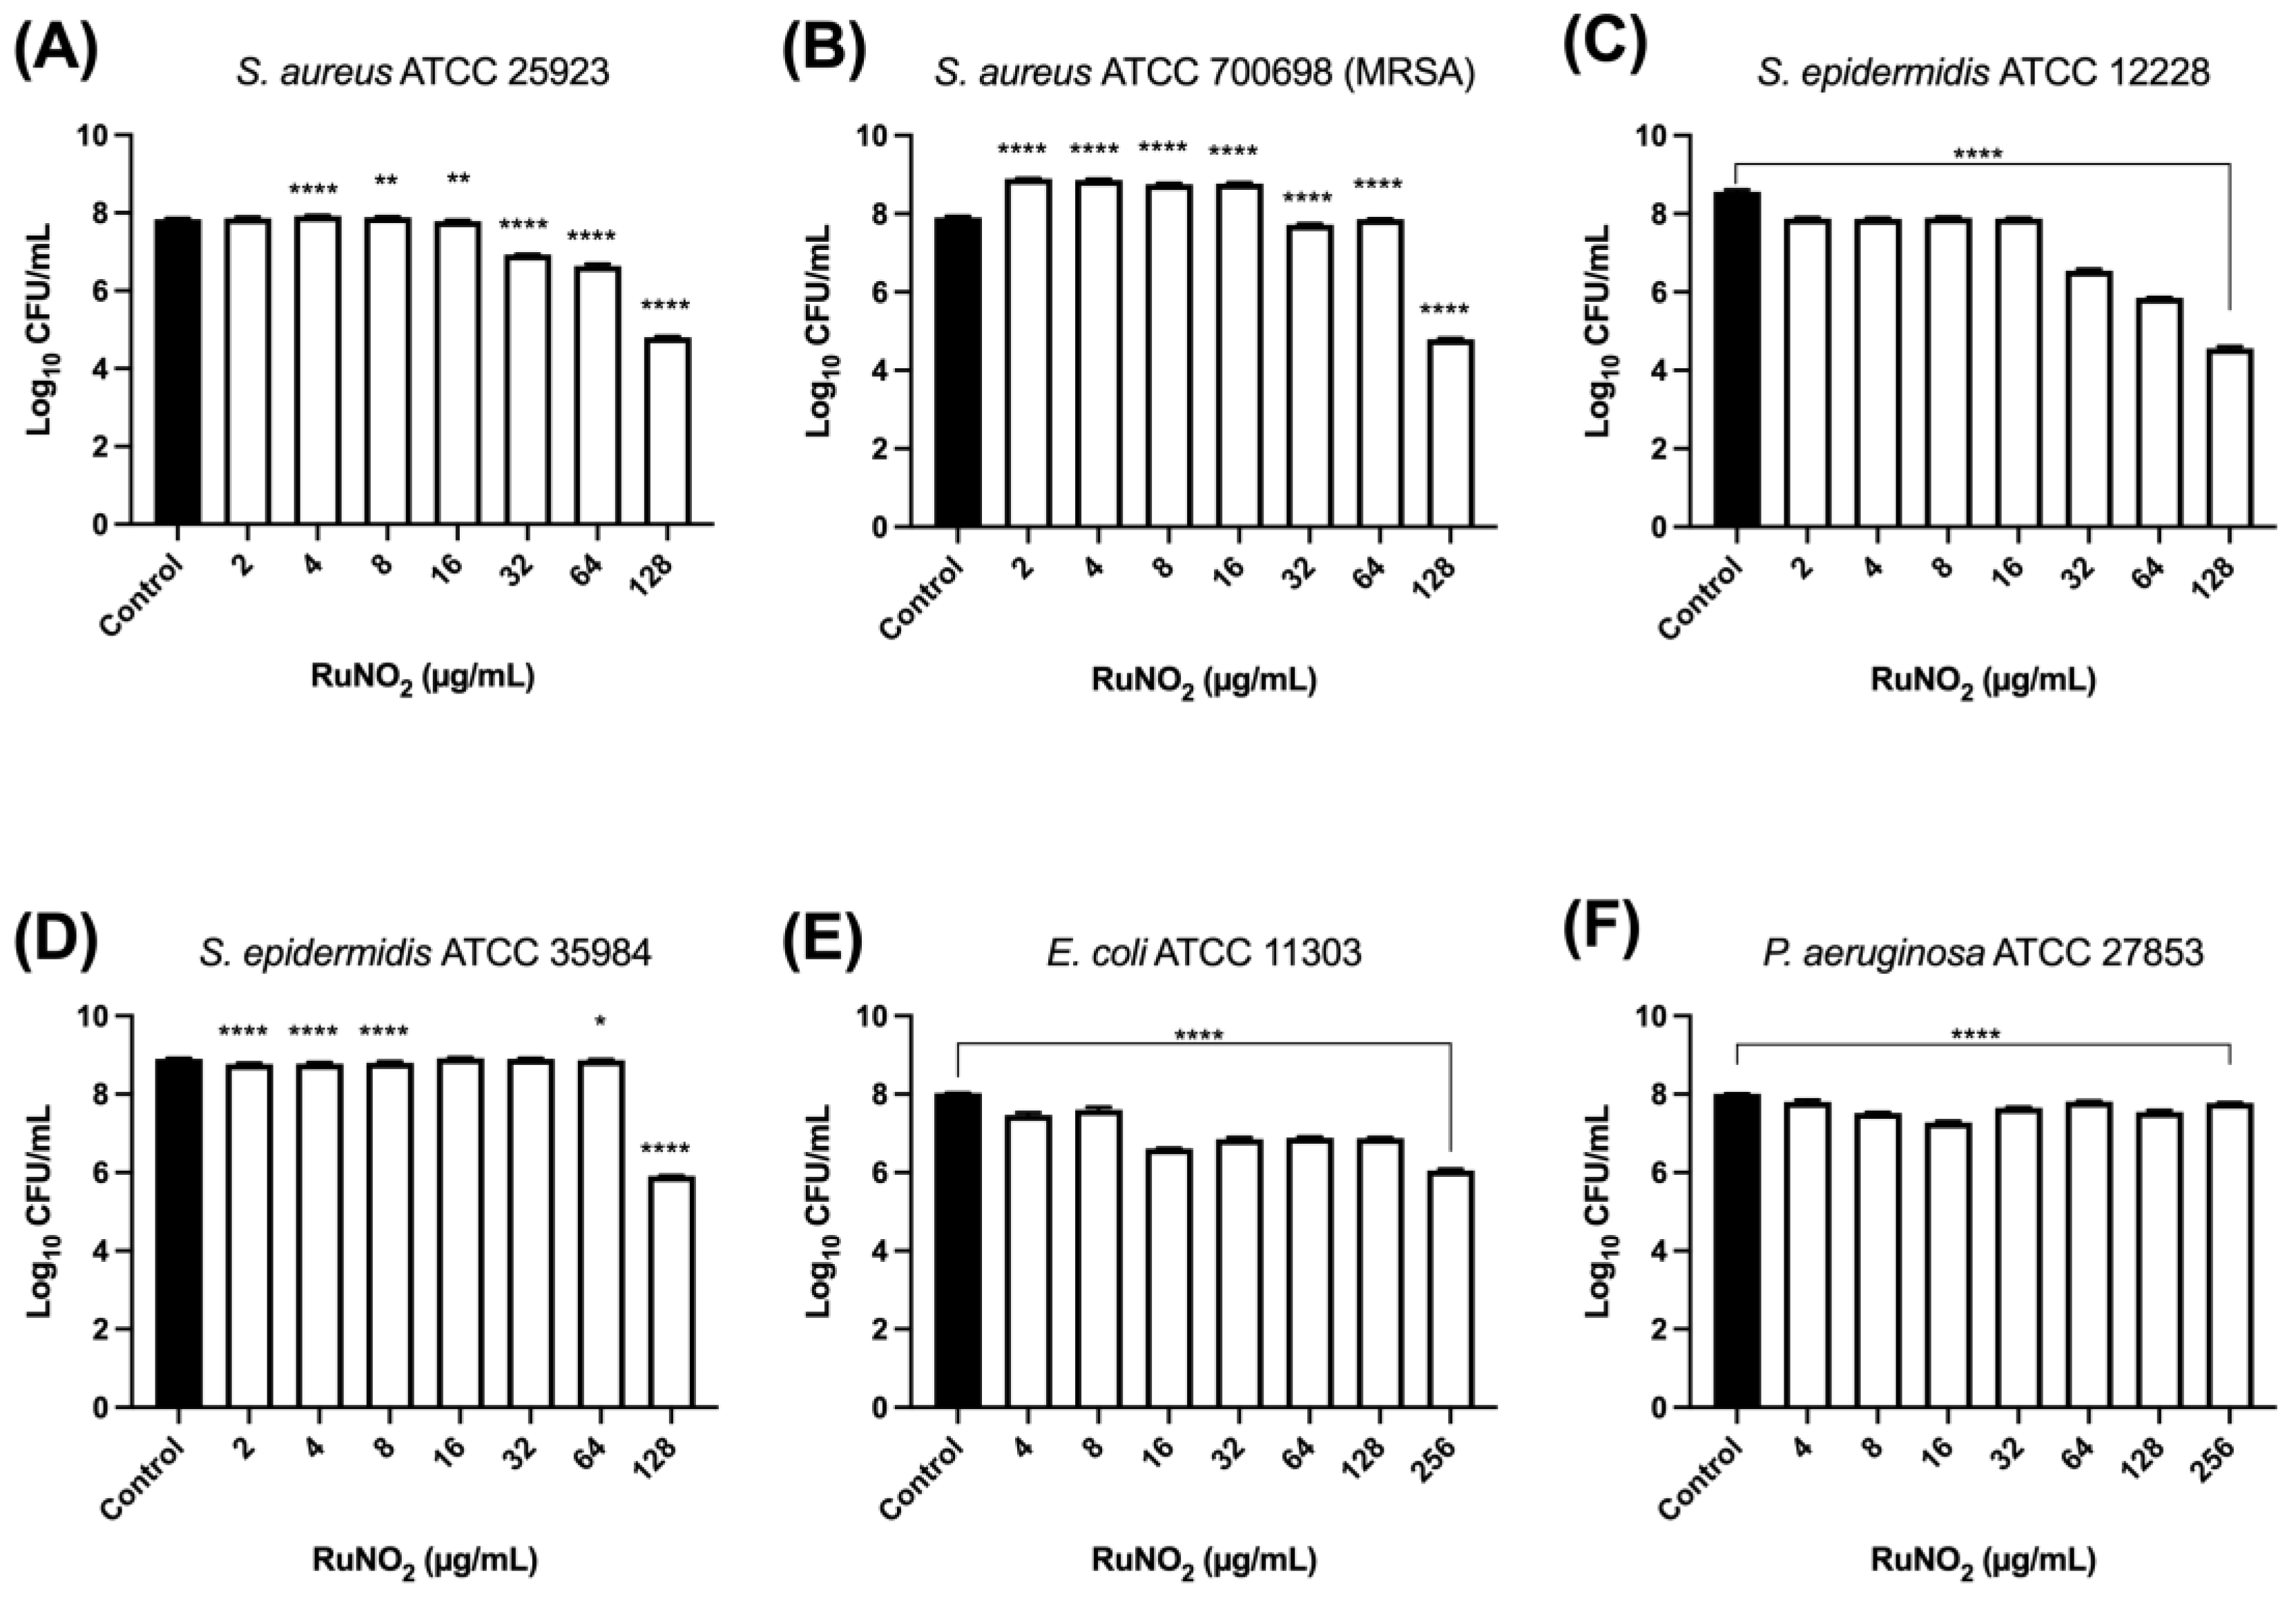
3.8. Effect of Complex I on Mature Biofilm

Complex I was able to induce a reduction in the total biomass of the strains evaluated in this study (Figure 9A–F). The biofilms of S. epidermidis ATCC 35984 and P. aeruginosa ATCC 27853 were more sensitive to treatment with complex I, with a reduction in biomass of approximately 65% at the lowest concentrations (2 μg/mL for S. epidermidis and 4 μg/mL for P. aeruginosa) on both bacteria (Figure 9D,F).
Relative to the number of viable cells in mature biofilms (Figure 10A–F), complex I reduced the number of CFU by at least two orders of magnitude on the logarithmic scale at the highest concentrations (128 μg/mL for Gram-positive and 256 μg/mL for Gram-negatives) except P. aeruginosa biofilm. The biofilms of the S. aureus ATCC 700698 and S. epidermidis ATCC 12228 strains showed the highest levels of CFU reduction, as they exhibited a decrease of three and four orders of magnitude, respectively (Figure 10B,C), in comparison to the control. It was observed that S. aureus ATCC 700698 showed a significant difference in the smallest concentration (between 16 and 2 μg/mL); however, there was an increase in the number of CFU, which implies an increase in cell density. In general, E. coli and P. aeruginosa biofilms exhibited a significant difference (p < 0.0001) after treatment with different concentrations of complex I in comparison to the control (untreated biofilms).

3.9. Scanning Electron Microscopy (SEM)

As shown in Figure 11A,B, the untreated S. aureus biofilms showed morphology in the shape of a coconut, and the integrity of the cell wall and membrane is visible. The electron micrographs of the untreated biofilm also showed high cell density embedded in the polymeric matrix of the biofilm, which was growing in the form of tulips or cell clusters. On the other hand, it is possible to observe the morphological changes in S. aureus cells treated with complex I irradiated with blue light at a concentration of 32 μg/mL (Figure 11C,D), an indication that this complex can act on the wall axis/cell membrane and the surface of the cells is also rougher. Notably, post-treatment S. aureus cells show some type of elongation in cellular morphology. Damage to the plasma membrane is also observed, as disruptions in cellular integrity are also observed, as shown in Figure 11D. Low cell density and scattered cells were also observed on the surface where the biofilm was formed (Figure 11C).
Regarding E. coli, in the untreated biofilms (Figure 11E,F), a high cell density can be seen constituting the biofilm and cells with preserved integrity, as the presence of bacilli is noticeable, the characteristic cellular morphology of the species. In the group treated with complex I at a concentration of 256 μg/mL and irradiated with blue light (Figure 11G,H), low cell density and practically no biofilm formation were observed. Furthermore, the cells have completely altered their morphology, and compromise of the cell wall and plasma membrane is also noted.

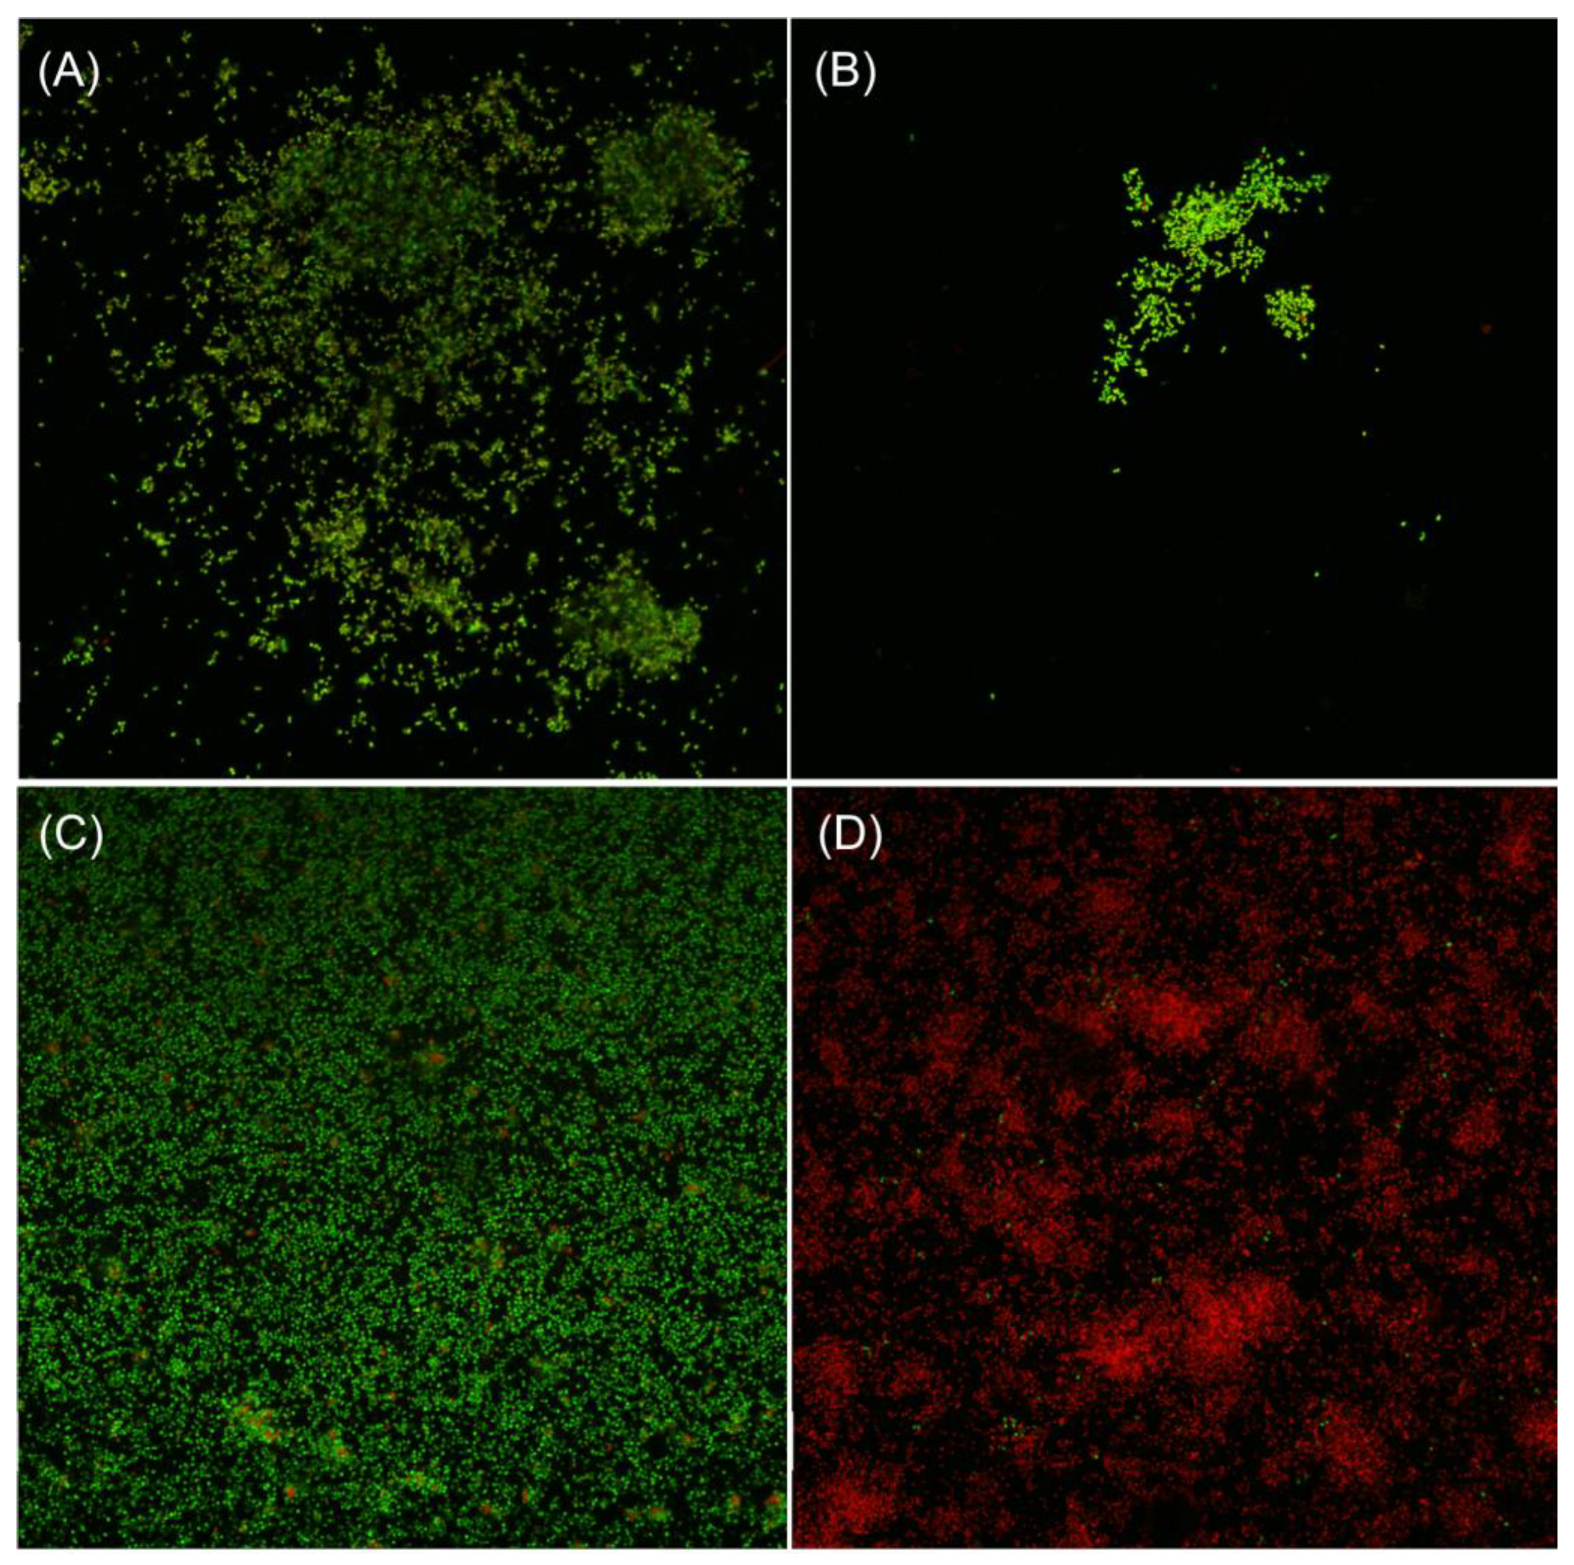
3.10. Confocal Laser Scanning Microscopy Analyses

To investigate the effects of complex I on the viability of biofilm-forming cells and mature biofilms of S. aureus, investigations were conducted using confocal laser scanning microscopy. In the analyses, viable cells (stained with SYTO9) exhibited green fluorescence, while non-viable cells (stained with propidium iodide) displayed red fluorescence. Figure 12 shows the effects of complex I on the viability of biofilm-forming S. aureus at a concentration of 32 μg/mL. Complex I reduces the number of viable cells of S. aureus in biofilms (Figure 12A), while high cell density is observed in the untreated biofilm (Figure 12B). Regarding mature biofilm, a high density of red-stained dead cells was observed after treatment with complex I at a concentration of 64 μg/mL (Figure 12D), indicating the internalization of propidium iodide and its binding to cytoplasmic DNA, caused by damage to the integrity of the cell membrane. In untreated biofilms (Figure 12C), a high density of viable cells with marked green fluorescence is visible, as well as the maintenance of a very robust biofilm.

3.11. Hemolytic Activity

Regarding hemolytic activity, complex I exhibited a low percentage of hemolysis (between 2% and 4%) at higher concentrations of 64 and 128 μg/mL, as shown in Figure 13. No hemolysis was detected at concentrations ranging from 2 to 32 μg/mL. Additionally, no hemolysis was observed in the negative controls, which included 0.15 M NaCl and 4% DMSO. In contrast, 1% SDS caused 100% hemolysis. These findings indicate that complex I has low hemolytic potential, especially at lower concentrations, demonstrating its potential safety for therapeutic applications.

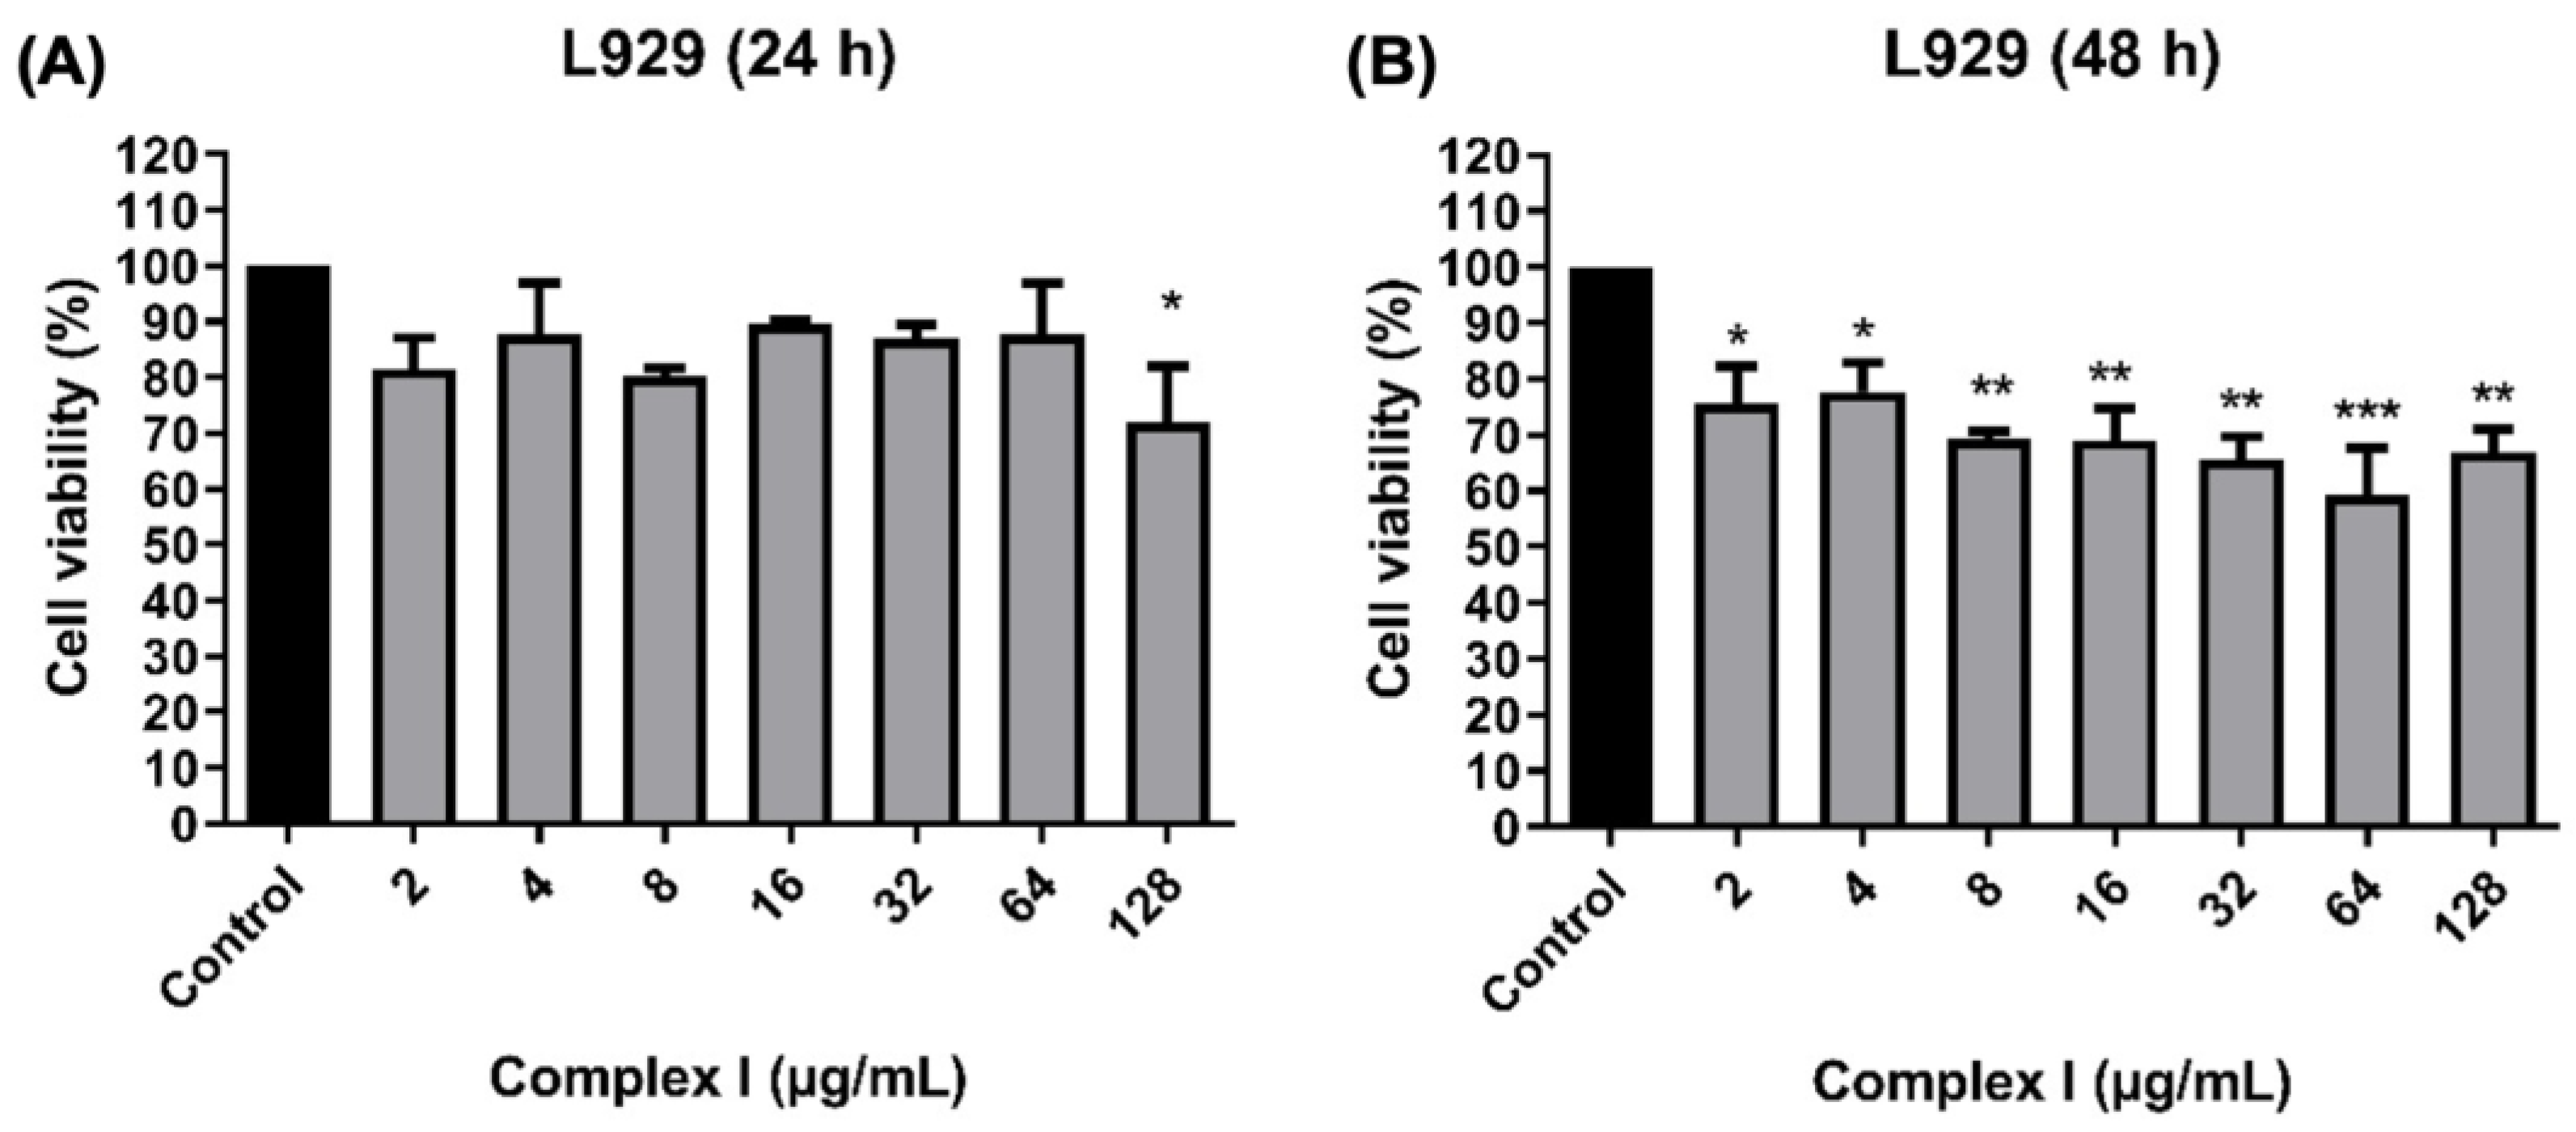
3.12. Cytotoxic Activity

The cytotoxic effect of complex I on murine dermal fibroblasts was assessed and the findings are encapsulated in Figure 14. On L929 cells, excluding the highest concentration (125 µg/mL), the results indicate that there was no statistical difference between the control and the groups treated with different concentrations of complex I in the first 24 h (Figure 14A). After 48 h (Figure 14B), no cytotoxic effect was observed since the reductions in cell viability were between 20 and 35%.

4. Discussion

For many decades, antimicrobials have been effective in treating or preventing a wide range of infectious diseases. However, their effectiveness is being put at risk due to the progressive emergence of microorganisms more resistant to traditional antibiotics [42]. Pathogens such as P. aeruginosa, E. coli, S. aureus, and S. epidermidis are at the top of global concerns for research and development of new antimicrobial agents, which represents an important step in the fight against AMR [2,43,44].
Recently, considerable research into the design and development of new antimicrobials has been carried out, and although a large number of new molecules or compounds, both of natural and synthetic origin, have been investigated to combat multiresistant microorganisms, few demonstrate an effective antimicrobial effect or can progress to clinical trials [45,46,47,48].
The emergence of resistance to antimicrobials poses a serious threat to public health worldwide. In this context, metal complexes have been recognized as promising sources for new classes of antimicrobial agents. A key target for antimicrobial drugs such as metal complexes is their ability to interact with the DNA molecule, which constitutes a relevant signal about their biological potential [49]. In this sense, considering the DNA-binding properties of Ru compounds and their ability to induce the production of singlet oxygen and/or other ROS, it is paramount to elaborate and synthesize a biologically active compound.
In this context, we prepared complex I, and the crystal structure of this nitro complex was successfully elucidated using X-ray crystallography. The X-ray crystallographic studies confirmed the presence of one NO2 and one chloride group coordinated as monodentate ligands. The structures formed a slightly distorted octahedral geometry, highlighted by the bond angles around the metal centers, such as the N2-Ru-N3 bond angle (Table 2), which are far from the expected value of 90° due to the tension of the five-membered chelate ring of the 4,4-Mebipy ligand. The N1b-Ru1-Cl1b and N1a-Ru1-Cl1a bond angles are close to 90°, as expected to the cis geometry presented by complex II. The dimensions of the nitrite ion in NaNO2 at 293 K were N–O = 1.240 Å and O–N–O = 114.9° [50]. In nitro complex I, the O–N–O angle was 120.6°, within the range generally observed for M-NO2 complexes (113–127°) and N–O bond length values of ≈1.22 Å, close to characteristic double-bond distances similar to the ct-[Ru(NO2)2(dppb)(5,5′-Mebipy)] complex previously described in the literature [51]. The Ru-N(6)(NO2) interatomic distance (≈2.10 Å) in the ct-[RuCl(NO2)(dppb)(4,4′-Mebipy)] complex was slightly longer but comparable to the values observed for other ruthenium nitro compounds, for example, 2.073(2) Å in [(p-cym) Ru(bpy)NO2]PF6 [52], 2.082 Å in ct-[Ru(NO2)2(dppb)(5,5′-Mebipy)] [51], and 2.075 in cis-[Ru(bpy)2(4-bzpy)(NO2)](PF6) [53]. Additionally, it was observed that Ru-N (4,4′-Mebipy) and Ru-P (dppb) bond lengths are within ranges found for other similar complexes, mainly those from the same Ru(II) precursors [29,51,54]. The crystal structure refinement showed disordered groups in the expected positions of NO2 and Cl ligands, identified as a positional disorder for these ligands. Two positions with different occupancies were determined, as presented in Figure 3. The first structure, containing the N1a trans to N3 and Cl1a trans to P1, was found with 80% occupancy, while the other, containing the N1b trans to P1 and Cl1b trans to N3, displayed 20% occupancy. This result shows the presence of two geometric isomers resulting from crystals obtained from a methanolic solution, which supports the occurrence of isomerization in solution.
Complex I, in the absence of light, exhibited no signs of DNA cleavage, even at concentrations of up to 100 µM of this metal complex (Figure 6). Conversely, under blue light irradiation, the complex facilitated effective DNA cleavage, resulting in the creation of nicked DNA (form II). Recent investigations indicate that the nitrosyl complex [RuCl(NO)(dppb)(4,4-Mebipy)]2+ facilitates effective DNA cleavage in the absence of light, while this degradation is further amplified in the presence of light [17]. This phenomenon may be elucidated by the fact that no bound nitrogen monoxide in this chemical may be released spontaneously within hours, but the process is expedited by light. The diaqua complex [Ru(H2O)2(dppb)(4,4-Mebipy)]2+, generated following NO release, can rapidly degrade DNA and may be partially accountable for this outcome. Moreover, nitric oxide (NO) can, either directly or indirectly, through reactions with O2 or superoxide (O2), inflict DNA damage, impede various enzymatic functions, and provoke lipid peroxidation, leading to membrane impairment, which is the primary mechanism of NO’s antibacterial effects [55].
These findings provide a compelling contrast in terms of the potential mechanism underlying the antibacterial activity of the nitrosyl complex [RuCl(NO)(dppb)(4,4-Mebipy)]2+ [17] and the nitro complex I described here, and we conclude that these species kill bacteria in the dark through different mechanisms. However, the DNA degradation observed after irradiation of the nitro complex may also be related to light-induced NO release since this compound is capable of releasing NO after irradiation with blue LEDs. Considering that NO photorelease may be responsible for DNA cleavage and consequently improve the antimicrobial activity of complex I, leading to a decrease in the experimentally observed MBC values after blue light irradiation, we conducted some qualitative photochemical experiments to investigate this photoreaction, such as electrochemical experiments and detection of NO photorelease using the Carboxy-PTIO probe. Both experiments confirmed the release of NO after irradiation of complex I.
It is established that, during photolysis, certain nitro complexes may liberate NO due to the disproportionation of other nitrogen oxides. De Lima et al. [28] demonstrated that the nitrite ion (NO2) coordinated to a Ru(II) center can function as a photochemical generator of nitric oxide in complexes of the form cis-[RuII(NO2)L(bpy)2]+ (bpy = 2,20-bipyridine and L = pyridine, 4-picoline, and pyrazine) and [RuII(NO2)(bpy)(terpy)]+ (terpy = terpyridine). Their findings indicate that bound nitrite experiences photochemical disproportionation to generate NO in an aqueous solution, as illustrated in Equation (1).
RuII-(NO2) + H2O + hn→ RuIII−(OH) + NO + OH
However, the release of NO from the irradiation of polypyridine–phosphine mixed ligand complexes has never been explored.
Regarding antimicrobial activity, our results indicated an apparent preference of complex I to act against Gram-positive bacteria since low MIC values were observed (between 4 and 8 µg/mL), which may be related to the fact that the complex exhibits lipophilic characteristics, which would facilitate its penetration into the bacterial cell.
Some ruthenium complexes containing 2,2′-bipyridine (bipy) and its derivatives [41,56,57] as well as polypyridine–phosphine mixed ligands [17] have been tested as antimicrobial agents against different pathogens and shown to be promising antimicrobial compounds. These results have encouraged us to explore these kinds of systems, not only because of the promising results but also because it is possible to investigate the structure–activity relationship of the complexes.
Currently, a wide variety of ruthenium complex formulations are being studied as potential antimicrobial agents to combat the imminent threat of antimicrobial resistance. In the literature, studies that evaluated the joint antimicrobial effect of ruthenium complexes and antibiotics are still scarce. Aiming to potentiate the antimicrobial effect of complex I and the antibiotics ampicillin and tetracycline, in this study we evaluated the interaction between different concentrations of the mentioned compounds. As shown in Table 4, the combination of complex I and ampicillin resulted in a synergistic effect when evaluated against Staphylococcus spp., something interesting and that leads us to expand the understanding of possible mechanisms of action of the nitro complex. Interestingly, no interaction and even an antagonistic effect were observed when complex I was evaluated against Gram-negative bacteria, something that may be related to the presence of the outer membrane [56] in this group of bacteria or even to resistance mechanisms such as the flow pump.
The combination of complex I and tetracycline showed two different results: (1) no interaction against Gram-positive bacteria; (2) synergistic effect against Gram-negative bacteria. These results may reinforce the idea that complex I is absorbed and accumulated in the bacterial cytoplasm and interacts reversibly with intracellular targets, such as DNA, RNA, proteins, membranes, or other metabolites, causing damage and consequently cell death, as demonstrated by Sousa et al. [15]. In this study, we suggested that the combination with tetracycline would allow better absorption of the nitro complex, facilitating the release of intracellular NO and interaction with the biomolecules and structures already mentioned.
Biofilms are responsible for up to 80% of all chronic and recurrent bacterial infections in humans [57], and the presence of biofilms has been confirmed on more than 90% of dry surfaces in intensive therapy units [58]. Currently, the presence of antibiotic-resistant bacteria and the infections they cause constitute a huge threat to public health [59], a problem that is aggravated by the presence of bacteria in biofilms, a microbial survival mechanism that becomes up to 1000 times more resistant to dehydration, phagocytosis, metal toxicity, and exposure to acids and antibiotics than the planktonic form [60].
Concerning the antibiofilm activity of complex I (Figure 7, Figure 8, Figure 9 and Figure 10), it was observed that there was a significant reduction in the total biomass of forming and mature biofilms. At its highest concentration (128 μg/mL for Gram-positive and 256 μg/mL for Gram-negative), the complex reduced the biomass of biofilms of the bacteria evaluated by at least 90%. The strains S. aureus ATCC 700698 and S. epidermidis ATCC 35984, despite being resistant to ampicillin and other β-lactams, were sensitive to this complex, presenting a reduction of more than 65% of their biomass at a concentration of 4 μg/mL (MIC) and 99.8% at its highest concentration (128 μg/mL) (Figure 7B,D). Even at subinhibitory concentrations, a further 40% reduction in the total biomass of E. coli and P. aeruginosa biofilms was observed (Figure 7E,F). The bacteriostatic and bactericidal activity of this complex was observed in a study published by Andrade et al. [16], and the reduction in biomass may be related to the decrease in planktonic cells, a result of damage caused to the cell wall and/or plasma membrane after treatment by complex I, since according to Sharma et al. [61], damage to bacterial structures such as walls and membranes interferes with the ability of bacteria to attach to host cells and blocks their ability to attach to initiate the formation of biofilms.
Concerning mature biofilms, the complex also exhibited antibiofilm activity with statistically significant reductions (p < 0.0001) in total biomass and the number of viable cells in relation to the control of untreated bacteria. Even bacterial strains with a resistance profile (S. aureus ATCC 700698 and S. epidermidis ATCC 35984) and requiring up to 1000 times higher concentrations of antibiotics were sensitive to treatment with complex I, which induced a reduction in total biomass by more than 75% at a concentration of 128 μg/mL. Similarly, viable cells that, despite being protected inside the matrix against desiccation, the action of oxidizing biocides, and some antibiotics [62], suffered the action of complex I showed a decrease between two and four orders on the logarithmic scale at the highest concentrations (62 and 128 μg/mL).
Jiang et al. [39] showed that a ruthenium polypyridine complex proved to be effective in reducing biofilm formation with significant levels of reduction that varied between 27% and 41% at concentrations of 1 μg/mL and 2 μg/mL, respectively, a result that, according to the authors, indicated an antibiofilm effect at subinhibitory concentrations. Moreover, the authors also carried out an attack assay on mature bacterial biofilm, and the results indicated that the compound can inhibit not only the formation of biofilms but also already-formed bacterial biofilms.
Recent studies, such as those involving ruthenium(II) polypyridyl complexes, have shown enhanced phototoxicity and specificity for bacterial cells, making PDT an increasingly viable option for managing localized infections that are resistant to traditional antibiotics. Furthermore, the rapid action of PDT can be particularly beneficial in acute infections where timely bacterial control is critical, potentially preventing complications from biofilm formation and chronic infection [21,43]. PDT has emerged as a promising alternative to conventional antibiotics, particularly for multidrug-resistant (MDR) infections. PDT operates by utilizing photosensitizers that, upon exposure to a specific wavelength of light, produce reactive oxygen species (ROS) capable of damaging microbial cellular components and effectively killing bacteria. This technique is not only effective against a wide range of pathogens, including the ESKAPE group of MDR bacteria, but also minimizes the risk of resistance development due to its mechanism of action that generates non-specific oxidative stress on microbial cells [21,43].
The poor permeability of traditional antibiotics is one of the main reasons for the decrease in their therapeutic capacity and the increase in resistant bacteria [63,64,65]. Therefore, the ability to damage the plasma membrane of microorganisms should be an important feature of newly developed antibacterial agents [66]. To evaluate whether complex I can compromise the integrity of the bacterial membrane or cell wall, analyses using scanning electron microscopy (SEM) and confocal microscopy were performed. These techniques provide detailed insights into potential structural damage caused by the complex at the cellular level.
The electron micrographs obtained by SEM (Figure 11) and the micrographs obtained by confocal microscopy (Figure 12) showed the action of complex I on the cell wall and plasma membrane of S. aureus and E. coli. As presented in Section 3, the morphological change in S. aureus cells is noticeable when treated with complex I at a concentration of 32 μg/mL (Figure 11D), an indication that the complex caused damage to the cell wall. Furthermore, as one of the functions of the cell wall is to maintain the morphology of bacterial cells, any interference or even the absence of this structure causes changes in the shape of the bacteria. There was also low cell density and cells dispersed on the surface where the biofilm was formed (Figure 11C), thus confirming the reduction of the SPE matrix, a component that corresponds to more than 80% of the organic matter in the mass. Biofilm drought [67], resulting in a reduction in biomass quantification and the number of viable cells, was also evaluated in this study.
Anderson and O’Toole [68] assert that the matrix safeguards cells from external threats and serves as a barrier to the transport of tiny substances. The decrease in the matrix by ruthenium complexes may render cells more vulnerable, as it constitutes a method of biofilm resistance. Electron micrographs of E. coli biofilms (Figure 11G,H) revealed alterations in the shape of the bacterial cell wall, exhibiting cells with uneven, wrinkled, and fragmented surfaces. Sun et al. [69], examining the antibacterial properties of the ruthenium(II) RuBP complex and its mechanism against Gram-positive bacteria, determined that the complex could impede the proliferation of bacterial species such as S. aureus and M. tetragenus. Scanning electron microscopy (SEM) observations of both bacteria treated with RuBP revealed damage to the cell wall and membrane integrity, which likely resulted in growth inhibition and cell death.
Jiang et al. [39] also assessed the morphological characteristics of S. aureus bacterial samples treated with ruthenium complexes using SEM. The authors noted that the bacteria in the control group exhibited an intact and smooth cell surface, devoid of rupture. In the group administered the compound Ru-3 at a concentration of 4 μg/mL for 2 h, most bacterial structures exhibited deformation and collapse, with numerous ripples seen, indicating that Ru-3 treatment results in physical damage to the cell membrane.
Furthermore, Jiang et al. [39] noted disparities in bacterial growth between the Ru-3-treated group and the control group when subjected to the fluorophores 4′,6-diamino-2-phenylindole (DAPI) and propidium iodide (PI). DAPI is capable of penetrating both viable and non-viable cells, emitting blue fluorescence, whereas PI exclusively infiltrates cells with compromised membranes, binding to nucleic acids to yield red fluorescence [65]. Consequently, the authors noted blue fluorescence solely in the control group, implying the integrity of S. aureus cell membranes. In contrast, both blue and red fluorescence were detected in the Ru-3 groups, signifying that Ru-3 effectively disrupts the membranes of S. aureus at a concentration of 4 μg/mL.
In our study, we evaluated cytotoxicity by measuring hemolytic activity and cytotoxicity on murine fibroblasts. The toxicity of any compound intended for pharmacological applications is very important, as information about the interactions between molecules and biological entities at the cellular level is considered an indicator of general cytotoxicity for normal cells [45]. In general, the percentage of hemolytic activity of complex I was less than 5% in all concentrations tested (Figure 13); in this case, the hemolysis assay carried out in this study showed safety for possible uses of complex I in future therapies, according to the interest in their activities in biological systems. Another point is that the absence of side effects, in this case, hemolysis, favors the carrying out of more studies on metal compounds with potential intravenous administration according to their concentration, since several drugs used in therapy have been reported to promote hemolysis at a higher rate of up to 5% and were considered clinically safe [70]. Cytotoxic activity on murine fibroblasts (Figure 14) yielded acceptable results, as no concentration diminished cell viability by over 50% during the assessment period. Nonetheless, certain formulations exist that mitigate the toxicity of complexes or molecules exhibiting clinically relevant biological activity, thereby ensuring their safe and effective application.

5. Conclusions

In conclusion, the nitro complex [RuCl(NO2)(dppb)(4,4-Mebipy)] (complex I) irradiated with blue light demonstrated significant antibacterial and antibiofilm activities against both Gram-positive and Gram-negative bacteria. Notably, the antibacterial activity of the complex was enhanced upon light irradiation, supporting the hypothesis that the release of free NO plays a crucial role in its antimicrobial effects. Analyses using SEM and confocal microscopy revealed the impact of complex I on the bacterial cell wall and plasma membrane, suggesting a dual mechanism of action involving both the complex itself and the release of NO. Toxicity assays further confirmed that complex I is non-toxic to human erythrocytes and murine fibroblasts. These findings highlight the promising antimicrobial potential of complex I against clinically relevant bacterial strains, warranting further investigation into its therapeutic applications.

Author Contributions

Conceptualization, A.K.M.H., M.A.V. and E.H.T.; investigation, A.C.S.G., J.H.A.N., A.L.A., A.A.P., E.A.M. and I.M.F.A.; data curation, A.A.B., E.E.C., A.L.A., I.M.F.A. and A.K.M.H.; writing—original draft preparation, A.C.S.G., J.H.A.N., A.L.A., A.A.P., E.A.M. and I.M.F.A.; writing—review and editing, A.A.B., E.E.C., A.K.M.H., M.A.V. and E.H.T.; supervision, A.K.M.H., M.A.V. and E.H.T.; funding acquisition, A.K.M.H., M.A.V. and E.H.T. All authors have read and agreed to the published version of the manuscript.

Funding

This research was funded by CAPES (Finance Code: 001), FAPEMIG (Grant#: APQ-00224-2), and CNPq (Grant#: N 402198/2023-9).

Data Availability Statement

All data and materials are available from the corresponding authors.

Acknowledgments

The authors are grateful to Central Analitica-UFC/CT-INFRA/MCTI-SISNANO/Pró-Equipamentos CAPES.

Conflicts of Interest

The authors declare no conflicts of interest.

References

  1. Blair, J.M.A. Introducing npj Antimicrobials and Resistance. npj Antimicrob. Resist. 2023, 1, 3. [Google Scholar] [CrossRef]
  2. Murray, C.J.L.; Ikuta, K.S.; Sharara, F.; Swetschinski, L.; Robles Aguilar, G.; Gray, A.; Han, C.; Bisignano, C.; Rao, P.; Wool, E.; et al. Global burden of bacterial antimicrobial resistance in 2019: A systematic analysis. Lancet 2022, 399, 629–655. [Google Scholar] [CrossRef] [PubMed]
  3. O’Neill, J. Tackling Drug-Resistant Infections Globally: Final Report and Recommendations: The Review on Antimicrobial Resistance; Wellcome Trust: London, UK, 2016. [Google Scholar]
  4. Ture, Z.; Güner, R.; Alp, E. Antimicrobial stewardship in the intensive care unit. J. Intensive Med. 2022, 3, 244–253. [Google Scholar] [CrossRef] [PubMed]
  5. WHO Regional Office for Europe/European Centre for Disease Prevention and Control. Antimicrobial Resistance Surveillance in Europe 2022—2020 Data; WHO Regional Office for Europe: Copenhagen, Denmark, 2022. [Google Scholar]
  6. Schilcher, K.; Horswill, A.R. Staphylococcal biofilm development: Structure, regulation, and treatment strategies. Microbiol. Mol. Biol. Rev. 2020, 84, e00026-19. [Google Scholar] [CrossRef] [PubMed]
  7. Flemming, H.C.; van Hullebusch, E.D.; Neu, T.R.; Nielsen, P.H.; Seviour, T.; Stoodley, P.; Wingender, J.; Wuertz, S. The biofilm matrix: Multitasking in a shared space. Nat. Rev. Microbiol. 2023, 21, 70–86. [Google Scholar] [CrossRef]
  8. Jamal, M.; Ahmad, W.; Andleeb, S.; Jalil, F.; Imran, M.; Nawaz, M.A.; Ussain, T.; Ali, M.; Rafiq, M.; Kamil, M.A. Bacterial biofilm and associated infections. J. Chin. Med. Assoc. 2018, 81, 7–11. [Google Scholar] [CrossRef]
  9. Kolpen, M.; Kragh, K.N.; Enciso, J.B.; Faurholt-Jepsen, D.; Lindegaard, B.; Egelund, G.B.; Jensen, A.V.; Ravn, P.; Mathiesen, I.H.M.; Gheorge, A.G.; et al. Bacterial biofilms predominate in both acute and chronic human lung infections. Thorax 2022, 77, 1015–1022. [Google Scholar] [CrossRef]
  10. Staats, A.; Li, D.; Sullivan, A.C.; Stoodley, P. Biofilm formation in periprosthetic joint infections. Ann. Jt. 2021, 6, 43. [Google Scholar] [CrossRef]
  11. Oliva, A.; Mascellino, M.T.; Nguyen, B.L.; De Angelis, M.; Cipolla, A.; Di Berardino, A.; Ciccaglioni, A.; Mastroianni, C.M.; Vullo, V. Detection of biofilm-associated implant pathogens in cardiac device infections: High sensitivity of sonication fluid culture even in the presence of antimicrobials. J. Glob. Infect. Dis. 2018, 10, 74–79. [Google Scholar] [CrossRef]
  12. Shrestha, L.B.; Baral, R.; Khanal, B. Comparative study of antimicrobial resistance and biofilm formation among Gram-positive uropathogens isolated from community acquired urinary tract infections and catheter-associated urinary tract infections. Infect. Drug Resist. 2019, 12, 957–963. [Google Scholar] [CrossRef]
  13. Ng, X.Y.; Fong, K.W.; Kiew, L.V.; Chung, P.Y.; Liew, Y.K.; Delsuc, N.; Zulkefeli, M.; Low, M.L. Ruthenium (II) polypyridyl complexes as emerging photosensitisers for antibacterial photodynamic therapy. J. Inorg. Biochem. 2024, 250, 112425. [Google Scholar] [CrossRef] [PubMed]
  14. Uruén, C.; Chopo-Escuin, G.; Tommassen, J.; Mainar-Jaime, R.C.; Arenas, J. Biofilms as Promoters of Bacterial Antibiotic Resistance and Tolerance. Antibiotics 2021, 10, 3. [Google Scholar] [CrossRef] [PubMed]
  15. Sousa, A.P.; Ellena, J.; Gondim, A.C.S.; Lopes, L.G.F.; Sousa, E.H.S.; Vasconcelos, M.A.; Teixeira, E.H.; Ford, P.C.; Holanda, A.K.M. Antimicrobial activity of cis -[Ru(bpy)2(L)(L’)]n+ complexes, where L = 4-(4-chlorobenzoyl)pyridine or 4-(benzoyl)pyridine and L’ = Cl or CO. Polyhedron 2018, 144, 88–94. [Google Scholar] [CrossRef]
  16. Andrade, A.L.; Vasconcelos, M.A.; Arruda, F.V.S.; Nascimento Neto, L.G.; Carvalho, J.M.S.; Gondim, A.C.S.; Lopes, L.G.F.; Sousa, E.H.S.; Teixeira, E.H. Antimicrobial activity and antibiotic synergy of a biphosphinic ruthenium complex against clinically relevant bacteria. Biofouling 2020, 36, 442–454. [Google Scholar] [CrossRef]
  17. Sousa, A.P.; Gondim, A.C.S.; Sousa, E.H.S.; Lopes, L.G.F.; Martins, P.H.R.; Teixeira, E.H.; Vasconcelos, M.A.; Medeiros, E.J.T.; Batista, A.A.; Holanda, A.K.M. Biphosphinic ruthenium complexes as the promising antimicrobial agents. New J. Chem. 2020, 44, 21318–21325. [Google Scholar] [CrossRef]
  18. Sousa, A.P.; Gondim, A.C.S.; Sousa, E.H.S.; Vasconcelos, M.A.; Teixeira, E.H.; Bezerra, B.P.; Ayala, A.P.; Martins, P.H.R.; Lopes, L.G.F.; Holanda, A.K.M. An unusual bidentate methionine ruthenium(II) complex: Photo-uncaging and antimicrobial activity. J. Biol. Inorg. Chem. 2020, 25, 419–428. [Google Scholar] [CrossRef]
  19. Li, F.; Collins, J.G.; Keene, F.R. Ruthenium complexes as antimicrobial agents. Chem. Soc. Rev. 2015, 44, 2529–2542. [Google Scholar] [CrossRef]
  20. Southam, H.M.; Butler, J.A.; Chapman, J.A.; Poole, R.K. The Microbiology of Ruthenium Complexes. Adv. Microb. Physiol. 2017, 71, 1–96. [Google Scholar]
  21. Hamblin, M.R. Antimicrobial photodynamic inactivation: A bright new technique to kill resistant microbes. Curr. Opin. Microbiol. 2016, 33, 67–73. [Google Scholar] [CrossRef]
  22. Mendhi, J.; Asgari, M.; Ratheesha, G.; Prasadama, I.; Yanga, Y.; Xiao, Y. Dose controlled nitric oxide-based strategies for antibacterial property in biomedical devices. Appl. Mater. 2020, 19, 100562. [Google Scholar] [CrossRef]
  23. Hall, J.R.; Rouillard, K.R.; Suchyta, D.J.; Brown, M.D.; Ahonen, M.J.R.; Schoenfisc, M.H. Mode of nitric oxide delivery affects antibacterial action. ACS Biomater. Sci. Eng. 2020, 6, 433–441. [Google Scholar] [CrossRef] [PubMed]
  24. Sharma, B.; Shukla, S.; Rattan, R.; Fatima, M.; Goel, M.; Bhat, M.; Dutta, S.; Ranjan, R.K.; Sharma, M. Antimicrobial Agents Based on Metal Complexes: Present Situation and Future Prospects. Int. J. Biomater. 2022, 2022, 6819080. [Google Scholar] [CrossRef] [PubMed]
  25. Giri, B.; Saini, T.; Kumbhakar, S.; Karumban, K.S.; Muley, A.; Misra, A.; Maji, S. Near-IR light-induced photorelease of nitric oxide (NO) on ruthenium nitrosyl complexes: Formation, reactivity, and biological effects. Dalton Trans. 2020, 49, 10772–10785. [Google Scholar] [CrossRef] [PubMed]
  26. Bourassa, J.L.; Ford, P.C. Flash and continuous photolysis studies of Roussin’s red salt dianion Fe2S2(NO)42− in solution. Coord. Chem. Rev. 2000, 200, 887–900. [Google Scholar] [CrossRef]
  27. Wecksler, S.R.; Mikhailovsky, A.; Korystov, D.; Buller, F.; Kannan, R.; Tan, L.-S.; Ford, P.C. Single- and two-photon properties of a dye-derivatized Roussin’s red salt ester (Fe2(μ-RS)2(NO)4) with a large TPA cross section. Inorg. Chem. 2007, 46, 395–402. [Google Scholar] [CrossRef]
  28. Lima, R.G.; Sauaia, M.G.; Bonaventura, D.; Tedesco, A.C.; Lopez, R.F.V.; Bendhack, L.M.; Silva, R.S. Controlled nitric oxide photo-release from nitro ruthenium complexes: The vasodilator response produced by UV light irradiation. Inorg. Chim. Acta 2005, 358, 2643–2650. [Google Scholar] [CrossRef]
  29. Silva, H.V.R.; Dias, J.S.M.; Ferreira-Silva, G.Á.; Vegas, L.C.; Ionta, M.; Corrêa, C.C.; Batista, A.A.; Barbosa, M.I.F.; Doriguetto, A.C. Phosphine/diimine ruthenium complexes with Cl, CO, NO+, NO2, NO3 and pyridine ligands: Proapoptotic activity on triple-negative breast cancer cells and DNA/HSA interactions. Polyhedron 2018, 144, 55–65. [Google Scholar] [CrossRef]
  30. Agilent. CrysAlis PRO; Agilent Technologies Ltd.: Oxfordshire, UK, 2013; pp. 1–60. [Google Scholar]
  31. Sheldrick, G.M. Crystal Structure Refinement with SHELXL. Acta Cryst. C 2015, 71, 3–8. [Google Scholar] [CrossRef]
  32. Dolomanov, O.V.; Bourhis, L.J.; Gildea, R.J.; Howard, J.A.K.; Puschmann, H. OLEX2: A Complete Structure Solution, Refinement and Analysis Program. J. Appl. Cryst. 2009, 42, 339–341. [Google Scholar] [CrossRef]
  33. Sheldrick, G.M. TWINABS; University of Göttingen: Göttingen, Germany, 2009. [Google Scholar]
  34. Macrae, C.F.; Edgington, P.R.; McCabe, P.; Pidcock, E.; Shields, G.P.; Taylor, R.; Towler, M.; van de Streek, J. Mercury: Visualization and Analysis of Crystal Structures. J. Appl. Cryst. 2006, 39, 453–457. [Google Scholar] [CrossRef]
  35. M07-A10; Method for Dilution Antibacterial Susceptibility Tests for Bacteria That Grow Aerobically: Approved Standard, 10th ed. Clinical and Laboratory Standards Institute: Pennsylvania, PA, USA, 2015.
  36. Das, B.; Mandal, D.; Dash, S.K.; Chattopadhyay, S.; Tripathy, S.; Dolai, D.P.; Dey, S.K.; Roy, S. Eugenol Provokes ROS-Mediated Membrane Damage-Associated Antibacterial Activity Against Clinically Isolated Multidrug-Resistant Staphylococcus aureus Strains. Infect. Dis. 2016, 9, 11–19. [Google Scholar] [CrossRef] [PubMed]
  37. Odds, F.C. Synergy, antagonism, and what the chequerboard puts between them. J. Antimicrob. Chemother. 2003, 52, 1. [Google Scholar] [CrossRef] [PubMed]
  38. Castelo-Branco, D.S.; Riello, G.B.; Vasconcelos, D.C.; Guedes, G.M.; Serpa, R.; Bandeira, T.J.; Monteiro, A.J.; Cordeiro, R.A.; Rocha, M.F.; Sidrim, J.J.; et al. Farnesol increases the susceptibility of Burkholderia pseudomallei biofilm to antimicrobials used to treat melioidosis. J. Appl. Microbiol. 2016, 120, 600–606. [Google Scholar] [CrossRef] [PubMed]
  39. Jiang, L.; Ma, Y.; Xiong, Y.; Tan, Y.; Duan, X.; Liao, X.; Wang, J. Ruthenium polypyridine complexes with triphenylamine groups as antibacterial agents against Staphylococcus aureus with membrane-disruptive mechanism. Front. Chem. 2022, 10, 1035741. [Google Scholar] [CrossRef]
  40. Holanda, A.K.M.; da Silva, F.O.N.; Sousa, J.R.; Diogenes, I.C.N.; Carvalho, I.M.M.; Moreira, I.S.; Clarke, M.J.; Lopes, L.G.F. Photochemical NO release from nitrosyl Ru-II complexes with C-bound imidazoles. Inorganica Chim. Acta 2008, 361, 2929–2933. [Google Scholar] [CrossRef]
  41. da Silveira Carvalho, J.M.; Batista, A.H.M.; Nogueira, N.A.P.; Holanda, A.K.M.; Sousa, J.R.; Zampiere, D.; Bezerra, M.J.B.; Barreto, F.S.; Moraes, M.O.; Batista, A.A.; et al. A biphosphinic ruthenium complex with potent anti-bacterial and anti-cancer activity. New J. Chem. 2017, 41, 13085–13095. [Google Scholar] [CrossRef]
  42. Hernando-Amado, S.; Coque, T.M.; Baquero, F.; Martínez, J.L. Defining and combating antibiotic resistance from One Health and Global Health perspectives. Nat. Rev. Microbiol. 2019, 4, 1432–1442. [Google Scholar] [CrossRef]
  43. Ghosh, S.; Amariei, G.; Mosquera, M.E.G.; Rosal, R. Polymeric ruthenium precursor as a photoactivated antimicrobial agent. J. Hazard. Mater. 2021, 402, 123788. [Google Scholar] [CrossRef]
  44. Burnham, C.; Leeds, J.; Nordmann, P.; O’Grady, J.; Patel, J. Diagnosing antimicrobial resistance. Nat. Rev. Microbiol. 2017, 15, 697–703. [Google Scholar] [CrossRef]
  45. Ghosh, T.; Biswas, M.K.; Chatterjee, S.; Roy, P. In-vitro study on the hemolytic activity of different extracts of Indian medicinal plant Croton bonplandianum with phytochemical estimation: A new era in drug development. J. Drug Deliv. Ther. 2018, 8, 155–160. [Google Scholar] [CrossRef]
  46. Kaviyarasu, K.; Geetha, N.; Kanimozhi, K.; Magdalane, C.M.; Sivaranjani, S.; Ayeshamariam, A.; Kennedy, J.; Maaza, M. In vitro cytotoxicity effect and antibacterial performance of human lung epithelial cells A549 activity of Zinc oxide doped TiO2 nanocrystals: Investigation of bio-medical application by chemical method. Mater. Sci. Eng. 2017, 74, 325–333. [Google Scholar] [CrossRef] [PubMed]
  47. Amariei, G.; Kokol, V.; Boltes, K.; Letón, P.; Rosal, R. Incorporation of antimicrobial peptides on electrospun nanofibres for biomedical applications. RSC Adv. 2018, 8, 28013–28023. [Google Scholar] [CrossRef] [PubMed]
  48. Magdalane, C.M.; Kaviyarasu, K.; Raja, A.; Arularasu, M.V.; Mola, G.T.; Isaev, A.B.; Aldhabi, N.A.; Arasu, M.V.; Jeyaraj, B.; Kennedy, J.; et al. Photocatalytic decomposition effect of erbium doped cerium oxide nanostructures driven by visible light irradiation: Investigation of cytotoxicity, antibacterial growth inhibition using catalysts. J. Photochem. Photobiol. B. 2018, 185, 275–282. [Google Scholar] [CrossRef] [PubMed]
  49. Conti, L.; Mengoni, A.; Giacomazzo, G.E.; Mari, L.; Perfetti, M.; Fagorzi, C.; Sorace, L.; Valtancoli, B.; Giorgi, C. Exploring the potential of highly charged Ru(II)- and heteronuclear Ru(II)/Cu(II)-polypyridyl complexes as antimicrobial agents. J. Inorg. Biochem. 2021, 220, 11467. [Google Scholar] [CrossRef]
  50. Kay, M.I.; Frazer, B.C. A neutron diffraction refinement of the low temperature phase of NaNO2. Acta Crystallogr. 1961, 14, 56–57. [Google Scholar] [CrossRef]
  51. Bastos, T.M.; Barbosa, M.I.F.; Silva, M.M.; Júnior, J.W.C.; Meira, C.S.; Guimarães, E.T.; Ellena, J.; Moreira, D.R.M.; Batista, A.A.; Soares, M.B.P. Nitro/nitrosyl ruthenium complexes are potent and selective anti-Trypanosoma cruzi agents causing autophagy and necrotic parasite death. Antimicrob. Agents Chemother. 2014, 58, 6044–6055. [Google Scholar] [CrossRef]
  52. Freedman, D.A.; Kruger, S.; Roosa, C.; Wymer, C. Synthesis, characterization, and reactivity of [Ru(bpy)(CH3CN)3(NO2)]PF6, a synthon for [Ru(bpy)(L3)NO2] complexes. Inorg. Chem. 2006, 45, 9558–9568. [Google Scholar] [CrossRef]
  53. Sousa, A.P.; Fernandes, A.F.; Paz, I.A.; Nascimento, N.R.F.; Ellena, J.; Sousa, E.H.S.; Lopes, I.G.F.; Holanda, A.K.M. A Potential Visible-Light NO Releaser: Synthesis, Reactivity and Vasodilator Properties. J. Braz. Chem. Soc. 2017, 28, 2117–2129. [Google Scholar] [CrossRef]
  54. Honorato, J.; Colina-Vegas, L.; Correa, R.S.; Guedes, A.P.M.; Miyata, M.; Pavan, F.R.; Ellena, J.; Batista, A.A. Esterification of the free carboxylic group from the lutidinic acid ligand as a tool to improve the cytotoxicity of Ru(ii) complexes. Inorg. Chem. Front. 2019, 6, 376–390. [Google Scholar] [CrossRef]
  55. Bogdan, C.; Röllinghoff, M.; Diefenbach, A. The role of nitric oxide in innate immunity. Immunol. Rev. 2000, 173, 17–26. [Google Scholar] [CrossRef]
  56. Abreu, F.D.; Paulo, T.F.; Gehlen, M.H.; Ando, R.A.; Lopes, L.G.F.; Gondim, A.C.S.; Vasconcelos, M.A.; Teixeira, E.H.; Sousa, E.H.S.; Carvalho, I.M.M. Aryl-Substituted Ruthenium(II) Complexes: A Strategy for Enhanced Photocleavage and Efficient DNA Binding. Inorg. Chem. 2017, 56, 9084–9096. [Google Scholar] [CrossRef] [PubMed]
  57. Sharma, D.; Misba, L.; Khan, A.U. Antibiotics versus Biofilm: An Emerging Battleground in Microbial Communities. Antimicrob. Resist. Infect. Control 2019, 8, 76. [Google Scholar] [CrossRef] [PubMed]
  58. Parvin, F.; Hu, H.; Whiteley, G.S.; Glasbey, T.; Vickery, K. Difficulty in Removing Biofilm from Dry Surfaces. J. Hosp. Infect. 2019, 103, 465–467. [Google Scholar] [CrossRef] [PubMed]
  59. Fotinos, N.; Convert, M.; Piffaretti, J.C.; Gurny, R.; Lange, N. Effects on Gram-Negative and Gram-Positive Bacteria Mediated by 5-Aminolevulinic Acid and 5-Aminolevulinic Acid Derivatives. Antimicrob. Agents Chemother. 2008, 52, 1366–1373. [Google Scholar] [CrossRef]
  60. Otter, J.A.; Vickery, K.; Walker, J.T.; De Lancey Pulcini, E.; Stoodley, P.; Goldenberg, S.D.; Salkeld, J.A.G.; Chewins, J.; Yezli, S.; Edgeworth, J.D. Surface-Attached Cells, Biofilms and Biocide Susceptibility: Implications for Hospital Cleaning and Disinfection. J. Hosp. Infect. 2015, 89, 16–27. [Google Scholar] [CrossRef]
  61. Sharma, A.; Gupta, S.; Sarethy, I.P.; Dang, S.; Gabrani, R. Green tea extract: Possible mechanism and antibacterial activity on skin pathogens. Food Chem. 2012, 135, 672–675. [Google Scholar] [CrossRef]
  62. Flemming, H.C.; Wingender, J. The biofilm matrix. Nat. Rev. Microbiol. 2010, 8, 623–633. [Google Scholar] [CrossRef]
  63. Sun, W.Z.; Jian, Y.; Zhou, M.X.; Yao, Y.S.; Tian, N.; Li, C.; Chen, J.; Wang, X.S.; Zhou, Q.X. Selective and efficient photoinactivation of intracellular Staphylococcus aureus and MRSA with little accumulation of drug resistance: Application of a Ru(II) complex with photolabile ligands. J. Med. Chem. 2021, 64, 7359–7370. [Google Scholar] [CrossRef]
  64. Yan, J.; Bassler, B.L. Surviving as a community: Antibiotic tolerance and persistence in bacterial biofilms. Cell Host Microbe 2019, 26, 15–21. [Google Scholar] [CrossRef]
  65. Gafur, A.; Sukamdani, G.Y.; Kristi, N.; Maruf, A.; Xu, J.; Chen, X.; Wang, G.; Ye, Z. From bulk to nano-delivery of essential phytochemicals: Recent progress and strategies for antibacterial resistance. J. Mater. Chem. B 2020, 8, 9825–9835. [Google Scholar] [CrossRef]
  66. Wang, L.L.; Battini, N.; Bheemanaboina, R.R.Y.; Ansari, M.F.; Chen, J.P.; Xie, Y.P.; Cai, G.X.; Zhang, S.L.; Zhou, C.H. A new exploration towards aminothiazolquinolone oximes as potentially multi-targeting antibacterial agents: Design, synthesis and evaluation acting on microbes, DNA, HSA and topoisomerase IV. Eur. J. Med. Chem. 2019, 179, 166–181. [Google Scholar] [CrossRef] [PubMed]
  67. Rhoads, D.D.; Wolcott, R.D.; Percival, S.L. Biofilms in wounds: Management strategies. J. Wound Care 2008, 17, 502–508. [Google Scholar] [CrossRef] [PubMed]
  68. Anderson, G.G.; O’Toole, G.A. Innate and induced resistance mechanisms of bacterial biofilms. In Bacterial Biofilms; Romeo, T., Ed.; Springer: Berlin/Heidelberg, Germany, 2008; Volume 322, pp. 85–105. [Google Scholar]
  69. Sun, D.; Zhang, W.; Yang, E.; Li, N.; Liu, H.; Wang, W. Investigation of antibacterial activity and related mechanism of a ruthenium(II) polypyridyl complex. Inorg. Chem. Commun. 2015, 56, 17–21. [Google Scholar] [CrossRef]
  70. Jin, H.; Yang, L.; Ahonen, M.J.R.; Schoenfisch, M.H. Nitric Oxide-Releasing Cyclodextrins. J. Am. Chem. Soc. 2018, 140, 14178–14184. [Google Scholar] [CrossRef]
Figure 1. Structure of the nitro complex [RuCl(NO2)(dppb)(4,4-Mebipy)], designated complex I.
Processes 12 02841 g001
Figure 2. (A,B) LED light system used for uniform irradiation of samples in a 96-well plate. The system features a dedicated lamp for each well (λmax = 463 nm; power = 8 mW/cm2).
Processes 12 02841 g002
Figure 3. Molecular geometries for complex I showing the two isomers generated by the disordered NO2 and Cl ligands (ellipsoids at 30% of probability). For the sake of clarity, two methanol molecules as solvate were omitted.
Processes 12 02841 g003
Figure 4. Differential pulse voltammogram of complex I in NaTFA solution, pH 7.0; µ = 1 mol/L at a glassy carbon electrode, utilizing a platinum wire as the auxiliary electrode and Ag/AgCl as the reference electrode. The voltammogram was obtained following light irradiation at 463 nm. Solid line: initial substance in the absence of light; dashed line: subsequent to irradiation. The potential scan commenced at 0.3 V with an anodic sweep.
Processes 12 02841 g004
Figure 5. UV/Vis/NIR spectroelectrochemical response of complex I during reduction at a negative potential of −1.0 V for 210 min.
Processes 12 02841 g005
Figure 6. DNA cleavage assay. Lane 2 shows only pBR322 DNA. Plasmid DNA with complex I at concentrations of 100, 50, and 30 µM was incubated in the dark or exposed to blue light for 1 h. The [Ru(bpy)3]2+ complex served as a positive control for TBP.
Processes 12 02841 g006
Figure 7. Effect of Complex I on the biofilm formation (24 h) of S. aureus, S. epidermidis, E. coli, and P. aeruginosa. Quantification of biomass (AF) by crystal violet (CV) staining assay. White columns denote biofilm subjected to different concentrations of Complex I, while black columns indicate untreated biofilm (control, medium containing 4% DMSO). **** p < 0.0001 represent statistical difference in relation to the control.
Processes 12 02841 g007
Figure 8. Effect of Complex I on the number of viable cells present in biofilm formation (24 h) of S. aureus, S. epidermidis, E. coli, and P. aeruginosa. Counting the number of viable cells (AF). White columns denote biofilm subjected to different concentrations of Complex I, while black columns indicate untreated biofilm (control, medium containing 4% DMSO). **** p < 0.0001 represent statistical difference in relation to the control.
Processes 12 02841 g008
Figure 9. Effect of Complex I on the biomass of mature biofilms (48 h) of S. aureus, S. epidermidis, E. coli, and P. aeruginosa. Quantification of biomass (AF) through crystal violet (CV) staining assay. White columns denote biofilm subjected to different concentrations of Complex I, while black columns indicate untreated biofilm (control, medium containing 4% DMSO). * p < 0.05, **** p < 0.0001 represent statistical difference in relation to the control.
Processes 12 02841 g009
Figure 10. Effect of Complex I on the number of viable cells present in mature biofilms (48 h) of S. aureus, S. epidermidis, E. coli, and P. aeruginosa. Counting the number of viable cells (AF). White columns denote biofilm subjected to different concentrations of Complex I, while black columns indicate untreated biofilm (control, medium containing 4% DMSO). * p < 0.05, ** p < 0.01, **** p < 0.0001 represent statistical difference in relation to the control.
Processes 12 02841 g010
Figure 11. Electron micrographs obtained by SEM illustrating the impact of Complex I on biofilm development of S. aureus ATCC 700698 (AD) and E. coli ATCC 11303 (EH) following 24 h of treatment. Electron micrographs show untreated biofilms of S. aureus (A,B) and E. coli (E,F) at magnifications of 20,000× and 65,000×, respectively. Electron micrographs show biofilms of S. aureus (C,D) and E. coli (G,H) treated with Complex I at a concentration of 32 μg/mL and 256 μg/mL, respectively, at magnifications of 20,000× and 65,000×.
Processes 12 02841 g011
Figure 12. Micrographs of the evaluation of the effect of Complex I on biofilm formation (24 h) and mature biofilms (48 h) of S. aureus ATCC 700698. (A) Untreated S. aureus ATCC 700698 (MRSA) biofilms. (B) S. aureus ATCC 700698 (MRSA) biofilms treated with Complex I at a concentration of 32 μg/mL. (C) Untreated S. aureus ATCC 700698 (MRSA) mature biofilms. (D) S. aureus ATCC 700698 (MRSA) mature biofilms treated with Complex I at a concentration of 64 μg/mL. Magnitude: 600× (AD). Lasers: 488 nm for SYTO9 detection and 561 nm for propidium iodide detection.
Processes 12 02841 g012
Figure 13. Hemolytic activity of Complex I on human erythrocytes. **** p < 0.0001 represents statistical differences concerning the total hemolysis control (SDS 1%).
Processes 12 02841 g013
Figure 14. Cytotoxicity of nitro complex I against murine fibroblast L929 cell line. The cell viability was determined by MTT assay. After (A) 24 h and (B) 48 h of treatment. Error bars indicate standard error of the mean (SEM). *** p < 0.001, ** p < 0.01, * p < 0.05 compared to control (medium with 1% DMSO).
Processes 12 02841 g014
Table 1. Crystal data and structure refinement parameters obtained for complex I.
Empirical formula Ru1C42H48ClN3O4P2
Formula weight 857.29
Temperature/K 293 (2)
Crystal system Monoclinic
Space group P21/n
a/Å 12.3962 (2)
b/Å 19.0198 (3)
c/Å 16.9362 (3)
α/° 90
β/° 92.645 (2)
γ/° 90
Volume/Å3 3988.85 (11)
Z 4
ρcalcg/cm3 1.428
μ/mm−1 0.586
F(000) 1776.0
Crystal size/mm3 0.545 × 0.218 × 0.208
Radiation MoKα (λ = 0.71073)
2Θ range for data collection/° 5.27 to 53.998
Index ranges −15 ≤ h ≤ 15, −24 ≤ k ≤ 24, −21 ≤ l ≤ 21
Reflections collected 52,577
Independent reflections 8703 [Rint = 0.0256, Rsigma = 0.0164]
Data/restraints/parameters 8703/0/502
Goodness-of-fit on F2 1.199
Final R indexes [I > =2σ (I)] R1 = 0.0329, wR2 = 0.0739
Final R indexes [all data] R1 = 0.0449, wR2 = 0.0865
Largest diff. peak/hole/e Å−3 0.60/−0.45
Table 2. Selected angle and bond lengths for complex I.
Bond Angles (°) Bond Lengths (Å)
P1-Ru1-P297.70 (2)Ru1-P22.3540 (6)
N2-Ru1-N376.58 (8)Ru1-P12.3269 (6)
P2-Ru1-N2173.49 (6)Ru1-N22.121 (2)
N1b-Ru1-Cl1b91.8 (7)Ru1-N32.115 (2)
N1a-Ru1-Cl1a93.7 (4)Ru1-N1a2.084 (2)
O1a-N1a-O2a120.2 (10)Ru1-N1b2.085 (2)
O1b-N1b-O2b111.6 (17)Ru1-Cl1a2.453 (1)
--Ru1-Cl1b2.372 (2)
N1a-O1a1.197 (17)
N1a-O2a1.225 (15)
N1b-O2b1.25 (2)
N1b-O1b1.23 (3)
Table 3. Antimicrobial susceptibility of Gram-positive and Gram-negative bacteria by complex I and antibiotics.
Complex IAmpicillinTetracycline
LED OFFLED ON
MICMBCMICMBCMICMBCMICMBC
S. aureus
(ATCC 25923)
816440.25 S0.50.25 S4
S. aureus
(ATCC 700698)
163281664 R64128 R128
S. epidermidis
(ATCC 12228)
88442 S20.25 S4
S. epidermidis
(ATCC 35984)
1632481024 R10241 S4
E. coli
(ATCC 11303)
256ND256ND1 S21 S4
P. aeruginosa
(ATCC 27853)
256ND256ND128 RND64 R128
MIC and MBC (µg/mL). (S) Sensitive; (R) Resistant; (ND) Not Determined at the highest concentration tested.
Table 4. Effect of complex I combined with ampicillin and tetracycline against Gram-positive and Gram-negative bacteria.
Complex I/Ampicillin Complex I/Tetracycline
MIC aMIC bFICIMIC aMIC bFICI
S. aureus
(ATCC 25923)
0.240.090.311 (S)1.90.040.625 (NI)
S. aureus
(ATCC 700698)
0.9812.50.375 (S)0.48500.562 (NI)
S. epidermidis
(ATCC 12228)
0.240.390.311 (S)1.90.040.625 (NI)
S. epidermidis
(ATCC 35984)
0.241250.186 (S)3.90.041.063 (NI)
E. coli
(ATCC 11303)
2500.021.063 (NI)15.60.190.311 (S)
P. aeruginosa
(ATCC 27853)
5002524.0 (A)15.6160.311 (S)
MIC a = novel MIC value of complex I combined antibiotic; MIC b = novel MIC value of antibiotic combined complex I; (S) Synergistic; (NI) No interaction; (A) Antagonistic; I = Complex I; Amp = ampicillin; Tetra = tetracycline. MIC values in µg/mL.
Disclaimer/Publisher’s Note: The statements, opinions and data contained in all publications are solely those of the individual author(s) and contributor(s) and not of MDPI and/or the editor(s). MDPI and/or the editor(s) disclaim responsibility for any injury to people or property resulting from any ideas, methods, instructions or products referred to in the content.

