
Coffee-Waste-Based ZnCl2 Activated Carbon in High-Performance Supercapacitor Electrodes: Impact of Graphitization, Surface Morphology, Porosity and Conductivity

 , ,
, ,
Abstract
1. Introduction
2. Experimental
2.1. Materials
2.2. Equipment
2.3. Carbon Material Preparation
- Thermal (pyrolytic) treatment (CPyrol)
- Chemical activation (ACChem)
2.4. Carbon Disc Electrode Preparation
2.5. Electrochemical Methods
3. Results
3.1. Carbon Disc Characterization
- -
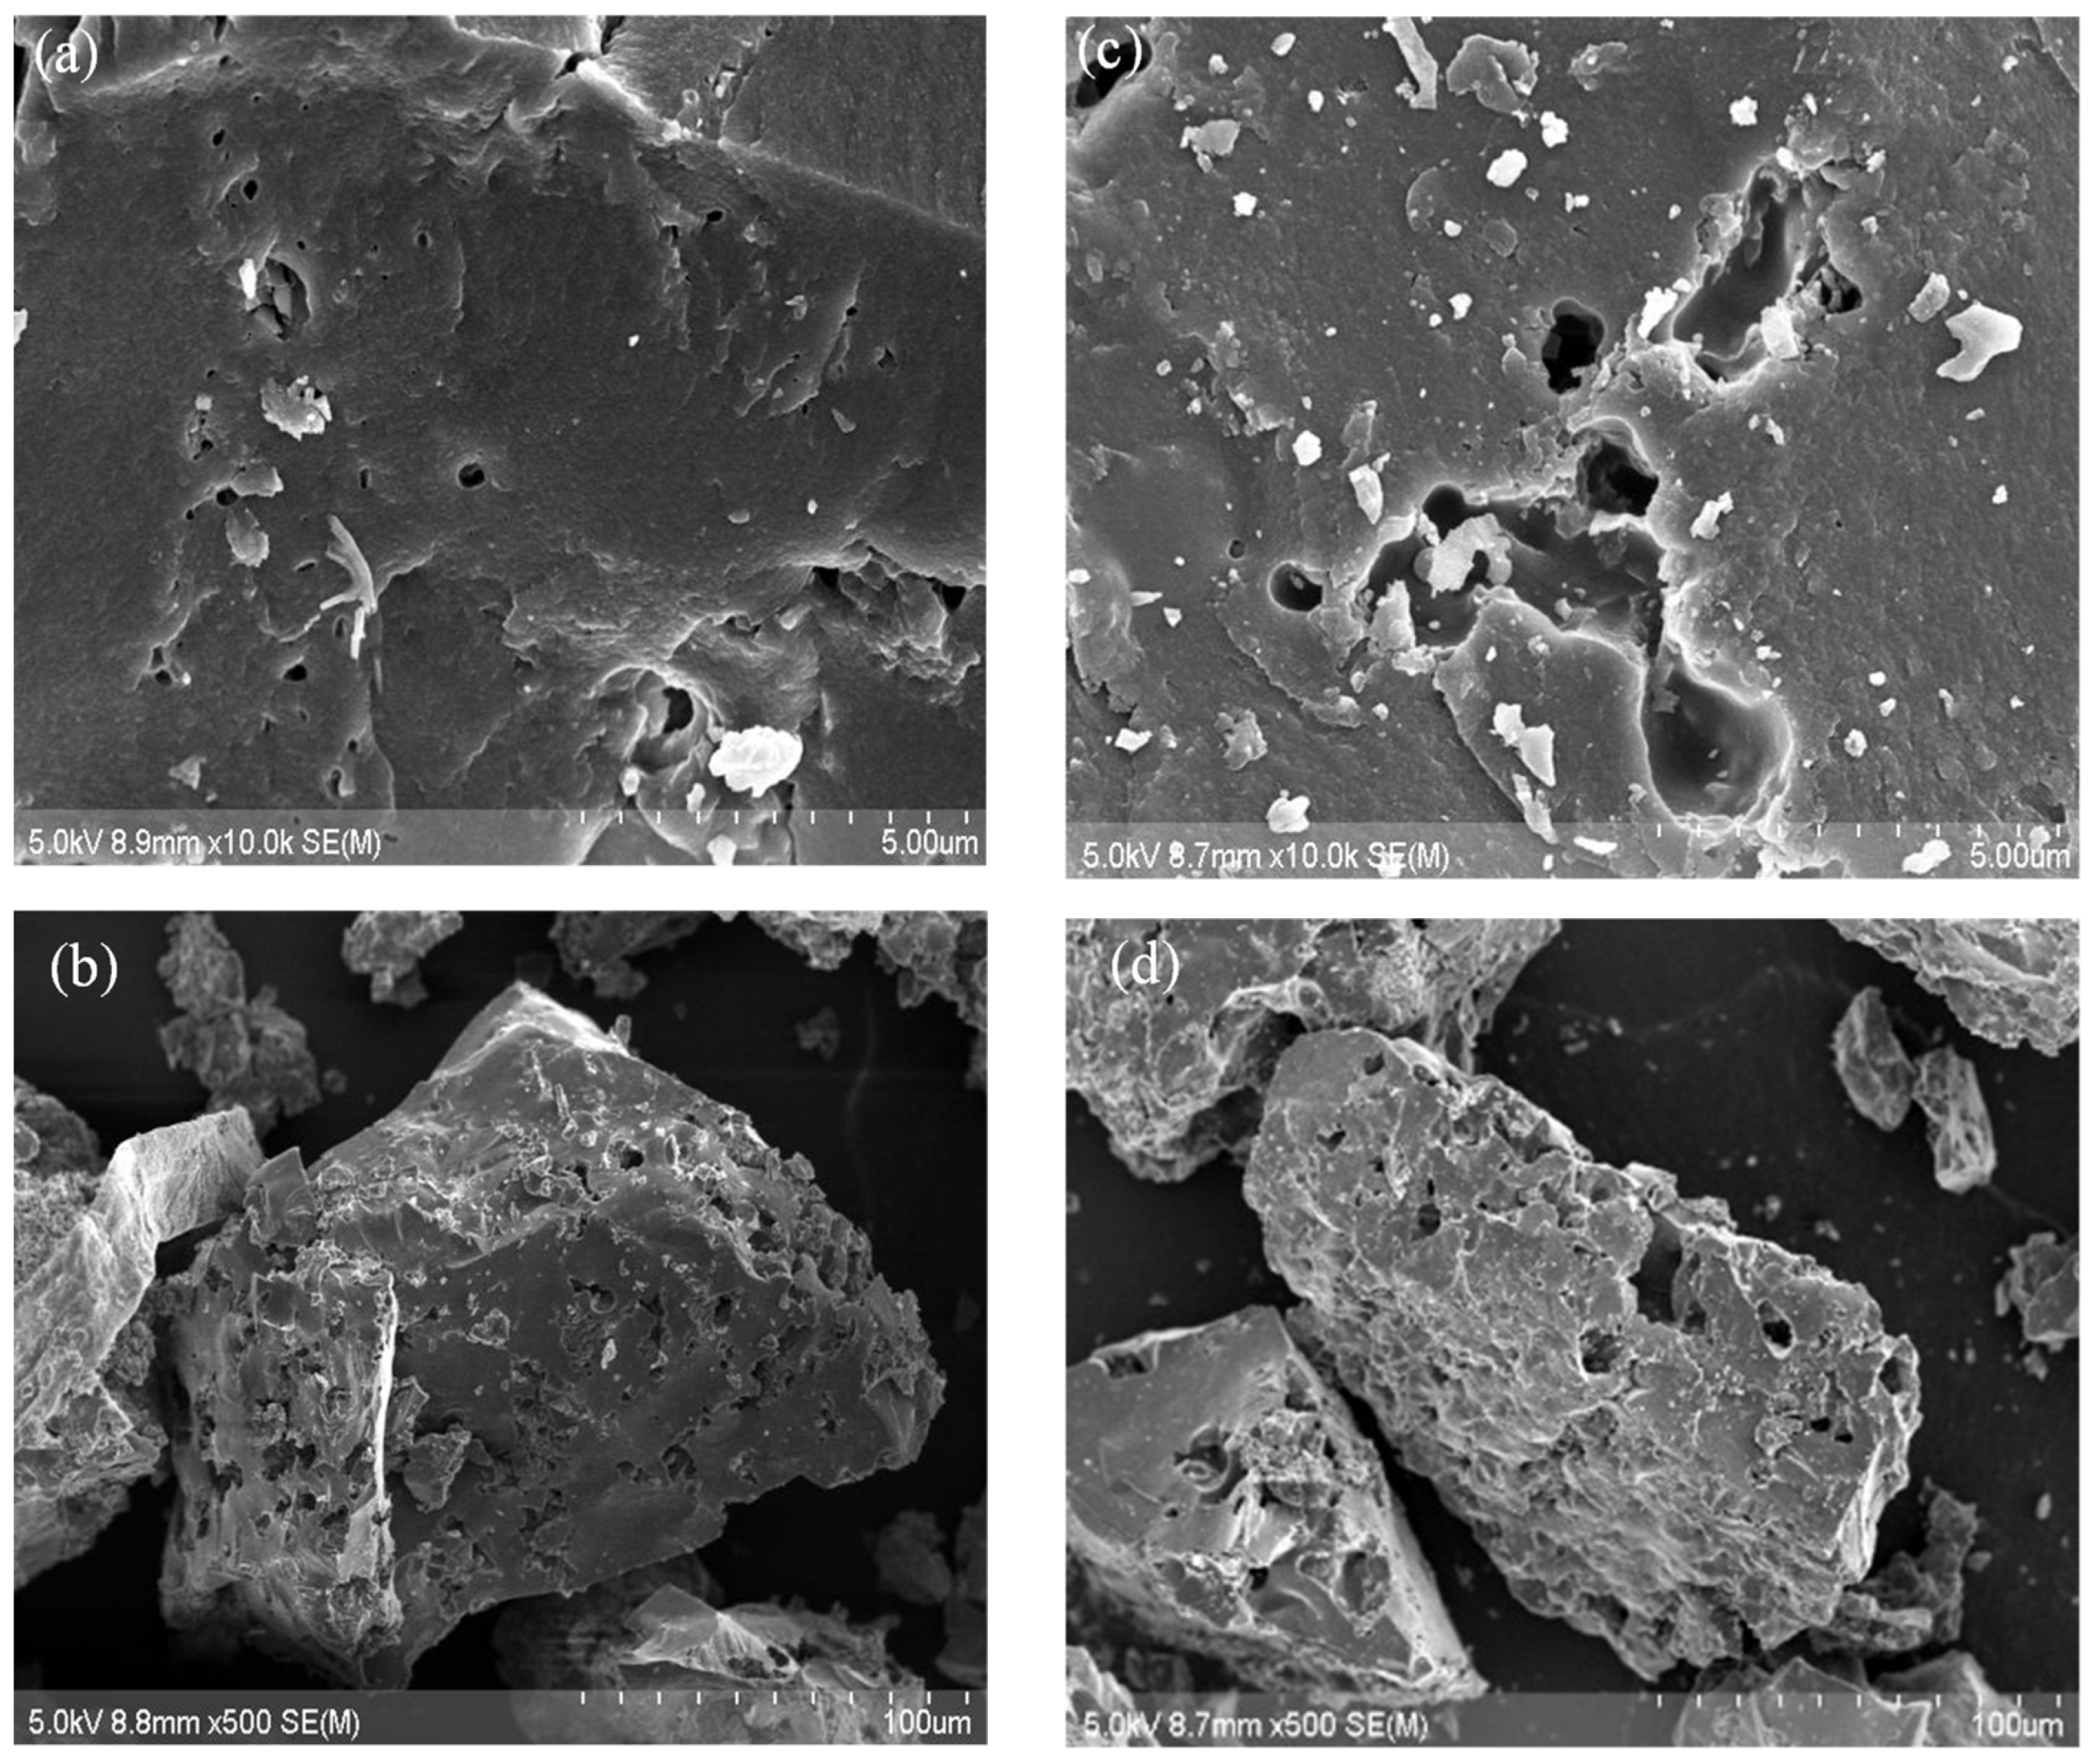
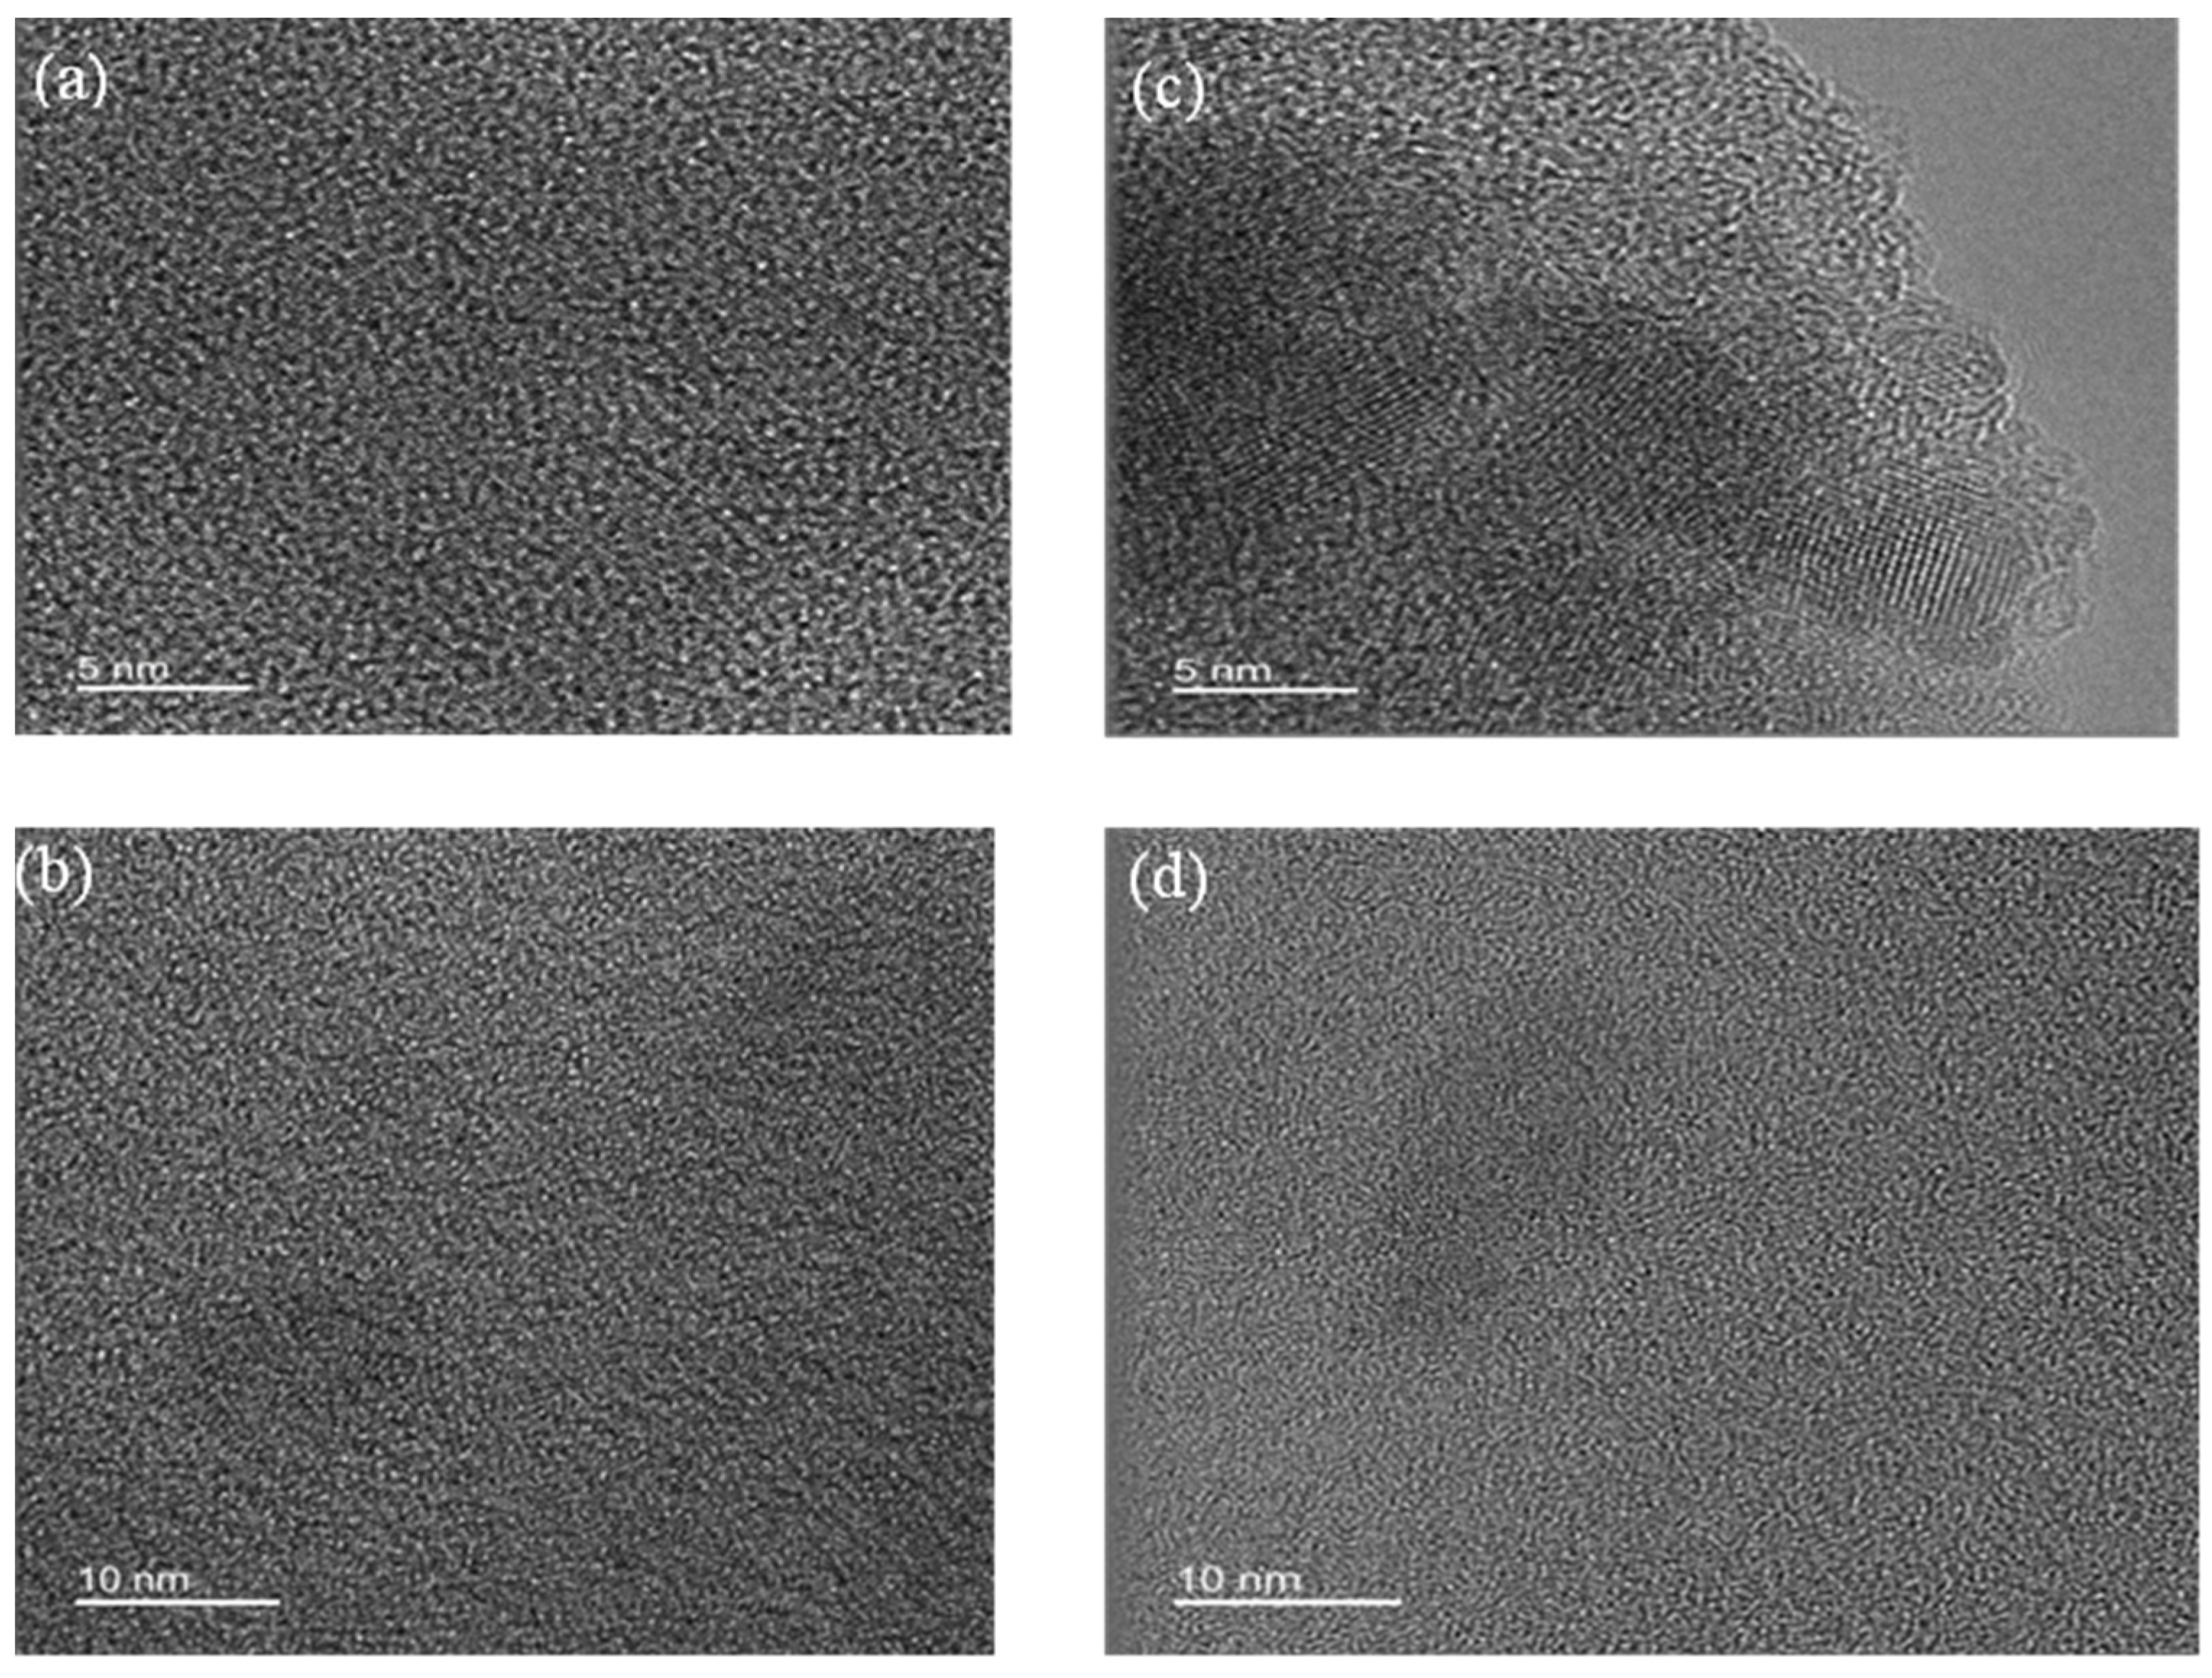
- Carbon Morphology
- -
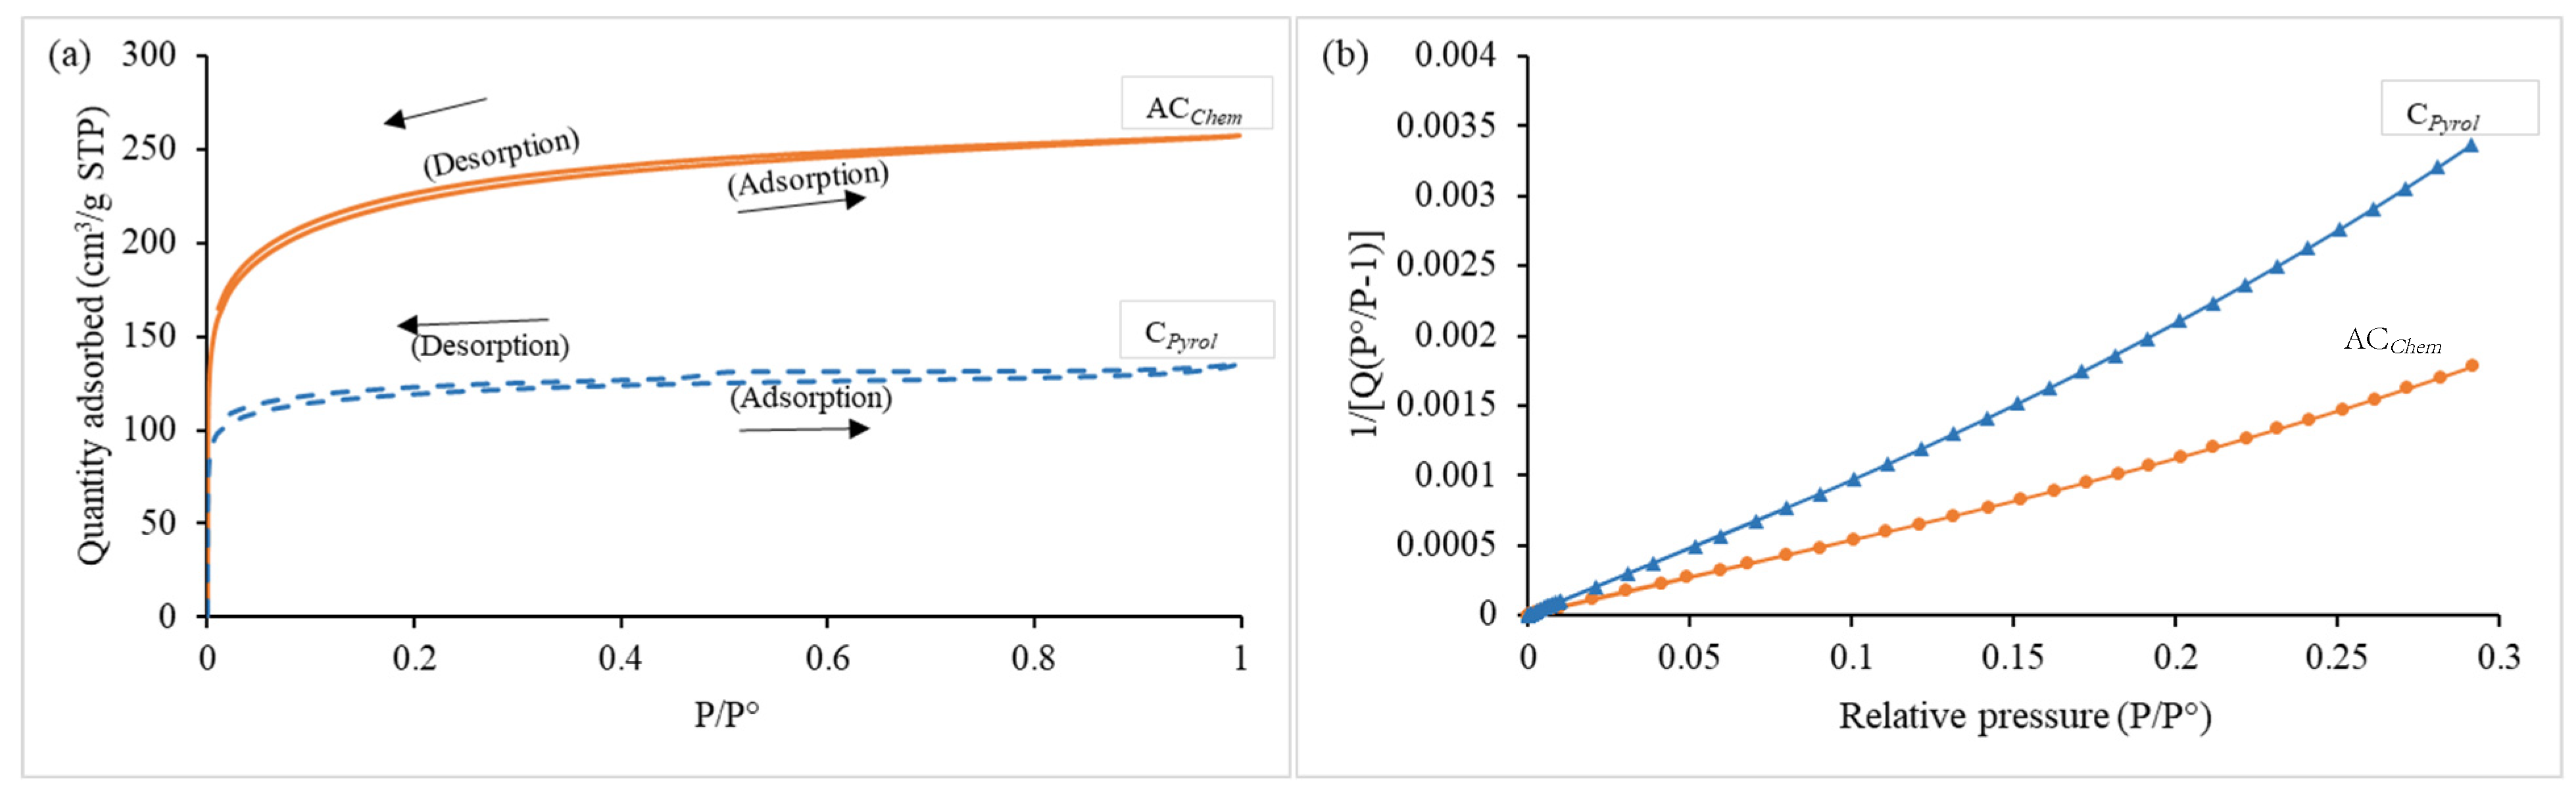
- Carbon material porosity
- -
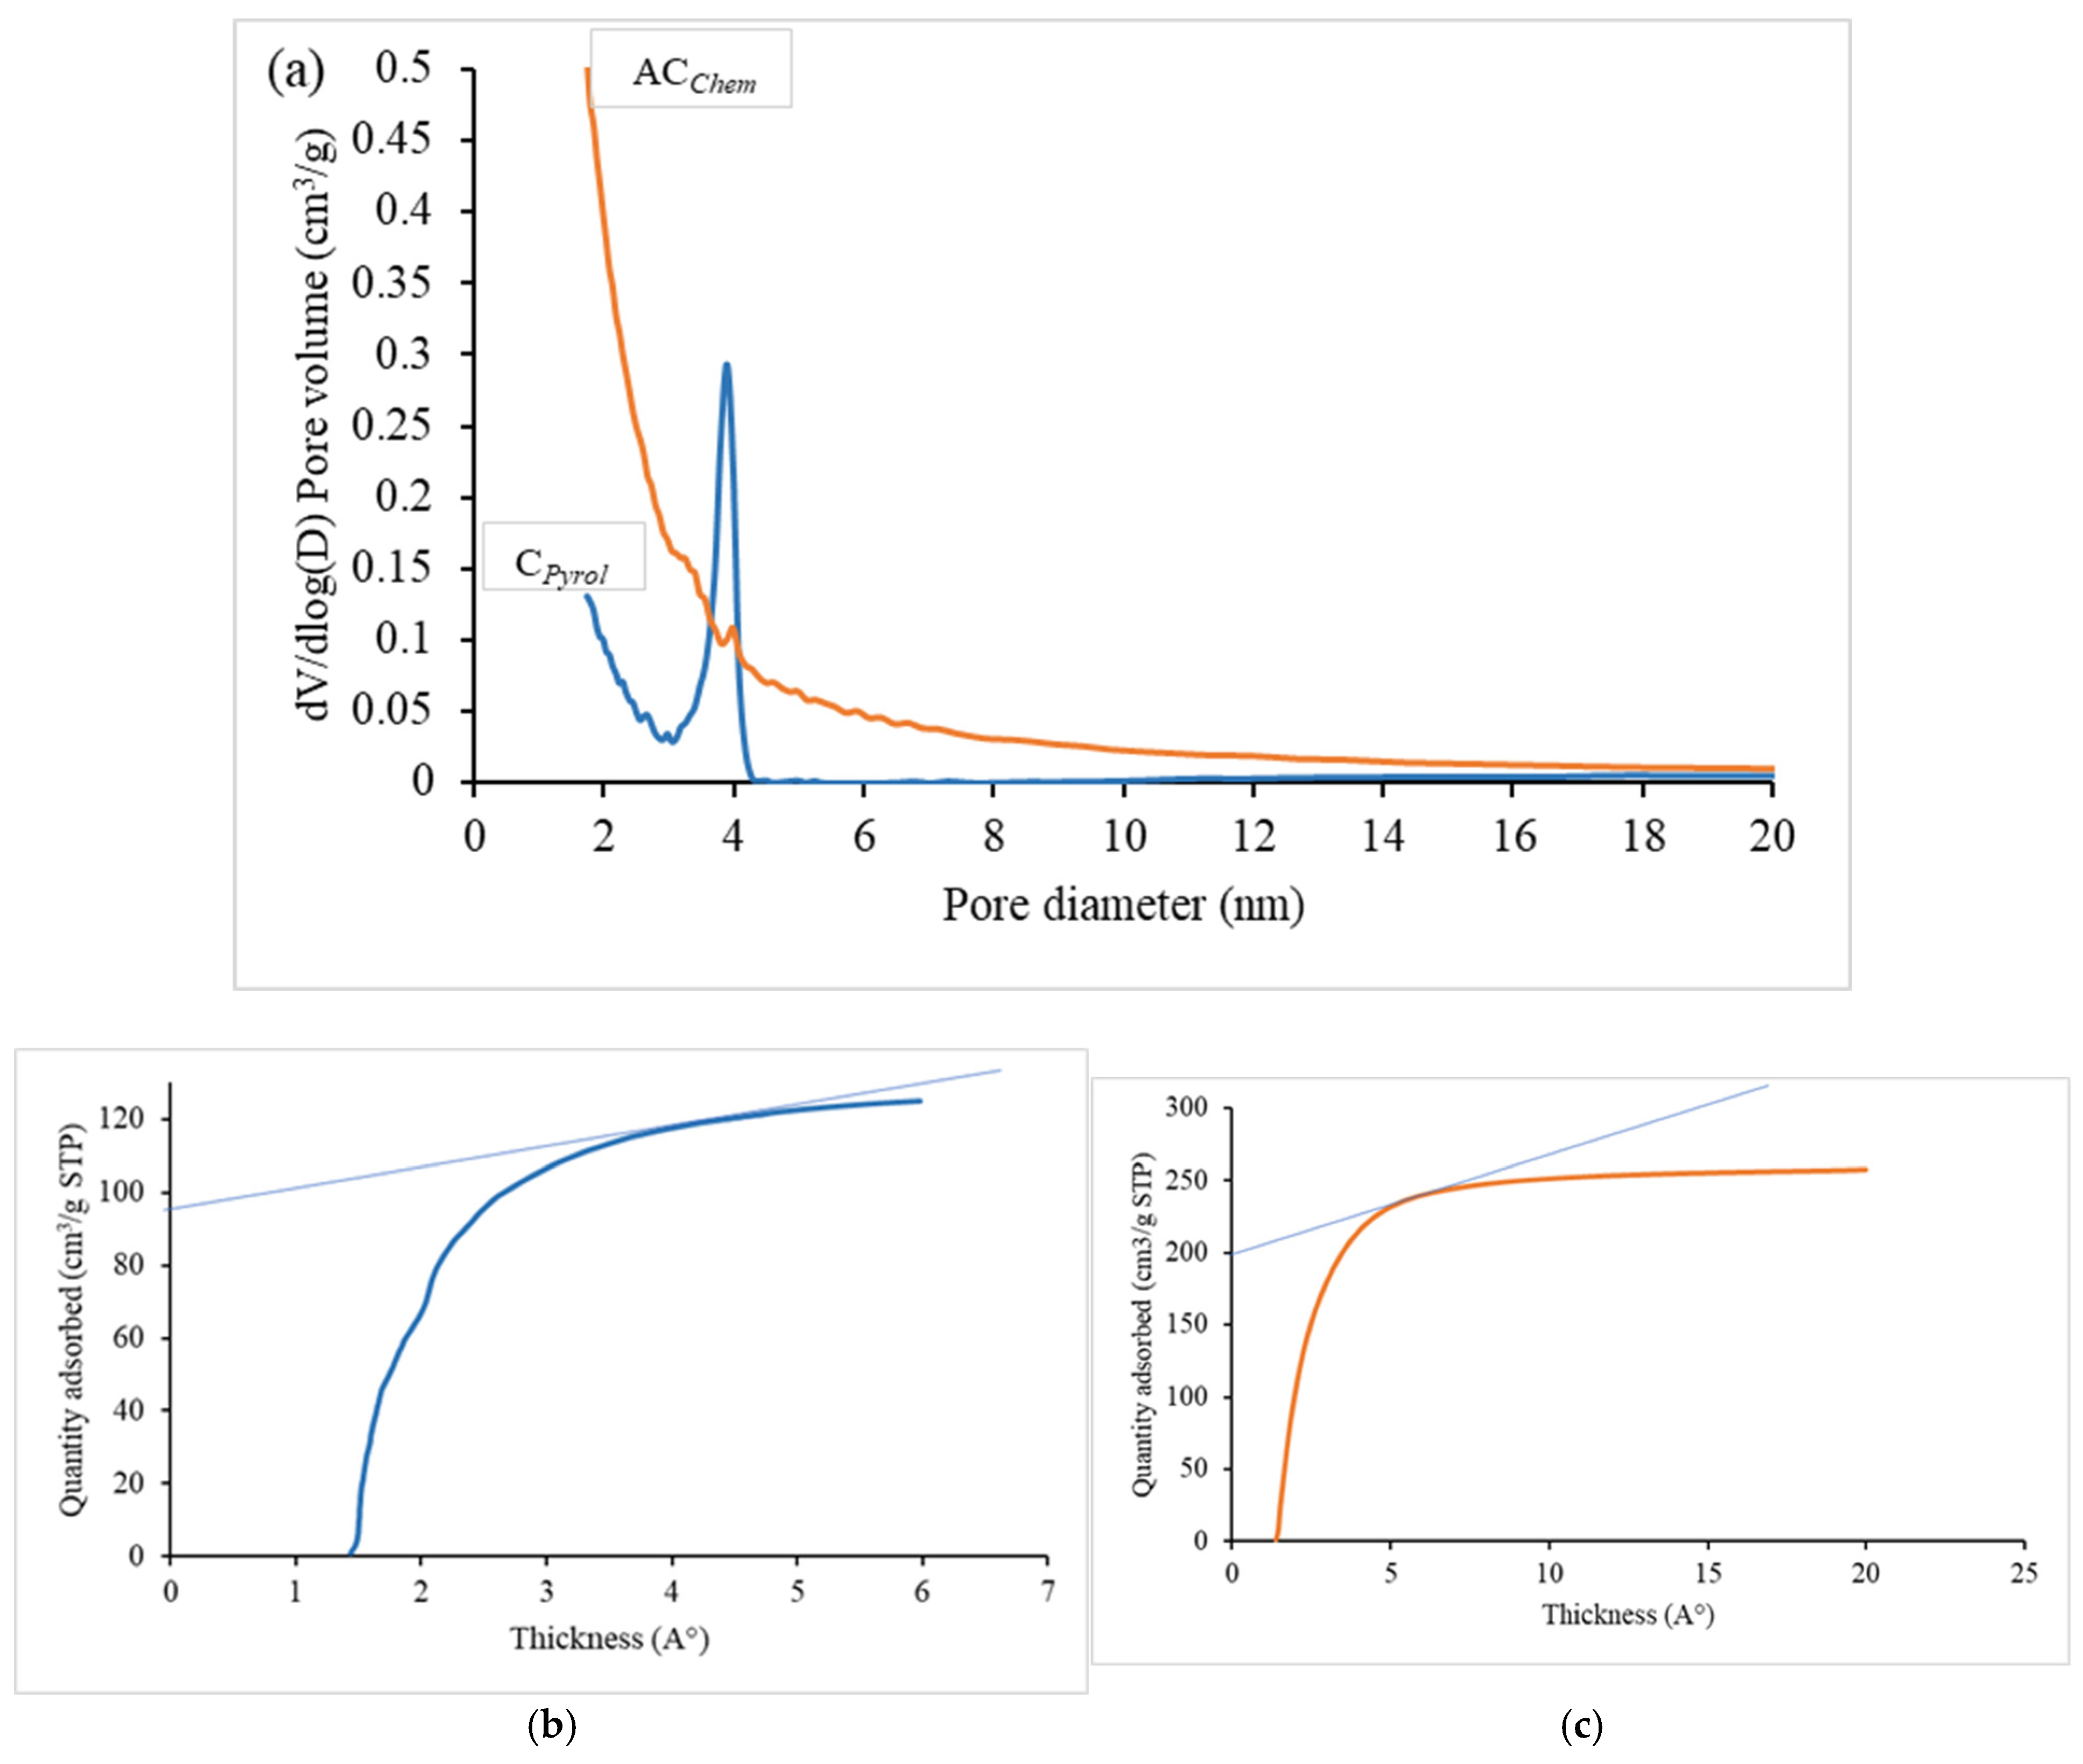
- Pore size distribution by the BJH method
- -
- Improving SSA;
- -
- Decreasing spacing between electrode surface and ions.
- -
- Pore size distribution by the (HJ) t-plot
- -
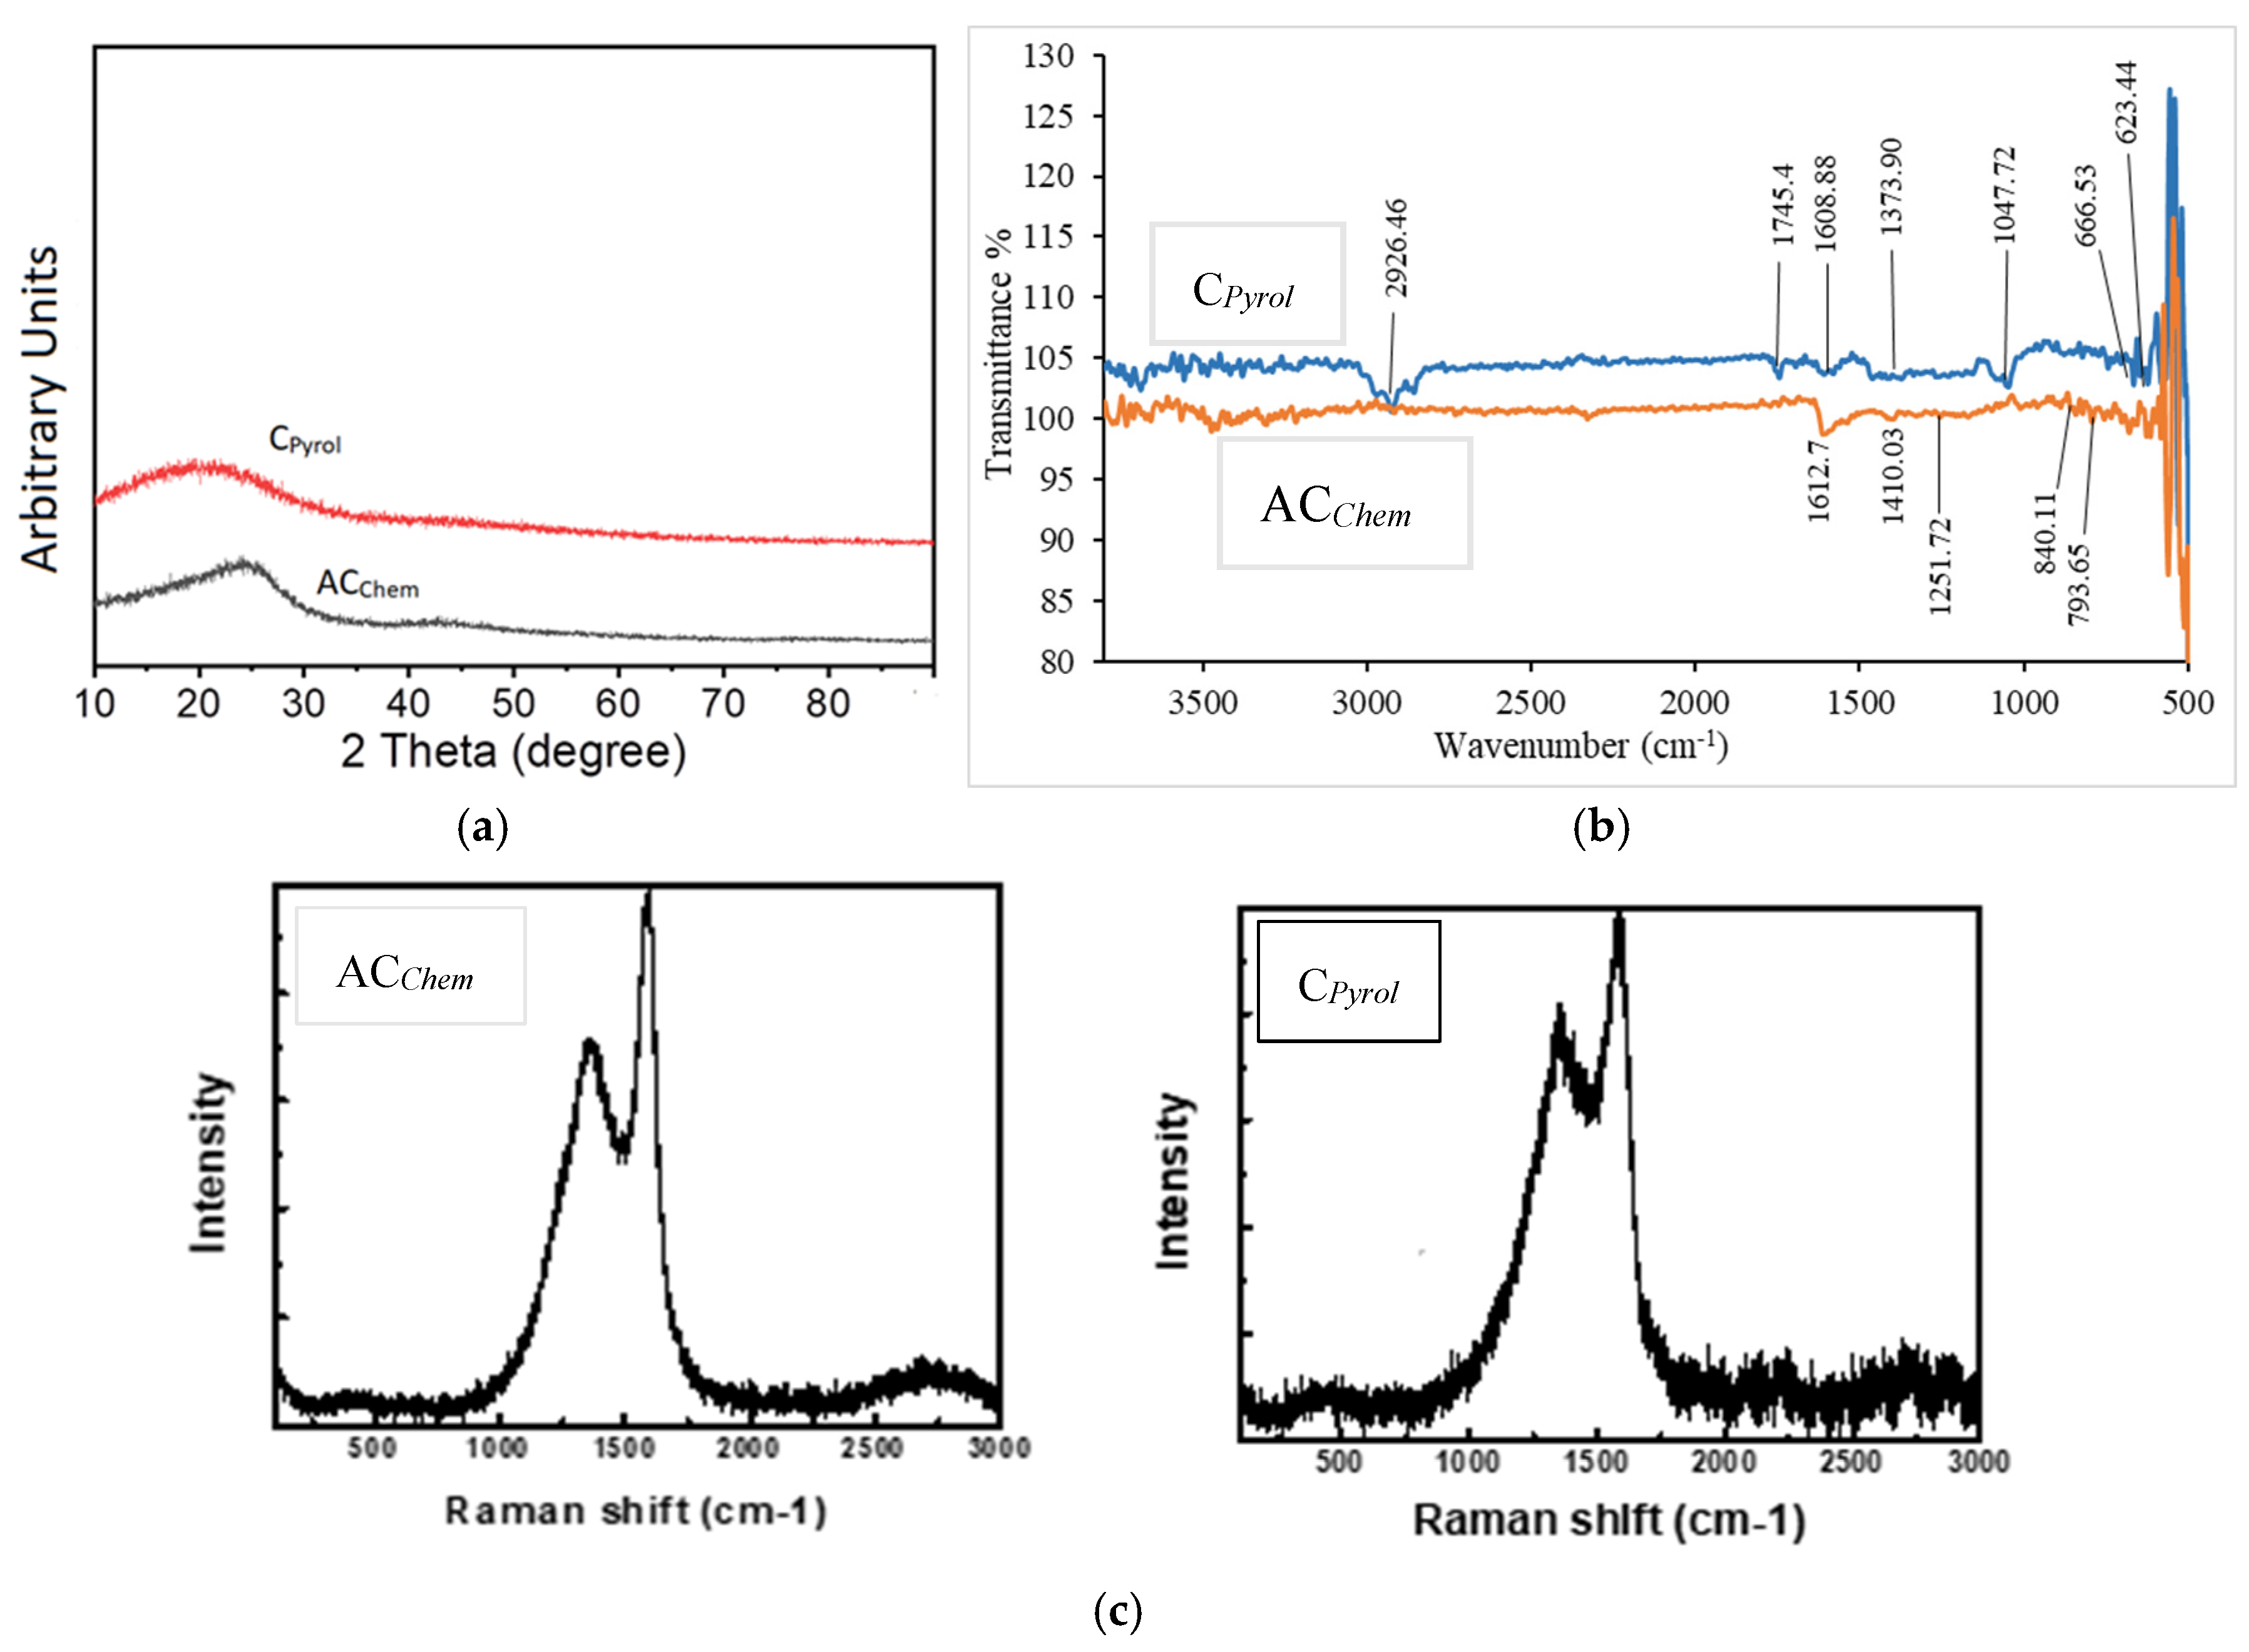
- X-ray patterns
- -
- Elemental analysis
- -
- FT-IR spectra:
- -
- Raman spectra
3.2. Supercapacitor Testing
- -
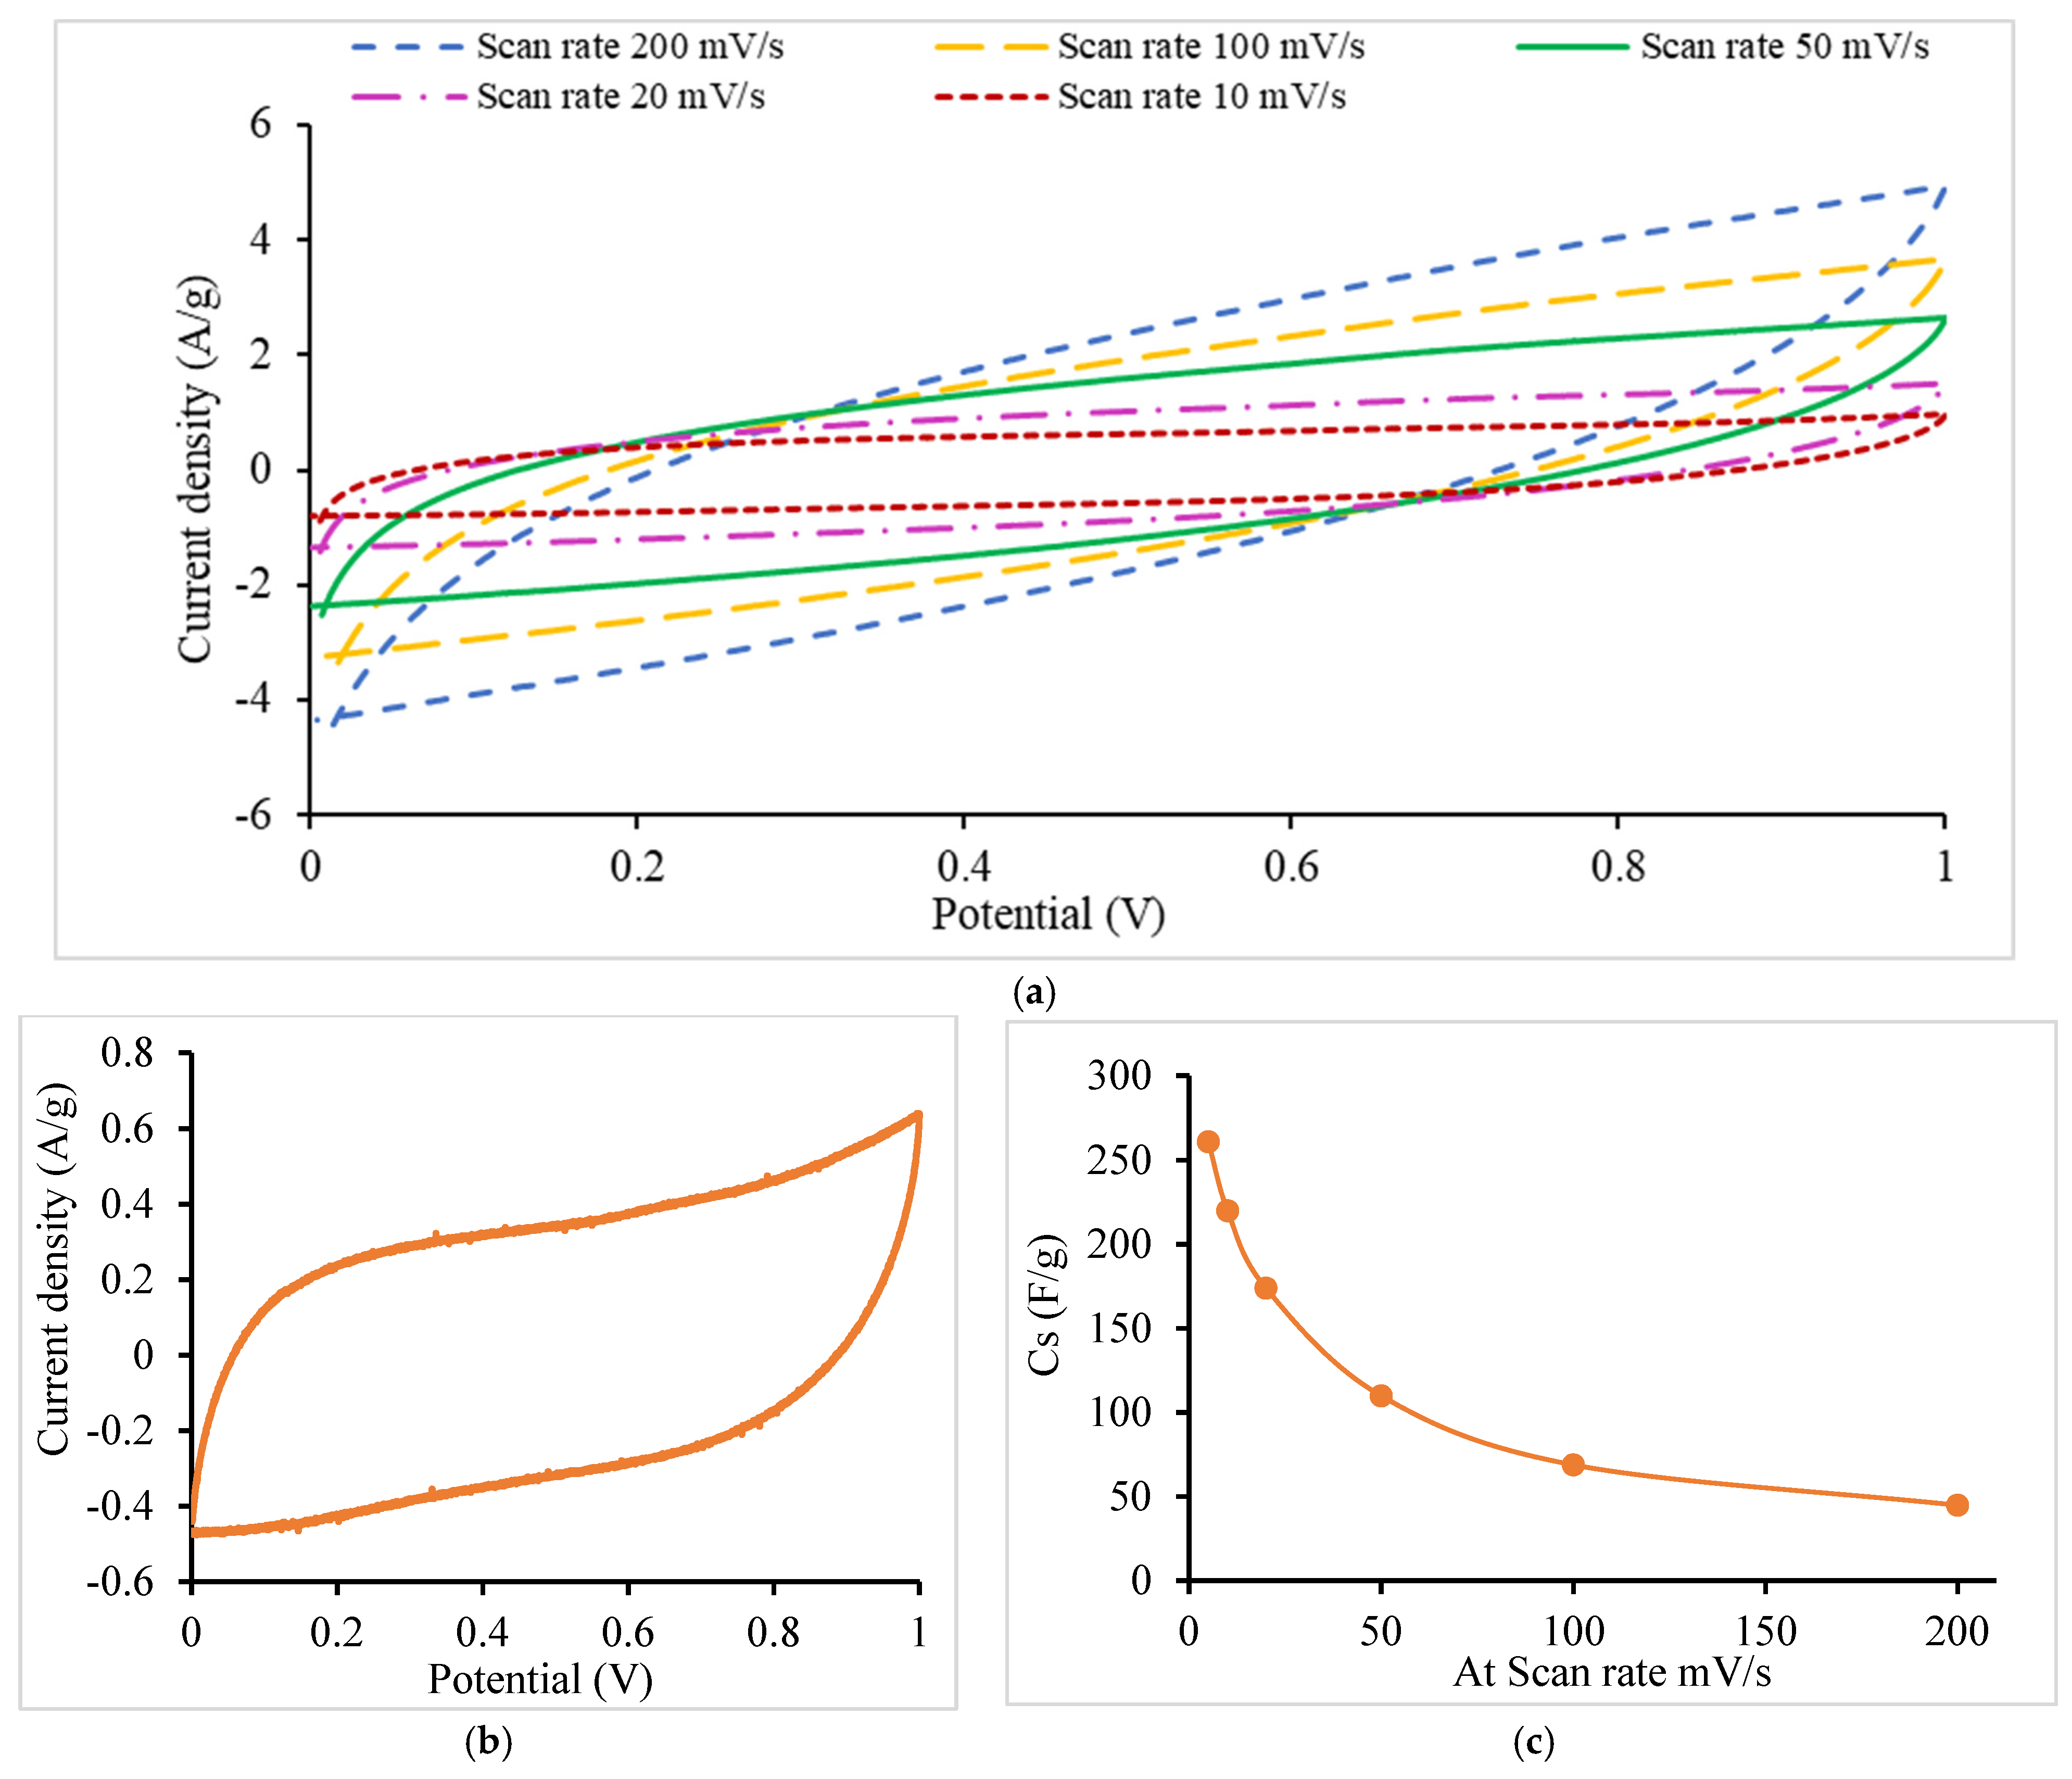
- CV

| Scan Rate Setting (mV/s) | This Work Cs Values (F/g) | Literature Cs Values (F/g) |
|---|---|---|
| 1 | -- | 150 [65] 250 [39] |
| 5 | 261 | 109 [32] 195 [39] |
| 10 | 220 | 101 [32] |
| 20 | 174 | 130 [65] 90 [32] |
| 50 | 110 | 100 [65] |
| 100 | 69 | 47 [32] |
| 200 | 45 | -- |
- -
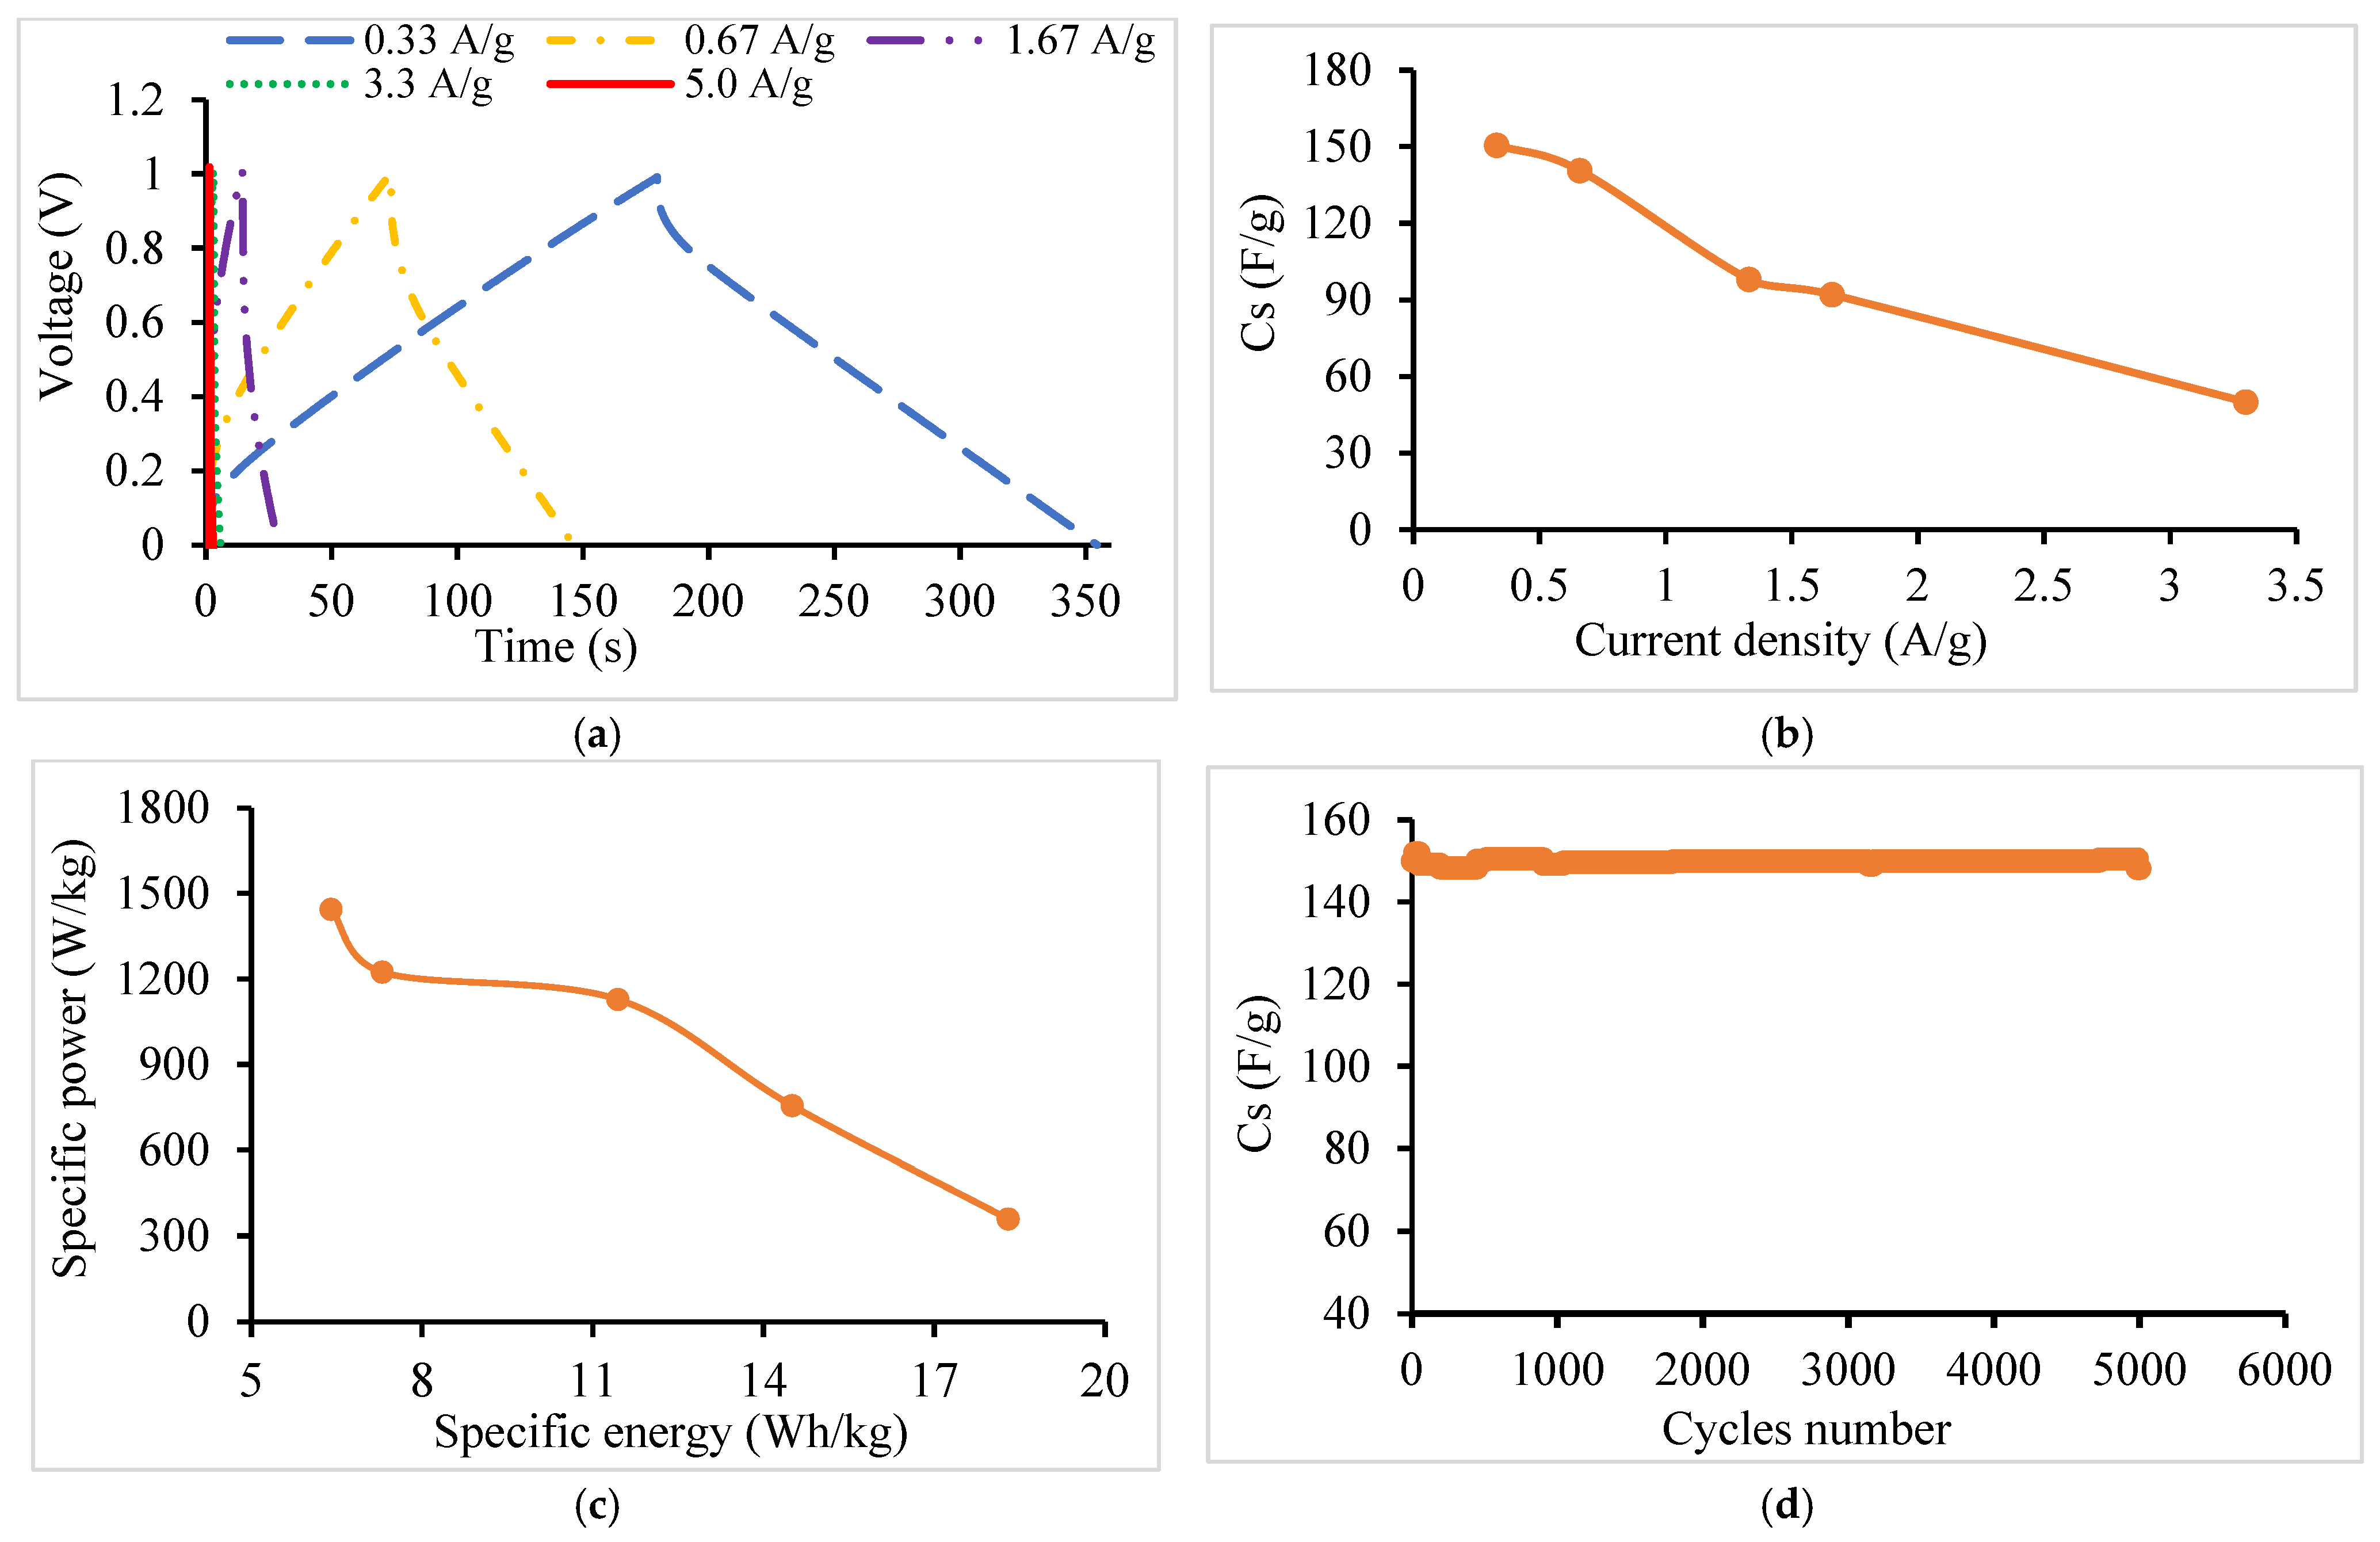
- GCD
- -
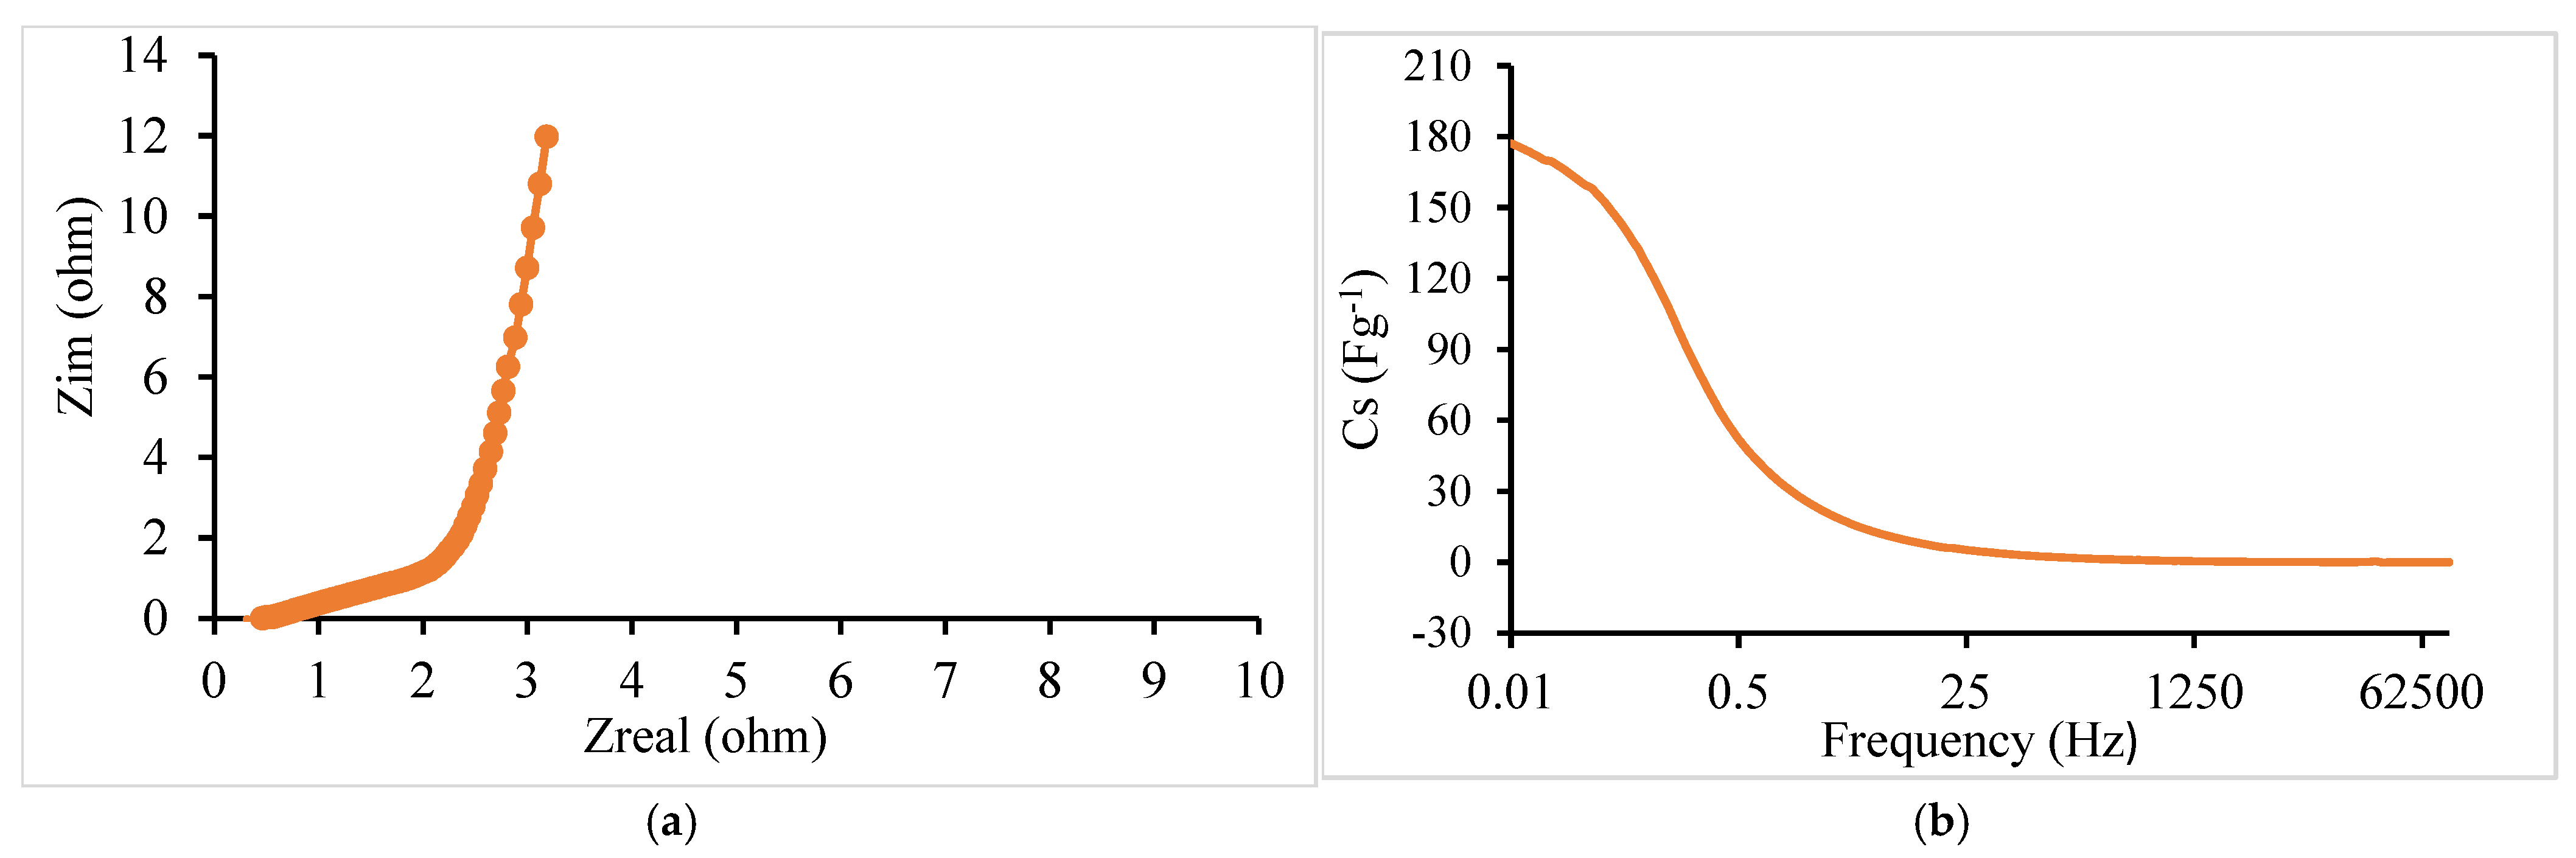
- EIS
4. Conclusions
Supplementary Materials
Author Contributions
Funding
Data Availability Statement
Acknowledgments
Conflicts of Interest
References
- Huang, H.; Wang, X. Graphene nanoplate-MnO2 composites for supercapacitors: A controllable oxidation approach. Nanoscale 2011, 3, 3185–3191. [Google Scholar] [CrossRef] [PubMed]
- Cheng, Q.; Tang, J.; Ma, J.; Zhang, H.; Shinya, N.; Qin, L.-C. Graphene and nanostructured MnO2 composite electrodes for supercapacitors. Carbon 2011, 49, 2917–2925. [Google Scholar] [CrossRef]
- Yang, H. Graphene-Based Supercapacitor for Energy Storage Applications. Master’s Thesis, The Ohio State University, Columbus, OH, USA, 2013. [Google Scholar]
- Singh, A.; Roberts, A.J.; Slade, R.C.T.; Chandra, A. High electrochemical performance in asymmetric supercapasitors using MWCNT/nickel sulfide composite and graphene nanoplates as electrodes. J. Mater. Chem. A 2014, 2, 16723–16730. [Google Scholar] [CrossRef]
- Libich, J.; Máca, J.; Vondrák, J.; Čech, O.; Sedlaříková, M. Supercapacitors: Properties and applications. J. Energy Storage 2018, 17, 224–227. [Google Scholar] [CrossRef]
- Vangari, M.; Pryor, T.; Jiang, L. Supercapacitors: Review of materials and fabrication methods. J. Energy Eng. 2013, 139, 72–79. [Google Scholar] [CrossRef]
- Lufrano, F.; Staiti, P. Mesoporous carbon materials as electrodes for electrochemical supercapacitors. Int. J. Electrochem. Sci. 2010, 5, 903–916. [Google Scholar] [CrossRef]
- Lu, M. Graphene-Based Materials for Supercapacitor Electrodes. Ph.D. Theses, National University of Singapore, Singapore, 2013.
- Kötz, R.; Carlen, M. Principles and applications of electrochemical capacitors. Electrochim. Acta 2000, 45, 2483–2498. [Google Scholar] [CrossRef]
- Guo, Q.; Zhou, X.; Li, X.; Chen, S.; Seema, A.; Greiner, A.; Hou, H. Supercapacitors based on hybrid carbon nanofibers containing multiwalled carbon nanotubes. J. Mater. Chem. 2009, 19, 2810–2816. [Google Scholar] [CrossRef]
- Stoller, M.D.; Ruoff, R.S. Best practice methods for determining an electrode material’s performance for Ultracapacitors. J. Energy Environ. Sci. 2010, 3, 1294–1301. [Google Scholar] [CrossRef]
- Basri, N.H.; Dolah, B.N.M.; Farma, R.; Deraman, M.; Awitdrus Talib, I.A.; Omar, R.; Manjunatha, J.G.; Ishak, M.M. Physical and electrochemical properties of supercapacitor electrodes derived from carbon nanotube and biomass carbon. Int. J. Electrochem. Sci. 2013, 8, 257–273. [Google Scholar]
- Li, W.; Peng, J.; Zhang, L.; Yang, K.; Xia, H.; Zhang, S.; Guo, S.-H. Preparation of activated carbon from coconut shell chars in pilot-scale microwave heating equipment at 60 kW. Waste Manag. 2009, 29, 756–760. [Google Scholar] [CrossRef]
- Arrebola, J.; Caballero, A.; Hernán, L.; Morales, J.; Olivares-Marín, M.; Gómez-Serrano, V. Improving the performance of biomass-derived carbons in Li-ion batteries by controlling the lithium insertion process. J. Electrochem. Soc. 2010, 157, A791. [Google Scholar] [CrossRef]
- Kalyani, P.; Anitha, A.; Darchen, A. Obtaining Activated Carbon from Papaya Seeds for Energy Storage Devices. Int. J. Eng. Sci. Res. Technol. 2015, 4, 110–122. [Google Scholar]
- Li, W.; Zhang, L.-B.; Peng, J.-H.; Li, N.; Zhu, X.-Y. Preparation of High Surface Area Activated Carbons from Tobacco Stems with K2CO3 Activation Using Microwave Radiation. Ind. Crops Prod. 2008, 27, 341–347. [Google Scholar] [CrossRef]
- Hesas, R.H.; Daud, W.M.A.W.; Sahu, J.; Arami-Niya, A. The Effects of A Microwave Heating Method on The Production of Activated Carbon from Agricultural Waste: A Review. J. Anal. Appl. Pyrolysis 2021, 100, 1–11. [Google Scholar] [CrossRef]
- Yang, K.; Peng, J.; Srinivasakannan, C.; Zhang, L.; Xia, H.; Duan, X. Preparation of High Surface Area Activated Carbon from Coconut Shells Using Microwave Heating. Bioresour. Technol. 2010, 101, 6163–6169. [Google Scholar] [CrossRef]
- Hwang, J.Y.; Li, M.; El-Kady, M.F.; Kaner, R.B. Next-generation activated carbon supercapacitors: A simple step in electrode processing leads to remarkable gains in energy density. Adv. Funct. Mater. 2017, 27, 1605745. [Google Scholar] [CrossRef]
- Jiang, L.; Yan, J.; Hao, L.; Xue, R.; Sun, G.; Yi, B. High rate performance activated carbons prepared from ginkgo shells for electrochemical supercapacitors. Carbon 2013, 56, 146–154. [Google Scholar] [CrossRef]
- Hong, P.; Liu, X.; Zhang, X.; Peng, S.; Zou, T.; Wang, Z.; Yang, Y.; Zhao, R.; Chen, Y.; Wang, Y. Potassium sulphate (K2SO4) activation of chestnut shell to oxygen-enriched porous carbons with enhanced capacitive properties. Int. J. Energy Res. 2020, 44, 5385–5396. [Google Scholar] [CrossRef]
- Cheng, L.; Guo, P.; Wang, R.; Ming, L.; Leng, F.; Li, H.; Zhao, X. Electrocapacitive properties of supercapacitors based on hierarchical porous carbons from chestnut shell. Colloids Surf. A Physicochem. Eng. Asp. 2014, 446, 127–133. [Google Scholar] [CrossRef]
- Wan, L.; Li, X.; Li, N.; Xie, M.; Du, C.; Zhang, Y.; Chen, J. Multi-heteroatom-doped hierarchical porous carbon derived from chestnut shell with superior performance in supercapacitors. J. Alloys Compd. 2019, 790, 760–771. [Google Scholar] [CrossRef]
- Czerwinska, N.; Giosuè, C.; Matos, I.; Sabbatini, S.; Ruello, M.L.; Bernardo, M. Development of activated carbons derived from wastes: Coffee grounds and olive stones as potential porous materials for air depollution. Sci. Total Environ. 2024, 914, 169898. [Google Scholar] [CrossRef] [PubMed]
- Pagett, M.; Teng, K.S.; Sullivan, G.; Zhang, W. Reusing waste coffee grounds as electrode materials: Recent advances and future opportunities. Glob. Chall. 2023, 7, 2200093. [Google Scholar] [CrossRef] [PubMed]
- Aouay, F.; Attia, A.; Dammak, L.; Ben Amar, R.; Deratani, A. Activated carbon prepared from waste coffee grounds: Characterization and adsorption properties of dyes. Materials 2024, 17, 3078. [Google Scholar] [CrossRef]
- AlMarzooqi, A.; Almazrouei, H.; Alhammadi, H. Drugs Removal from Wastewater with Activated Carbon from Coffee Waste. Int. J. Biomed. Res. Pract. 2024, 4, 1–5. [Google Scholar]
- Kim, C.-H.; Lee, S.-Y.; Park, S.-J. Valorization of waste coffee grounds into microporous carbon materials for CO2 adsorption. Green Chem. 2024, 26, 1901–1909. [Google Scholar] [CrossRef]
- Pandey, K.; Jeong, H.K. Coffee waste-derived porous carbon based flexible supercapacitors. Chem. Phys. Lett. 2022, 809, 140173. [Google Scholar] [CrossRef]
- Chiu, Y.-H.; Lin, L.-Y. Effect of activating agents for producing activated carbon using a facile one-step synthesis with waste coffee grounds for symmetric supercapacitors. J. Taiwan Inst. Chem. Eng. 2019, 101, 177–185. [Google Scholar] [CrossRef]
- Biegun, M.; Dymerska, A.; Chen, X.; Mijowska, E. Study of the active carbon from used coffee grounds as the active material for a high-temperature stable supercapacitor with ionic-liquid electrolyte. Materials 2020, 13, 3919. [Google Scholar] [CrossRef]
- Khadka, O.; Lawaju, U.; Koju, S.; Rai, R.C.; Nakarmi, M.L.; Joshi, P. Activated carbon derived from coffee waste as supercapacitor electrode material. Sci. World 2024, 17, 19–26. [Google Scholar] [CrossRef]
- Davidraj, J.M.; Sathish, C.I.; Benzigar, M.R.; Li, Z.; Zhang, X.; Bahadur, R.; Ramadass, K.; Singh, G.; Yi, J.; Kumar, P. Recent advances in food waste-derived nanoporous carbon for energy storage. Sci. Technol. Adv. Mater. 2024, 25, 2357062. [Google Scholar] [CrossRef] [PubMed]
- Rufford, T.E.; Hulicova-Jurcakova, D.; Zhu, Z.; Lu, G.Q. Nanoporous carbon electrode from waste coffee beans for high performance supercapacitors. Electrochem. Commun. 2008, 10, 1594–1597. [Google Scholar] [CrossRef]
- Borghei, S.A.; Zare, M.H.; Ahmadi, M.; Sadeghi, M.H.; Marjani, A.; Shirazian, S.; Ghadiri, M. Synthesis of multi-application activated carbon from oak seeds by KOH activation for methylene blue adsorption and electrochemical supercapacitor electrode. Arab. J. Chem. 2021, 14, 102958. [Google Scholar] [CrossRef]
- Said, B.; Bacha, O.; Rahmani, Y.; Harfouche, N.; Kheniche, H.; Zerrouki, D.; Belkhalfa, H.; Henni, A. Activated carbon prepared by hydrothermal pretreatment-assisted chemical activation of date seeds for supercapacitor application. Inorg. Chem. Commun. 2023, 155, 111012. [Google Scholar] [CrossRef]
- Zyoud, A.; Nassar, H.N.; El-Hamouz, A.; Hilal, H.S. Solid olive waste in environmental cleanup: Enhanced nitrite ion removal by ZnCl2-activated carbon. J. Environ. Manag. 2015, 152, 27–35. [Google Scholar] [CrossRef]
- Rufford, T.E.; Hulicova-Jurcakova, D.; Fiset, E.; Zhu, Z.; Lu, G.Q. Double-layer capacitance of waste coffee ground activated carbons in an organic electrolyte. Electrochem. Commun. 2009, 11, 974–977. [Google Scholar] [CrossRef]
- Farma, R.; Julita, R.I.; Apriyani, I.; Awitdrus, A.; Taer, E. ZnCl2-assisted synthesis of coffee bean bagasse-based activated carbon as a stable material for high-performance supercapacitors. Mater. Today Proc. 2023, 87, 25–31. [Google Scholar] [CrossRef]
- Williams, P.T.; Reed, A.R. Development of activated carbon pore structure via physical and chemical activation of biomass fibre waste. Biomass Bioenergy 2006, 30, 144–152. [Google Scholar] [CrossRef]
- Le Van, K.; Luong Thi Thu, T. Preparation of Pore-Size Controllable Activated Carbon from Rice Husk Using Dual Activating Agent and Its Application in Supercapacitor. J. Chem. 2019, 2019, 4329609. [Google Scholar] [CrossRef]
- Ruiz, S.; Tamayo, J.A.; Delgado Ospina, J.; Navia Porras, D.P.; Valencia Zapata, M.E.; Mina Hernandez, J.H.; Valencia, C.H.; Zuluaga, F.; Grande Tovar, C.D. Antimicrobial films based on nanocomposites of chitosan/poly(vinyl alcohol)/graphene oxide for biomedical applications. Biomolecules 2019, 9, 109. [Google Scholar] [CrossRef]
- Lowell, S.; Shields, J.E.; Thomas, M.A.; Thommes, M. Characterization of Porous Solids and Powders: Surface Area, Pore Size and Density; Springer Science & Business Media: New York, NY, USA, 2012; Volume 16. [Google Scholar]
- Puziy, A.; Poddubnaya, O.; Martınez-Alonso, A.; Suárez-Garcıa, F.; Tascón, J. Synthetic carbons activated with phosphoric acid: I. Surface chemistry and ion binding properties. Carbon 2002, 40, 1493–1505. [Google Scholar] [CrossRef]
- Islam, M.S.; Ang, B.C.; Gharehkhani, S.; Afifi, A.B.M. Adsorption capability of activated carbon synthesized from coconut shell. Carbon Lett. 2016, 20, 1–9. [Google Scholar] [CrossRef]
- Gao, Y.; Shi, W.; Wang, W.; Wang, Y.; Zhao, Y.; Lei, Z.; Miao, R. Ultrasonic-assisted production of graphene with high yield in supercritical CO2 and its high electrical conductivity film. Ind. Eng. Chem. Res. 2014, 53, 2839–2845. [Google Scholar] [CrossRef]
- Anastacio-López, Z.S.; Gonzalez-Calderon, J.; Saldivar-Guerrero, R.; Velasco-Santos, C.; Martínez-Hernández, A.L.; Fierro-González, J.C.; Almendárez-Camarillo, A. Modification of graphene oxide to induce beta crystals in isotactic polypropylene. J. Mater. Sci. 2019, 54, 427–443. [Google Scholar] [CrossRef]
- Abbas, M.; Kaddour, S.; Trari, M. Kinetic and equilibrium studies of cobalt adsorption on apricot stone activated carbon. J. Ind. Eng. Chem. 2014, 20, 745–751. [Google Scholar] [CrossRef]
- Liu, Y.; Liu, X.; Dong, W.; Zhang, L.; Kong, Q.; Wang, W. Efficient adsorption of sulfamethazine onto modified activated carbon: A plausible adsorption mechanism. Sci. Rep. 2017, 7, 12437. [Google Scholar] [CrossRef]
- Gupta, G.K.; Sagar, P.; Pandey, S.K.; Srivastava, M.; Singh, A.; Singh, J.; Srivastava, A.; Srivastava, S.; Srivastava, A. In situ fabrication of activated carbon from a bio-waste desmostachya bipinnata for the improved supercapacitor performance. Nanoscale Res. Lett. 2021, 16, 85. [Google Scholar] [CrossRef]
- Gupta, A.; Dhakate, S.R.; Pal, P.; Dey, A.; Iyer, P.K.; Singh, D.K. Effect of graphitization temperature on structure and electrical conductivity of poly-acrylonitrile based carbon fibers. Diam. Relat. Mater. 2017, 78, 31–38. [Google Scholar] [CrossRef]
- Hernández-Montoya, V.; García-Servin, J.; Bueno-López, J.I. Thermal treatments and activation procedures used in the preparation of activated carbons. In Lignocellulosic Precursors Used in the Synthesis of Activated Carbon-Characterization Techniques and Applications in the Wastewater Treatment; Intech: Rijeka, Croatia, 2012; pp. 19–36. [Google Scholar]
- Bergna, D.; Varila, T.; Romar, H.; Lassi, U. Comparison of the properties of activated carbons produced in one-stage and two-stage processes. C 2018, 4, 41. [Google Scholar] [CrossRef]
- Mohamedkhair, A.K.; Aziz, M.A.; Shah, S.S.; Shaikh, M.N.; Jamil, A.K.; Qasem, M.A.A.; Buliyaminu, I.A.; Yamani, Z.H. Effect of an activating agent on the physicochemical properties and supercapacitor performance of naturally nitrogen-enriched carbon derived from Albizia procera leaves. Arab. J. Chem. 2020, 13, 6161–6173. [Google Scholar] [CrossRef]
- Daraghmeh, A.; Hussain, S.; Servera, L.; Xuriguera, E.; Blanes, M.; Ramos, F.; Cornet, A.; Cirera, A. Flexible supercapacitors based on low-cost tape casting of high dense carbon nanofibers. Mater. Res. Express 2017, 4, 025007. [Google Scholar] [CrossRef]
- Kim, S.Y.; Noh, Y.J.; Yu, J. Thermal conductivity of graphene nanoplatelets filled composites fabricated by solvent-free processing for the excellent filler dispersion and a theoretical approach for the composites containing the geometrized fillers. Compos. Part A Appl. Sci. Manuf. 2015, 69, 219–225. [Google Scholar] [CrossRef]
- Jarrar, S.; Hussain, S.; Haq, A.U.; Bhattacharya, G.; Saadeddin, I.; Servera, L.; Ruiz, J.; Janem, A.; Daraghmeh, A. Binder-free all-carbon composite supercapacitors. Nanotechnology 2024, 35, 305708. [Google Scholar] [CrossRef] [PubMed]
- Prabaharan, S.; Vimala, R.; Zainal, Z. Nanostructured mesoporous carbon as electrodes for supercapacitors. J. Power Sources 2006, 161, 730–736. [Google Scholar] [CrossRef]
- Saha, D.; Li, Y.; Bi, Z.; Chen, J.; Keum, J.K.; Hensley, D.K.; Grappe, H.A.; Meyer III, H.M.; Dai, S.; Paranthaman, M.P. Studies on supercapacitor electrode material from activated lignin-derived mesoporous carbon. Langmuir 2014, 30, 900–910. [Google Scholar] [CrossRef]
- Frackowiak, E.; Beguin, F. Carbon materials for the electrochemical storage of energy in capacitors. Carbon 2001, 39, 937–950. [Google Scholar] [CrossRef]
- Lim, C.-S.; Teoh, K.; Liew, C.-W.; Ramesh, S. Electric double layer capacitor based on activated carbon electrode and biodegradable composite polymer electrolyte. Ionics 2014, 20, 251–258. [Google Scholar] [CrossRef]
- Meher, S.K.; Justin, P.; Ranga Rao, G. Microwave-mediated synthesis for improved morphology and pseudocapacitance performance of nickel oxide. ACS Appl. Mater. Interfaces 2011, 3, 2063–2073. [Google Scholar] [CrossRef] [PubMed]
- Graydon, J.W.; Panjehshahi, M.; Kirk, D.W. Charge redistribution and ionic mobility in the micropores of supercapacitors. J. Power Sources 2014, 245, 822–829. [Google Scholar] [CrossRef]
- Jayawickramage, R.A.P.; Ferraris, J.P. High performance supercapacitors using lignin based electrospun carbon nanofiber electrodes in ionic liquid electrolytes. Nanotechnology 2019, 30, 155402. [Google Scholar] [CrossRef]
- Choi, J.; Zequine, C.; Bhoyate, S.; Lin, W.; Li, X.; Kahol, P.; Gupta, R. Waste coffee management: Deriving high-performance supercapacitors using nitrogen-doped coffee-derived carbon. C 2019, 5, 44. [Google Scholar] [CrossRef]
- Jarrar, S. Carbon Nanofibers/Graphene Nanoplateletes Composite as Supercapacitor Electrode Using KOH Aqueous Electrolyte. Master’s Thesis, An-Najah National University, Nablus, Palestine, 2020. [Google Scholar]
- Daraghmeh, A.; Hussain, S.; Servera, L.; Xuriguera, E.; Cornet, A.; Cirera, A. Impact of binder concentration and pressure on performance of symmetric CNFs based supercapacitors. Electrochim. Acta 2017, 245, 531–538. [Google Scholar] [CrossRef]
- Zhou, Y.; Jin, P.; Zhou, Y.; Zhu, Y. High-performance symmetric supercapacitors based on carbon nanotube/graphite nanofiber nanocomposites. Sci. Rep. 2018, 8, 9005. [Google Scholar] [CrossRef] [PubMed]
- Ganesh, V.; Pitchumani, S.; Lakshminarayanan, V. New symmetric and asymmetric supercapacitors based on high surface area porous nickel and activated carbon. J. Power Sources 2006, 158, 1523–1532. [Google Scholar] [CrossRef]
- Gong, Y.; Li, D.; Fu, Q.; Pan, C. Influence of graphene microstructures on electrochemical performance for supercapacitors. Prog. Nat. Sci. Mater. Int. 2015, 25, 379–385. [Google Scholar] [CrossRef]
- Schütter, C.; Ramirez-Castro, C.; Oljaca, M.; Passerini, S.; Winter, M.; Balducci, A. Activated carbon, carbon blacks and graphene based nanoplatelets as active materials for electrochemical double layer capacitors: A comparative study. J. Electrochem. Soc. 2014, 162, A44. [Google Scholar] [CrossRef]
- Calvo, E.; Lufrano, F.; Staiti, P.; Brigandì, A.; Arenillas, A.; Menéndez, J. Optimizing the electrochemical performance of aqueous symmetric supercapacitors based on an activated carbon xerogel. J. Power Sources 2013, 241, 776–782. [Google Scholar] [CrossRef]
| Waste Source | Spec. Capac. (F/g) | Spec. Energy W h/kg | Spec. Power (W/kg) | ESR (Ω) | Ref. |
|---|---|---|---|---|---|
| CW | 139 (0.5 A/g) | 12.5 | 202 | ~50 | [29] |
| CW (with ionic liquid) | 178 (at 50 A/g) | 84 | 202 | 0.20 | [31] |
| CW KOH | 105-21 | 6.9 | 350 | -- | [30] |
| CW | 113 (1 A/g) | -- | -- | -- | [32] |
| CW | <160 | [25] | |||
| Chestnut | 265 (0.1 A) | -- | -- | -- | [21] |
| Chestnut | ~403 | 26 | 454.5 | -- | [23] |
| Ginkgo | 365 (scan rate 2 mV/s) | -- | -- | 0.2 | [20] |
| Oak seeds | 551 (1 A/g) | 18.5 | 14,900 | 1 | [35] |
| Date waste | 179 (scan rate 5 mV/s) | -- | -- | 10 | [36] |
| BET-Based Data | ||||||||
|---|---|---|---|---|---|---|---|---|
| Material | SBET (m2/g) | Vtb (cm3/g) | V0.5–2c mic (cm3/g) t-plot | V2–5e (cm3/g) BJH Meso | V > 50 (cm3/g) | Smic (m2/g) | Smeso (m2/g) | APS (nm) |
| CPyrol | 458 | 0.2114 | 0.153 | 0.23 | 0.0084 | 385 | 73 | 1.8–3.3 |
| ACChem | 830 | 0.41 | 0.19 | 0.072 | 0.148 | 755 | 75 | 1.0–4.0 |
| a | Element | C | N | O | S | Cl | Fe |
| Atom% | 93.3 | 2.3 | 3.9 | 0.1 | 0.2 | 1 × 10⁻² | |
| Mass% | 96.6 | 0.3 | 0.1 | 0.2 | 2 × 10⁻² | ||
| b | Element | C | N | O | S | Cl | Fe |
| Atom% | 63.2 | 1.9 | 23.7 | 0.04 | 1.1 | 0.04 | |
| Mass% | 83.3 | 4.0 | 0.1 | 1.5 | 0.1 |
| Discharge Current (A/g) | 0.33 | 0.66 | 1.66 | 3.3 | 5.0 |
| VIR (V) | 0.064 | 0.134 | 0.297 | 0.660 | 0.760 |
| ESR (Ω) | 3.20 | 3.35 | 3.00 | 3.30 | 2.53 |
| Cs (F/g) | 150 | 141 | 92 | 50 | 39 |
Disclaimer/Publisher’s Note: The statements, opinions and data contained in all publications are solely those of the individual author(s) and contributor(s) and not of MDPI and/or the editor(s). MDPI and/or the editor(s) disclaim responsibility for any injury to people or property resulting from any ideas, methods, instructions or products referred to in the content. |
© 2024 by the authors. Licensee MDPI, Basel, Switzerland. This article is an open access article distributed under the terms and conditions of the Creative Commons Attribution (CC BY) license (https://creativecommons.org/licenses/by/4.0/).
Share and Cite
Mukhiemer, S.; Daraghmah, A.; Nassar, H.; Hussain, S.; Lim, H.; Han, H.; Kim, T.W.; Amireh, A.N.; Hilal, H.S. Coffee-Waste-Based ZnCl2 Activated Carbon in High-Performance Supercapacitor Electrodes: Impact of Graphitization, Surface Morphology, Porosity and Conductivity. Processes 2024, 12, 2832. https://doi.org/10.3390/pr12122832
Mukhiemer S, Daraghmah A, Nassar H, Hussain S, Lim H, Han H, Kim TW, Amireh AN, Hilal HS. Coffee-Waste-Based ZnCl2 Activated Carbon in High-Performance Supercapacitor Electrodes: Impact of Graphitization, Surface Morphology, Porosity and Conductivity. Processes. 2024; 12(12):2832. https://doi.org/10.3390/pr12122832
Chicago/Turabian StyleMukhiemer, Sami, Allan Daraghmah, Heba Nassar, Shahzad Hussain, Hanyi Lim, Hyobin Han, Tae Woo Kim, Ameed N. Amireh, and Hikmat S. Hilal. 2024. "Coffee-Waste-Based ZnCl2 Activated Carbon in High-Performance Supercapacitor Electrodes: Impact of Graphitization, Surface Morphology, Porosity and Conductivity" Processes 12, no. 12: 2832. https://doi.org/10.3390/pr12122832
APA StyleMukhiemer, S., Daraghmah, A., Nassar, H., Hussain, S., Lim, H., Han, H., Kim, T. W., Amireh, A. N., & Hilal, H. S. (2024). Coffee-Waste-Based ZnCl2 Activated Carbon in High-Performance Supercapacitor Electrodes: Impact of Graphitization, Surface Morphology, Porosity and Conductivity. Processes, 12(12), 2832. https://doi.org/10.3390/pr12122832