Article

Numerical Optimization of Burner Deflection Angle at Half Load for a 660 MW Tangentially Fired Boiler

1
Laboratory of Energy Carbon Neutrality, School of Electrical Engineering, Xinjiang University, Urumqi 830047, China
2
Ruoqiang Energy Industry Research Institute, Engineering Research Center of Northwest Energy Carbon Neutrality, Ministry of Education, Urumgi 830047 and Ruoqiang 841800, China
3
School of Intelligent Science and Technology (School of Future Technology), Xinjiang University, Urumqi 830047, China
*
Author to whom correspondence should be addressed.
Processes 2024, 12(12), 2823; https://doi.org/10.3390/pr12122823
Submission received: 21 November 2024 / Revised: 5 December 2024 / Accepted: 6 December 2024 / Published: 9 December 2024
(This article belongs to the Section Energy Systems)

Abstract

China established a coal power capacity payment mechanism to allow coal power to play a fundamental supporting and regulating role. It is difficult to generate peak power for long periods. The effects of variation in over-fire air ratio and burner deflection angle were investigated to optimize combustion conditions at half load. This simulation is based on field data from a new 660 MW tangentially fired boiler. The results indicate that when the over-fire air ratio increased from 17.6% to 27.6%, the NOx concentration decreased by about 45.1% in the burnout zone. The concentration decreased from 284 mg/m3 to 156 mg/m3. However, a large eddy formed in the top zone affected the flow field. The heat transfer at the horizontal flue was affected. The flow field structure can be optimized by moderately adjusting the deflection angle (−5°) of the burner. A further increase in the deflection angles (−10° and −15°) reduced NOx by about 10%. It affected the adequate combustion of pulverized coal and the flow field at the top zone. Considering the overall combustion conditions, it is recommended that the burner be offset downward at a small angle.

1. Introduction

1.1. Motivation

The efficacious utilization of fossil fuels can speed up industrial development and safeguard people’s daily lives [1]. Fossil fuels made up 81.5% of primary energy in 2023. In the global electricity generation, fossil fuels still occupy the dominant position, accounting for about 60%. Coal remains the dominant fuel for power generation, accounting for 35.2% of the market share. In China, its share will expand to about 60.8% [2].
Currently, China is actively and steadily promoting carbon neutrality. The energy structure will be transformed in the direction of clean and low-carbon fuels [3]. Coal power substitution is a very important step towards carbon neutrality [4]. It means that the position of new energy generation in the power system will be gradually improved. However, wind power, photovoltaic, and other new energy generation are limited by region and time. There are intermittent and volatile problems in new energy power generation [5]. Compared with new energy generation, coal-fired power generation is more controllable, with loads easier to adjust. To guarantee the steady functioning of the power system, coal power will be transformed to the direction of emergency peak-shaving and reserve energy [6]. Clean coal combustion and efficient power generation need to be urgently promoted.

1.2. Literature Review

Coal-fired power generation has been developing for many years. There are still many problems in actual operation. The problems of specific coal combustion [7,8,9], blended combustion [10,11,12,13,14], slagging [15,16,17,18,19], and pollutant emissions [20,21,22,23,24] have been the focus of numerous studies. Wang et al. [25] explored the effect of air staging technology on NOx emissions from the combustion of lean coal in a one-dimensional furnace experimental platform. It was found that lower excess air coefficients in the primary combustion zone and multi-staged air were both favorable for reducing NOx. Szufa et al. [26] researched the combustion of biomass blended with coal at different ratios on a 230 MW industrial boiler. The blending of corn stover biomass and coal was found to improve ignition performance and reduce combustion intensity without affecting combustion stability. Yuan et al. [27] explored the slagging trend in the pre-combustion chamber of the boiler. The effect of excess air coefficients in the range of 0.3 to 1.1 was investigated. The results recommend that maintaining the excess air coefficient at 0.5 to 0.9 is favorable for stable operation. Bian et al. [28] detailed a low-NOx retrofit program for a 600 MW tangentially fired boiler. Through numerical simulation, the NOx emissions were compared before and after the retrofit. The results showed that the NOx emissions were significantly reduced by about 40%.
China gives full play to supporting and regulating the value of coal power by establishing a coal capacity payment mechanism. It means marking up the power generated by coal power generation at low loads. This stabilizes the coal power industry’s expectations. The approach also improves the motivation of the coal power industry to study low-load operations. Researchers have studied the problems of boilers at low and variable loads. Zima et al. [29] established a mathematical model of a boiler under fast variable loads. The accuracy of the model was tested in a power plant. A tiny number of errors exists between the measured values and the outcomes produced by the model. In particular, the model can be applied to other boilers. Taler et al. [30] analyzed the heating rates of different components in the studied boiler. The boiler drum was found to have the largest wall thickness compared to other boiler components. It had the longest heating time and determined the start-up time. Zhu et al. [31] researched the combustion characteristics of coal using preheated combustion technology at 25% and 35% loads on a 1 MW testing platform. In the low-load scenario, pulverized coal was found to facilitate ignition and maintain combustion stability after preheating. In addition, the test platform achieved a maximum load variation of 3.75%/min. The combustion stability and NOx emissions at the lowest 30% load of a 300 MW boiler were investigated by Ma et al. [32]. It was found that operating the upper burner at an extremely low load was more conducive to combustion stability. The effect of the air classification technology on NOx reduction was weakened. Du et al. [33] achieved stable combustion at low boiler loads by arranging the oil secondary air in parallel with the coal-rich fuel/airflow. The method was used to conduct comprehensive industrial tests on a 600 MW down-fired boiler. The boiler could maintain stable operation at a minimum of 33% load. The thermal efficiency of the boiler was maintained above 90% at different loads. Jin et al. [34] studied combustion and high-temperature corrosion phenomena in a double-tangential circular boiler with different primary air ratios under an extremely low load operation. The combustion stability of the furnace was affected by either high or low primary airflow ratios under low-load operation. At higher primary airflow ratios, the high-temperature corrosion at the furnace wall was not significant enough. At the same time, more NOx was produced as the percentage of the primary airflow increased.

1.3. Main Focuses of This Study

In conclusion, researchers have used different approaches to explore the operation of boilers at low loads. In the future, for the achievement of higher efficiency and lower pollutant emissions, coal-fired boilers with supercritical and ultra-supercritical power generation technologies have gradually become mainstream [35]. Currently, relatively little research has been conducted on large-scale tangentially fired boilers. A new 660 MW pulverized coal boiler with ultra-supercritical technology was studied in this paper. Boilers using the technology make the medium (water) reach ultra-supercritical pressures and temperatures. The high-quality water vapor is used by steam turbines to produce electricity. Compared to previous technologies, the technology can achieve ultra-low emissions of pollutants while reducing coal consumption for power supply. The boiler increased the distance between the two group burners to ensure adequate combustion at high loads. It has an impact on the combustion when the load is low. During the day, coal-fired power plants cooperate with new energy generation. The boiler load was usually maintained near half load. When the actual boiler was at half-load without assisted combustion, the intermediate four-layer burners were usually operated. It is important to investigate more clearly the combustion characteristics of this boiler at half load and reduce NOx emissions. The selection of working conditions in this study is based on actual operation. In this paper, based on the original over-fired air ratio (22.6%), the air rate is reduced to 17.6% to maintain combustion stability at half load. Meanwhile, to further reduce NOx emissions, the air ratio is increased to 27.6%. The combustion characteristics are explored for three different over-fired air ratios, 17.6%, 22.6%, and 27.6%. On this basis, the effects of different burner deflection angles (0°, −5°, −10°, and −15°) on the combustion were investigated. The expectation is to achieve clean and efficient combustion.

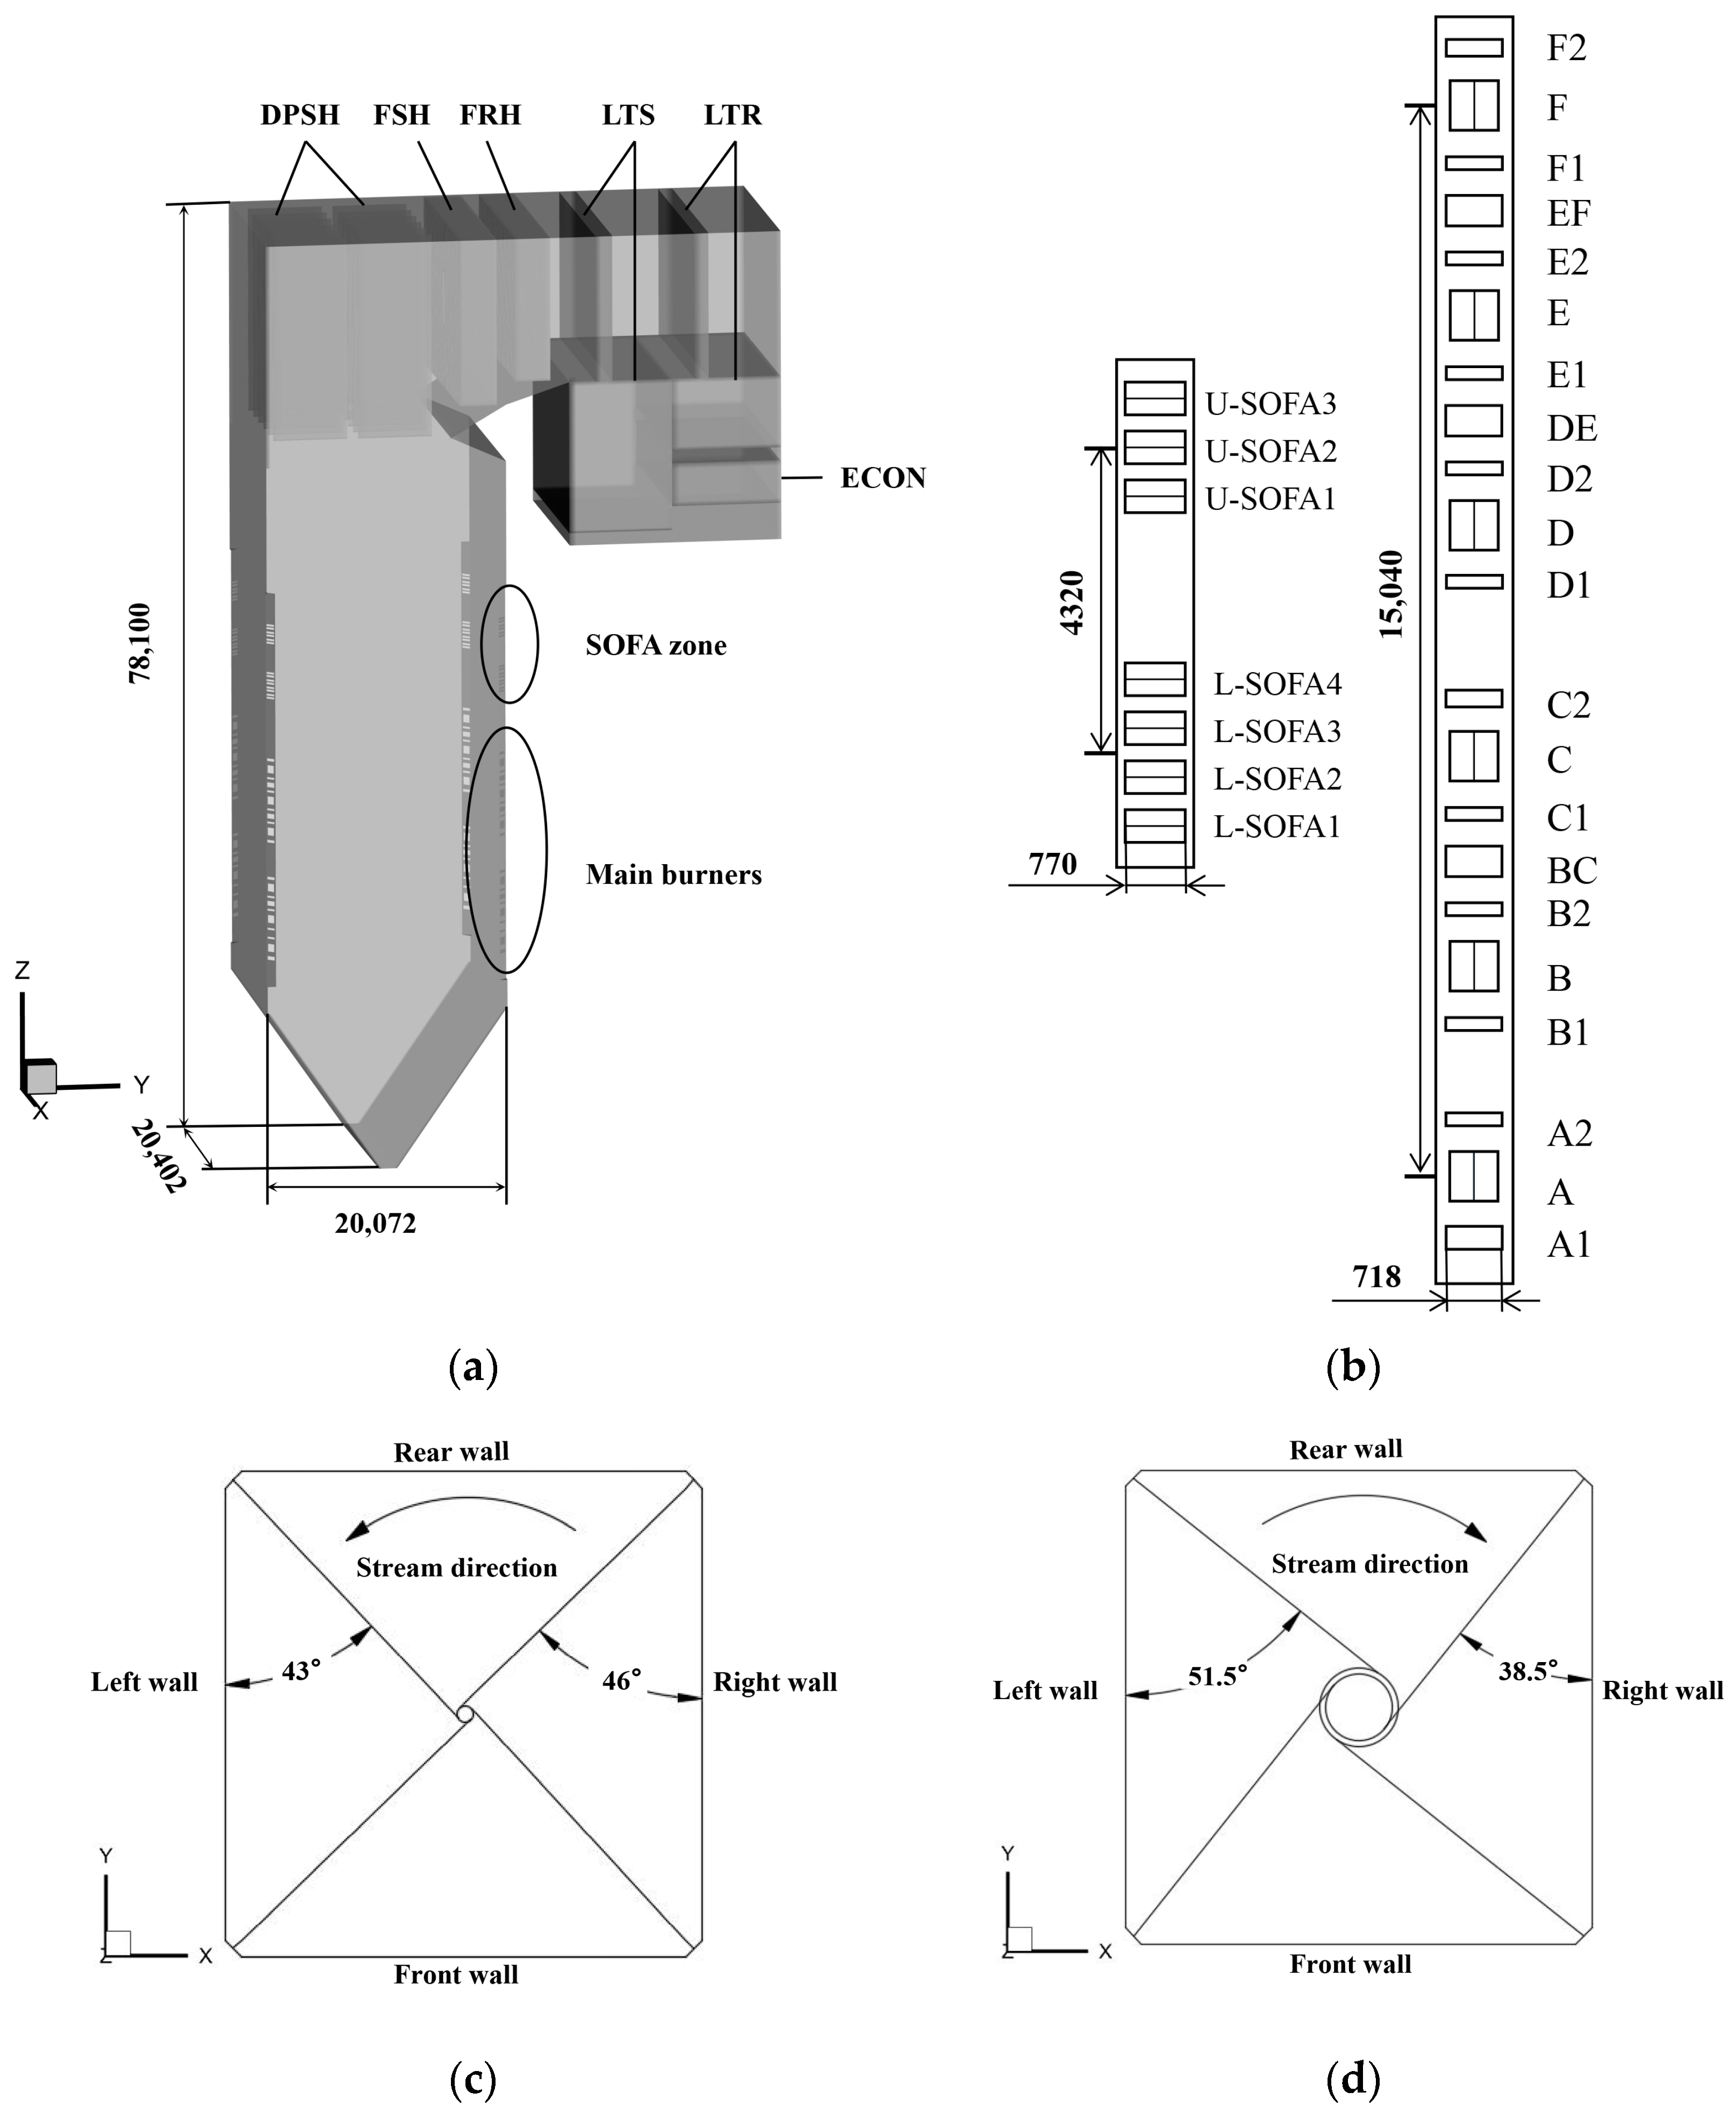
2. Boiler Specifications

The boiler geometry and layout of burners are shown in Figure 1. The overall height of the boiler model is 78,100 mm. The width and depth of the boiler are 20,402 mm and 20,072 mm, respectively. To closely match the operating boiler, the boiler was modeled from the hopper to the tail flue. Division panel superheaters (DPSH), final superheaters (FSH), and final reheaters (FRH) were simplified to plate structure. Among them, the DPSH has six rows and two columns, totaling 12 plates. The FSH and FRH were arranged on 36 and 91 plates along the width direction of the furnace, respectively. The remaining low-temperature superheaters (LTS), low-temperature reheaters (LTR), and economizers (ECON) were modeled as porous media.
The main burners on the furnace side were designed with 6 layers of primary air nozzles from A to F and 15 layers of secondary air nozzles. Above the main burners, there are two groups of separated over-fire air (SOFA) burners with a distance of 4320 mm between them, totaling 7 layers of SOFA nozzles. Figure 1c,d show the angle of airflow incidence for the main burners and the SOFA burners.
Analyses of coal properties are shown in Table 1. The boiler is designed to burn bituminous coal. The boiler currently burns two types of coal. Coal types 1 and 2 are Eastern Junggar coal and medium ash coal, respectively. The Eastern Junggar coal contains too many alkali metals. It sticks easily when burned alone at full load. Blending with other coals is needed. Table 2 shows the main parameters at full and half loads. The blending ratio indicates the percentage of Eastern Junggar coal in the total coal consumption. Meanwhile, Table 3 shows the thermal data when the boiler is in operation.

3. Numerical Calculation Details

3.1. Simulation Calculation Models

It is a complex process to burn pulverized coal in a large boiler. There are many physical and chemical processes involved. In this paper, turbulent flow, pulverized coal particles motion, coal devolatilization, volatiles combustion, char combustion, radiation heat transfer, and NO generation are described by different mathematical models. The specific mathematical models are shown in Table 4. Figure 2 shows the formation mechanism of fuel NO. In the model used in this study, fuel NO is derived from volatile matter and char. The volatile-N is converted into intermediate products (HCN and NH3). The intermediate products react with O2 and NO to form NO and N2. Char-N is oxidized directly to NO. Some of the NO will react with char and be reduced to N2. The reference [36] contains a thorough explanation of the formulas.

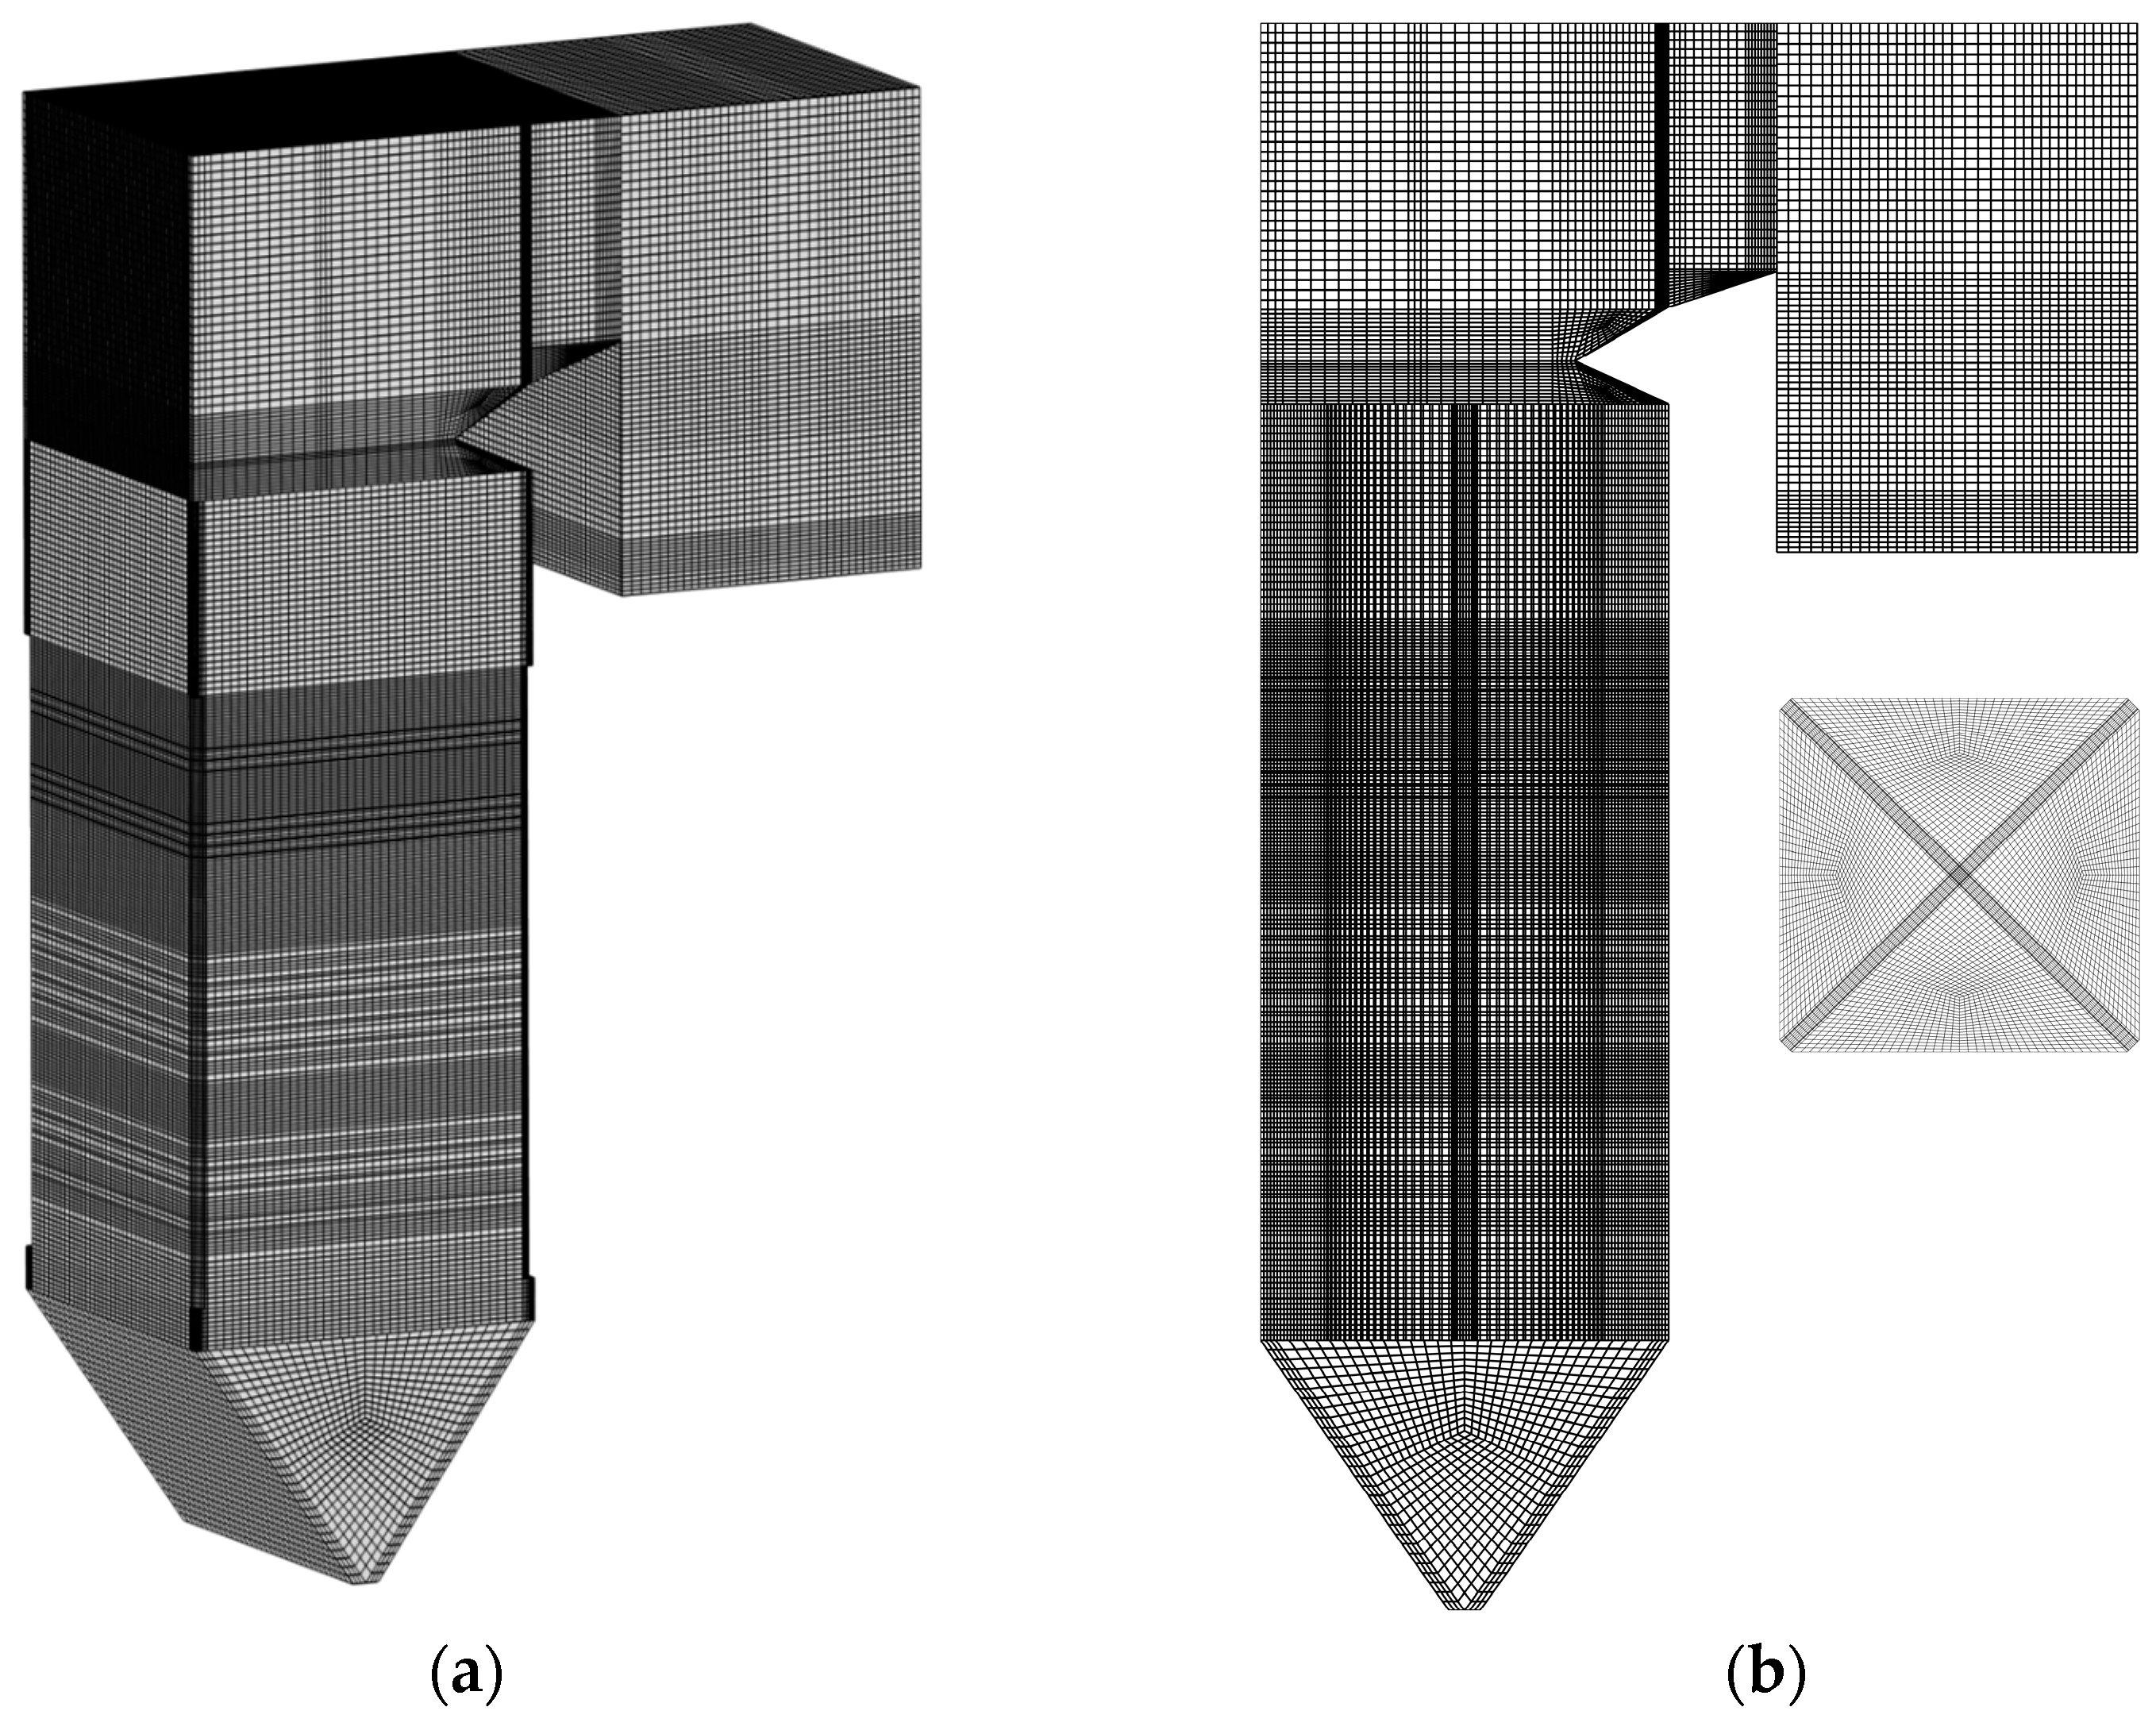
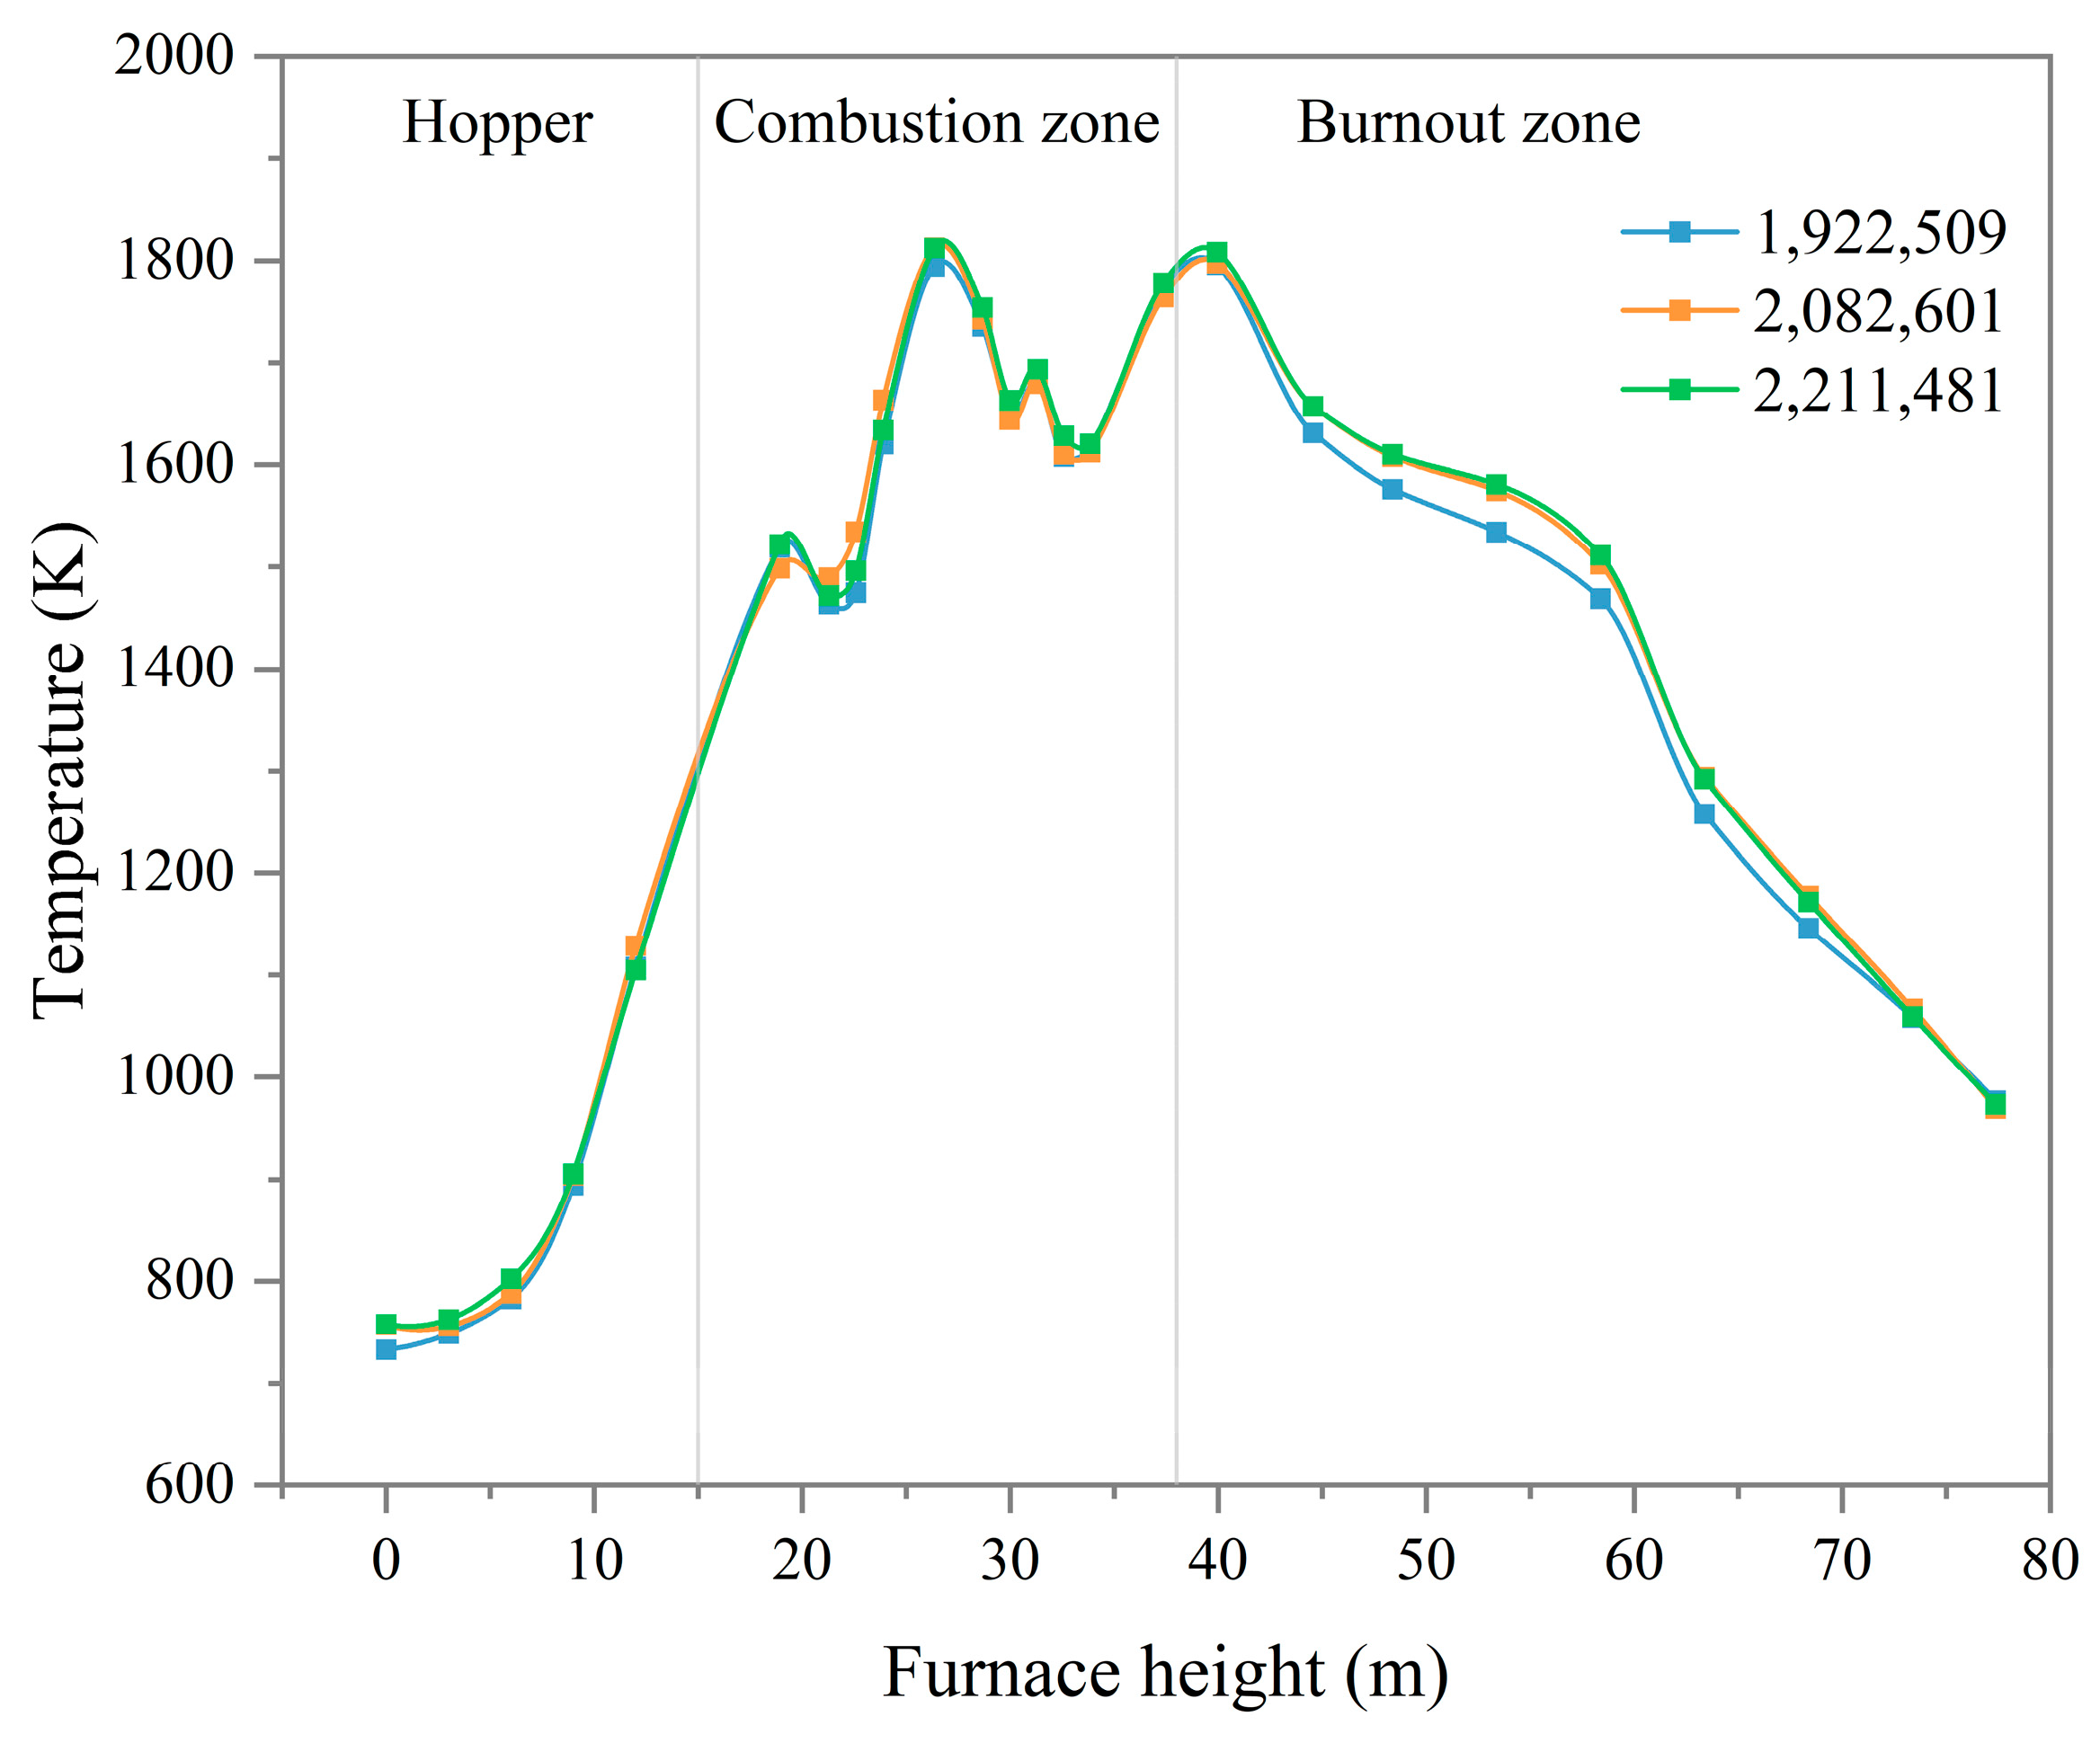
3.2. Computational Mesh System

Figure 3 shows the meshed model domain of the boiler. The structured grid has preferable accuracy. The computational mesh system uses a structured grid.
Three grids (1,922,509, 2,082,601, 2,211,481) were selected for mesh-independent validation at full boiler load. Figure 4 shows the temperature variations in the furnace for the three grids. When the number of grids is 1,922,509, the calculated temperature variation is slightly lower overall compared to the other grids. After considering the calculation accuracy and time, 2,082,601 grids were finally selected for numerical computation. Meanwhile, taking into account the precision of the simulation results, comparisons were made with the measurement and designed data of the boiler. Table 5 shows the results of the comparison. As an advanced new boiler, the temperature is high and the NOx concentration is low under full load. The simulation results do not differ much from the measured data, and the relative error is less than 5%.

3.3. Case Setting and Description of Calculation Conditions

The furnace’s combustion conditions were explored at different SOFA ratios and burner deflection angles at half load. Six cases were calculated using ANSYS Fluent 2021 commercial software, as presented in Table 6. More information can be found in Table 2.
The air and pulverized coal inlets were both set as mass flow inlets. The boiler outlet adopts the pressure outlet. According to the actual operating data of the boiler, the coal flow, airflow, and air temperature are configured (see Table 2). At half load, only four layers of SOFA nozzles (L-SOFA1, 2, 3, and 4) were turned on. The walls of the boiler are considered no-slip stationary walls. The hopper wall temperatures were set at 650 K. The remaining walls were set at a temperature of 700 K. The wall temperatures at the DPSH, FSH, and FRH were set to 843 K, 873 K, and 873 K, respectively. The Rosin–Rammler distribution was used to determine the particle size. Ten groups of particle sizes were chosen for the calculation. The diameter of the particles ranged from 10 to 250 μm, and the average value was 65 μm. The spread parameter was 1.5.
For solving discrete equations, the SIMPLE algorithm was used. The tentative results of convergence were calculated for each discrete equation using the first-order upwind scheme. Based on this, the accuracy of the results increased using the second-order upwind scheme.

4. Results and Discussion

4.1. Effect of Different SOFA Ratios on Combustion

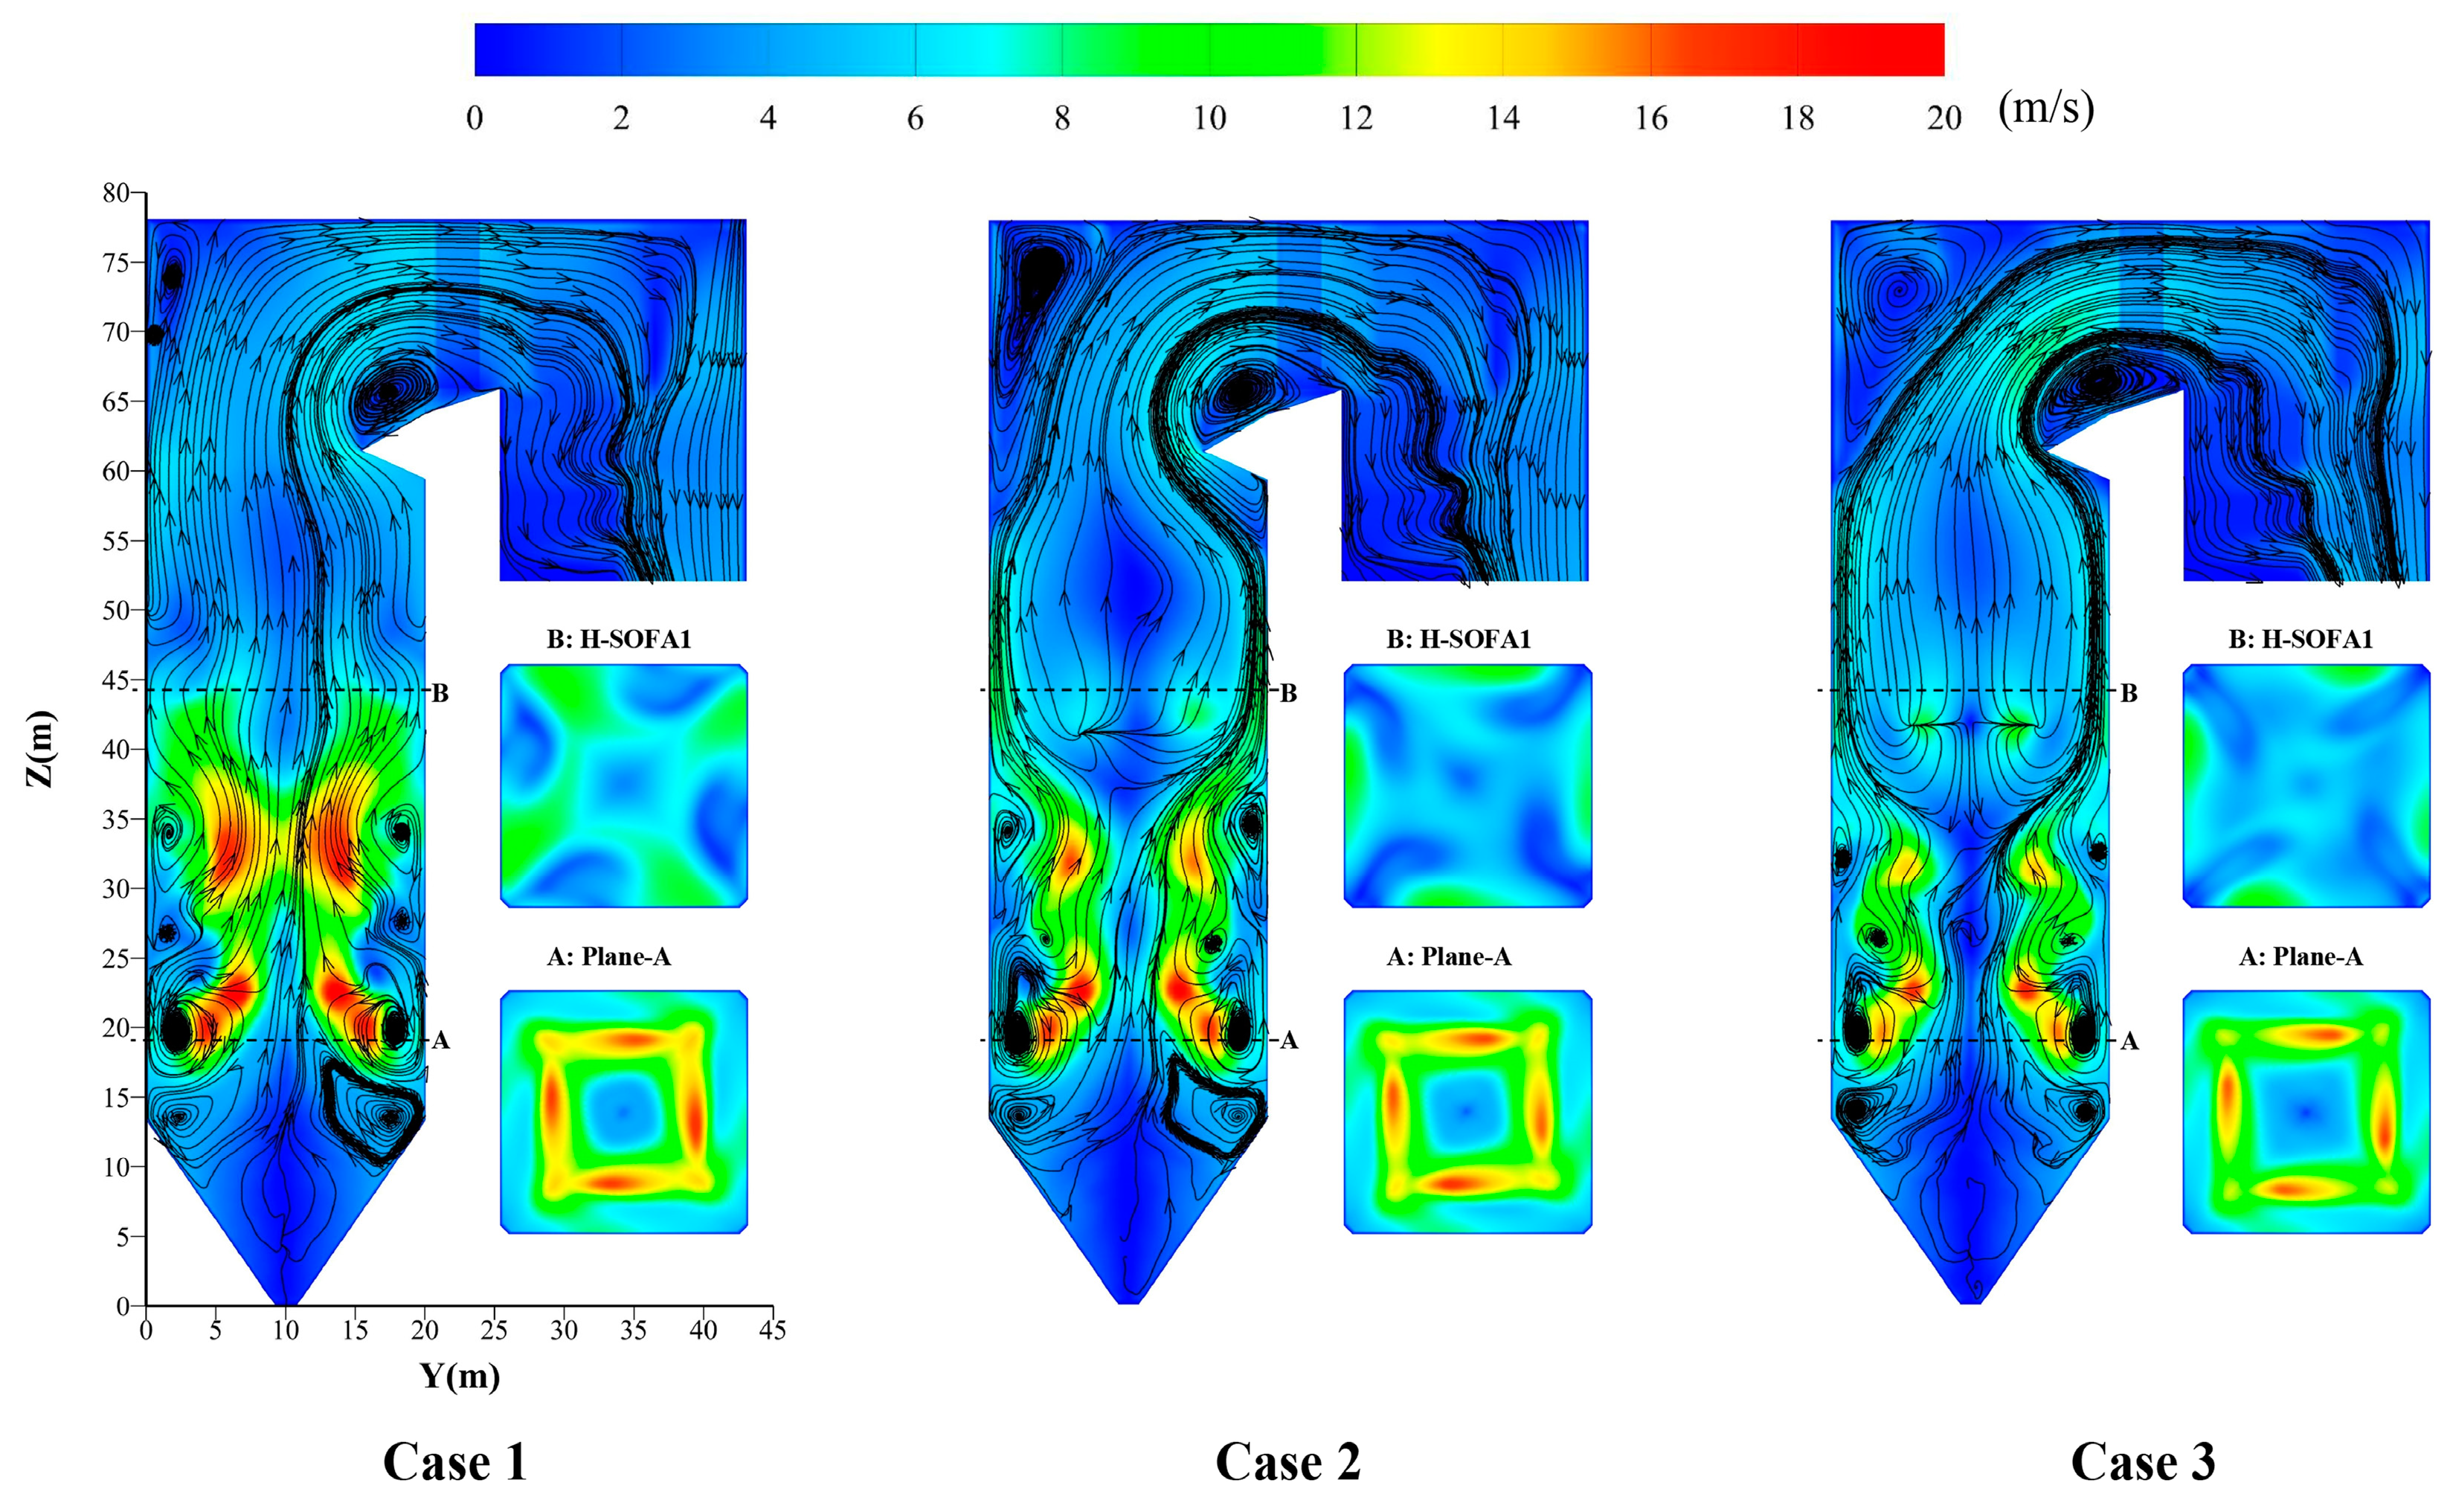
4.1.1. Distribution of Velocity Under Different SOFA Ratios

The airflow has an effect on combustion, and the flow fields under different SOFA ratios are shown in Figure 5. In the overall structure of the boiler, the cross-sectional area is reduced at the arch nose, which adjusts the direction of the flue gases to avoid flue gas washing over the top. The sharp turn of the flue gas creates a return zone above the arch nose. The airflow has a low velocity. The fly ash is more easily deposited. Figure 5 shows a lower velocity tangent circle in the cross-section of the SOFA zone. The rotating airflow in the furnace is attenuated. From Figure 1c,d, the direction of airflow from the SOFA is opposite to that in the main combustion zone. With the arrangement of the SOFA burners, the rotating airflow is attenuated, reducing thermal deviation at the horizontal flue.
As the SOFA ratio increases, the flow field has obvious changes in the SOFA zone (as shown in Figure 5). In Case 1, the main combustion zone has a large airflow due to the low SOFA ratio. The jets from the corners of the quadrangle have high flow velocities and rigidity. The diameter of the tangent circle is small. The velocity at the wall is low in the SOFA zone. In Cases 2 and 3, the secondary airflow decreases gradually. The tangent circle expands and the velocity at the wall rises. Especially in Case 3, a significant amount of O2 is replenished into the SOFA zone. The large amount of O2 diffuses downward. The air flows downwards. However, under the influence of the updraft airflow, this airflow eventually flows upward along the wall. Meanwhile, the increase in the SOFA rate allows the top of the furnace to accumulate a certain amount of O2, and the O2 concentration at the wall is relatively low. A large eddy is generated by concentration differences and the influence of updraft. The flow velocity of the flue gas above the horizontal flue increases due to the influence of the eddy. Uneven distribution of flue gas in the flue affects heat transfer. However, the impact is acceptable in actual operation. There are also eddies generated close to the wall. In combination with Figure 6 and Figure 7, at the location of the eddy formation, the temperature of the center is high and the wall temperature is low. Meanwhile, a large amount of O2 is being replenished from two layers of auxiliary air nozzles (BC and DE). Eddies are generated by concentration and temperature differences and the influence of updraft.
From Plane-A in Figure 5, the tangent circle formed is stable and is less affected by eddy currents at the walls. Although the flow velocity decreases as the SOFA ratio increases, the tangent circle remains stable. The variation of the SOFA ratio does not have a large impact on the combustion zone. The hopper has a temperature difference with the combustion zone, which generates large eddies at the walls.

4.1.2. Distribution of Temperature Under Different SOFA Ratios

Figure 6 shows the temperature distributions under the three SOFA ratios. The overall temperature distribution is obviously affected by the rise in SOFA ratio. Compared to Case 1, there is a higher temperature at the wall of the SOFA zone in Cases 2 and 3. Overall combustion is stable in the main combustion zone.
The average temperature in the height direction is calculated using the area-weighted average method, as shown in Figure 8. In Cases 1–3, the variation in the furnace temperature at the hopper is relatively consistent. It is little affected by changes in the SOFA ratio. Near the furnace height of about 20 m, temperature increases with increasing SOFA ratio. The amount of pulverized coal added here is the same. At a high SOFA ratio, the amount of secondary air added is low. It has less effect on the temperature, making the temperature highest (1656 K) for Case 3. With a large amount of air entering through the auxiliary air nozzles at the BC layer (about 22.6 m), there is a significant reduction in temperature. The temperature stays at around 1393 K at about 22.6 m. As the height increases, more pulverized coal is added to the combustion, and the temperature rises. At about 30m, the auxiliary air nozzles (DE layer) again bring in an amount of relatively low-temperature air to bring the furnace temperature down. Similarly, Case 3 has the highest SOFA ratio. The least amount of air is brought in from the DE layer, which has a small effect on the temperature. In Cases 1 and 2, the pulverized coal is adequately combusted by the incoming air from the SOFA zone. The temperatures reach peaks in the upper part of the main combustion zone (about 37.4 m). The temperature peaks are 1758 K and 1721 K, respectively. In Case 3, the larger SOFA ratio makes the temperature peak (1718 K) at about 33.8 m. In the SOFA zone, Case 3 has the lowest temperature in Cases 1–3. The highest SOFA ratio represents the most SOFA quantity added. It significantly reduces the temperature. As the height increases, the pulverized coal burns completely and the temperature gradually decreases.

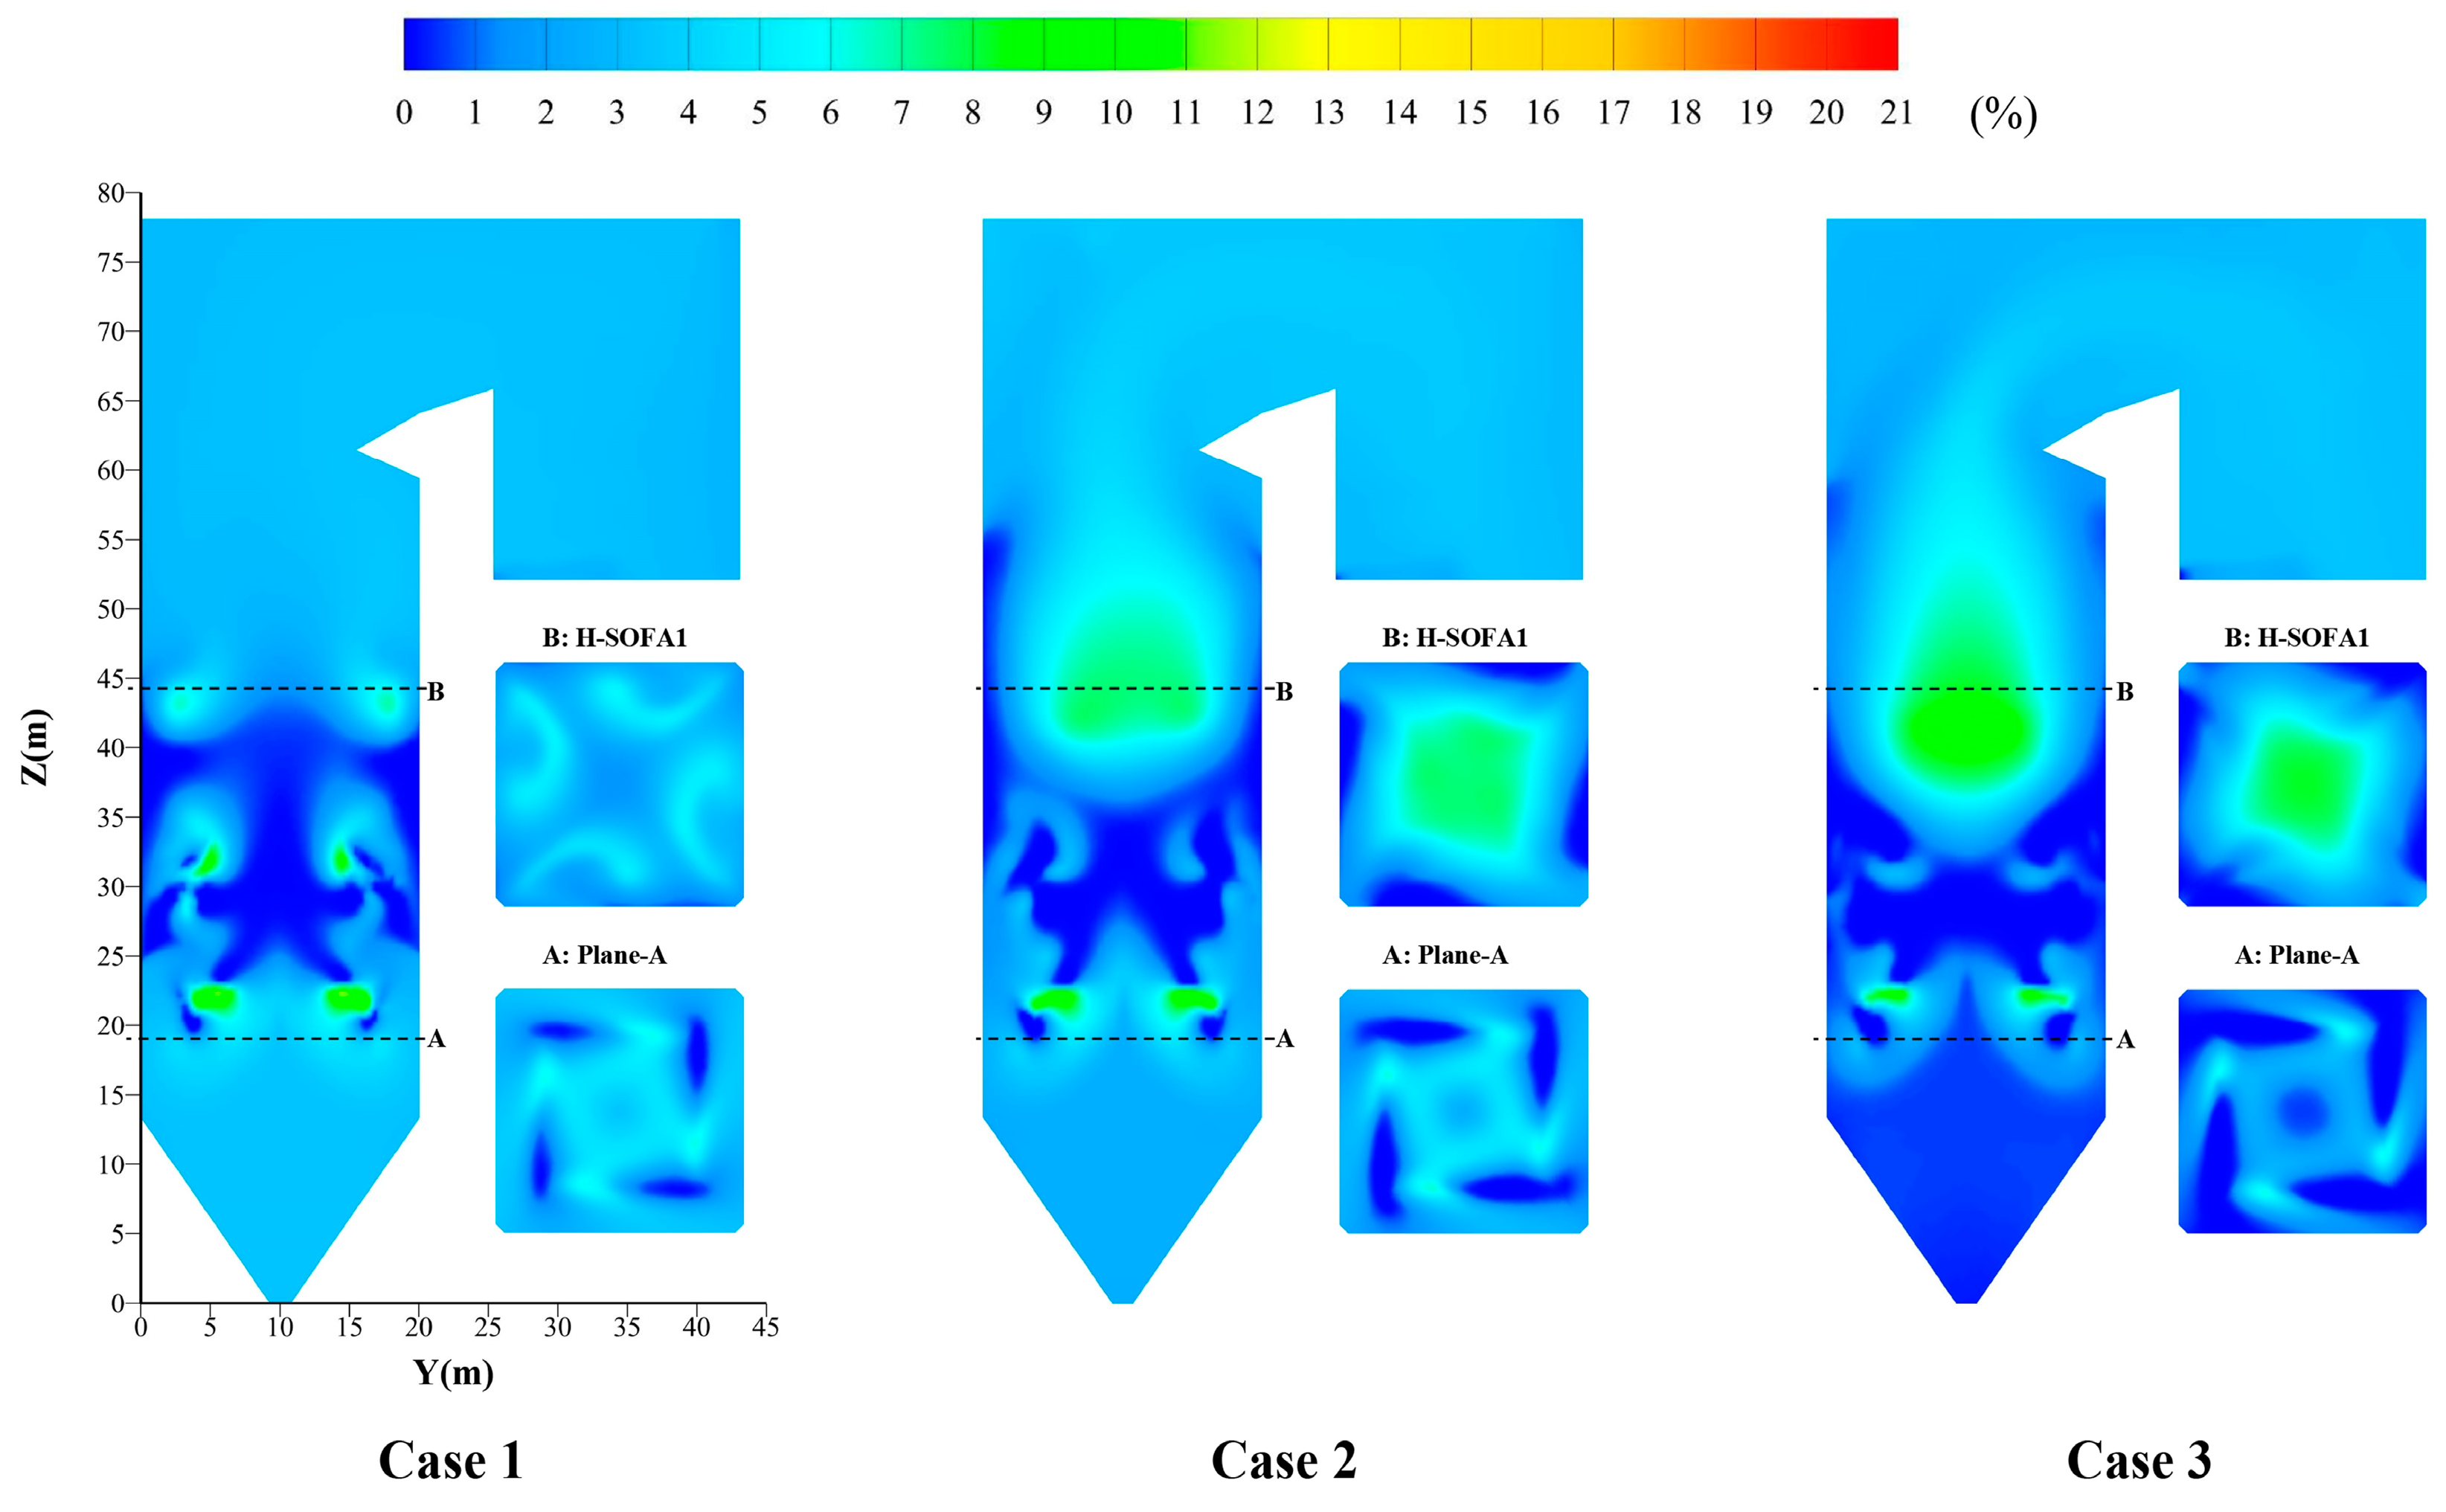
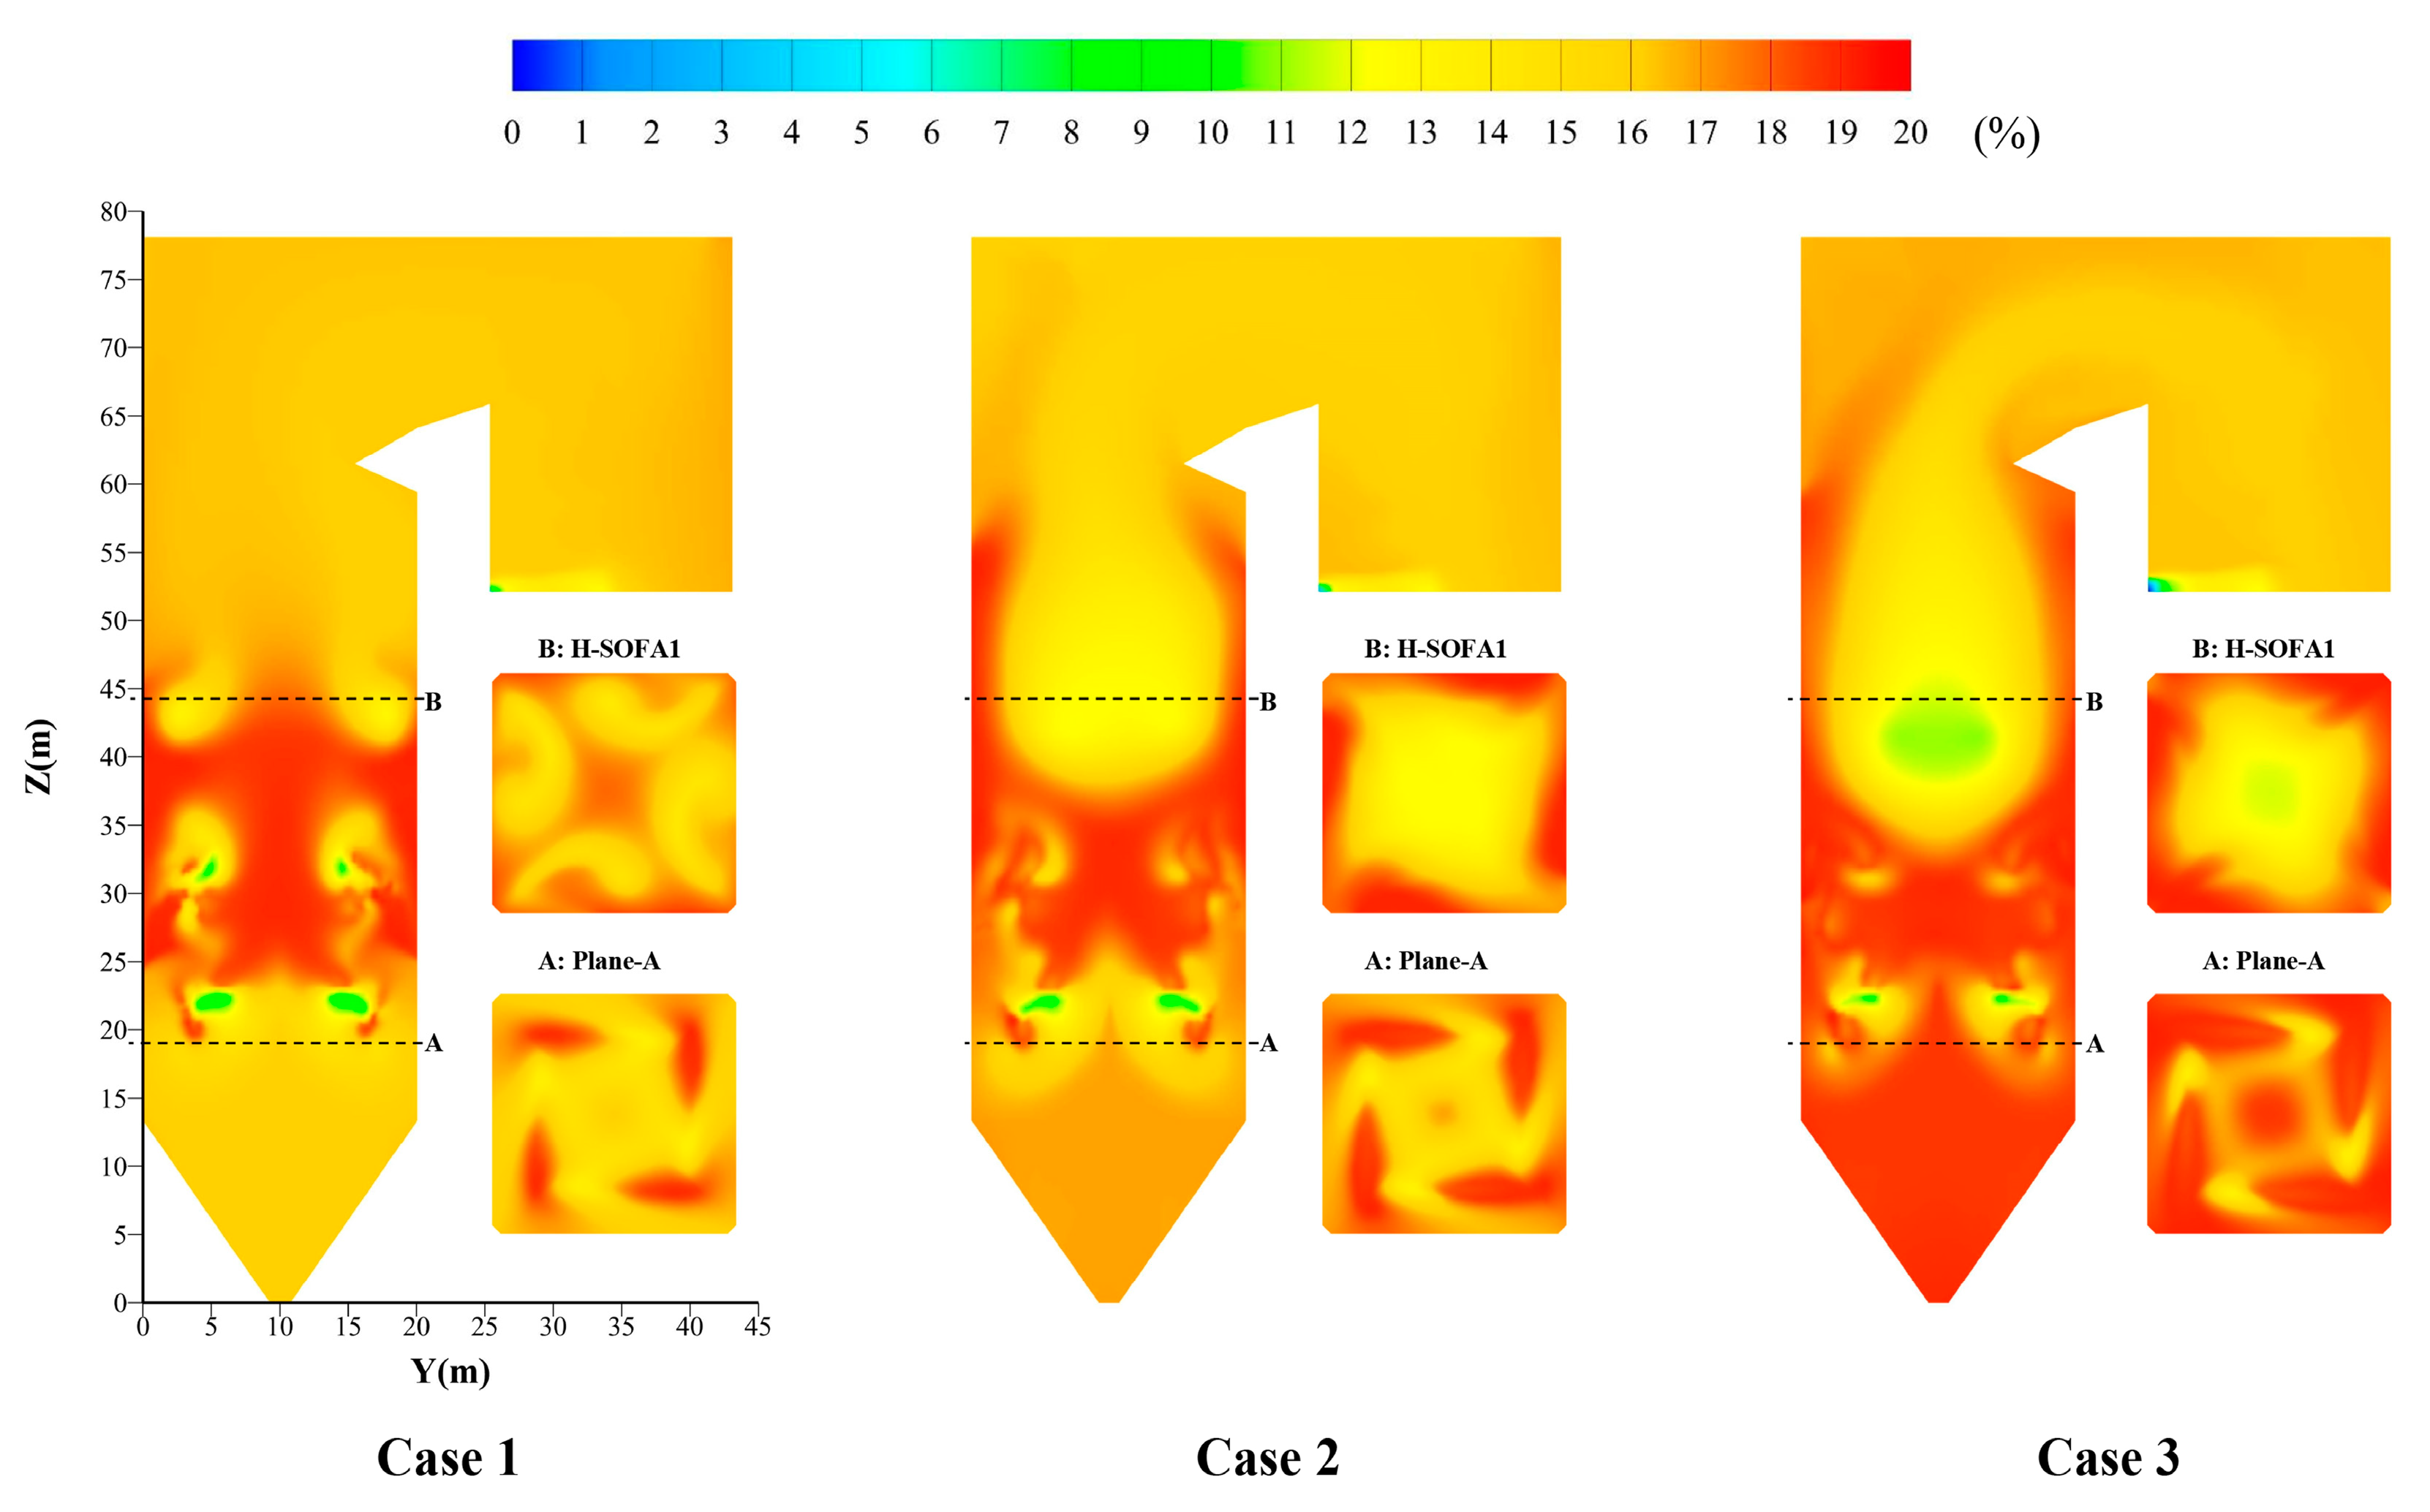
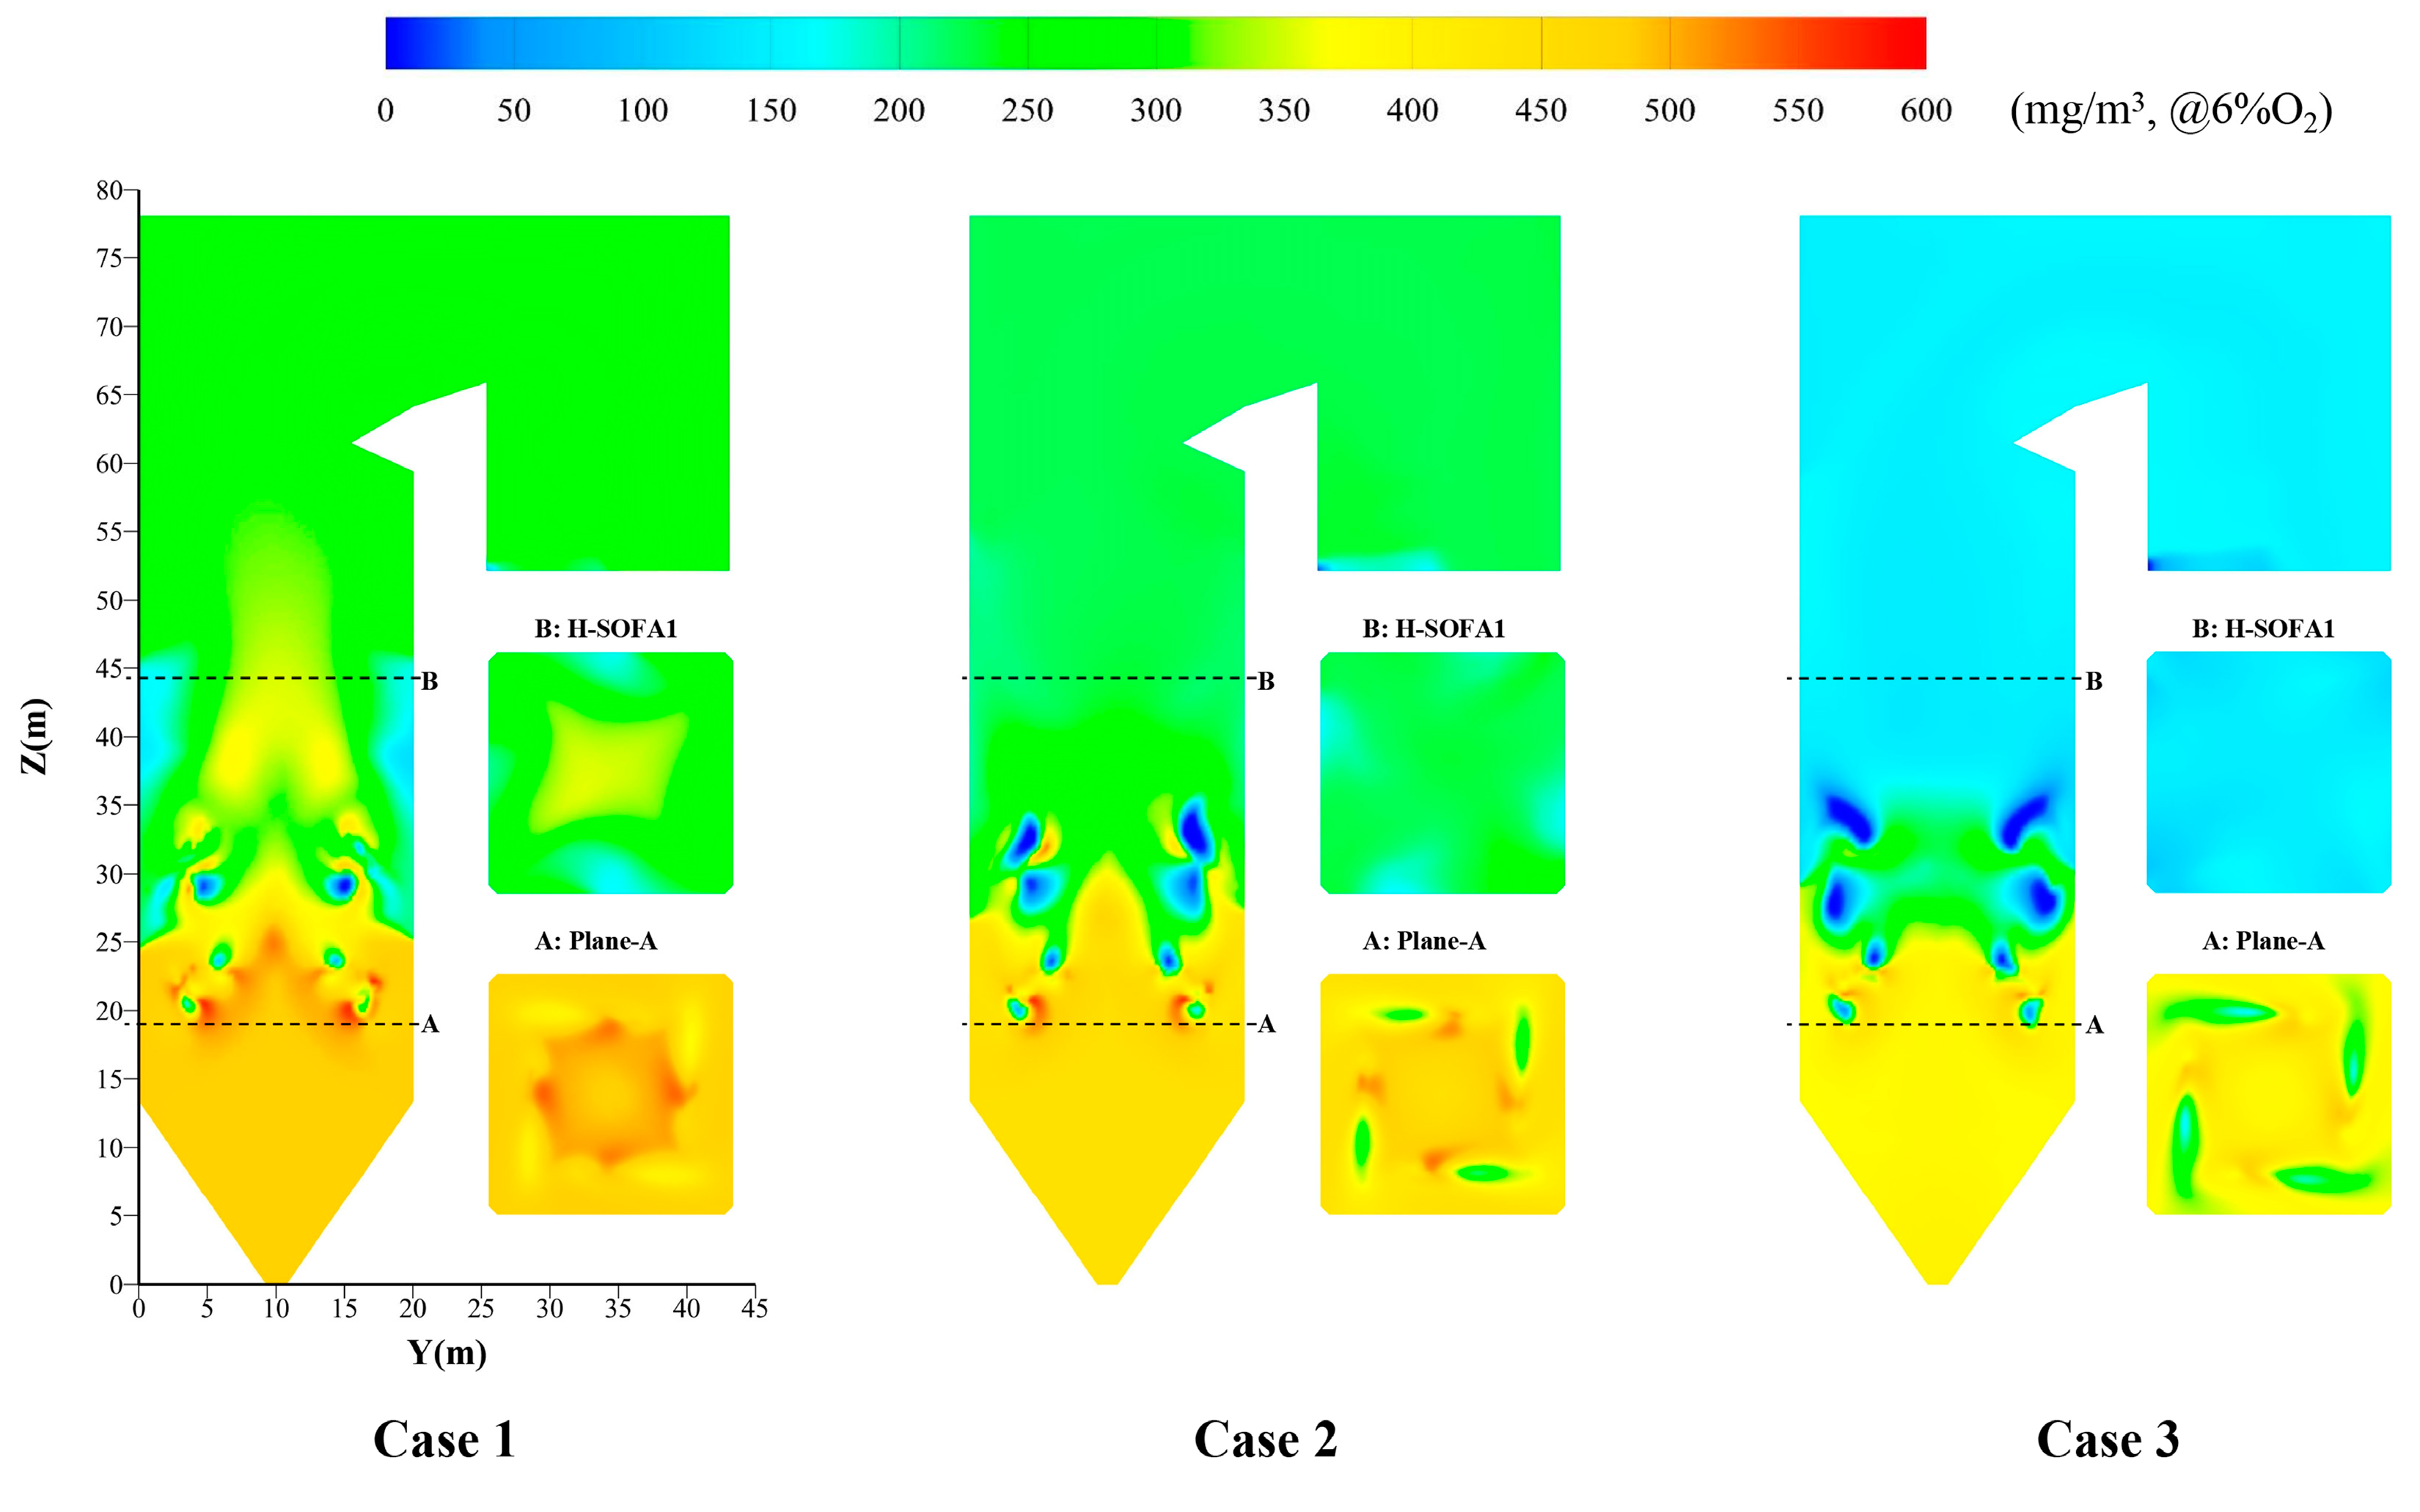
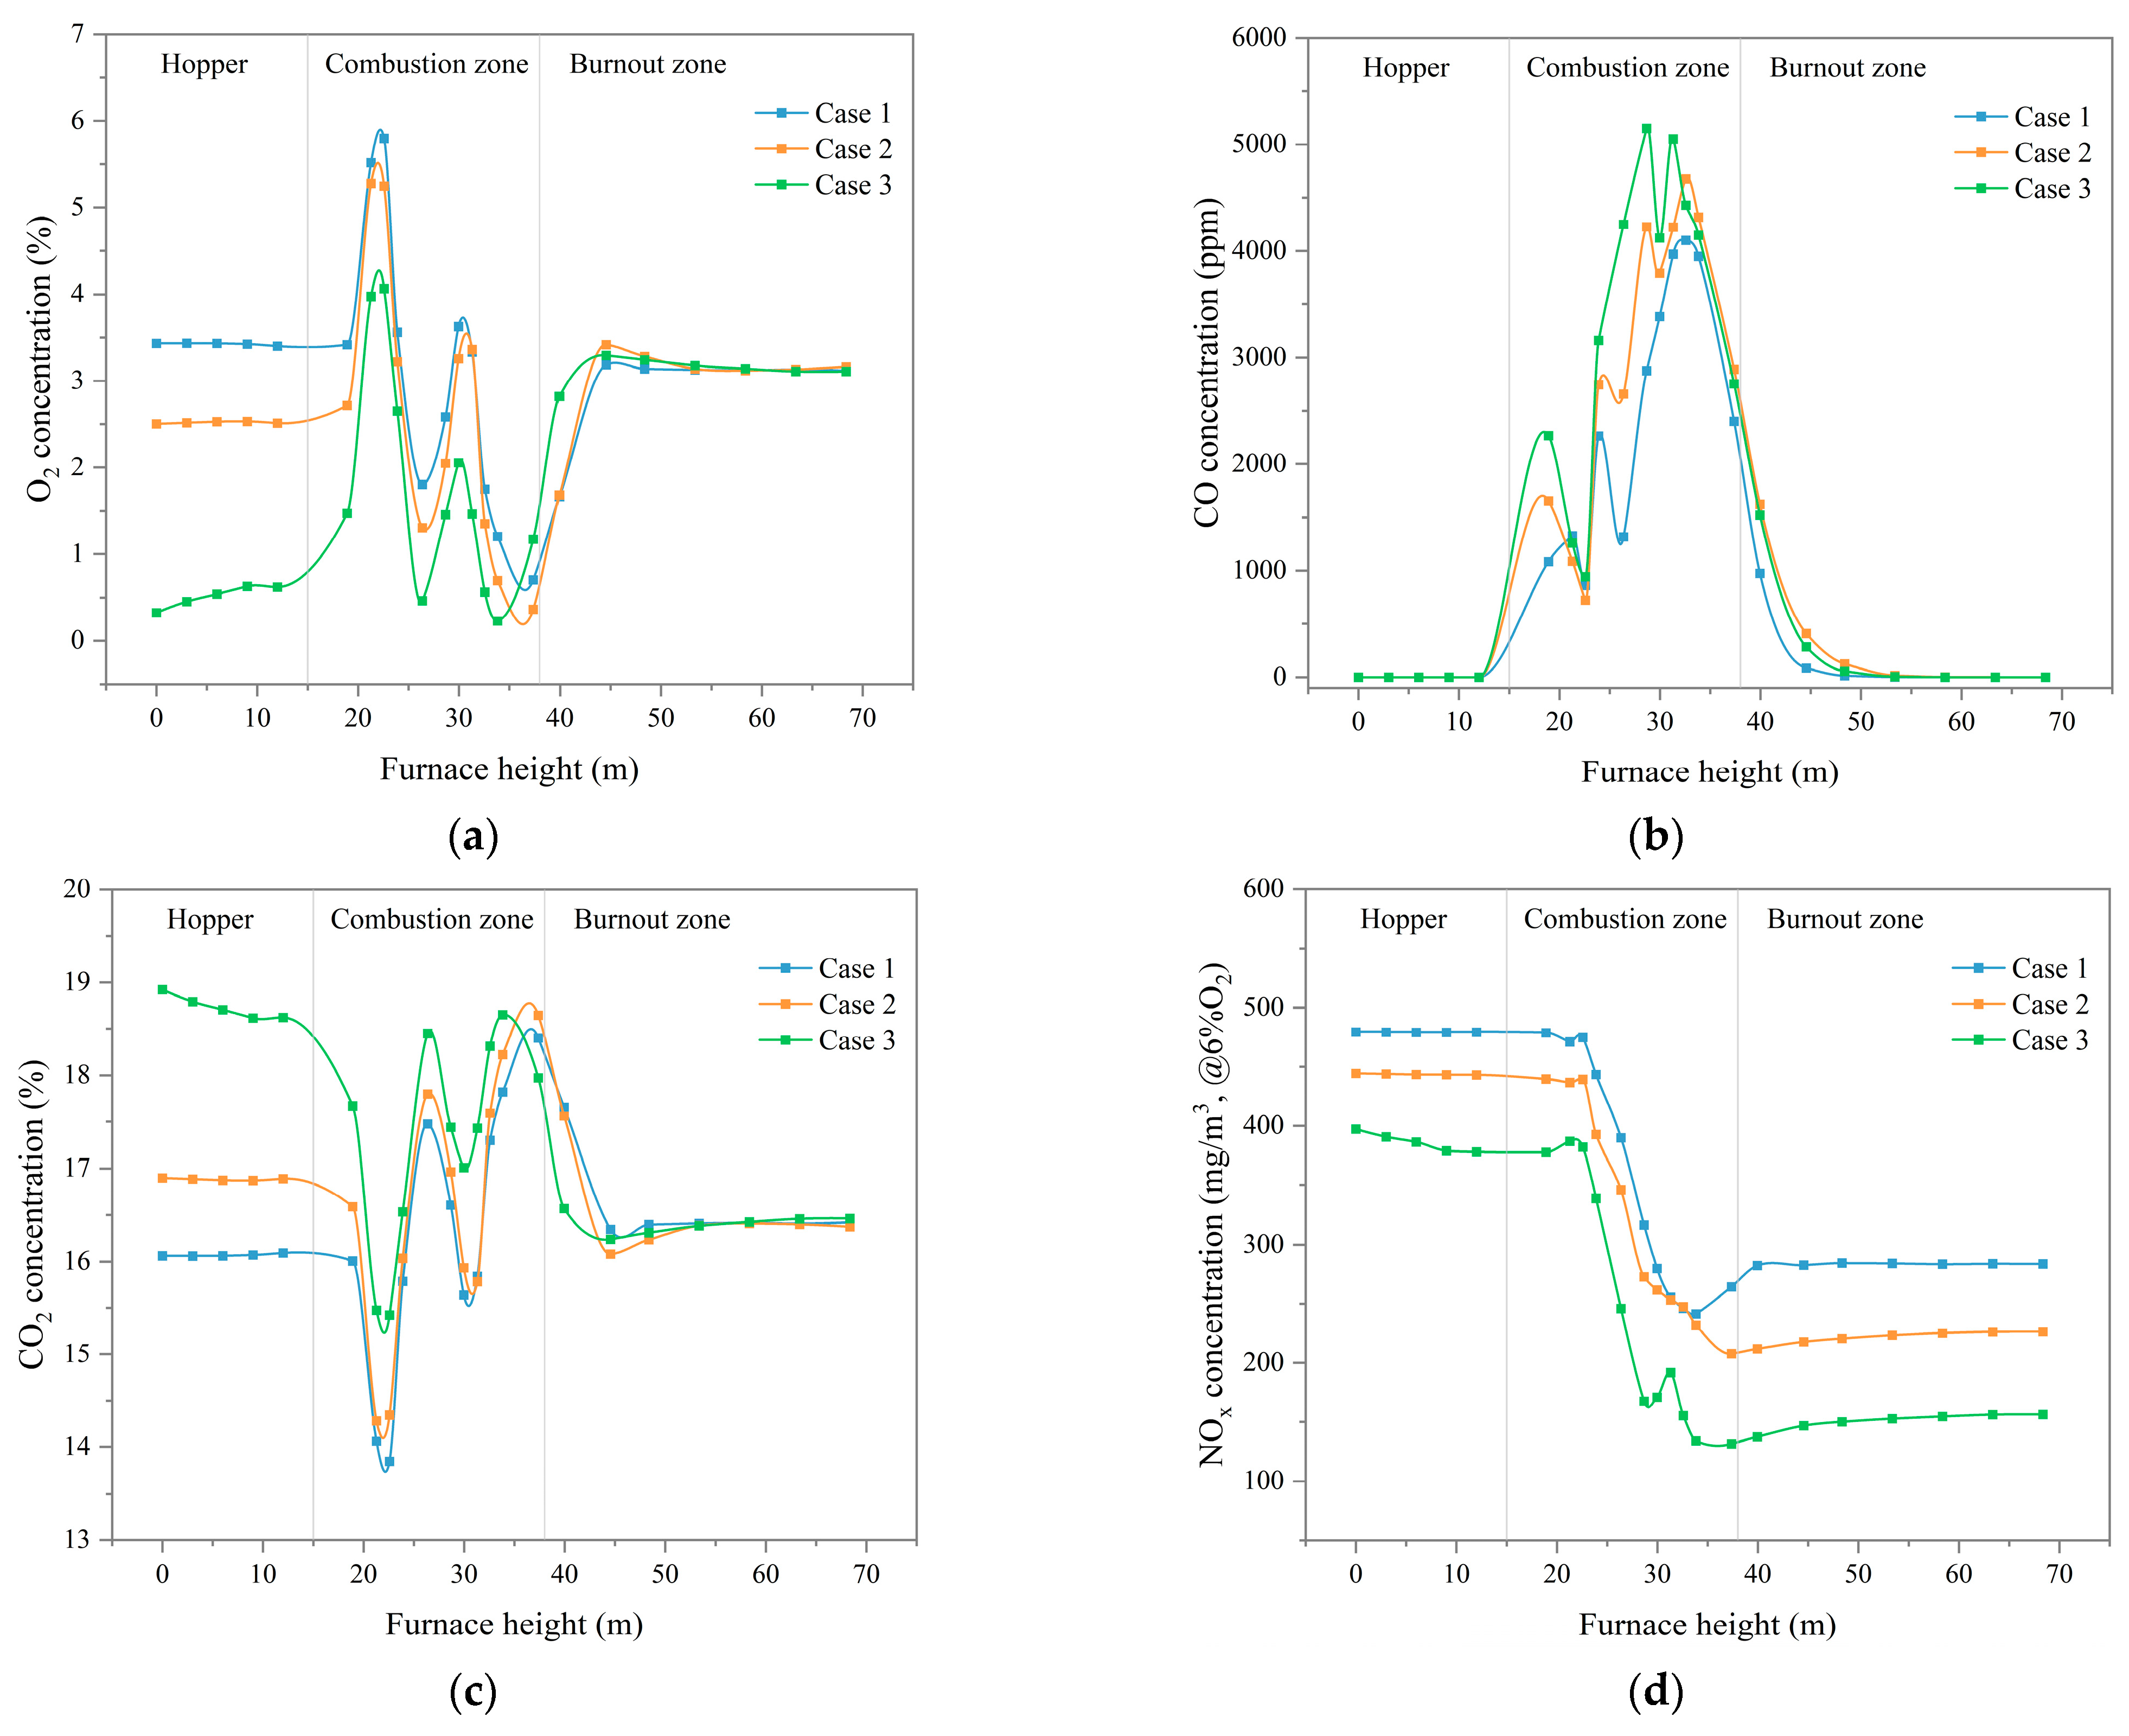
4.1.3. Distribution of Species Under Different SOFA Ratios

The distribution of species can reflect the combustion. Figure 7, Figure 9, Figure 10 and Figure 11 show the distribution of O2, CO, CO2, and NOx. The average concentrations of the cross-sections at various furnace heights are calculated using the mass-weighted average method. The results are shown in Figure 12.
From Figure 7 and Figure 12a, the O2 concentration decreases sequentially from the bottom to the upper region of the combustion zone in Cases 1 through 3. The increased SOFA ratio reduces the amount of air passing into the main combustion zone. At half load, the burners of layers B–E are operated. The hopper is some distance away from the combustion zone and accumulates a certain concentration of O2. In Cases 1 and 2, the average O2 concentrations remain stable at about 3.4% and 2.5% at the hopper, respectively. The average O2 concentration of the hopper decreases with the decrease in height in Case 3. The auxiliary air nozzles at the BC and DE layers bring in a large amount of air, which makes the O2 concentration have significant increases at 22.6 m and 30.0 m, respectively. At the top of the combustion zone, the addition of the SOFA burners causes the O2 concentration to begin to rise. And the O2 concentration of cases with higher SOFA ratios is higher. With the pulverized coal burning out, the O2 concentration gradually decreases and eventually stabilizes. The O2 concentrations are stabilized at about 3.1% in Cases 1–3. Meanwhile, from Figure 7, the region of the graph where the O2 concentration tends to be zero corresponds to the high-temperature region in Figure 6. Huge amounts of O2 are consumed in the vicinity by the burning of coal.
As the SOFA ratio rises in Cases 1–3, the CO concentration gradually increases, as illustrated in Figure 9 and Figure 12b. The increased SOFA ratio reduces the secondary ratio, causing incomplete combustion of the pulverized coal in the main combustion zone, resulting in more CO. From Figure 12b, the average concentration of CO increases and then decreases as a whole. The CO concentration at the hopper and furnace top is almost zero. There is a certain O2 concentration at the hopper from Figure 12a, and the CO is basically oxidized. In the burnout zone, the O2 added from the SOFA is sufficient for the complete combustion of the pulverized coal. Figure 9 displays the high concentration of CO near the pulverized coal burners (layers B–E). The inadequate combustion of pulverized coal produces much CO. At the BC layer (about 22.6 m), the entry of large amounts of auxiliary air reduces the concentration of CO. Meanwhile, there is a distance between the two groups of burners to ensure adequate combustion of the pulverized coal. Compared to Cases 1 and 2, the highest SOFA ratio of Case 3 makes it have a low O2 concentration between the two groups of burners (about 26.4 m), and the CO concentration increases. At the DE layer (about 30.0 m), compared to Cases 2 and 3, there is some O2 concentration in the main combustion zone in Case 1. There is no decrease in CO concentration with the addition of auxiliary air. As the height increases, more pulverized coal is passed in. The CO concentrations eventually reach peaks of 4099 and 4678 ppm at 32.6 m (E-layer burner) in Cases 1 and 2. The lesser O2 concentration allows the CO concentration to reach a peak of 5151 ppm at 28.6 m in Case 3.
Figure 10 and Figure 12c show the effect of the SOFA air ratio variation on the CO2 distribution. The CO2 is the main product of pulverized coal combustion. Its concentration distribution is exactly the opposite of the O2 distribution. As the SOFA ratio increases, the O2 concentration at the hopper and main combustion zone decreases, making the CO2 concentration increase in Cases 1–3. In the burnout zone, the eventual concentrations of CO2 converge with the burning out of the pulverized coal in Cases 1–3.
The NO is susceptible to being oxidized to NO2 when emitted into the air. The NOx emissions standard is based on NO2 in China. The production of NO was calculated in the simulation. The NO is converted to NO2 by post-processing to show the NOx distribution. Figure 11 and Figure 12d show the results.
The distribution of NOx is relatively consistent for the three cases in the direction of the height. The NOx mass concentration overall decreases with increasing SOFA ratio. The higher CO concentration enhances the reducing atmosphere with an increasing SOFA ratio. This causes the production of NO to be inhibited. In the hopper, a certain O2 concentration makes it difficult to reduce NOx. This leads to the accumulation of NOx, making NOx have a high concentration. In Case 3, the progressively higher O2 proportion makes the NO proportion drop at the hopper. In the combustion zone, the O2 concentration is insufficient to burn coal adequately. The large amount of CO presents this zone with a reduced atmosphere. NOx is reduced and the concentration gradually decreases. There is a downward trend in the NOx concentration in Cases 1 and 2, except for the BC layer, where large amounts of air supplemented by auxiliary air nozzles increase NOx concentration. At the DE layer (about 30.0 m) in Case 3, there is a significant increase in NOx concentration, which is greatly influenced by the O2 supplemented. The addition of SOFA ensures that the pulverized coal is burned out and also creates NOx. In the burnout zone, NOx concentrations are maintained at relatively stable values of about 284, 226, and 156 mg/m3 in Cases 1–3, respectively. Compared to Case 1, the increase in SOFA ratio reduces the NOx concentration by about 45.1% in Case 3.
From Case 1 to Case 3, the SOFA rate increases from 17.6% to 27.6%. The SOFA ratio increased from 17.6% to 27.6% in Cases 1–3. The decrease in the amount of air in the main combustion zone weakens the effect on temperature, and the temperature increases. Although the flue distribution in the horizontal flue is uneven, the effect is acceptable in actual operation. Consistent with previous literature results [38,45], NOx decreases significantly with the increase in SOFA ratio. The NOx concentration decreases from 284 mg/m3 to 156 mg/m3. The concentration of the other species (O2, CO, CO2) fluctuates and eventually tends to be stable.

4.2. Effect of Different Burner Angles on Combustion

4.2.1. Distribution of Velocity Under Different Burner Angles

Figure 13 shows the flow field at different burner deflection angles. In Cases 3–6, as the burner deflection angle downward increases, the flow velocity at the hopper and lower part of the main combustion zone gradually increases. In the top zone, the weakened updraft reduces the size of the eddy. It attenuates the effect on the flow field at the horizontal flue. The flow velocity increases at the wall of the SOFA zone. It leads to an enlargement in the eddy at the top. The flow velocity at the top of the furnace increases.
Figure 14 illustrates the velocity distribution at each burner under different deflection angles. In Case 3, the burners are deflected at an angle of 0°. There is a large space below the burners at layers B and D. The upper airflow has a certain thrust on the lower airflow, pushing the airflow to rotate strongly. The rotation of the airflow gives the tangent circle a large diameter. At layers C and E, the momentum of the surrounding incoming airflow is large, and the influence of the upper airflow is small. The diameter of the tangent circle formed is relatively small. In Cases 4–6, the angle of the burner is gradually deflected downward. The interaction of the incoming airflow from the four corners is weakened. The tangent diameters at the heights of the burners in layers B and D are gradually reduced. The tangent circle at the burners in layers C and E gradually increases due to the influence of the rotating airflow from below. The circle diameter at any layer of the burner is relatively stable, without significant deviation, contributing to stable combustion.

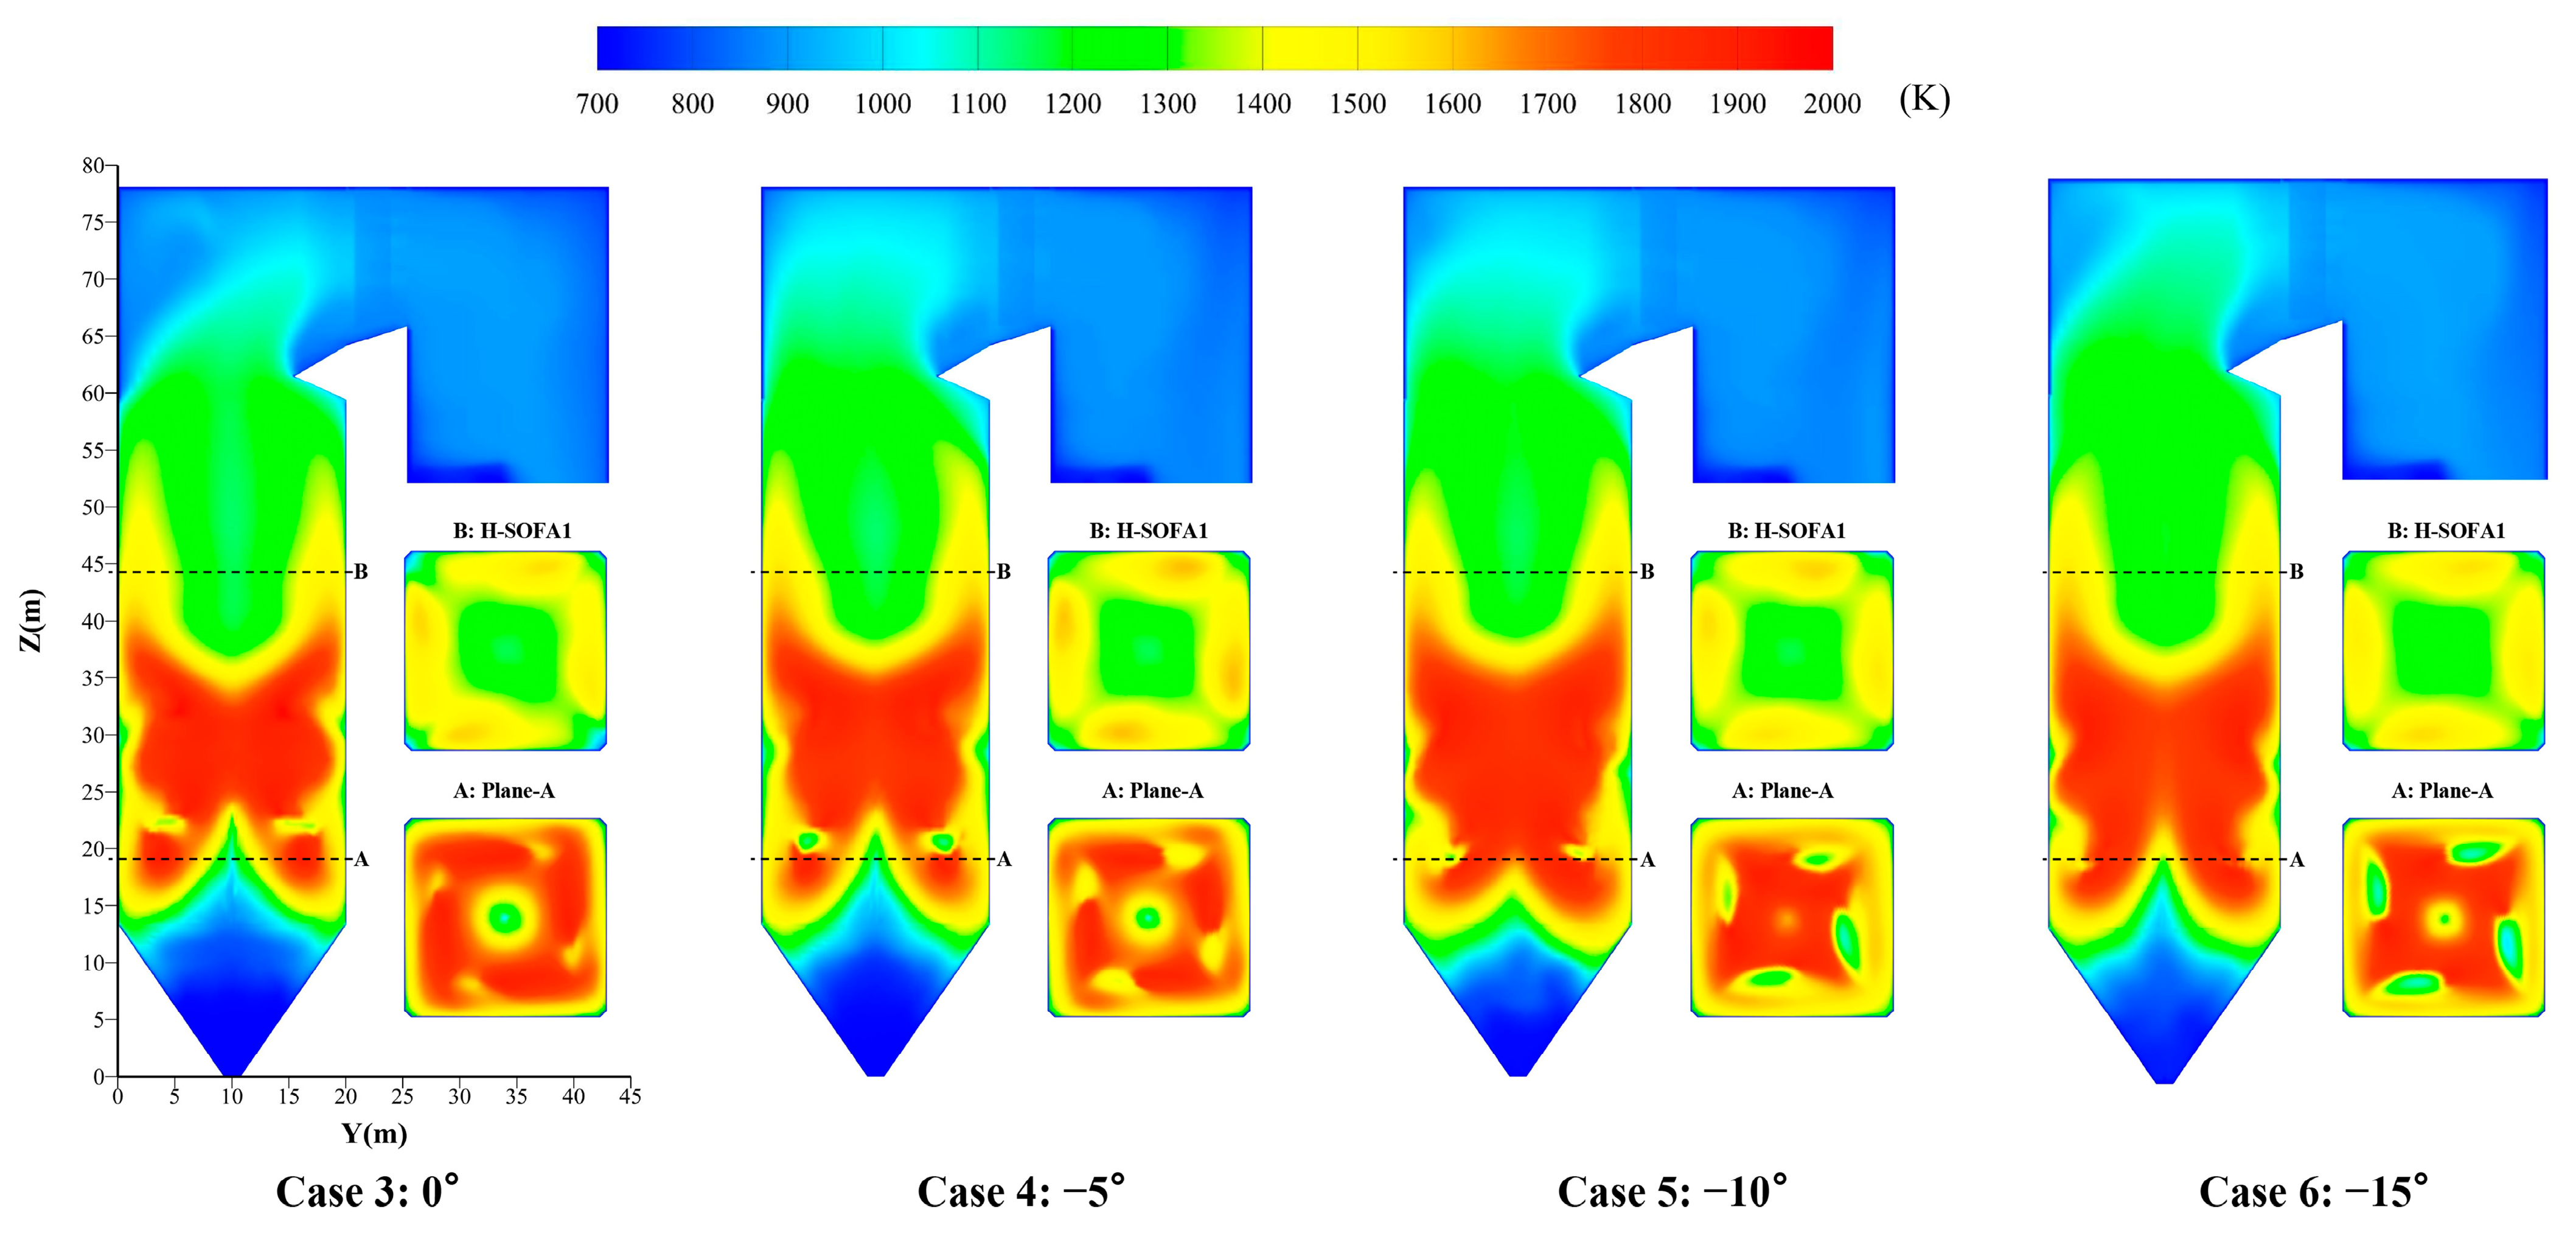
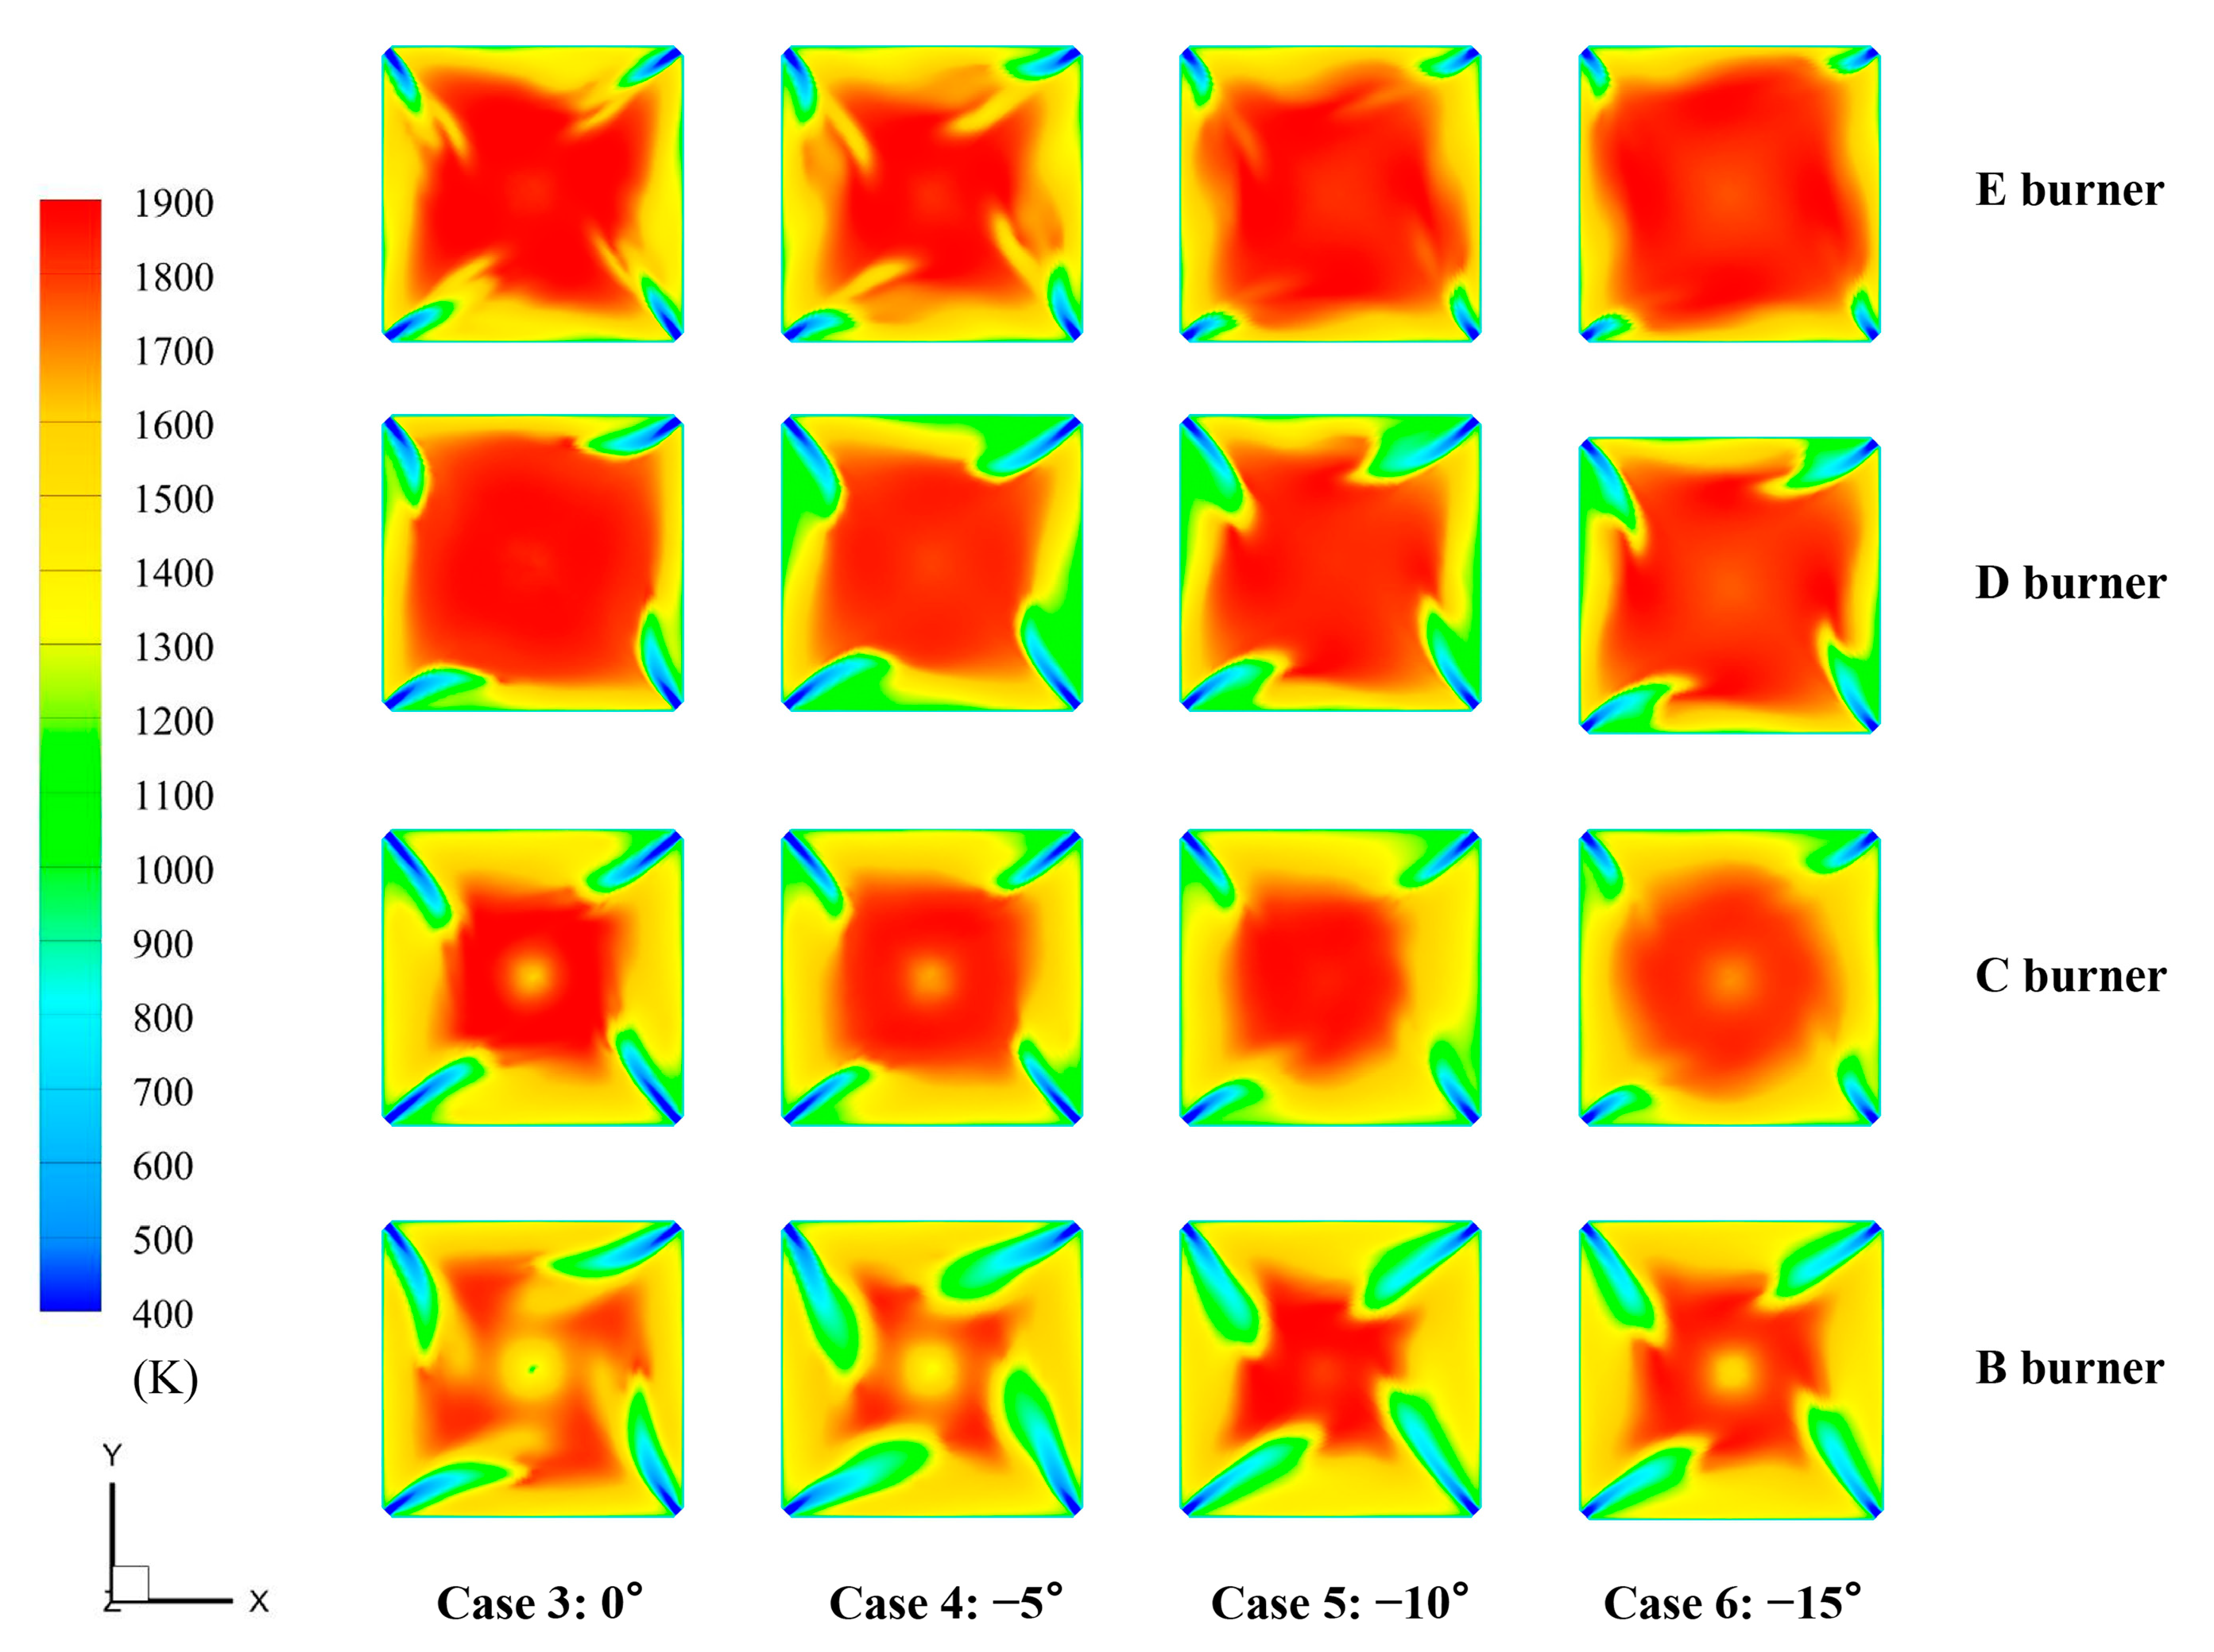
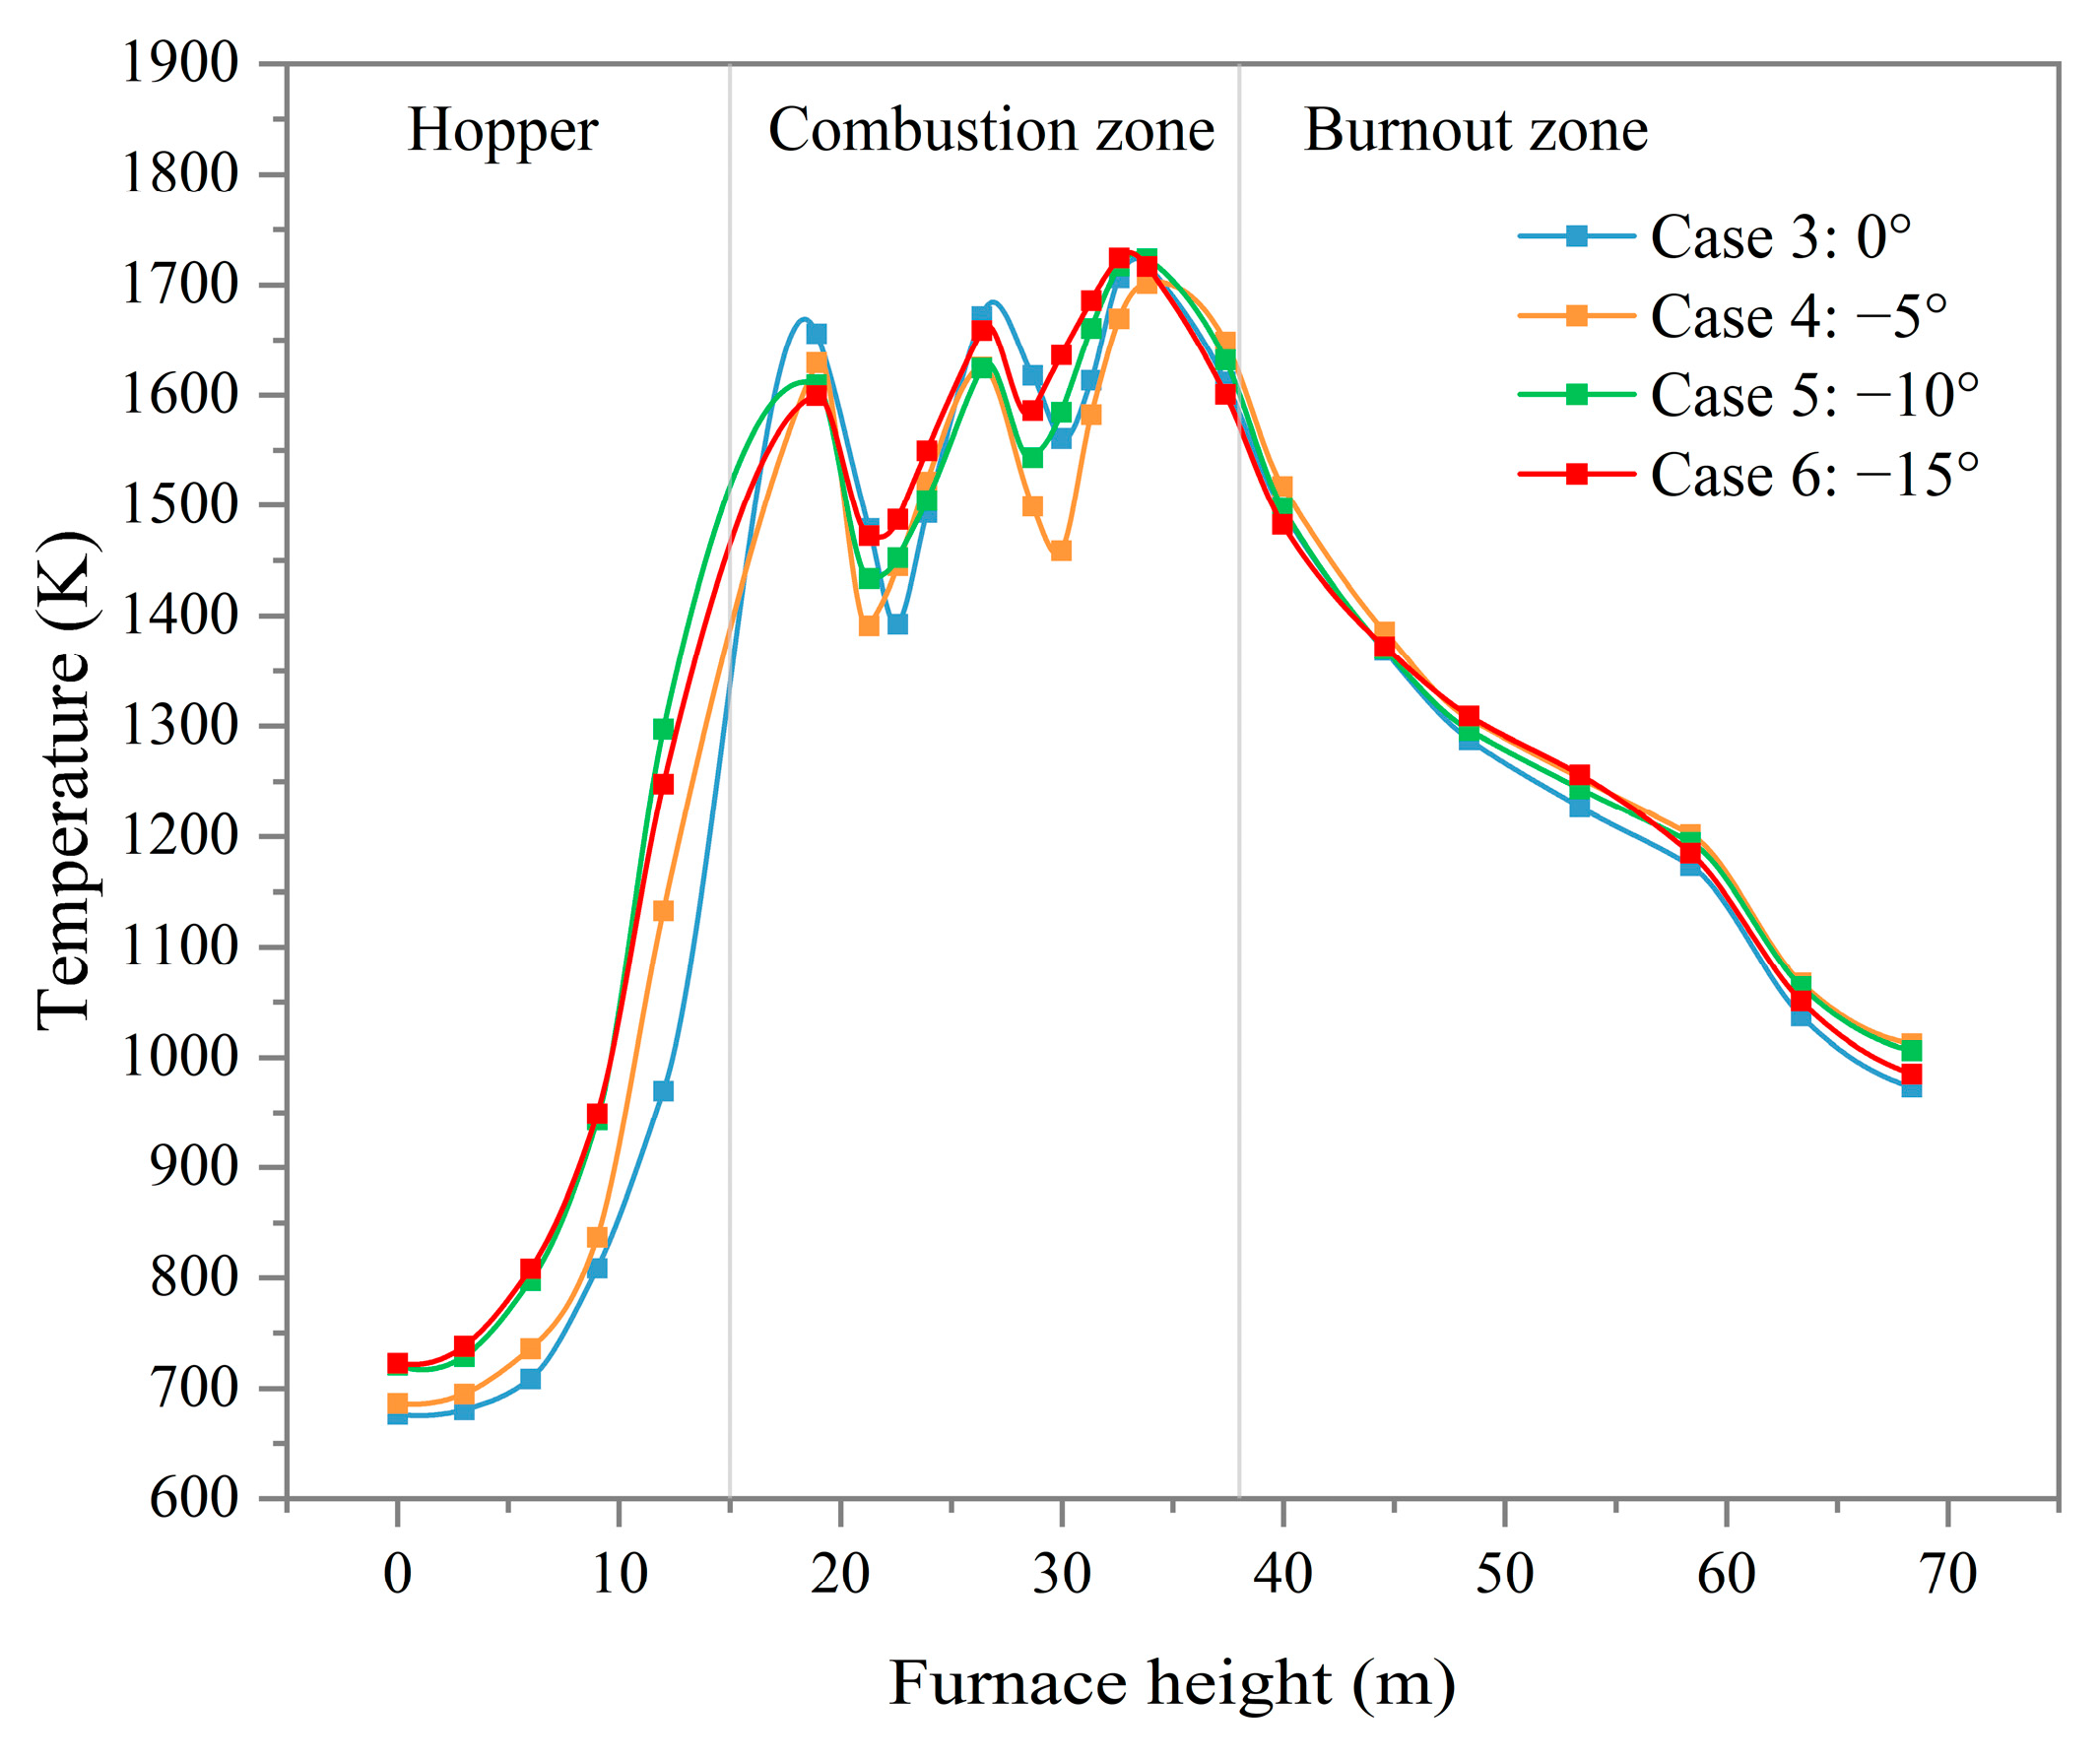
4.2.2. Distribution of Temperature Under Different Burner Angles

Figure 15 depicts the distribution of temperatures at different burner deflection angles. In Cases 3–6, the burner angle is gradually deflected downwards. The high-temperature region is extended towards the hopper. The temperature at the area of the hopper gradually increases. Figure 16 illustrates the temperature distribution at different burners. The overall combustion trend is consistent with the flow field in Figure 14. At the corners of the furnace, the inflow of air makes a lower temperature. The ring flame formed by the tangential combustion makes a low temperature in the center and a high temperature in the surroundings. At the lower burners, the temperature in the lower region gradually increases as the burner deflection angle decreases.
The average temperatures at each cross-section in the height direction are shown in Figure 17. From Cases 4 to 6, the temperature is increasing overall. In the hopper zone, the residence time of pulverized coal increases as the burner gradually shifts downward. It favors the combustion of pulverized coal, and the average temperature increases. There is a significant increase in the average temperature in Case 6 compared to Case 3. As moving closer to the main combustion zone, the temperature difference increases. At 0 m and 12 m, the temperature differences are 47 K and 278 K. Within the combustion zone, the temperature trend is more consistent for Cases 4–6 compared to Case 3. In Cases 4–6, the amount of air in the lower part of the main combustion zone has a certain increase. It is due to the downward offset of the burner. The supplemental incoming air has an effect on the temperature while aiding combustion. Case 3 has a higher temperature here (about 18.9 m) than the other cases, reaching 1655 K. There should have been a lower temperature at the BC layer auxiliary air (about 22.6 m). Due to the effect of downward deflection of the burner, the lower temperature is at about 21.3m in Cases 4–6. The temperature is still low at the auxiliary air of the DE layer (about 30 m) in Cases 3 and 4. As a result of the larger deflection angles (−10° and −15°), the lower temperature occurs at about 28.6 m in Cases 5 and 6. Between the two groups of burners (26.4 m) and close to the burnout zone (33.8 m), there is a certain amount of space for the pulverized coal to burn fully. The corresponding temperatures increase. The temperatures are maintained at 1625–1671 K and 1700–1723 K in the low- and high-temperature zones, respectively. The overall amount of pulverized coal did not change. Temperatures did not changed significantly in the high-temperature zone. Overall temperature fluctuations in the main combustion zone weakened with the constant deflection of the burner. In the burnout zone, the higher deflection angle increases the residence time of pulverized coal. However, as the pulverized coal burns out, there is little difference in overall temperature.

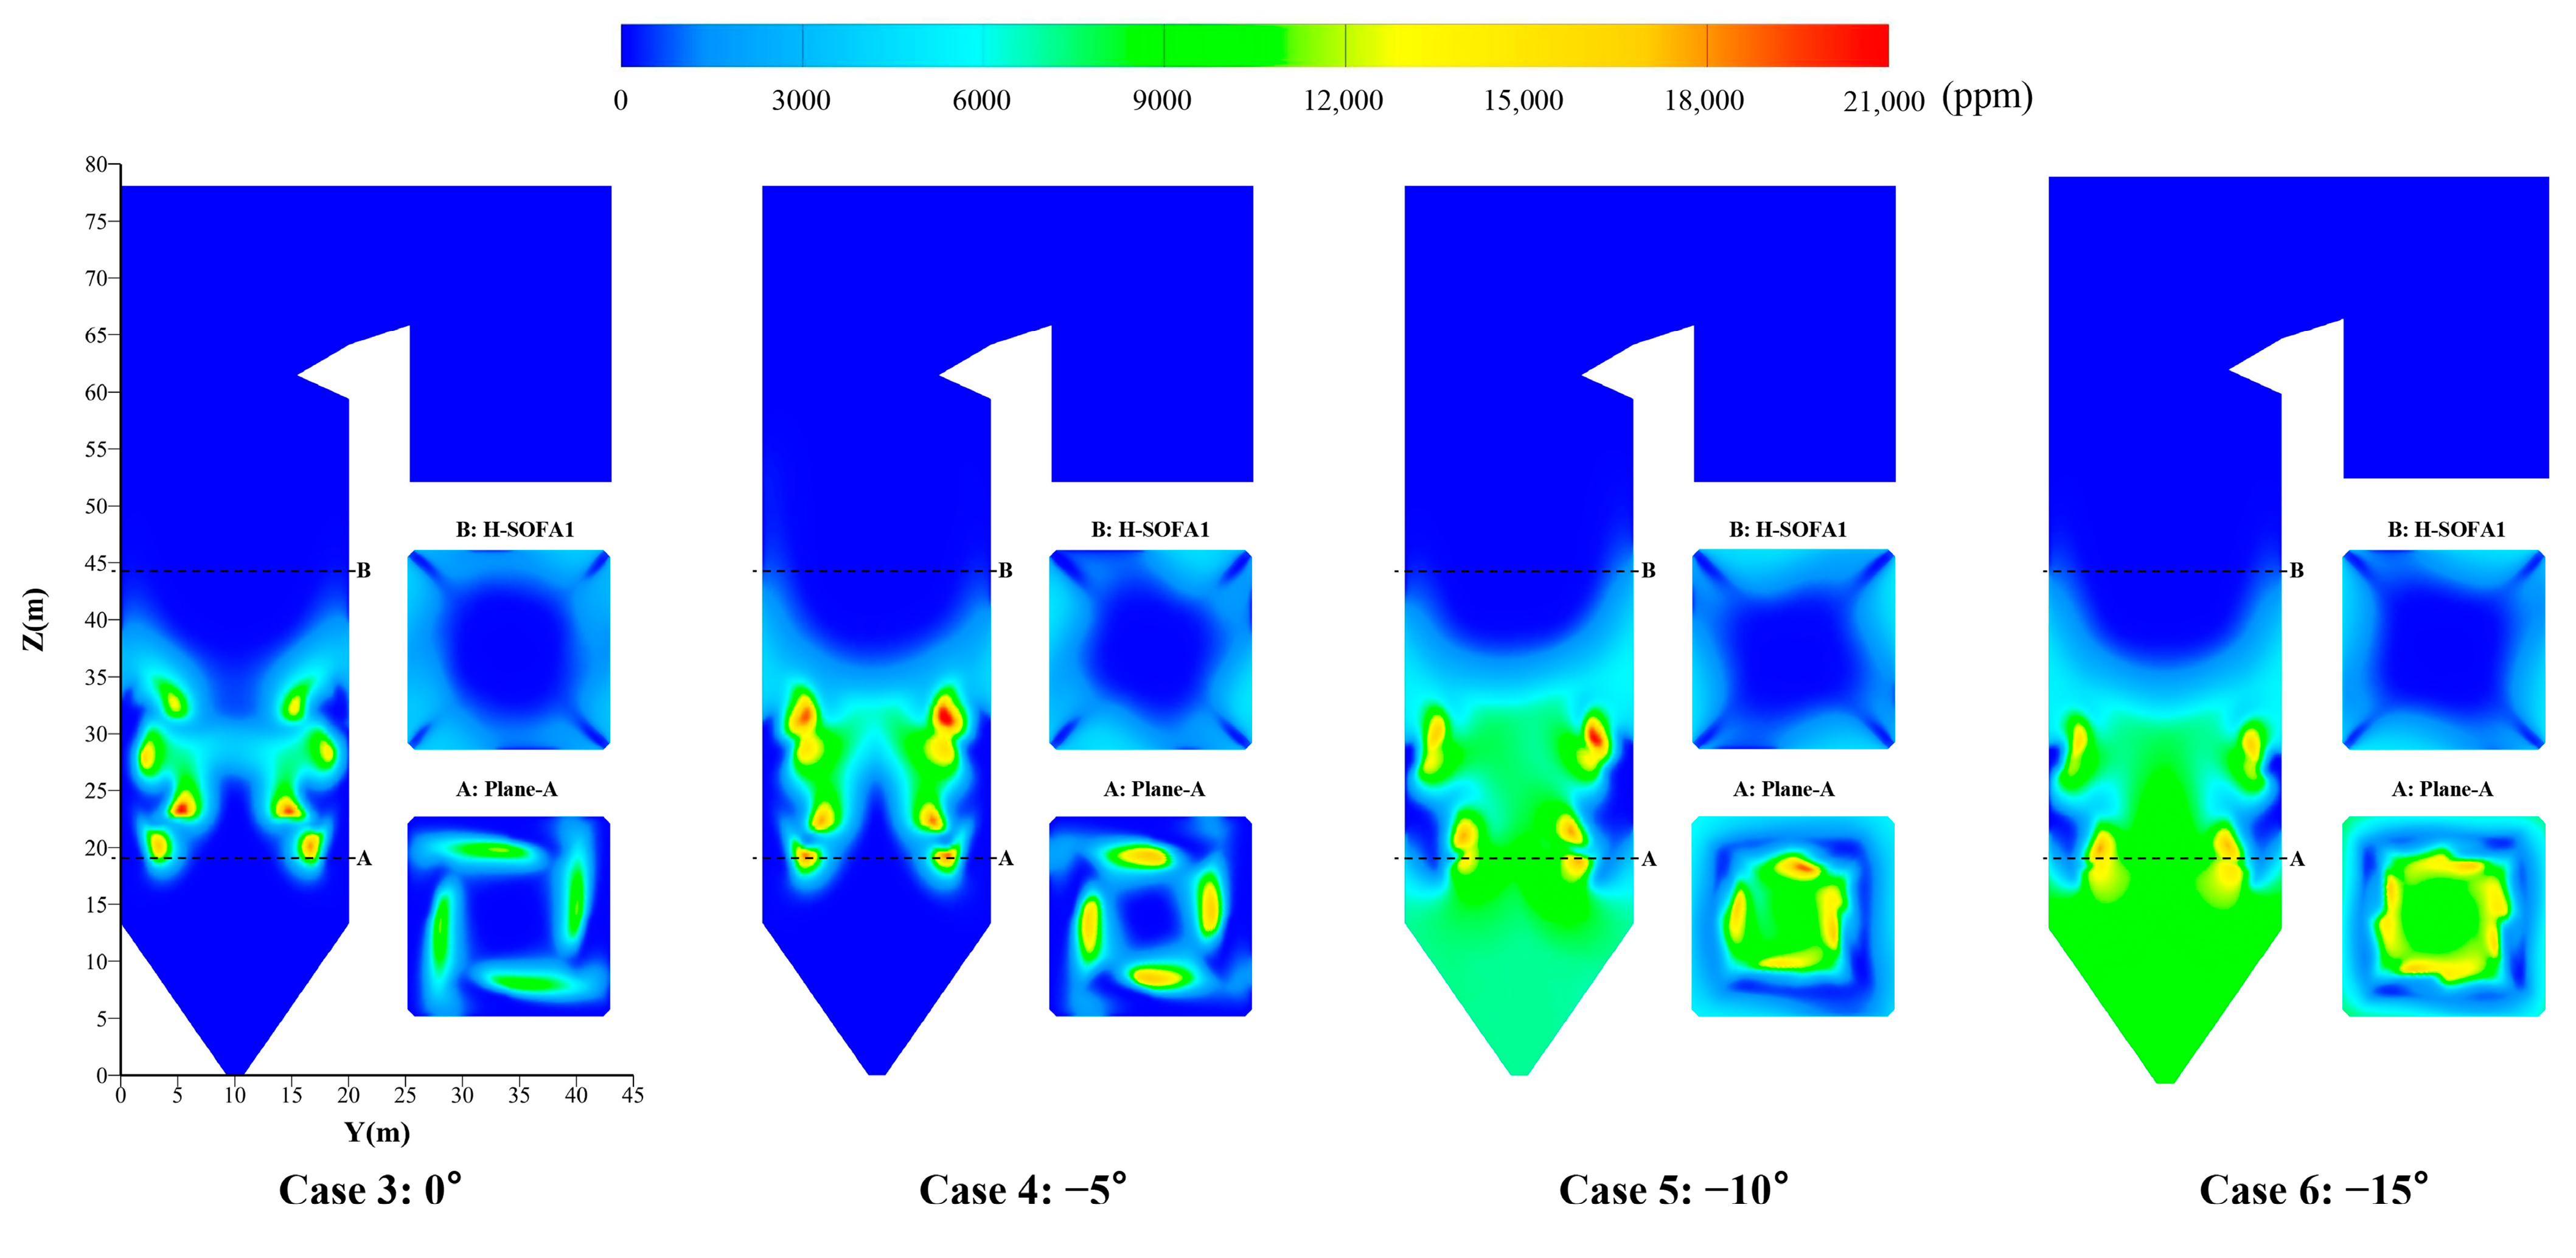
4.2.3. Distributions of Species Under Different Burner Angles

The distributions of species at different deflection angles of the burner is shown in Figure 18, Figure 19, Figure 20 and Figure 21. Figure 22 illustrates the average concentrations of the species at different heights.
The effects of different deflection angles of the burner on O2 are shown in Figure 18 and Figure 22a. In the hopper, as the deflection angle increases, the O2 concentration decreases and eventually approaches zero. The downward deflection of the burner not only brings the combustion zone closer to the hopper but also increases the residence time of the pulverized coal. All of this causes the O2 to be consumed continuously. In the combustion zone, the O2 concentration increased at all locations in Cases 4–6 compared to Case 3. On the one hand, the expansion of the combustion zone reduces the mixing of pulverized coal with O2. On the other hand, part of the pulverized coal is burned at the bottom, which reduces the consumption of O2. Especially at the B layer burner (about 21.3 m), the O2 concentrations in Cases 4–6 are above 5%. Case 4 has the highest O2 concentration of 5.53% here. Cases 5 and 6 have a large deflection angle, and O2 is supplemented to the lower part of the combustion zone. In the combustion zone, the consumption of O2 supplemented into the combustion air varies in Cases 3–6. The change in the burner’s angle increases the O2 concentration in the combustion zone. From the side, it indicates that more of the pulverized coal has not been adequately burned. With increasing burner deflection angle, more residence time allows pulverized coal to burn out in the burnout zone. The O2 concentration decreases gradually. The O2 concentration is significantly increased in Case 5 compared to the other Cases. The deflection angle of −10° could not ensure full combustion. When the deflection angle reaches −15°, the pulverized coal has a longer residence time. It ensures adequate combustion of pulverized coal. The O2 concentration is maintained within reasonable limits in Case 6.
The influence of CO on the deflection angle of the burner is shown in Figure 19 and Figure 22b. The increase in deflection angle brings more CO. In the hopper, with the deflection of the burner angle, the O2 in the zone is unable to ensure the combustion of the pulverized coal. A large amount of CO is produced. From Case 3 to Case 6, the concentration of CO here increased from 0 ppm to about 9340 ppm. In the combustion zone, the increase in deflection angle weakens the mixing of pulverized coal with air, which affects the adequate combustion of pulverized coal. The CO concentration increases with the increase in the deflection angle of the burner. In the lower part of the combustion zone, the CO in Cases 5 and 6 is oxidized by the supplemental O2 from the upper burner compared to Cases 3 and 4, which have a smaller deflection angle. The CO concentration starts to decrease and reaches a lower value at the auxiliary air of the B layer burner (about 21.3 m). As the height of the furnace increases, more pulverized coal is added to the combustion. The overall CO concentration starts to increase. At the DE layer (about 30m), the air brought in by the auxiliary air makes the concentration of CO in Cases 3 and 4 have a significant decrease. The CO concentration in Cases 5 and 6 is also affected, but still maintains a higher concentration. Even the CO concentration in Case 5 is slightly higher than that in Case 6. It represents the inadequate combustion of pulverized coal in Case 5. With the addition of the SOFA burner, the CO concentration eventually decreases to zero in the burnout zone as the pulverized coal is burned.
The variation in CO2 concentration at different burner deflection angles is shown in Figure 20 and Figure 22c. Due to the effect of the deflection angle, the trend of CO2 concentration in Cases 4–6 is relatively consistent. The CO2 concentration decreases gradually with the increase in the downward deflection angle. In the hopper, in combination with Figure 22a,b, the O2 in this zone is depleted, and a large amount of CO is generated in Cases 5 and 6. CO2 concentrations are relatively low. In Case 4, the smaller deflection angle allows some of the pulverized coal to burn out at the hopper. The CO2 builds up in large quantities at the bottom of the furnace, reaching a concentration of 19.1%. In the combustion zone, the CO2 concentration fluctuates due to the combustion of pulverized coal and the input of auxiliary air. In the burnout zone, the CO2 concentration is reduced by the supplemental O2 from the SOFA burner. As the pulverized coal burns out, the CO2 concentration increases again and eventually stabilizes. In Case 5, the inadequate combustion of pulverized coal makes the O2 concentration have a high value. It makes the CO2 concentration lower in the burnout zone and finally maintains at about 16.3%.
The deflection of the burner angle results in an overall reduction in NOx concentration, as shown in Figure 21 and Figure 22d. In Case 3, the burner angle is not deflected and the overall NOx concentration change is different compared to the other cases. At the hopper, the zone is less affected by combustion in Cases 3 and 4; there is some amount of NOx at the bottom. In Cases 5 and 6, the higher CO concentration (see Figure 22b) creates a reducing atmosphere in the zone. The NOx concentration is maintained at a lower value overall. Compared to Case 3, Case 6 showed a lower NOx concentration by about 38.5% at the bottom. In the combustion zone, the large amount of O2 brought by the auxiliary air at the BC layer ensures the combustion of pulverized coal and promotes the generation of NOx. The NOx concentration in different cases reached extreme values near here. The deflection of the burner angle with the increase in the furnace height intensified the incomplete combustion of pulverized coal. A large amount of CO production suppresses the NOx production. In Cases 4–6, NOx concentration decreased from the A layer to the top of the combustion zone. In Case 3, NO concentration increased at the DE layer due to the influence of the supplementary air. In the SOFA zone, much air is supplied to make an oxidizing atmosphere. Inevitably, the NOx concentration started to increase. The pulverized coal combustion maintains the NOx concentrations at around 156, 147, 138, and 140 mg/m3 in Cases 3–6, respectively. The large amount of CO produced by the inadequate combustion of pulverized coal in Case 5 yields the lowest concentration of NOx. The deflection angles of −10° and 15° reduced the NOx concentration by about 10% compared to the undeflected burner.
From Case 3 to Case 6, different deflection angles (0°, −5°, −10°, and −15°) of the burner are considered. The overall temperature fluctuations gradually weaken. In Case 4, a small downward deflection angle (−5°) makes the distribution of flue gas at the top more uniform. Compared to the variation in SOFA ratio, the variation in deflection angle has a smaller impact on the concentration of species. As the burner deflects downward, the mixture of pulverized coal and air weakens. The reducing atmosphere is strengthened. The concentration of NOx is reduced.

5. Conclusions

In this paper, the combustion characteristics of a new 660 MW boiler at half load were investigated with actual field measurement data. The effects of different burnout air ratios (17.6%, 22.6%, and 27.6%) and different deflection angles (0°, −5°, −10°, and −15°) of the burner on the combustion at half load were investigated. The main conclusions drawn are as follows:
(1)
The temperature in the main combustion zone increased slightly after the SOFA ratio increased from 17.6% to 27.6% in Cases 1–3. However, the large eddy formed in the top zone affects the horizontal flue flow field. The uneven flue gas distribution affects the heat exchange.
(2)
The increase in the SOFA ratio resulted in a significant decrease in the NOx concentration. In the burnout zone, compared with the NOx concentration of 284 mg/m3 in Case 1 (17.6% SOFA ratio), the NOx concentration in Case 3 (27.6% SOFA ratio) is only 156 mg/m3, which is a decrease of 45.1%.
(3)
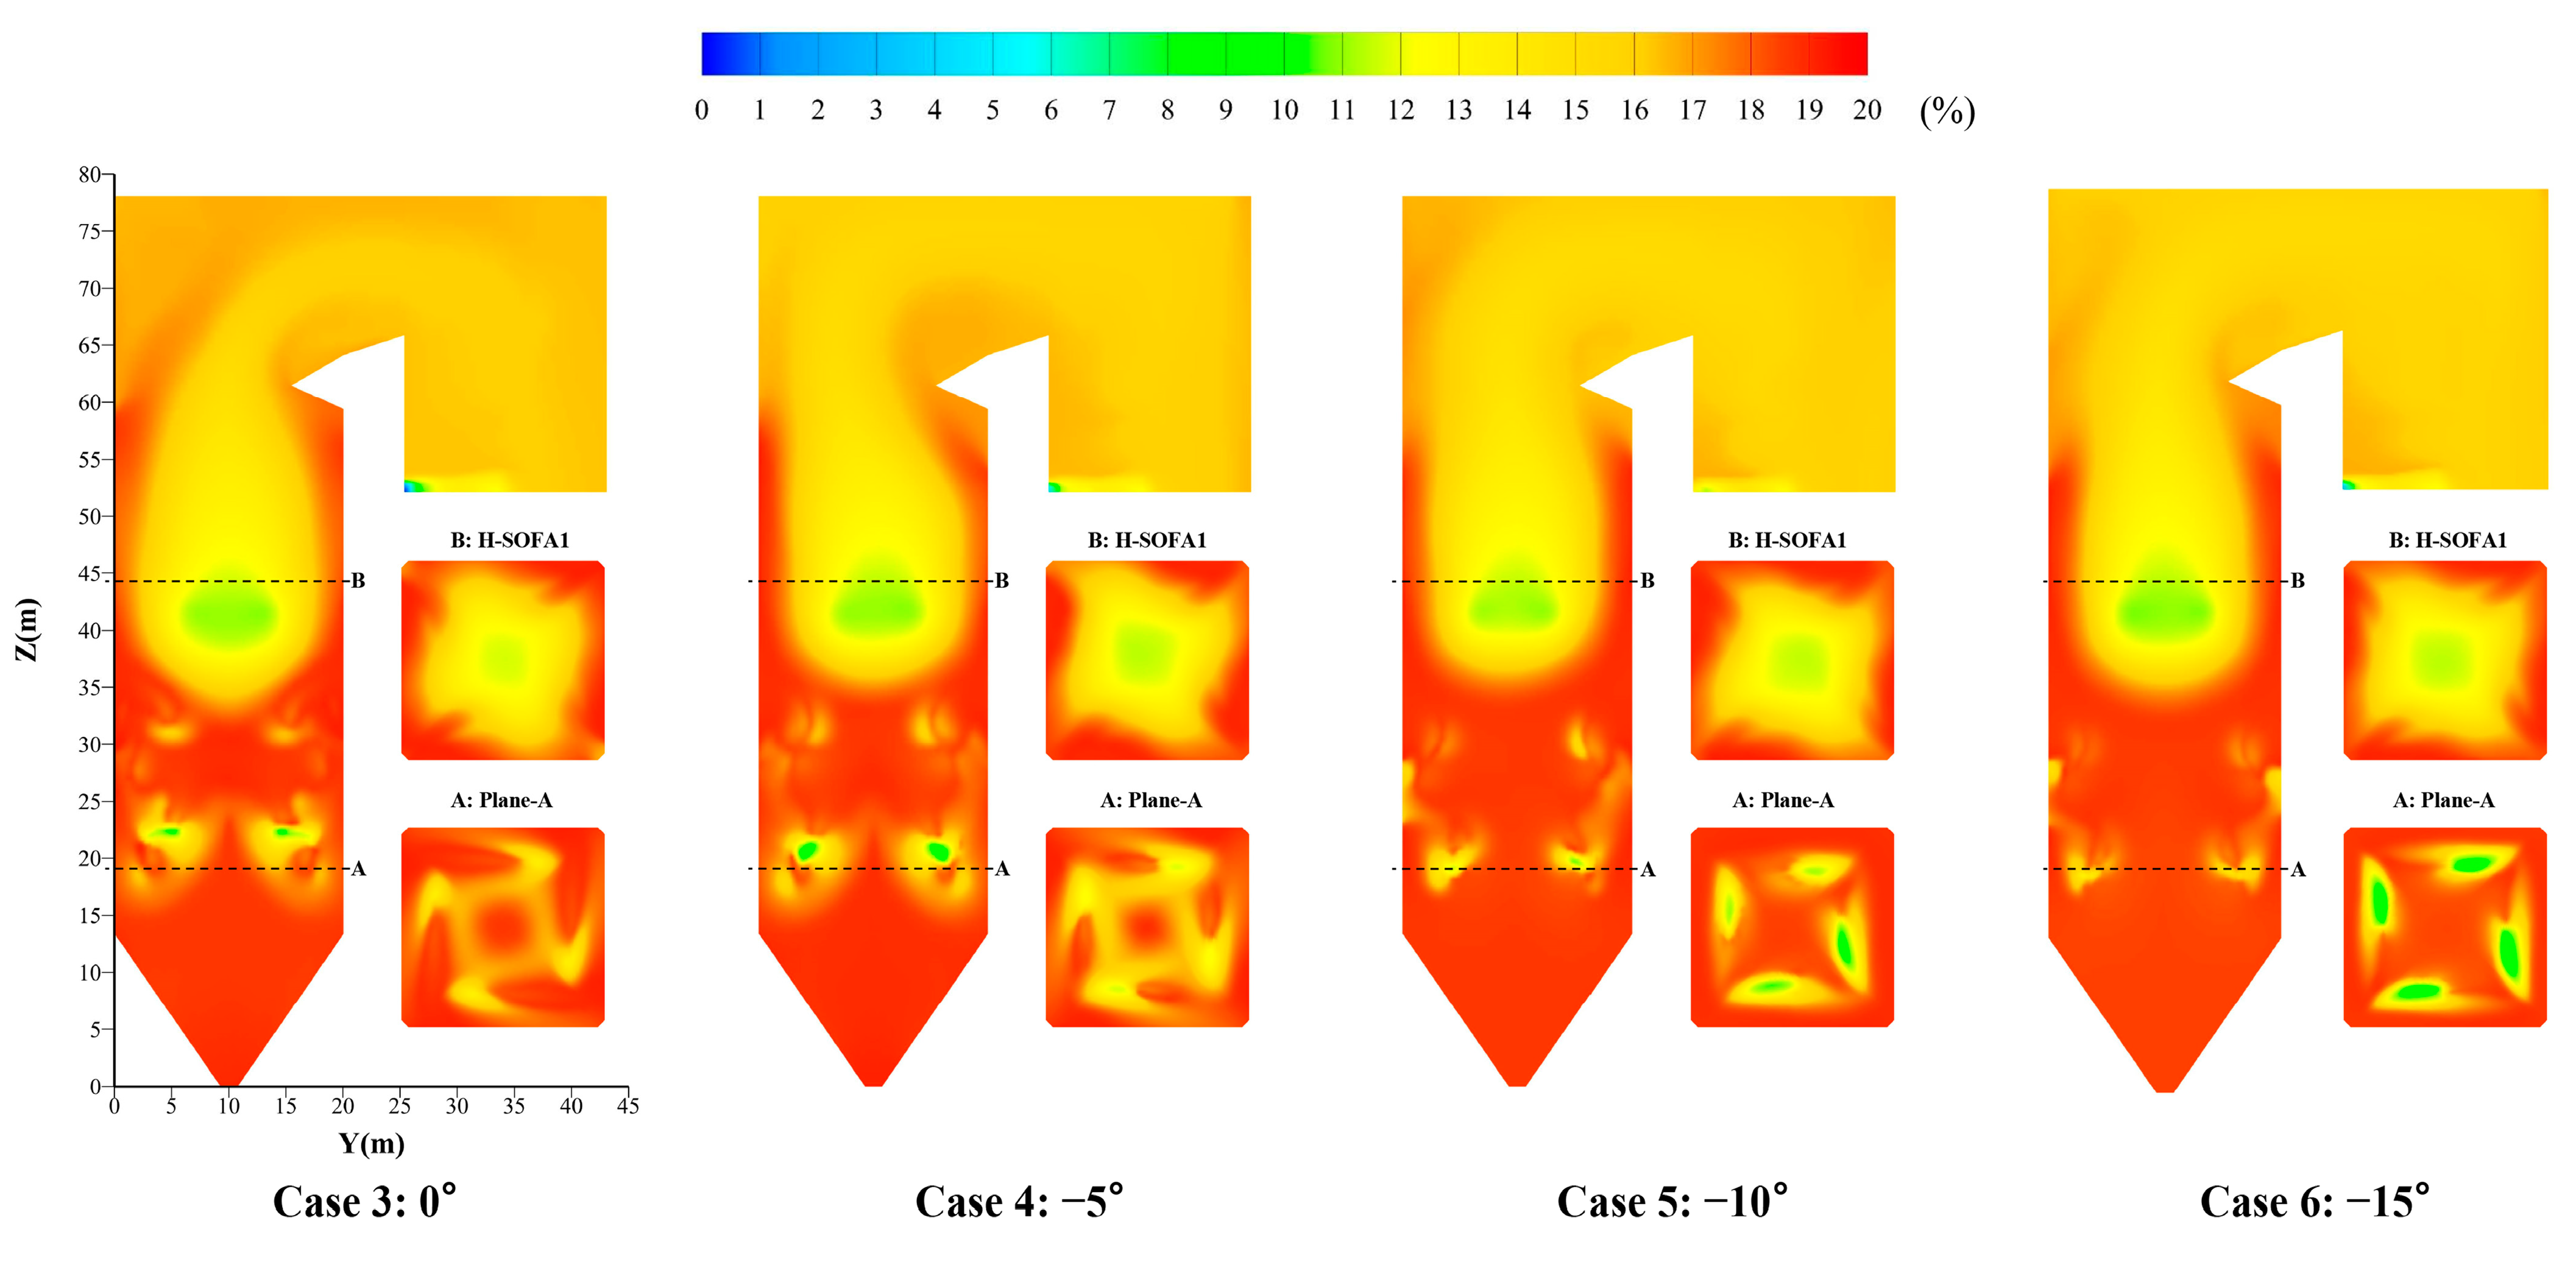
The downward deflection of the burner angle adjusts the flow field in the furnace. The eddy in the top zone current decreases and then increases. At a deflection angle of −5° (Case 4), the flow field at the top of the chamber is more uniform. At the same time, the increase in the deflection angle makes the combustion zone extend downward, which reduces the temperature fluctuation in the combustion zone.
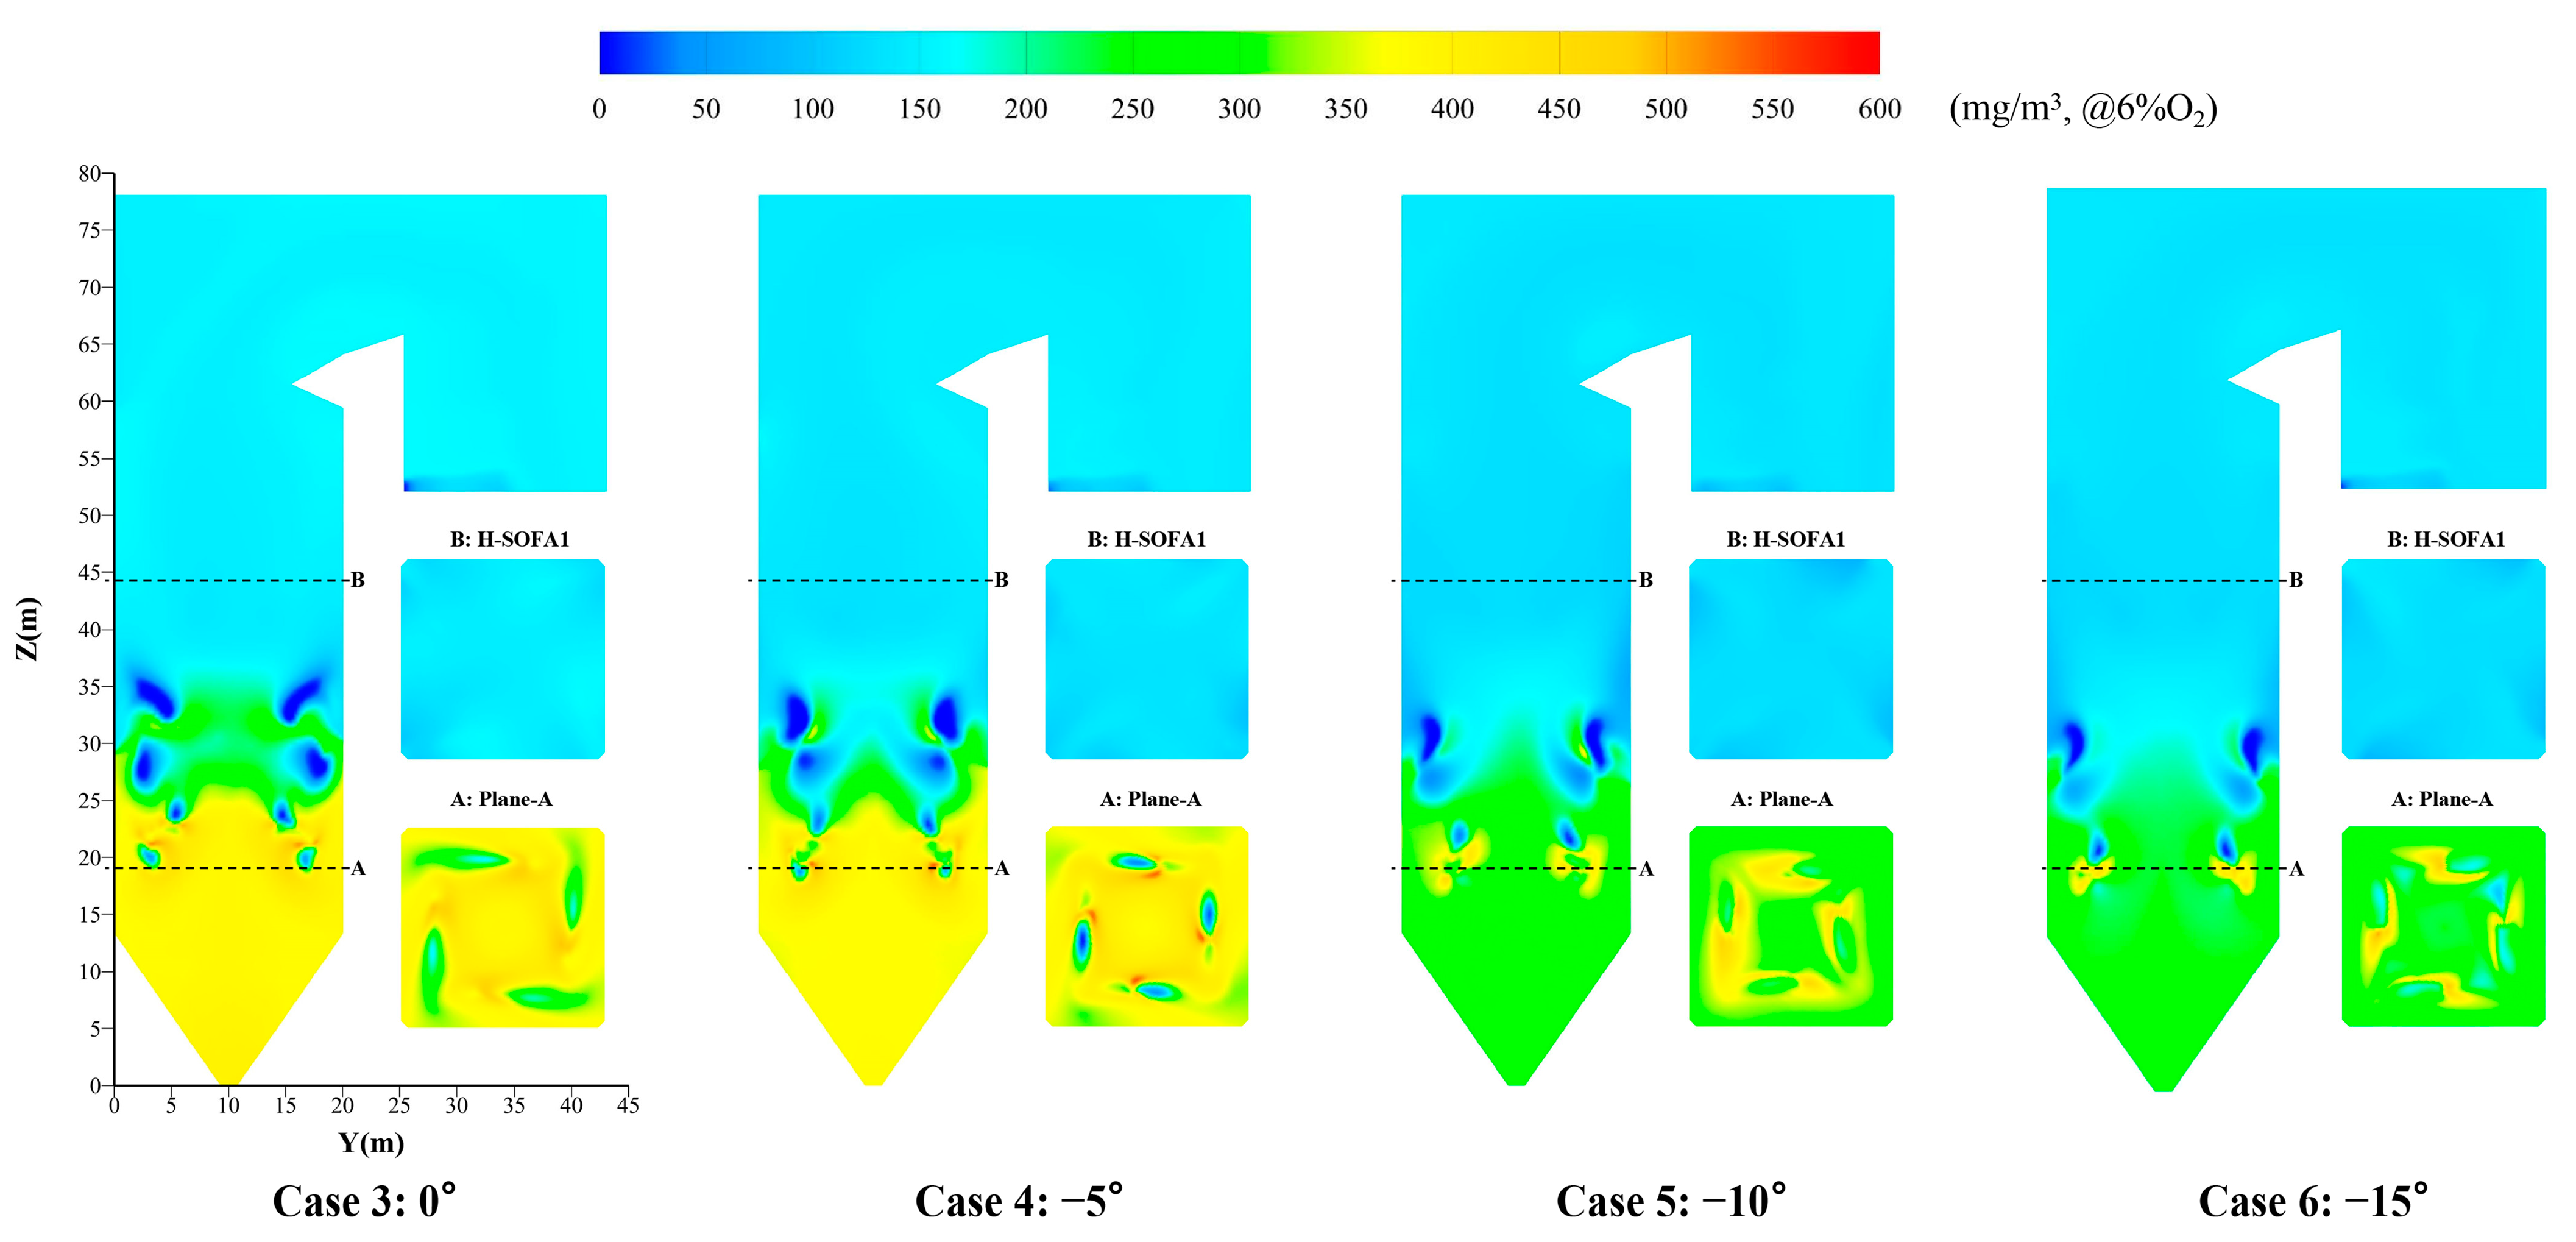
(4)
The deflection of the burner angle attenuates the mixing of pulverized coal and air. The insufficient combustion of pulverized coal makes the CO concentration higher, which effectively reduces the NOx production. In the burnout zone, adjusting the deflection angles (−5°, −10°, and −15°) in Cases 4–6 reduced the NOx concentrations in this zone by 5.8%, 11.5%, and 10.3%, respectively, compared to the NOx concentration in Case 3 without adjusting the burner angle (156 mg/m3). However, the attenuating effect of angular deflection on NOx concentration gradually decreased.
It is recommended that during low-load operation of the boiler, the NOx concentration be reduced by increasing the SOFA air ratio and moderately reducing the burner deflection angle as much as possible while maintaining stable combustion.
In the future, the operation of boilers at ultra-low loads requires focused research. At ultra-low loads (below 30%), the boiler only operates two layers of burners. There is a certain distance between the main combustion zone and the SOFA zone, so there is no need to adjust the deflection angle to reduce NOx. However, to ensure sufficient combustion of coal powder, the excess air coefficient further increases. To reduce the generation of NOx, the proportion of SOFA will further increase. The selection of SOFA ratios that can generate less NOx while maintaining stable combustion is very important. Adjusting the air distribution method and burner layout to achieve stable combustion is a key focus of future research.

Author Contributions

Writing—original draft, S.H.; writing—review and editing, H.L. All authors have read and agreed to the published version of the manuscript.

Funding

The authors appreciate the financial supports provided by the Xinjiang Regional Coordination Special Project-International Science and Technology Cooperation Program (No. 2022E01026) and the Tianshan Talent Training Program of Xinjiang-Science and Technology Innovation Team (2023TSYCTD0009).

Data Availability Statement

Data are contained within the article.

Conflicts of Interest

The authors declare no conflicts of interest.

References

  1. Li, Z.; Qiao, X.; Miao, Z. Low load performance of tangentially-fired boiler with annularly combined multiple airflows. Energy 2021, 224, 120131. [Google Scholar] [CrossRef]
  2. BP. BP Statistical Review of World Energy 2024; BP: London, UK, 2024. [Google Scholar]
  3. Nie, Y.; Zhang, G.; Zhou, Y.; Su, B.; Zhang, K.; Yao, L. Characteristics and mechanism analysis of the clean evolution of China’s power generation structure. J. Clean. Prod. 2024, 457, 142236. [Google Scholar] [CrossRef]
  4. Zhang, B.; Niu, N.; Li, H.; Wang, Z. Assessing the efforts of coal phaseout for carbon neutrality in China. Appl. Energy 2023, 352, 121924. [Google Scholar] [CrossRef]
  5. Wang, G.; Sbai, E.; Wen, L.; Sheng, S. The Impact of Renewable Energy on Extreme Volatility in Wholesale Electricity Prices: Evidence from Organisation for Economic Co-operation and Development Countries. J. Clean. Prod. 2024, 484, 144343. [Google Scholar] [CrossRef]
  6. Xu, J.; Zhang, Q.; Ye, N.; Zhang, Z.; Wu, X.; Fan, H. A review on flexible peak shaving development of coal-fired boilers in China under the carbon peak and carbon neutrality goals. Therm. Sci. Eng. Prog. 2024, 55, 103004. [Google Scholar] [CrossRef]
  7. Zhang, X.; Zhu, S.; Zhu, J.; Hui, J.; Liu, Y.; Zhang, J.; Lin, J.; Lyu, Q. Preheated combustion characteristics and fuel-nitrogen conversion paths for bituminous coal and anthracite in wide-range preheating temperature. J. Energy Inst. 2023, 108, 101222. [Google Scholar] [CrossRef]
  8. Zhang, X.; Zhu, S.; Zhu, J.; Liu, Y.; Zhang, J.; Hui, J.; Ding, H.; Cao, X.; Lyu, Q. Preheating and combustion characteristics of anthracite under O2/N2, O2/CO2 and O2/CO2/H2O atmospheres. Energy 2023, 274, 127419. [Google Scholar] [CrossRef]
  9. Životić, M.; Nikolić, N.; Stojiljković, D.; Bajuk-Bogdanović, D.; Životić, D. Devolatilization behaviour of Kolubara and Kostolac lignite (Serbia) during the combustion process: A case study. Int. J. Coal Geol. 2024, 295, 104641. [Google Scholar] [CrossRef]
  10. Wei, D.; An, D.; Wang, T.; Zhang, H.; Guo, Y.; Sun, B. Influence of fuel distribution on co-combustion of sludge and coal in a 660 MW tangentially fired boiler. Appl. Therm. Eng. 2023, 227, 120344. [Google Scholar] [CrossRef]
  11. Ding, X.; Li, W.; Liu, P.; Kang, Z. Numerical calculation on combustion process and NO transformation behavior in a coal-fired boiler blended ammonia: Effects of the injection position and blending ratio. Int. J. Hydrogen Energy 2023, 48, 29771–29785. [Google Scholar] [CrossRef]
  12. Suyatno, S.; Hariana, H.; Prismantoko, A.; Putra, H.P.; Sunyoto, N.M.S.; Darmawan, A.; Ghazidin, H.; Aziz, M. Assessment of potential tropical woody biomass for coal co-firing on slagging and fouling aspects. Therm. Sci. Eng. Prog. 2023, 44, 102046. [Google Scholar] [CrossRef]
  13. Zhang, Y.; Wu, Q.; Kang, X.; Hou, B.; Zhu, Y.; Zhou, H. Comparative experimental study on the co-firing characteristics of water electrolysis gas (HHO) and lean coal/lignite with different injection modes in a one-dimensional furnace. Fuel 2024, 378, 132968. [Google Scholar] [CrossRef]
  14. Ding, Y.; Li, D.; Zhang, X.; Lv, M.; Qin, S.; Zhao, P.; Guo, C. Research on the co-combustion characteristics and kinetics of rice husk hydrochar with anthracite. Energy 2024, 299, 131339. [Google Scholar] [CrossRef]
  15. Ni, Y.; Hu, S.; Zhang, Y.; Zhang, M.; Li, H.; Zhou, H. Research on the effects of the fly ash reburning on element migration and ash deposition characteristics of high-alkali coal in a full-scale slag-tapping boiler. Fuel 2023, 335, 126952. [Google Scholar] [CrossRef]
  16. Zhong, Y.-X.; Wang, X.; Xu, G.; Ning, X.; Zhou, L.; Tang, W.; Wang, M.-H.; Wang, T.; Xu, J.; Jiang, L.; et al. Investigation on slagging and high-temperature corrosion prevention and control of a 1000 MW ultra supercritical double tangentially fired boiler. Energy 2023, 275, 127455. [Google Scholar] [CrossRef]
  17. Novendianto, I.B.; Utomo, M.; Muchammad, M.; Kuswa, F.M.; Ghazidin, H.; Karuana, F.; Santoso, P.A.; Prismantoko, A.; Cahyo, N.; Kusmiyati, K.; et al. Investigation of the slagging and fouling aspects of co-firing coal and organic refuse-derived fuel. Therm. Sci. Eng. Prog. 2024, 49, 102447. [Google Scholar] [CrossRef]
  18. Yin, H.; Liu, X.; Li, M.; Li, C.; Li, X.; Wang, H. Integrated DNN and CFD model for real-time prediction of furnace waterwall slagging of coal-fired boiler. Fuel 2025, 383, 133847. [Google Scholar] [CrossRef]
  19. Chen, B.; Xiong, Z.; Zhao, Y.; Zhang, J. Transformation of Mg-bearing minerals and its effect on slagging during the high-alkali coal combustion. Fuel Process. Technol. 2025, 267, 108166. [Google Scholar] [CrossRef]
  20. Kang, W.; Jo, H.; Lee, J.; Jang, K.; Ryu, C. Numerical investigations on overfire air design for improved boiler operation and lower NOx emission in commercial wall-firing coal power plants. Appl. Therm. Eng. 2023, 219, 119604. [Google Scholar] [CrossRef]
  21. Chang, J.; Ma, X.; Wang, X.; Li, X. CPFD modeling of hydrodynamics, combustion and NOx emissions in an industrial CFB boiler. Particuology 2023, 81, 174–188. [Google Scholar] [CrossRef]
  22. Tong, Y.; Gao, J.; Yue, T.; Liu, J.; Yuan, Y. Spatio-temporal heterogeneity and synergistic effects of air pollutants and CO2 emissions from Chinese coal-fired industrial boilers. Resour. Conserv. Recycl. 2024, 204, 107504. [Google Scholar] [CrossRef]
  23. Su, K.; Ouyang, Z.; Li, S.; Chen, Q.; Wang, H.; Ding, H.; Wang, W. Exploration on deep pulverized coal activation and ultra-low NOx emission strategies with novel purifying-combustion technology. Energy 2024, 313, 133814. [Google Scholar] [CrossRef]
  24. Ma, D.; Zhang, S.; He, X.; Ding, X.; Li, W.; Liu, P. Combustion stability and NOx emission characteristics of three combustion modes of pulverized coal boilers under low or ultra-low loads. Appl. Energy 2024, 353, 121998. [Google Scholar] [CrossRef]
  25. Wang, Y.; Zhou, Y.; Bai, N.; Han, J. Experimental investigation of the characteristics of NOx emissions with multiple deep air-staged combustion of lean coal. Fuel 2020, 280, 118416. [Google Scholar] [CrossRef]
  26. Szufa, S.; Piersa, P.; Junga, R.; Błaszczuk, A.; Modliński, N.; Sobek, S.; Marczak-Grzesik, M.; Adrian, Ł.; Dzikuć, M. Numerical modeling of the co-firing process of an in situ steam-torrefied biomass with coal in a 230 MW industrial-scale boiler. Energy 2023, 263, 125918. [Google Scholar] [CrossRef]
  27. Yuan, Z.; Chen, Z.; Zhang, B.; Gao, X.; Li, J.; Qiao, Y.; Li, Z. Study on the slagging trends of the pre-combustion chamber in industrial pulverized coal boiler under different excess air coefficients by CFD numerical simulation. Energy 2023, 264, 126184. [Google Scholar] [CrossRef]
  28. Bian, C.; Huang, J.; Sun, R. Numerical optimization of combustion and NOX emission in a retrofitted 600MWe tangentially-fired boiler using lignite. Appl. Therm. Eng. 2023, 226, 120228. [Google Scholar] [CrossRef]
  29. Zima, W.; Grądziel, S.; Cebula, A.; Rerak, M.; Kozak-Jagieła, E.; Pilarczyk, M. Mathematical model of a power boiler operation under rapid thermal load changes. Energy 2023, 263, 125836. [Google Scholar] [CrossRef]
  30. Taler, J.; Trojan, M.; Dzierwa, P.; Kaczmarski, K.; Węglowski, B.; Taler, D.; Zima, W.; Grądziel, S.; Ocłoń, P.; Sobota, T.; et al. The flexible boiler operation in a wide range of load changes with considering the strength and environmental restrictions. Energy 2023, 263, 125745. [Google Scholar] [CrossRef]
  31. Zhu, S.; Hui, J.; Lyu, Q.; Ouyang, Z.; Liu, J.; Zhu, J.; Zeng, X.; Zhang, X.; Ding, H.; Liu, Y.; et al. Experimental study on pulverized coal combustion preheated by a circulating fluidized bed: Preheating characteristics for peak shaving. Fuel 2022, 324, 124684. [Google Scholar] [CrossRef]
  32. Ma, D.; Zhang, S.; He, X.; Zhang, J.; Ding, X. Combustion stability and NOX emission characteristics of a 300 MWe tangentially fired boiler under ultra-low loads with deep-air staging. Energy 2023, 269, 126795. [Google Scholar] [CrossRef]
  33. Du, H.; Li, Z.; Liu, Z.; Zhang, M.; Huang, C.; Jiang, G.; Chen, Z.; Song, J.; Fang, F.; Su, J.; et al. Industrial measurement of combustion and NOx formation characteristics on a low-grade coal-fired 600MWe FW down-fired boiler retrofitted with novel low-load stable combustion technology. Fuel 2022, 321, 123926. [Google Scholar] [CrossRef]
  34. Jin, W.; Si, F.; Kheirkhah, S.; Yu, C.; Li, H.; Wang, Y.O. Numerical study on the effects of primary air ratio on ultra-low-load combustion characteristics of a 1050 MW coal-fired boiler considering high-temperature corrosion. Appl. Therm. Eng. 2023, 221, 119811. [Google Scholar] [CrossRef]
  35. Fan, H.J.; Zhang, Z.X.; Dong, J.C.; Xu, W. China’s R&D of advanced ultra-supercritical coal-fired power generation for addressing climate change. Therm. Sci. Eng. Prog. 2018, 5, 364–371. [Google Scholar]
  36. Lu, H.; Huang, S.; Li, H.; Cheng, Z.; Chang, X.; Dong, L.; Kong, D.; Jing, X. Numerical simulation of combustion characteristics in a 660 MW tangentially fired pulverized coal boiler subjected to peak-load regulation. Case Stud. Therm. Eng. 2023, 49, 103168. [Google Scholar] [CrossRef]
  37. Shih, T.-H.; Liou, W.W.; Shabbir, A.; Yang, Z.; Zhu, J. A new k-ϵ eddy viscosity model for high reynolds number turbulent flows. Comput. Fluids 1995, 24, 227–238. [Google Scholar] [CrossRef]
  38. Jiang, Y.; Lee, B.-H.; Oh, D.-H.; Jeon, C.-H. Influence of various air-staging on combustion and NOX emission characteristics in a tangentially fired boiler under the 50% load condition. Energy 2022, 244, 123167. [Google Scholar] [CrossRef]
  39. Inc, F. Ansys Fluent Theory Guide; Fluent Inc.: New York, NY, USA, 2023. [Google Scholar]
  40. Kobayashi, H.; Howard, J.B.; Sarofim, A.F. Coal devolatilization at high temperatures. Symp. (Int.) Combust. 1977, 16, 411–425. [Google Scholar] [CrossRef]
  41. Baum, M.; Street, P. Predicting the combustion behaviour of coal particles. Combust Sci. Technol. 1971, 3, 231–243. [Google Scholar] [CrossRef]
  42. Sazhin, S.S.; Sazhina, E.M.; Faltsi-Saravelou, O.; Wild, P. The P-1 model for thermal radiation transfer: Advantages and limitations. Fuel 1996, 75, 289–294. [Google Scholar] [CrossRef]
  43. Anetor, L.; Odetunde, C.; Osakue, E.E. Computational analysis of the extended Zeldovich mechanism. Arab. J. Sci. Eng. 2014, 39, 8287–8305. [Google Scholar] [CrossRef]
  44. De Soete, G.G. Overall reaction rates of NO and N2 formation from fuel nitrogen. Symp. (Int.) Combust. 1975, 15, 1093–1102. [Google Scholar] [CrossRef]
  45. Liu, S.; Fan, W. Formation characteristics of NO and N2O during air-staged combustion of pulverized coal. Fuel 2024, 372, 132093. [Google Scholar] [CrossRef]
Figure 1. (a) Boiler geometry; (b) layout of burners; (c) plane diagram of main burners; (d) plane diagram of SOFA burners.
Processes 12 02823 g001
Figure 2. The formation mechanism of fuel NO.
Processes 12 02823 g002
Figure 3. (a) Overall schematic of the grid; (b) vertical section of the boiler and cross-section of the main combustion zone.
Processes 12 02823 g003
Figure 4. Mesh independence validation.
Processes 12 02823 g004
Figure 5. The flow field under different SOFA ratios.
Processes 12 02823 g005
Figure 6. Temperature distribution under different SOFA ratios.
Processes 12 02823 g006
Figure 7. O2 distribution under different SOFA ratios.
Processes 12 02823 g007
Figure 8. The temperature variation in the height direction under different SOFA ratios.
Processes 12 02823 g008
Figure 9. CO distribution under different SOFA ratios.
Processes 12 02823 g009
Figure 10. CO2 distribution under different SOFA ratios.
Processes 12 02823 g010
Figure 11. NOx distribution under different SOFA ratios.
Processes 12 02823 g011
Figure 12. (a) The O2 concentration distribution under different SOFA ratios; (b) the CO concentration distribution under different SOFA ratios; (c) the CO2 concentration distribution under different SOFA ratios; (d) the NOx concentration distribution under different SOFA ratios.
Processes 12 02823 g012
Figure 13. The flow field under different burner angles.
Processes 12 02823 g013
Figure 14. Velocity distribution in the cross-section under different burner angles.
Processes 12 02823 g014
Figure 15. Temperature distribution under different burner angles.
Processes 12 02823 g015
Figure 16. Temperature distribution in the cross-section under different burner angles.
Processes 12 02823 g016
Figure 17. The temperature variation in the height direction under different burner angles.
Processes 12 02823 g017
Figure 18. O2 distribution under different burner angles.
Processes 12 02823 g018
Figure 19. CO distribution under different burner angles.
Processes 12 02823 g019
Figure 20. CO2 distribution under different burner angles.
Processes 12 02823 g020
Figure 21. NOx distribution under different burner angles.
Processes 12 02823 g021
Figure 22. (a) The O2 concentration distribution under different burner angles; (b) the CO concentration distribution under different burner angles; (c) the CO2 concentration distribution under different burner angles; (d) the NOx concentration distribution under different burner angles.
Processes 12 02823 g022
Table 1. Analyses of coal properties.
Proximate (As Received, wt%)Coal 1Coal 2Ultimate (As Received, wt%)Coal 1Coal 2
Moisture28.8017.00Carbon53.8739.94
Ash3.2829.81Hydrogen2.242.00
Volatile21.0320.13Oxygen10.9910.64
Fixed carbon46.8933.06Nitrogen0.420.41
Net heating value (MJ/kg)18.7413.86Sulfur0.40 0.20
Table 2. Main parameters under various loads.
Load Condition100% Load50% Load
Total air flow (t/h)2210.201347.95
Primary air flow (t/h)590.12409.08
Secondary air flow (t/h)1120.57566.84
Over-fire air flow (t/h)499.51372.03
Total coal flow (t/h)332.38177.36
Primary air temperature (K)338.15338.15
Secondary air temperature (K)638.15585.15
Blending ratio (%)60.00100.00
Excess air ratio1.141.67
Layer of burnersBCDEFBCDE
Table 3. Thermal data of the boiler.
Load Condition 100% Load50% Load
Main steam flowt/h2030.00915.74
Main steam outlet pressureMPa.g28.2513.81
Main steam outlet temperature°C605.00605.00
Feed-water pressureMPa.g32.0515.70
Feed-water temperature°C303.00255.30
Separator pressureMPa.g30.1014.70
Reheat steam flowt/h1637.22782.13
Reheat steam outlet pressureMPa.g5.802.75
Reheat steam outlet temperature°C603.00590.00
Reheat steam inlet pressureMPa.g6.002.85
Reheat steam inlet temperature°C360.00370.30
Flue gas temperature at air preheater inlet°C396.00363.00
Exhaust gas temperature°C134.00124.00
Exhaust gas temperature (revised)°C130.00118.00
Carbon loss%0.300.80
Boiler thermal efficiency%94.0593.93
Table 4. Simulation mathematical models [37,38,39,40,41,42,43,44].
TermsModelsNumerical Descriptions
Turbulence modelRealizable k-ɛ ( ρ k ) t + ( ρ k u j ) x i = x i μ + μ t σ k k x j   + G k + G b ρ ε Y M + S k
( ρ ε ) t + ( ρ ε u j ) x j = x j μ + μ t σ ε ε x j   + C 1 ε ρ S ε C 2 ε ρ ε 2 k + ν ε + μ t = ρ C μ k 2 ε C 1 ε ε k C 3 ε G b + S ε
Gas–solid modelParticle trajectory m p d u i p d t = C D ρ g ( A p 2 ) ( u i g ¯ + u i g u i p ) u i g ¯ + u i g u i p + m p g k
Volatiles combustionEddy-dissipation C 1.57 H 1.76 O 0.54 N 0.0237 S 0.0098 + 0.96 O 2 = 1.57 CO + 0.88 H 2 O + CO + 0.5 O 2 = CO 2 0.0118 N 2 + 0.0098 SO 2
Coal devolatilizationTwo-competing-rates R i = A i e ( E i / T p )   ( i = 1 , 2 )
m v ( t ) ( 1 f w , 0 ) m p , 0 m a = 0 t ( α 1 R 1 + α 2 R 2 ) exp 0 t ( R 1 + R 2 ) d t d t
Char combustionDiffusion/kinetic-limited D 0 = C 1 T p + T / 2 0.75 d p ;   R = C 2 e ( E / T p )
d m p d t = π d p 2 p o x D 0 R D 0 + R
Radiation modelP-1 q r = 1 3 ( a + σ s ) C σ s G
1 3 a + σ s C σ s G a G + 4 a σ T 4 = S G
q r = a G 4 a σ T 4
NO modelThermal NO O + N 2 k r 1 k f 1 N + N O
O 2 + N k r 2 k f 2 O + N O
Fuel NOAs shown in Figure 2
Table 5. Validation of simulation results at full load and half load.
Load Condition 100% Load50% Load
The gas temperature at the bottom of the DPSH (K)Simulated1479.491146.16
Measured1423.151198.78
Relative error3.96%−4.39%
The gas temperature at the side of the FSH and FRH (K)Simulated1132.67942.40
Measured1183.55973.64
Relative error−4.30%−3.21%
Furnace outlet of O2 (vol%)Simulated2.753.07
Measured2.73/
Designed/3.00
Relative error0.73%2.33%
5
Furnace outlet of NOx (mg/m3, @6%O2)Simulated157.02151.60
Measured152.37150.18
Relative error3.05%0.94%
Table 6. Different SOFA ratios and burner deflection angles for the cases.
Case NameCase 1Case 2Case 3Case 4Case 5Case 6
SOFA ratio17.5%22.5%27.5%27.5%27.5%27.5%
Angle of burner−5°−10°−15°
Disclaimer/Publisher’s Note: The statements, opinions and data contained in all publications are solely those of the individual author(s) and contributor(s) and not of MDPI and/or the editor(s). MDPI and/or the editor(s) disclaim responsibility for any injury to people or property resulting from any ideas, methods, instructions or products referred to in the content.

