Article

Effect of Volumetric Flow Rate on Heat Transfer Characteristics of Single-Fractured Rock with Different Surface Morphology and External Temperature

1
College of Civil Engineering and Architecture, Shandong University of Science and Technology, Qingdao 266590, China
2
School of Engineering, Nagasaki University, 1-14 Bunkyo-machi, Nagasaki 8528521, Japan
*
Author to whom correspondence should be addressed.
Processes 2024, 12(12), 2821; https://doi.org/10.3390/pr12122821
Submission received: 7 November 2024 / Revised: 27 November 2024 / Accepted: 5 December 2024 / Published: 9 December 2024
(This article belongs to the Section Chemical Processes and Systems)

Abstract

:
The primary aim of this study is to explore how varying flow rates impact the heat transfer in single fractures, taking into account the effects of surface roughness, aperture and external temperature of the rock. Utilizing COMSOL Multiphysics, the fluid flow and heat transfer through 3D fracture models characterized by different roughness and apertures were simulated with volumetric flow rates ranging from 1 × 10⁻⁶ m3/s to 1 × 10⁻⁵ m3/s. The combined effects of these factors on key metrics, including outlet temperature, thermal breakthrough time, energy extraction efficiency, and heat transfer coefficients were systematically analyzed. The results indicate that water flow rate dominantly influences heat transfer, followed by fracture surface morphology and rock external temperature. Higher flow rates enhance both heat transfer and total heat extraction, while also increasing temperature non-uniformity, which improves overall heat extraction efficiency. Surface roughness significantly affects temperature distribution, leading to heterogeneous thermal profiles, especially in narrower fractures. Additionally, higher external temperatures and flow rates facilitate faster thermal breakthroughs by reducing thermal resistance. The interplay between surface roughness and thermal breakthrough time is intricate, with increased roughness prolonging breakthrough times in smaller apertures but potentially reducing them in larger ones. At smaller apertures, increasing the JRC from 2.29 to 17.33 results in a 1.01 to 1.20 times increase in thermal breakthrough time, whereas at larger apertures, thermal breakthrough time decreases by a factor of 1.01 to 1.29. This highlights the importance of carefully selecting fluid parameter in the design of geothermal projects to optimize heat extraction efficiency.

1. Introduction

With the global population growth and rapid technological advancements, the demand for new energy sources and environmental concerns have become increasingly prominent, making the use of innovative clean energy a key global development objective. As a renewable clean energy source, geothermal energy has broad potential for development [1,2], categorized into shallow geothermal and enhanced geothermal systems. The former is relatively mature, with technologies like ground-source heat pumps widely applied. Research on enhanced geothermal systems (EGS) is still lagging behind, in which predicting thermal energy output and assessing the potential of dry hot rock geothermal systems remain major challenges for the geothermal industry. In dry hot rock geothermal exploitation, fractures serve as primary fluid seepage channels promoting heat exchange. Therefore, accurately understanding the heat transfer properties of fluids within fracture channels is an essential issue for the extraction of dry hot rock geothermal reservoirs [3,4].
Natural rock fractures typically form complex networks with a large number of single fractures. Understanding the flow and heat exchange characteristics of fluid within a single fracture is foundational to studying heat transfer in fracture networks [5]. To date, researchers have investigated water flow and heat transfer characteristics in fracture channels using analytical, experimental, and numerical simulation methods [6,7,8,9,10]. Due to limited conditions, most early seepage-heat transfer experiments were conducted in laminar flow states within smooth, planar fractures, yielding theoretical or empirical formulas. However, considering the geometric complexity of fracture surfaces, heat exchange efficiency differs significantly between smooth planar fractures and natural rough ones [11,12,13,14,15]. Therefore, to incorporate the geometrical morphology of natural fractures, seepage-heat transfer experiments should be conducted on fractures with rough and undulating surfaces [7,16]. Zhao and Tso [17] conducted heat transfer experiments on rough-walled fractures of high-temperature granite, confirming that traditional planar fracture heat transfer models are unsuitable for rough fractures. Ma et al. [18] performed similar tests, showing that roughness affects thermal convection; the greater the roughness, the less thermal convection occurs. Bai et al. [19,20] systematically conducted water flow and heat transfer tests on single fractures under varying confining pressures. An empirical model for heat transfer coefficients was proposed. The results indicate that the fracture aperture is inversely proportional to the heat transfer coefficient, meaning that a larger aperture tends to reduce the heat transfer. He et al. [21,22] developed a two-dimensional heat transfer model to study the relationship between local convective heat transfer coefficients and fracture morphology. Zhang et al. [23] demonstrated that the average heat transfer coefficient increases with fracture surface roughness, and the local heat transfer coefficient strongly correlates with the undulations and fluctuations of the fracture surface. Moreover, researchers have also focused on the variations in hydraulic aperture and fracture permeability under coupled thermal–hydraulic–mechanical–chemical (THMC) processes. [9,24,25].
In addition to the fracture geometrical characteristic, the water flow rate is another critical factor affecting the heat transfer. Zhang et al. [26] modeled rough fracture surfaces based on CT scans, and conducted numerical simulations of supercritical CO2 in rough fractures, showing that at higher mass flow rates, heat transfer is enhanced, and the heat transfer performance within rough fractures is jointly determined by dominant channel paths and their tortuosity. Chen et al. [27] simulated the macroscopic fluid flow and heat transfer in fractured geothermal reservoirs under different flow rates, and calculated equivalent heat transfer coefficients, which were subsequently applied to larger-scale fracture network models. The simulation results reveal that increases in fluid flow rate and fracture roughness lead to elevated equivalent heat transfer coefficients. This conclusion is consistent with findings from experimental studies by Li et al. [8]. Yao et al. [28] developed a non-Darcian flow–thermal coupling model to simulate the heat transfer processes in fractured rock masses. It was observed that the impact of non-Darcian flow on the heat transfer process becomes more pronounced with increases in hydraulic gradient or equivalent hydraulic aperture. Mohais et al. [29] investigated fluid flow and heat transfer issues in horizontal single-fracture channels at different temperatures, concluding that flow rate and heat transfer curves are closely related to channel width, permeability, and slip coefficient. Frank et al. [30] analyzed the effect of flow rates on the transient heat transfer in a sandstone rough fracture under heating–cooling cycles. Their findings reveal that heat transfer efficiency significantly decreases when flow rates exceed 200 mm/s.
The heat transfer characteristic is also affected by the temperature of the rock matrix. Jiang et al. [31] conducted experimental research on the laminar convective heat transfer of CO2 at supercritical pressure in horizontal fractures, and revealed the effect of the experimental temperature on the heat transfer within structural surfaces and fluids. Huang et al. [32] conducted repeatable permeation heat transfer experiments with distilled water, and quantified the time-dependent changes in the temperature of the fracture surface under various initial rock temperatures and flow rates. Using temperature sensors and infrared thermography, Luo et al. [33] investigated the impacts of temperature and injection pressure on the thermal exchange efficiency of high-temperature rock samples. They found that increasing rock temperature or reducing injection pressure raises the temperature at the same location, resulting in an enhanced energy exchange rate. Asai et al. [34] designed seven different fluid injection schemes under a constant injection temperature to study the effects of these schemes on the thermal extraction rates of EGS reservoirs. They concluded that exponential flow injection is the optimal choice for increasing yield, with the heat absorption per unit volume of water increasing as total circulating water volume decreases.
Current research on water flow–heat transfer models of single fractured rock masses has yielded certain achievements, but most simulations focus on two-dimensional analyses, considering single or dual factors to perform parameter analysis of the temperature field. Few studies have comprehensively considered multiple influencing factors, including the external surface temperature of the rock, the flow regime, and fracture geometrical characteristics, e.g., surface roughness and aperture. The main objective of this study is to investigate how the varying flow rate influences the heat transfer through single fractures integrated with the impacts of surface roughness, aperture and rock external surface temperature. For this purpose, two geologically realistic fracture surfaces were established and utilized to constitute three-dimensional (3D) fracture models with different roughness and apertures. The fluid flow and heat transfer through the fractures were simulated using the COMSOL Multiphysics 6.2 software with the volumetric flow rate ranging from 1 × 10⁻⁶ m3/s to 1 × 10⁻⁵ m3/s. The combined effects of rock external surface temperature, surface roughness, fracture aperture, and water flow rate on fluid seepage-heat transfer within single fractures were systematically investigated. Furthermore, the evolution of outlet temperature, thermal breakthrough time, energy extraction efficiency, and heat transfer coefficients with different influencing factors were quantified.

2. Theoretical Background

2.1. Governing Equations

Due to the minimal variation in fluid temperature observed in the simulations, it is assumed that there are no phase changes in the fluid during the flow process, and that both the density and viscosity of the fluid remain constant.
The single-phase water flow in the fracture follows the Navier–Stokes (N-S) equation, written as
ρ u · u   = - P + μ 2 u
where u is the velocity vector, and P is the fluid pressure.
The continuity equation can be expressed as
ρ u   = 0
Two commonly used continuum mechanical approaches for describing heat transport in media are local thermal equilibrium (LTE) and local thermal non-equilibrium (LTNE). The LTE theory assumes that the temperature of the fracture surface is in equilibrium with the fluid at that location, allowing the temperature distribution of both the rock and fluid to be represented by a single equation. In contrast, the LTNE formulation employs two distinct energy equations to describe heat transfer in the fluid and rock matrix separately. Compared to LTE, the LTNE approach provides a more accurate representation of heat transfer between the fracture surface and the fluid. Consequently, the LTNE method is utilized in this paper to model heat transfer.
In the context of convection, heat is transported through convection in the fluid, conduction within the fluid, and conduction in the rock. The energy conservation equation for the rock is expressed as
ρ r C r T r t + · q r T A r h ( T f T r ) = 0
where ρ r C r is the solid density multiplied by specific heat, q r T is the specific heat flux in the rock, Ar is the contact area per unit volume of solid, and Tr and Tf are the temperature of the rock and fluid, respectively.
The energy conservation equation of the fluid in the fracture is expressed as
ρ f C f T f t + · q f T + ρ f C f q f · T f + A f h ( T f T r ) = 0
where ρ f C f is the fluid density multiplied by specific heat, q f T is the specific heat flux in the fluid, qf is the specific fluid discharge, Af is the contact area per unit fluid volume, and h is the heat transfer coefficient.
The heat transport by conduction in the fracture fluid and rock observe Fourier’s law,
q r T = - k r T T
q f T = - k f T T
where k r T and k f T are the rock thermal conductivity and fluid thermal conductivity, respectively.

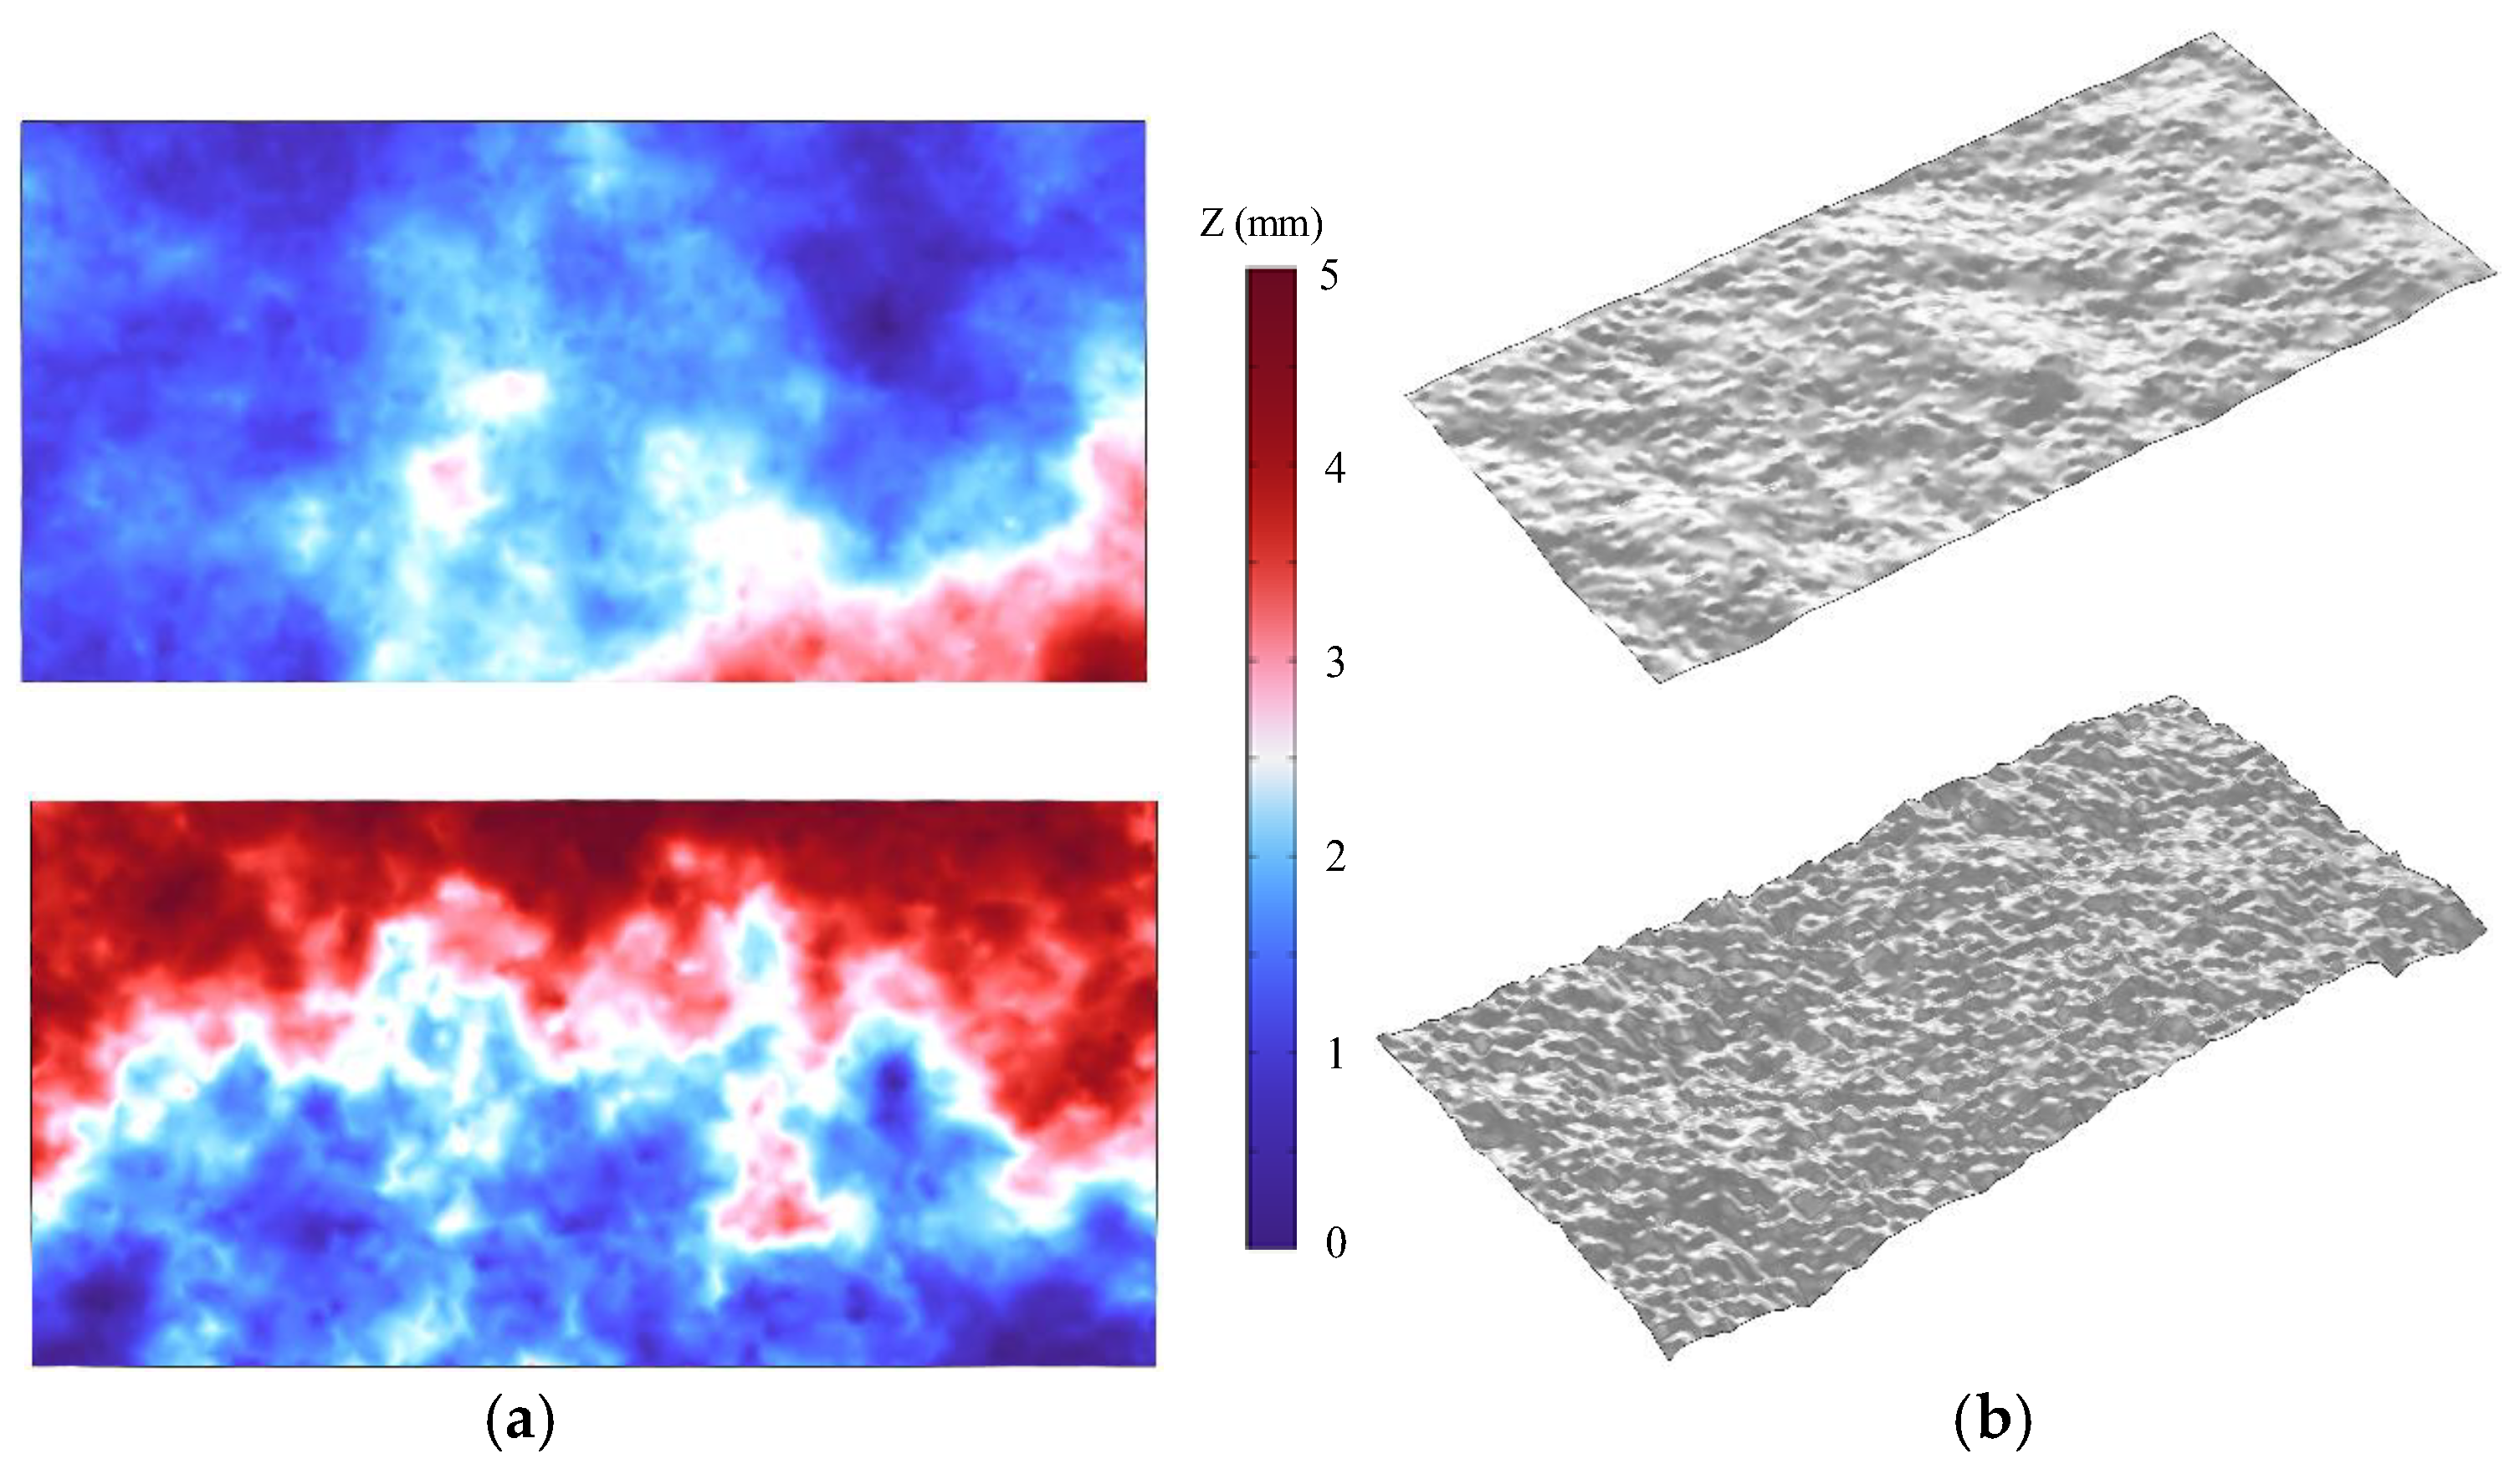
2.2. Generation of Rough Fracture Surface

The surfaces of natural rock fractures are typically rough and exhibit a self-affine fractal distribution, which can be modeled using fractional Brownian motion (fBm) [35]. Various methods have been proposed for generating fracture surfaces using fBm, including successive random addition (SRA), Weierstrass Mandelbrot function randomization, and Fourier transform [36,37]. In this study, the SRA algorithm is employed to simulate the heterogeneity of fracture surfaces due to its simplicity and efficiency.
In 2D fBm, the continuous single-valued function Z(x, y) represents the aperture asperity height of a fracture wall. The stationary increment [Z(x + lx, y + ly) − Z(x, y)] over the distance (lag) l follows a Gaussian distribution with a mean of zero and a variance of σ2 [38,39]. The statistical self-affine property of fBm increments can be expressed as
Z ( x + rl x ,   y + rl y ) - Z ( x ,   y ) = 0
σ 2 ( r ) = r 2 H σ 2 ( 1 )
where 〈 • 〉 represents the mathematical expectation, H is the roughness exponent or Hurst exponent varying from 0 to 1 and related to the 3D fractal dimension (Df) by Df = 3 − H [40,41], r is a constant, and σ2 is the variance, defined as
σ 2 ( r ) = [ Z ( x + rl x ,   y + rl y ) - Z ( x ,   y ) ] 2
Liu et al. [42] developed a modified successive random addition (SRA) algorithm to generate 3D self-affine surfaces of fractures, addressing the issue of generating random fractal distributions with poor correlation inherent in traditional algorithms. In this study, two 3D self-affine surfaces with Hurst exponents of H = 0.50 and 0.65 were generated using the modified SRA algorithm proposed by Liu et al. [42], as illustrated in Figure 1. The detailed steps of the modified SRA algorithm are outlined in the earlier work by Liu et al. [42], and readers are referred to that study for further details. A larger Hurst exponent results in smoother fracture surfaces, while a smaller value yields rougher surfaces. The generated surfaces measure 250 mm × 125 mm and consist of 501 points along the x-direction and 251 points along the y-direction, with an interval of 0.5 mm.
The joint roughness coefficient (JRC) for the fracture profile is calculated using the formula proposed by Tse and Cruden [43],
JRC = 32.2 + 32.47 log Z 2
where Z2 is the root mean square of the slope of the fracture profile, and can be expressed in the discrete form
Z 2 = 1 ( n - 1 ) ( y ) 2 i = 1 n - 1 ( z i + 1 z i ) 2 1 2
where n is the number of sampling points along the length of a fracture, zi is the asperity height at point i, and ∆y is the interval of the data points. The average of JRC values for a series of profiles along a surface in the direction parallel to flow fluid direction is calculated, and their average value is regarded as the JRC of a 3D single fracture. The JRC values of the two rough fracture surfaces in this study are calculated to be 2.29 and 17.33 (denoted as JRC1 and JRC2), respectively, corresponding to H = 0.65 and 0.50.

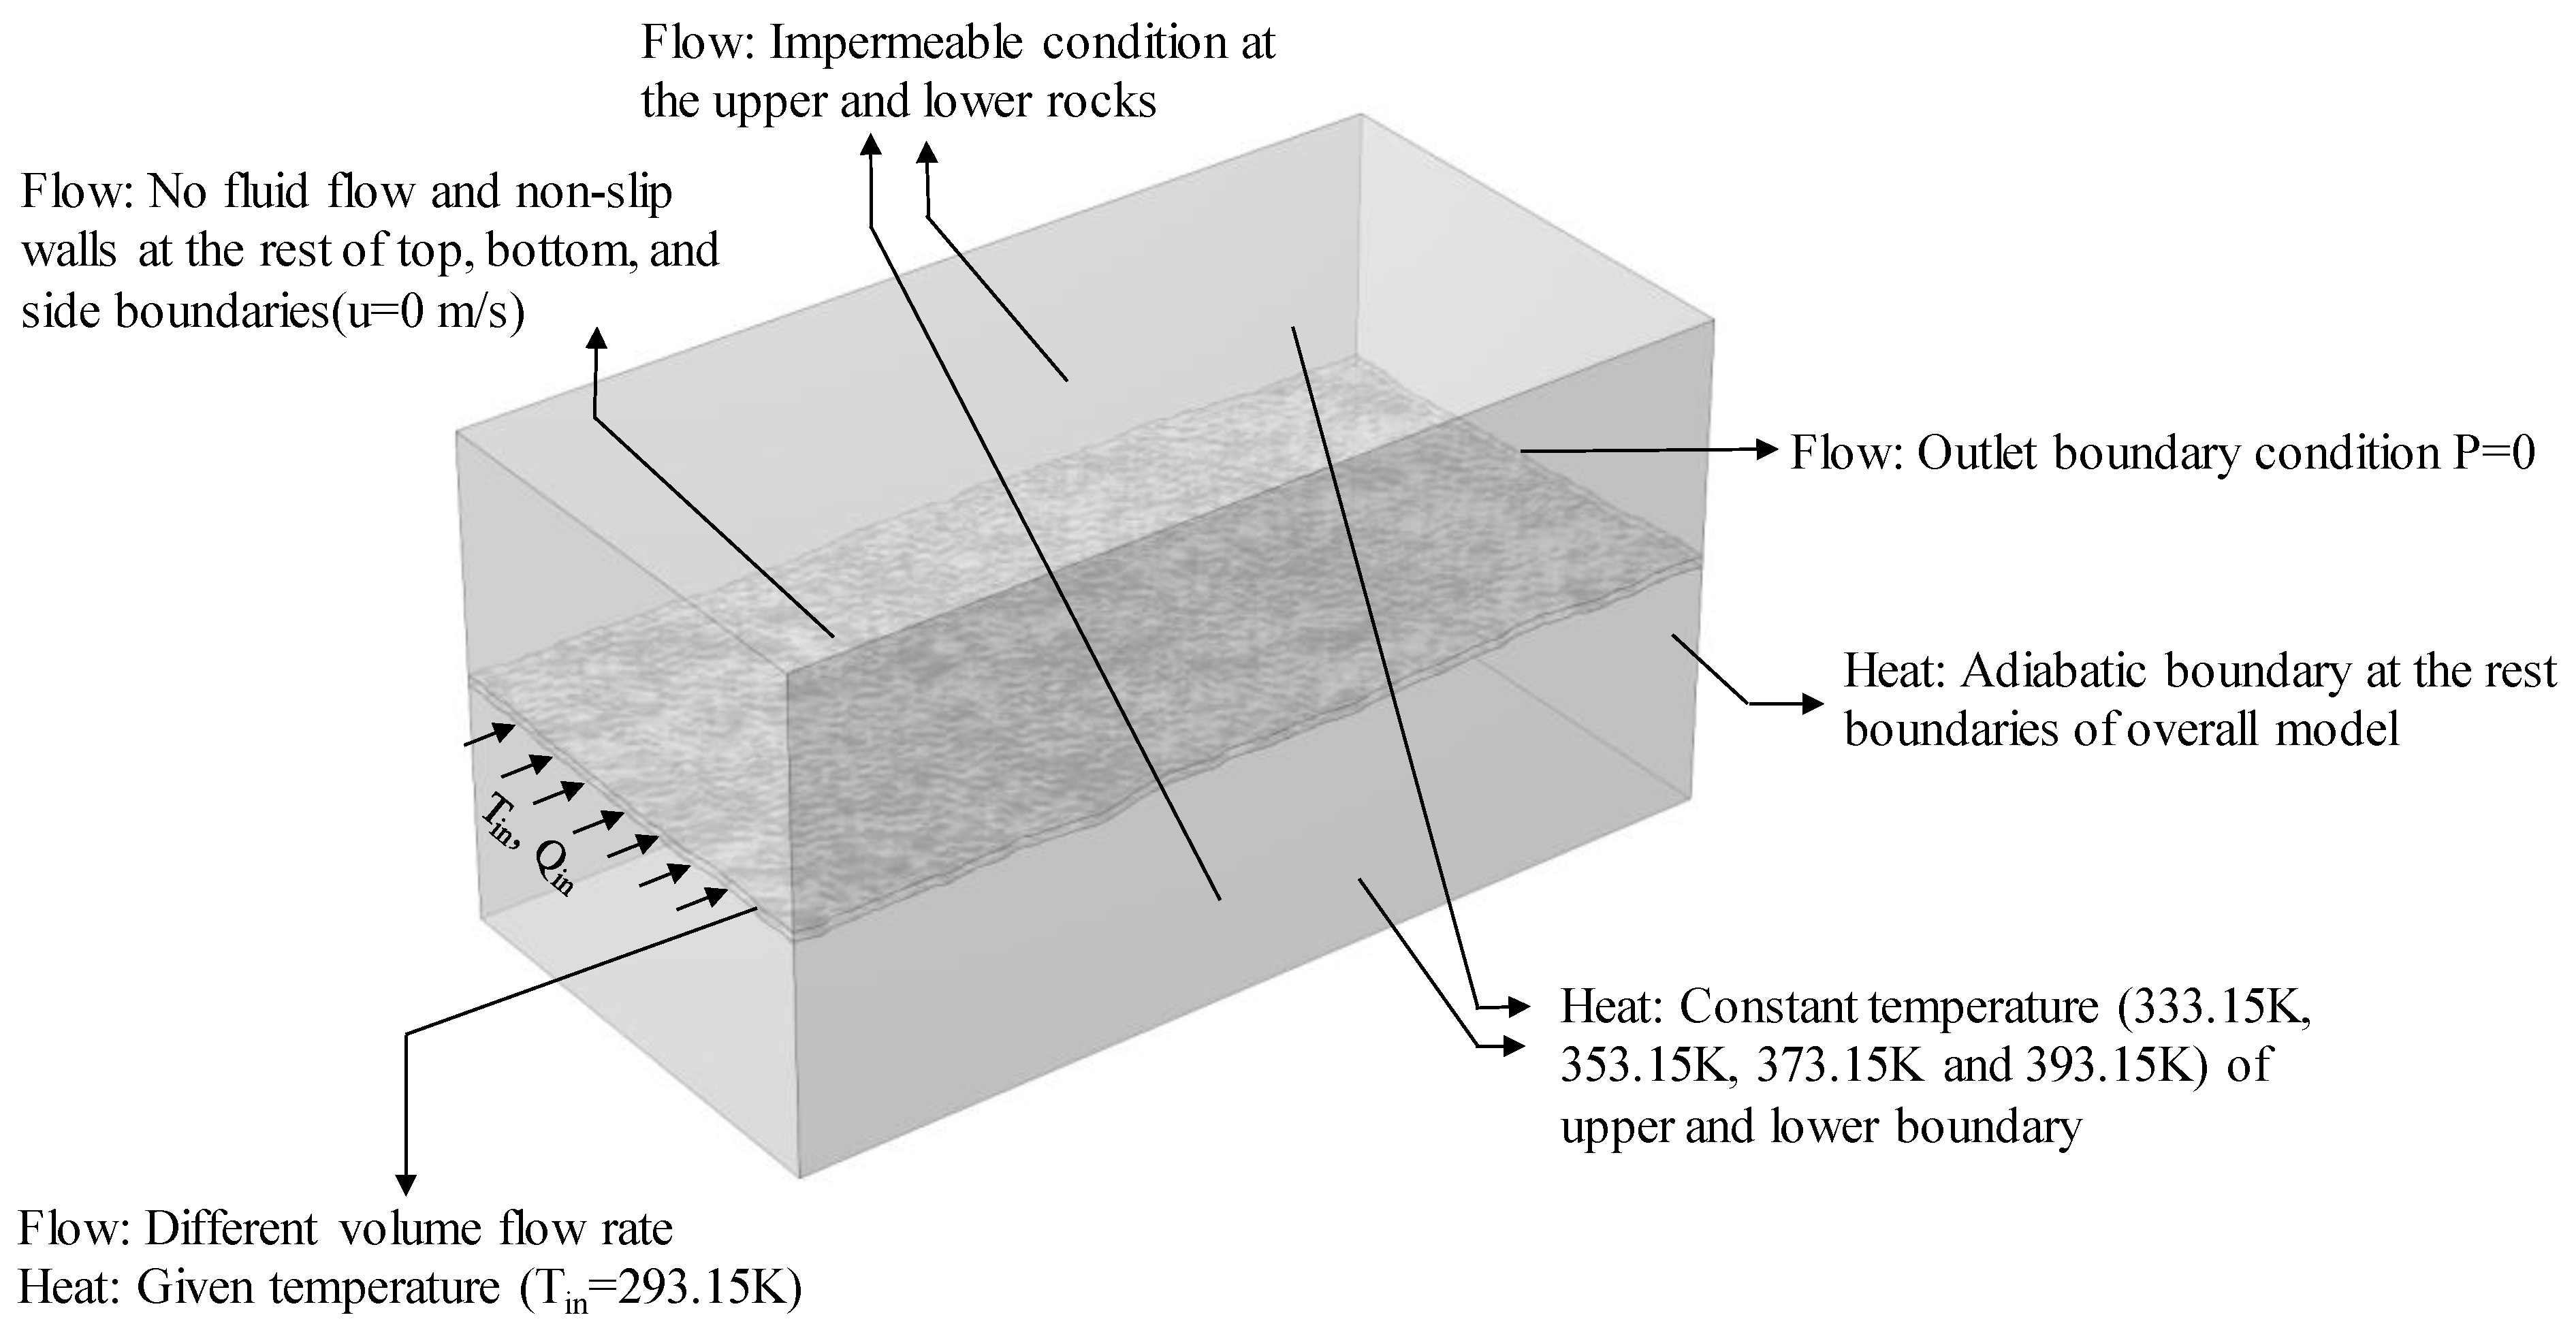
3. Numerical Modeling and Simulation

The 3D numerical model as illustrated in Figure 2 was established to simulate the fluid flow and heat transport process by solving the Navier–Stokes equation and the energy conservation equation based on a COMSOL Multiphysics 6.2. A series of 3D fracture surfaces of sizes of 250 mm × 125 mm × 125 mm were constructed with H = 0.65 and 0.50 based on the self-affine surface data generated in Section 2.2. For each H, four fracture apertures of 0.5 mm, 1 mm, 1.5 mm, and 2 mm were considered. The numerical fracture model was composed of a fracture and rock block with four external temperatures of 333.15 K, 353.15 K, 373.15 K, and 393.15 K. For each model, ten sets of volumetric flow rates ranging from 1 × 10⁻⁶ m3/s to 1 × 10⁻⁵ m3/s were simulated. In total, a set of 320 unique model scenarios were established, and the fluid seepage-heat transfer process was simulated.
For fluid dynamics, water is injected into the fracture with a prescribed volumetric flow rate at the inlet, flowing along the longitudinal axis of the model, and a zero-pressure condition (P = 0) is applied at the outlet. Fluid flow occurs within fluid-saturated fractures, while the rock matrix is considered impermeable. The fracture’s upper and lower surfaces are defined as impervious, with non-slip boundary conditions, and the two lateral boundaries are set to symmetric conditions. For heat transfer, the upper and lower wall boundaries are assigned four distinct temperatures. The lateral boundaries of the fracture model are treated as adiabatic. The material properties of rock and fluid used in the simulations are presented in Table 1.
Tetrahedral elements were employed to accommodate complex geometries with finer meshes around narrow apertures (Figure 3). In order to validate the numerical results and minimize numerical uncertainty, the grid dependence was examined. A time step of 1.5 s was used, with each simulation running for 15,000 steps. Under JRC1 conditions with an aperture of 0.5 mm, increasing the number of tetrahedral elements from 219,000 to 572,000 resulted in minimal changes to the outlet temperature and flow rate. This indicates that additional mesh refinement did not impact the results significantly, but it did considerably increase computation time. Therefore, the mesh density of 219,000 is adequate for achieving stable and accurate simulation results.

4. Results

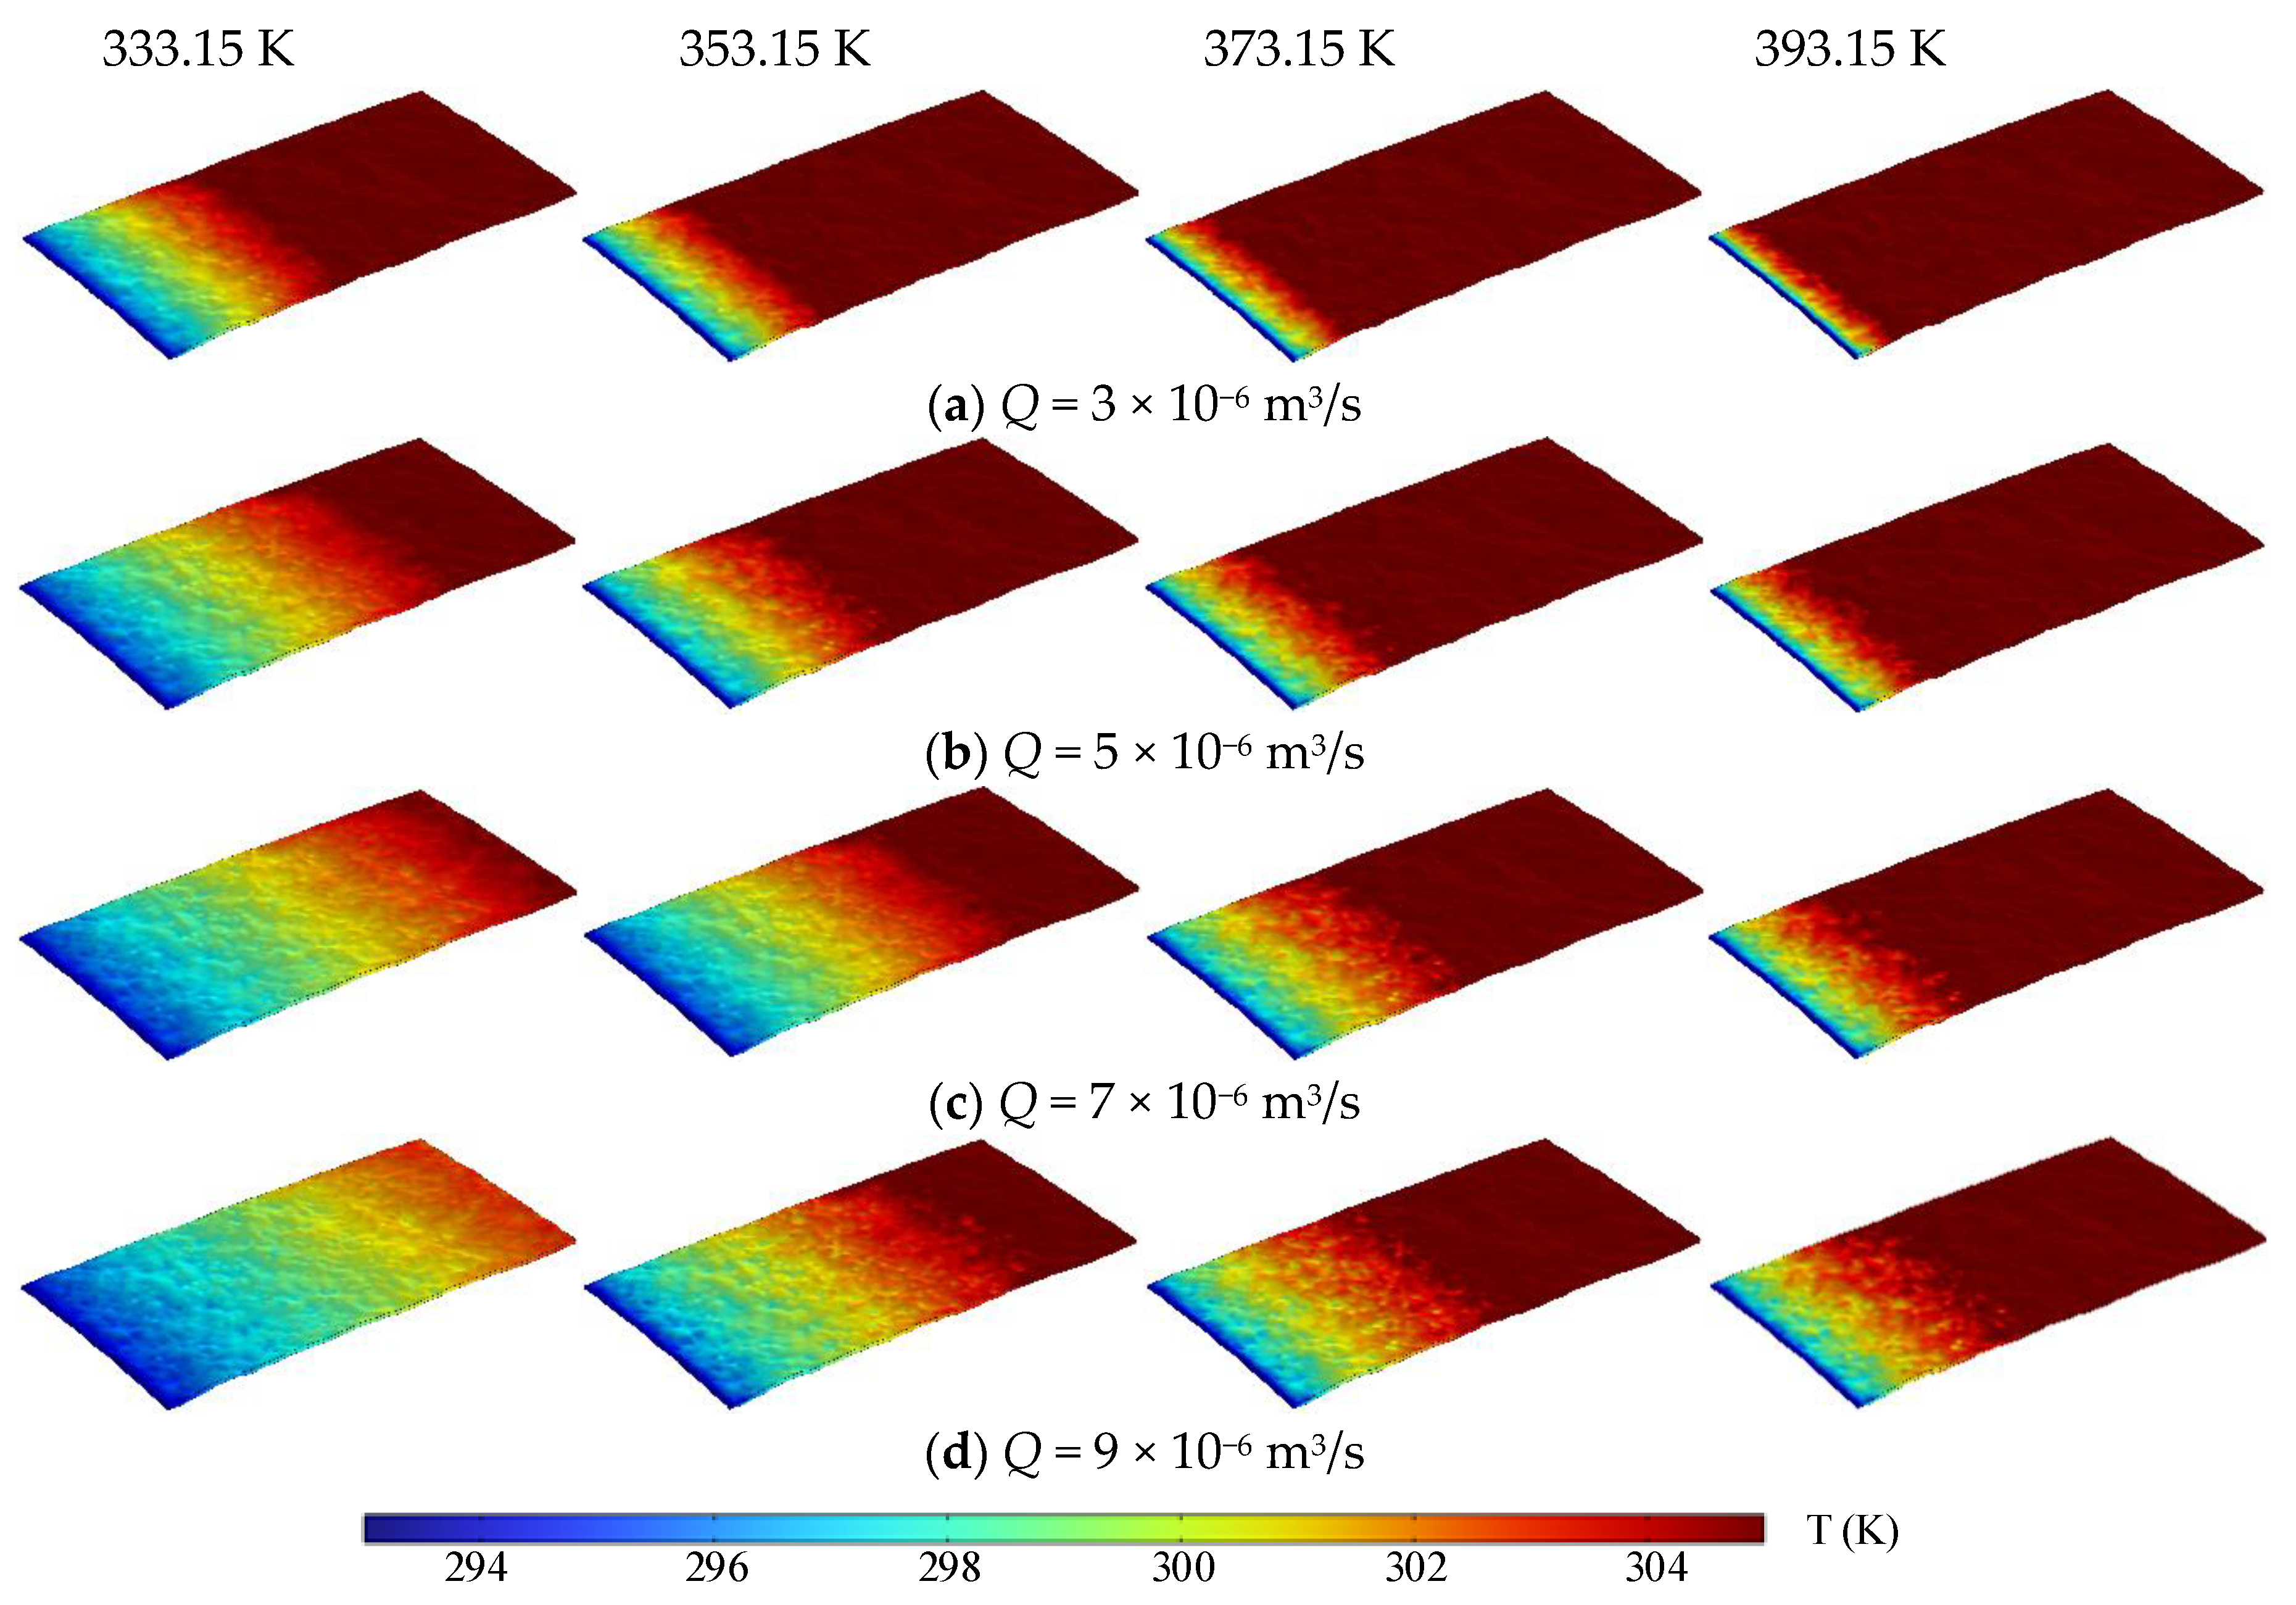
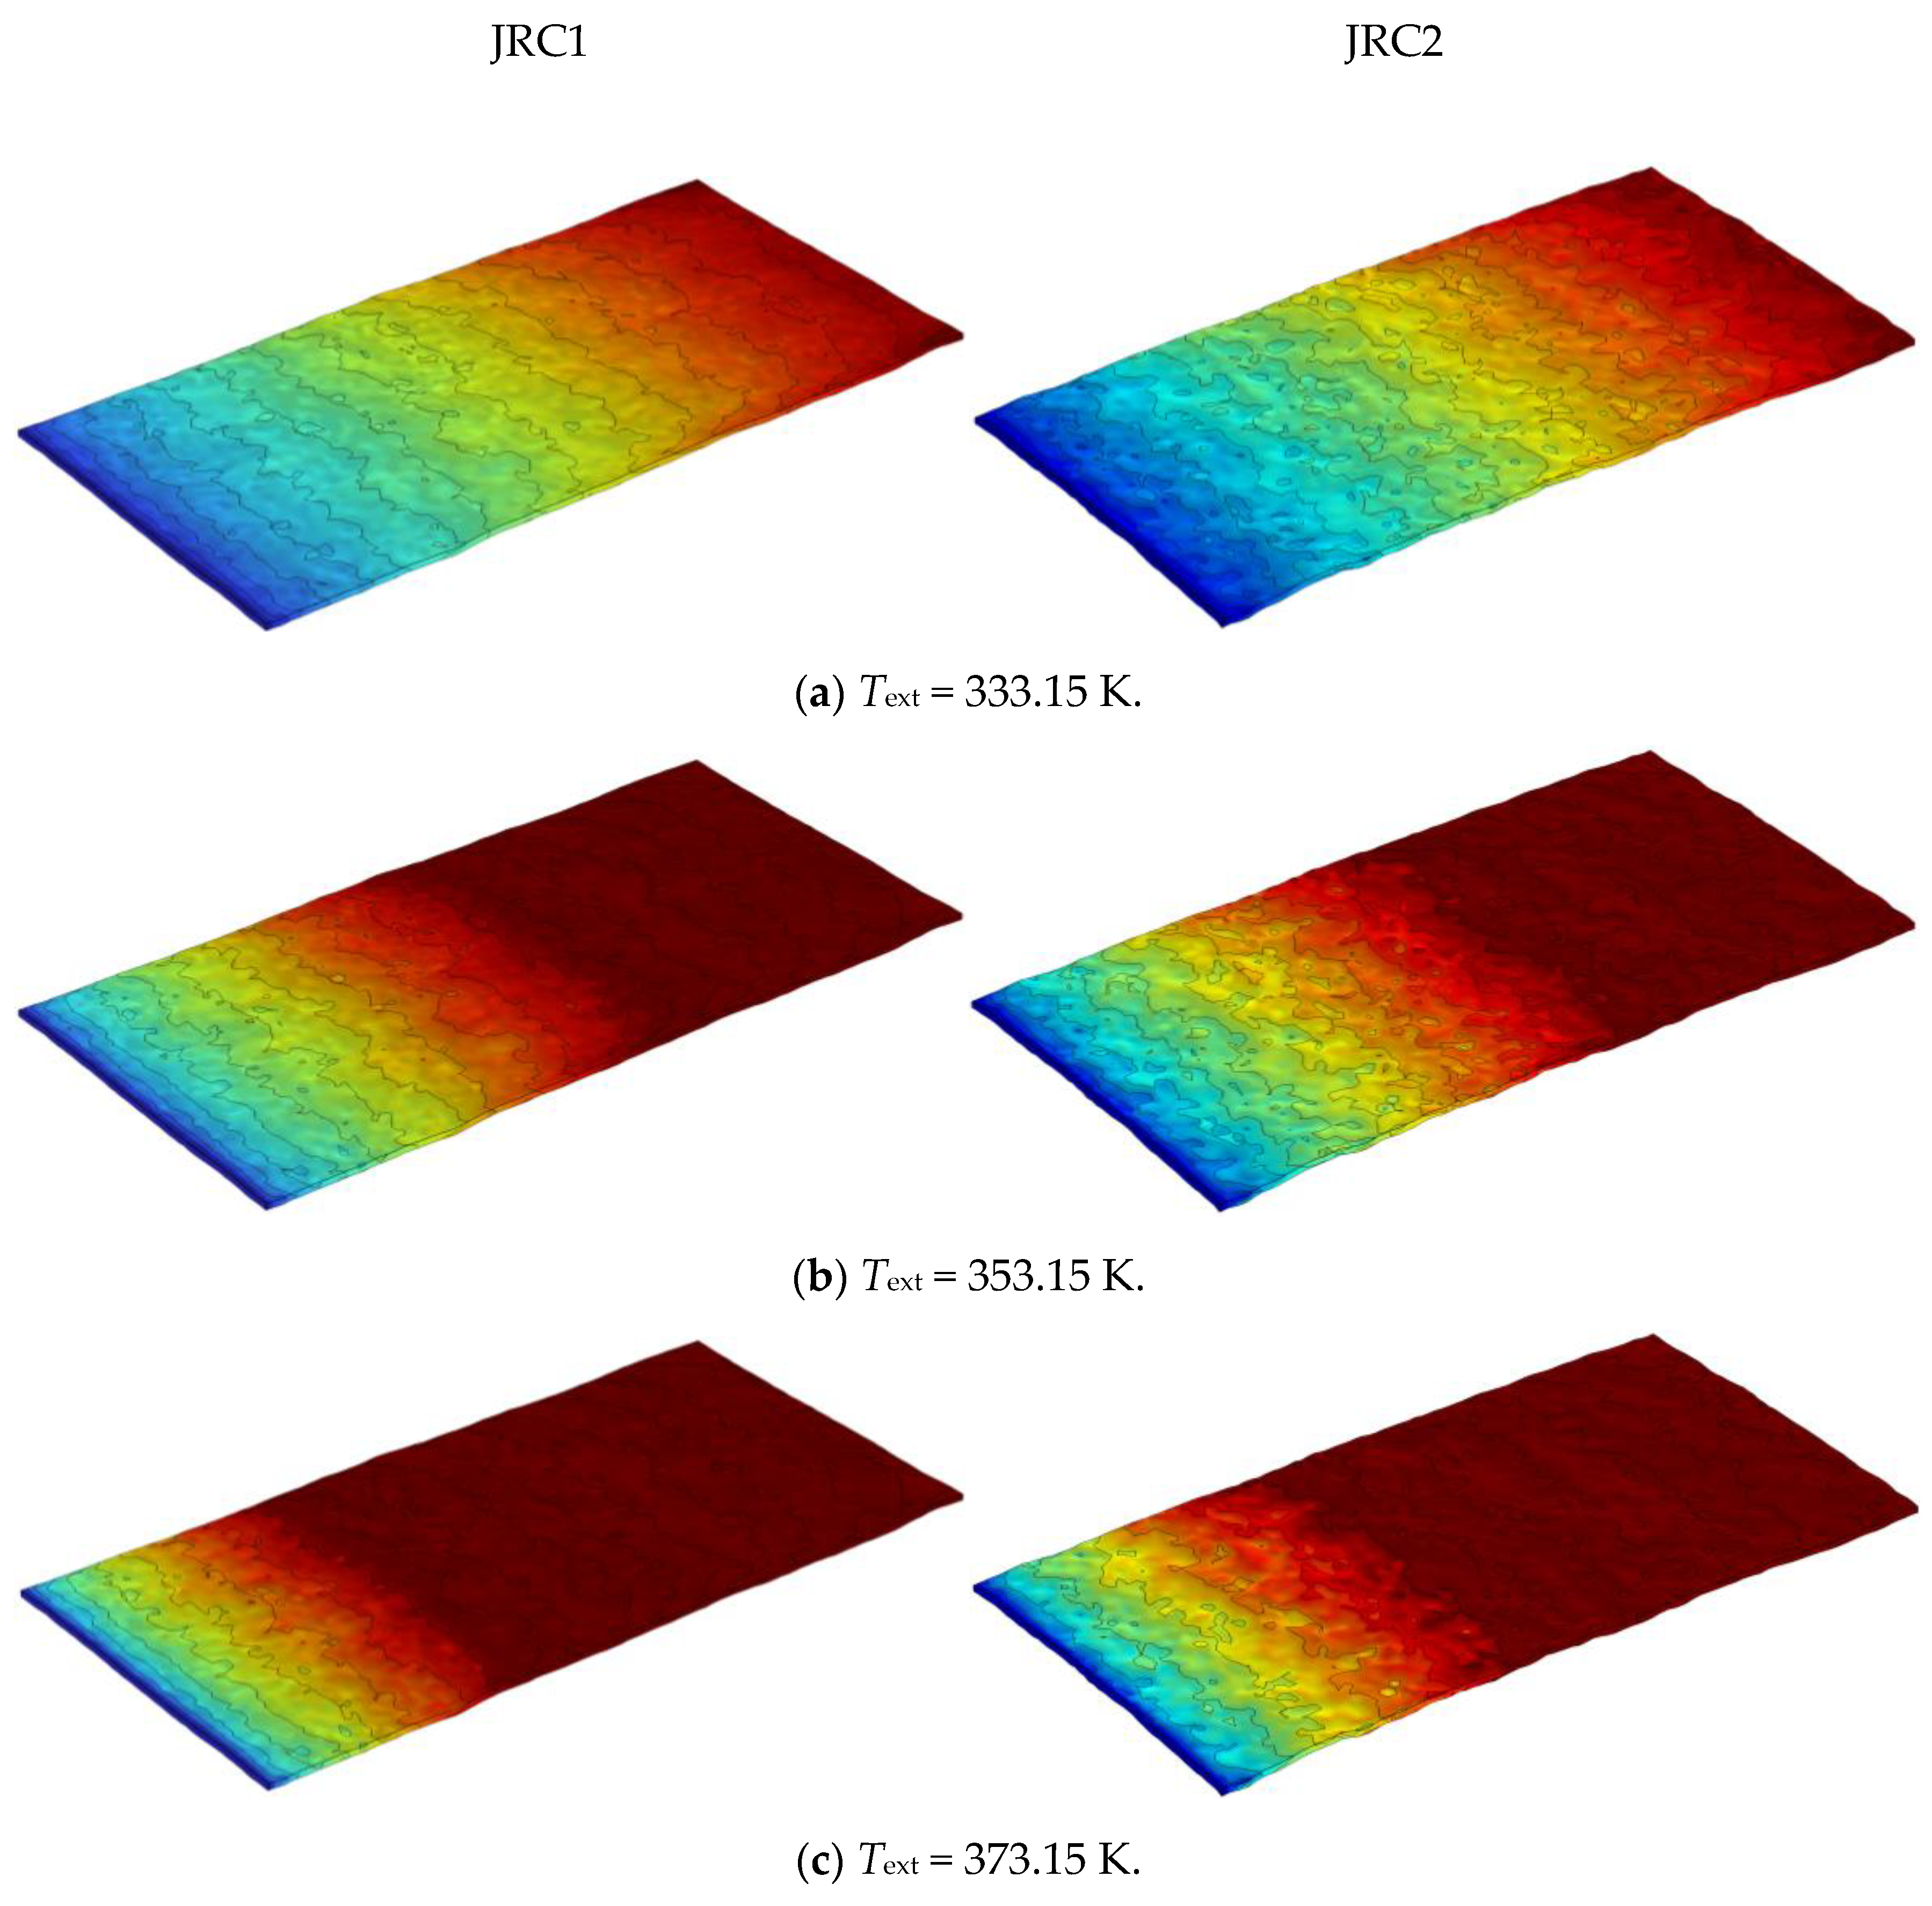
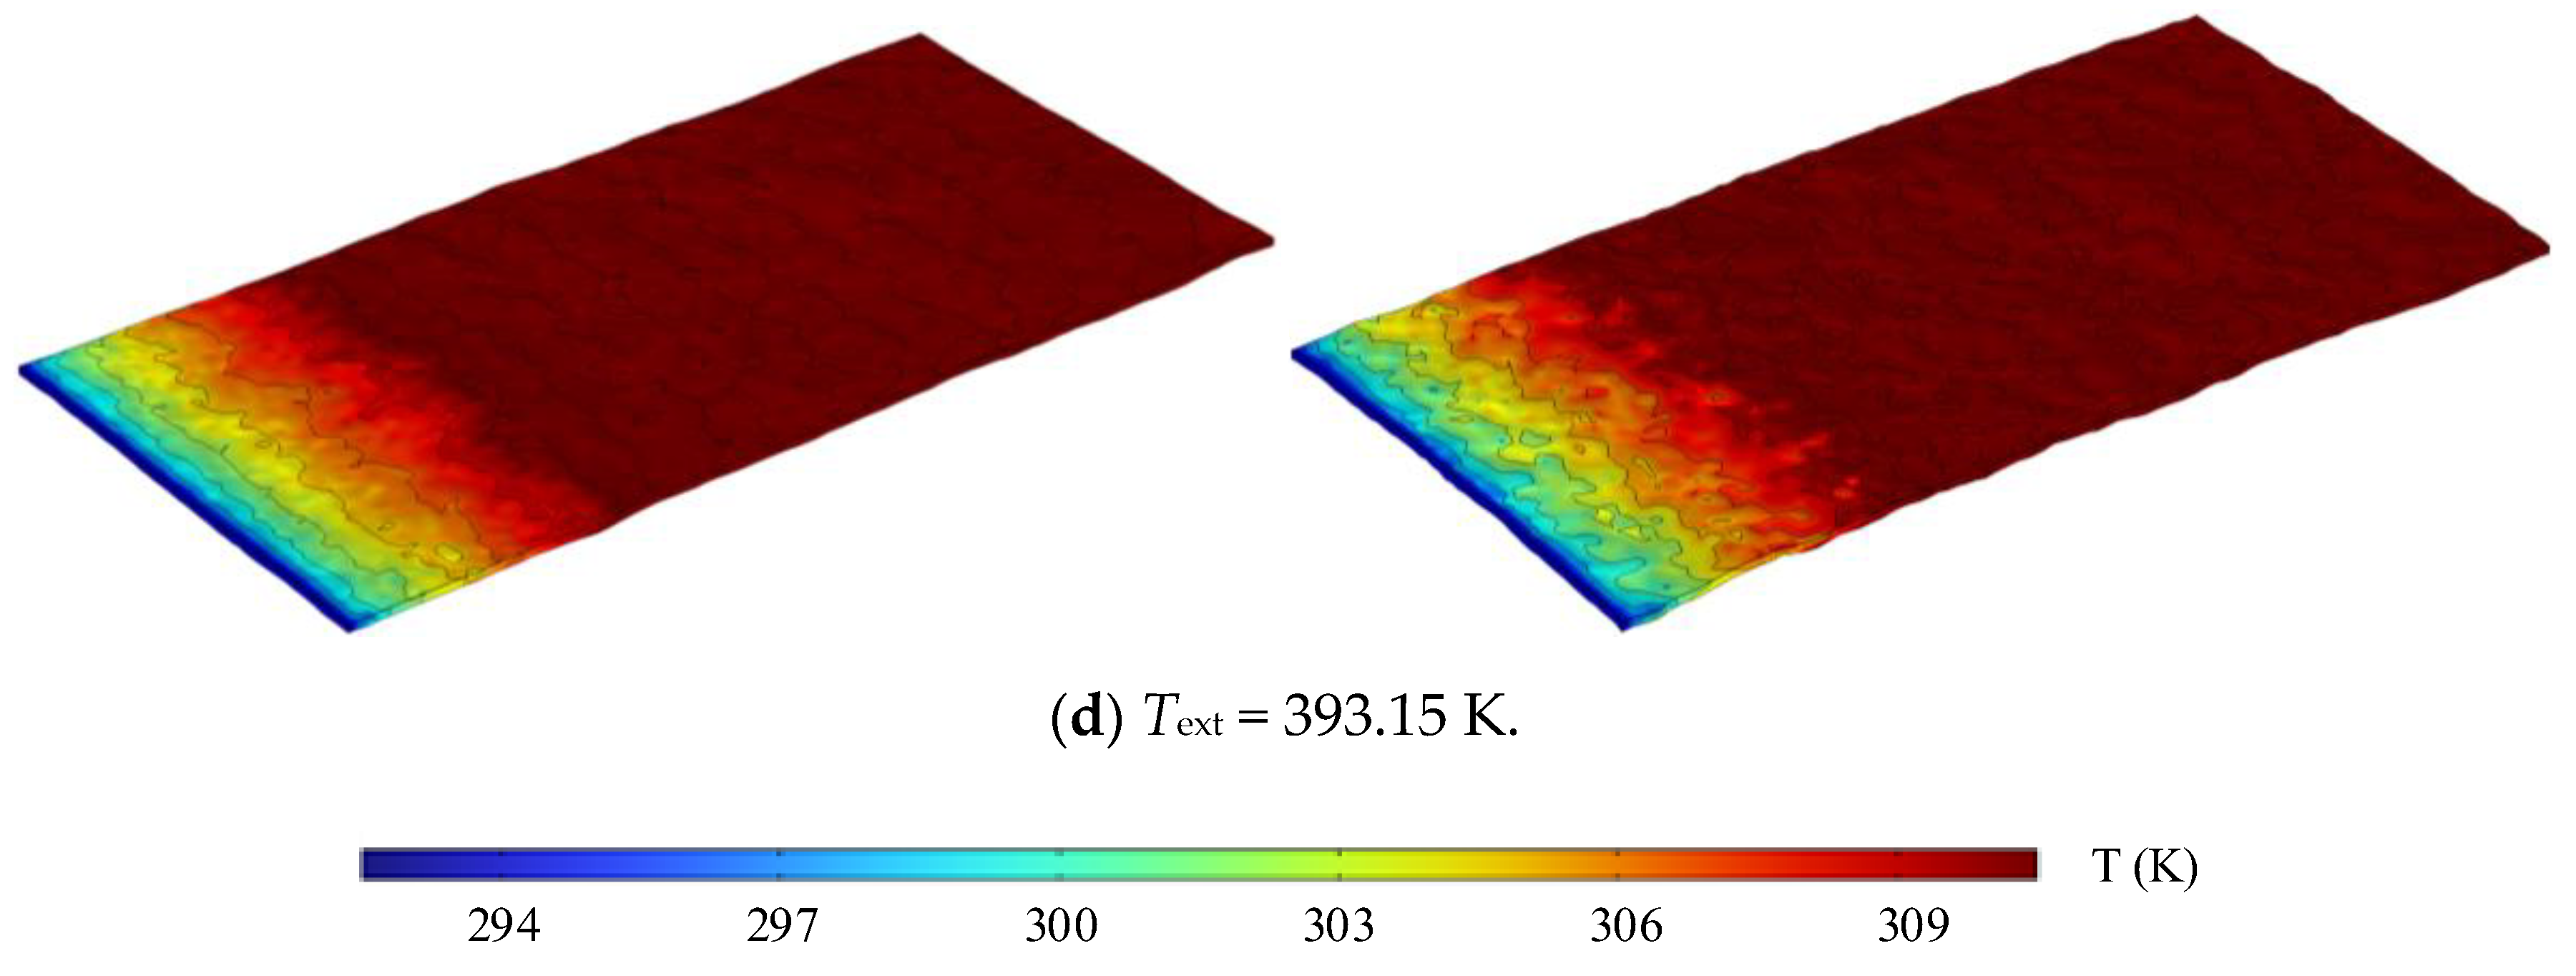
4.1. Comparison of Temperature Field

Fluid flow and heat transfer in rock fractures with different JRCs are simulated, and without loss of generality, Figure 4 only illustrates the results of the fracture model with JRC2 where the influence of external temperature and fracture aperture on the temperature field can be observed. In all cases, due to surface roughness, temperature distribution consistently exhibits heterogeneous progression toward the outlet. At identical volumetric flow rates, fractures with a smaller aperture show more extensive water–rock heat exchange, indicating greater heat absorption from the rock surface in narrower fractures. The external temperature has a limited impact on heat transfer. Increasing the external temperature results in minimal deviation in the temperature field, with the point of thermal equilibrium between water and rock remaining close to the inlet. Thus, the initial rock external temperature does not substantially affect heat transfer dynamics between the water and fracture.
Figure 5 shows the influence of external temperature and volumetric flow rate on the temperature field in the JRC2 fracture model. In rough-walled fractures, higher flow rates exacerbate temperature non-uniformity, while low-flow-rate scenarios display weaker temperature variation. This is because higher flow rates increase the total heat absorbed by the water while reducing the heat stored in the surrounding rock, thereby creating a greater temperature differential between fluid and fracture walls, enhancing heat transfer efficiency, and accelerating water temperature changes. Consequently, temperature heterogeneity intensifies with increasing volumetric flow rate. In addition, fluid temperature at each point in the fracture generally decreases as volumetric flow rate increases. The phenomenon is mainly due to the fact that more heat in the system will be taken away with the increase in volumetric flow rate once a steady state is reached.
Figure 6 depicts water temperature contours for fractures with JRC1 and JRC2. The temperature distribution correlates strongly with fracture surface morphology, resulting in distinct temperature fields for fractures with different JRC values. Compared to JRC1, the tortuosity of JRC2 contours generates more non-uniform flow rates across different fracture cross-sections, leading to a more heterogeneous temperature field. As demonstrated in Figure 6, the irregularity of temperature distribution fluctuates with the fracture morphology. Under a consistent aperture, rougher surfaces lead to a more rapid temperature decrease and a lower outlet temperature. This is mainly because the fracture surface roughness extends the flow path, increasing flow area and heat transfer efficiency. Notably, the influence of different external temperatures on the water temperature contour distribution remains minimal.

4.2. Temperature of Outlet Water

Fracture seepage alters the thermal convection behavior of the temperature field, thereby influencing the distribution of the internal temperature field. The significant nonlinearity of flow in rough fractures complicates the evolution of the temperature field. In EGS, the injection fluid velocity has a crucial impact on the surrounding rock external temperature. Figure 7 depicts the variation of outlet temperature Tout with a volumetric flow rate for fractures with different JRC. The results indicate that, in all cases, Tout decreases nonlinearly over time. Initially, Tout drops rapidly with increasing Q. Once the Q exceeds 5 × 10⁻⁶ m3/s, the temperature decreases slowly until it stabilizes. This suggests the presence of a specific limit Q within a particular scale of rock, beyond which further increases in Q have minimal impact on Tout. It is evident that at the same Q, the Tout rises with increasing Text, exhibiting a similar trend. For example, at JRC1 and a Q of 1 × 10⁻⁵ m3/s, the ranges of Tout at Text values of 333.15 K, 353.15 K, 373.15 K, and 393.15 K for different apertures are 296.94 K~297.98 K, 298.82 K~300.39 K, 300.73 K~302.77 K, and 302.63 K~305.27 K, respectively. These values correspond to 89.13%~89.44%, 84.62%~85.06%, 80.59%~81.14%, and 76.98%~77.65% of the initial rock external temperature. This indicates that, under equivalent conditions, the heat extraction rate increases with the rise in temperature of the rock’s external surface.
Figure 8 presents the dual-parameter fitting surface for Tout with volumetric flow rate, and rock external temperature considering different surface roughnesses and fracture apertures. The results indicate that Tout increases nonlinearly with the increasing volumetric flow rate, and increases approximately linearly with increasing rock external temperature. However, the effects of surface roughness and fracture aperture on Tout are minimal. Equation (12) can effectively describe the variation in Tout with respect to the volumetric flow rate Q and the rock external temperature Text,
T out = α + β Q γ Q 2 + δ × T ext
The fitting coefficients for JRC1 are α = 206.97, β = 6.1 × 10⁻⁵, γ = −1.66 × 10⁻¹¹ and δ = 0.24, with R2 = 0.922. For JRC2, the fitting coefficients are α = 207.03, β = 6.31 × 10⁻⁵, γ = −1.8 × 10⁻¹¹ and δ = 0.24, with R2 = 0.921.
A thermal breakthrough defined as a 10% decrease in reservoir temperature can significantly impact reservoir lifespan, which is a critical parameter in the development of EGS [44,45,46]. Figure 9 illustrates the variation in Tout over time at four different volumetric flow rates for rock samples with JRC1 and JRC2, in which the thermal breakthrough is specifically marked. As shown in Figure 9a, increasing external temperature reduces the time to thermal breakthrough, primarily due to a larger temperature gradient between the water and rock, which accelerates the heat transfer process. Higher reservoir temperatures enhance thermal convection and conduction in EGS extraction.
Injection rate plays a critical role in EGS production, as different flow rates yield different times to thermal breakthrough. The temperature on the external wall drops rapidly at the onset of flow, with higher flow rates leading to a faster temperature decrease. Lower flow rates help maintain higher reservoir temperatures under the same conditions, and higher flow rates extract more heat from the rock mass. Selecting an optimal injection rate can help avoid premature thermal breakthrough and extend reservoir production lifetime. Surface roughness also significantly affects thermal breakthrough. As shown in Figure 9, the breakthrough time for JRC2 is longer than that for JRC1 under the same volumetric flow rate. This delay is due to fluid retention caused by surface undulations, which prolongs thermal breakthrough. However, as volumetric flow rate increases, the influence of roughness on thermal breakthrough diminishes.
Figure 10 illustrates the relationship between thermal breakthrough time t and volumetric flow rate Q under different Text and JRC. It is evident that lower external temperatures and lower volumetric flow rates result in longer times to reach thermal breakthrough. This phenomenon occurs because an increase in temperature or volumetric flow rate reduces boundary layer thickness, thereby decreasing the thermal resistance to seepage and enhancing convective heat transfer intensity, which in turn shortens the time to thermal breakthrough. As the fracture aperture increases, the overall trend in thermal breakthrough time decreases, and the distribution becomes more dispersed under different Text and JRC. This is due to the fact that, at a constant pressure drop across the fracture, smaller apertures tend to create dominant flow paths, significantly reducing the effective heat transfer area and consequently degrading heat transfer performance. Thus, smaller apertures lead to longer thermal breakthrough times. Conversely, with an increase in aperture size, the total liquid volume within the flow channel increases, facilitating more complex flow patterns. This complexity enhances the region and magnitude of disturbances in the rock temperature field, resulting in a more dispersed distribution of thermal breakthrough times.
As illustrated in Figure 11, the impact of roughness on thermal breakthrough is influenced by the fracture aperture. When the aperture is 0.5 mm, increasing roughness extends the thermal breakthrough time; however, at an aperture of 2 mm, greater roughness instead reduces the thermal breakthrough time. Taking a volumetric flow rate of 1 × 10⁻⁶ m3/s and an external surface temperature of 393.15 K as an example, the thermal breakthrough times for JRC1 at fracture apertures of 0.5 mm and 2 mm are 267.9 s and 182.5 s, respectively, while for JRC2, these times are 268.05 s and 141.02 s, respectively. At smaller apertures, an increase in roughness prolongs the time to thermal breakthrough, resulting in a slower initial decrease in Tout. However, as the aperture size increases, greater roughness can lead to a shorter time to thermal breakthrough. This occurs because, with smaller apertures, rough surfaces tend to create primary flow paths, reducing the effective heat transfer area. The heterogeneity in the temperature field will increase the thermal breakthrough time, which in turn further reduces the overall heat transfer performance. Conversely, as the aperture increases, the impact of surface morphology diminishes, and the increased roughness introduces more protrusions and depressions, effectively lengthening the flow path while reducing seepage velocity. This allows the low-temperature fluid greater opportunity to absorb energy from the high-temperature rock, thereby shortening the thermal breakthrough time. Localized high-temperature zones can effectively enhance heat extraction; however, excessive heterogeneity may result in uneven heat extraction and decreased overall system efficiency. Therefore, a thorough understanding of how fracture roughness and aperture impact temperature fields can offer a scientific foundation for optimizing the design and operation of geothermal systems. Additionally, the differences in thermal breakthrough times under varying external surface temperatures and apertures decrease as volumetric flow rates increase. When volumetric flow rates reach sufficiently high levels, the influence of other factors becomes less significant. This indicates that volumetric flow rate has a more pronounced effect on heat transfer compared to other influencing factors.

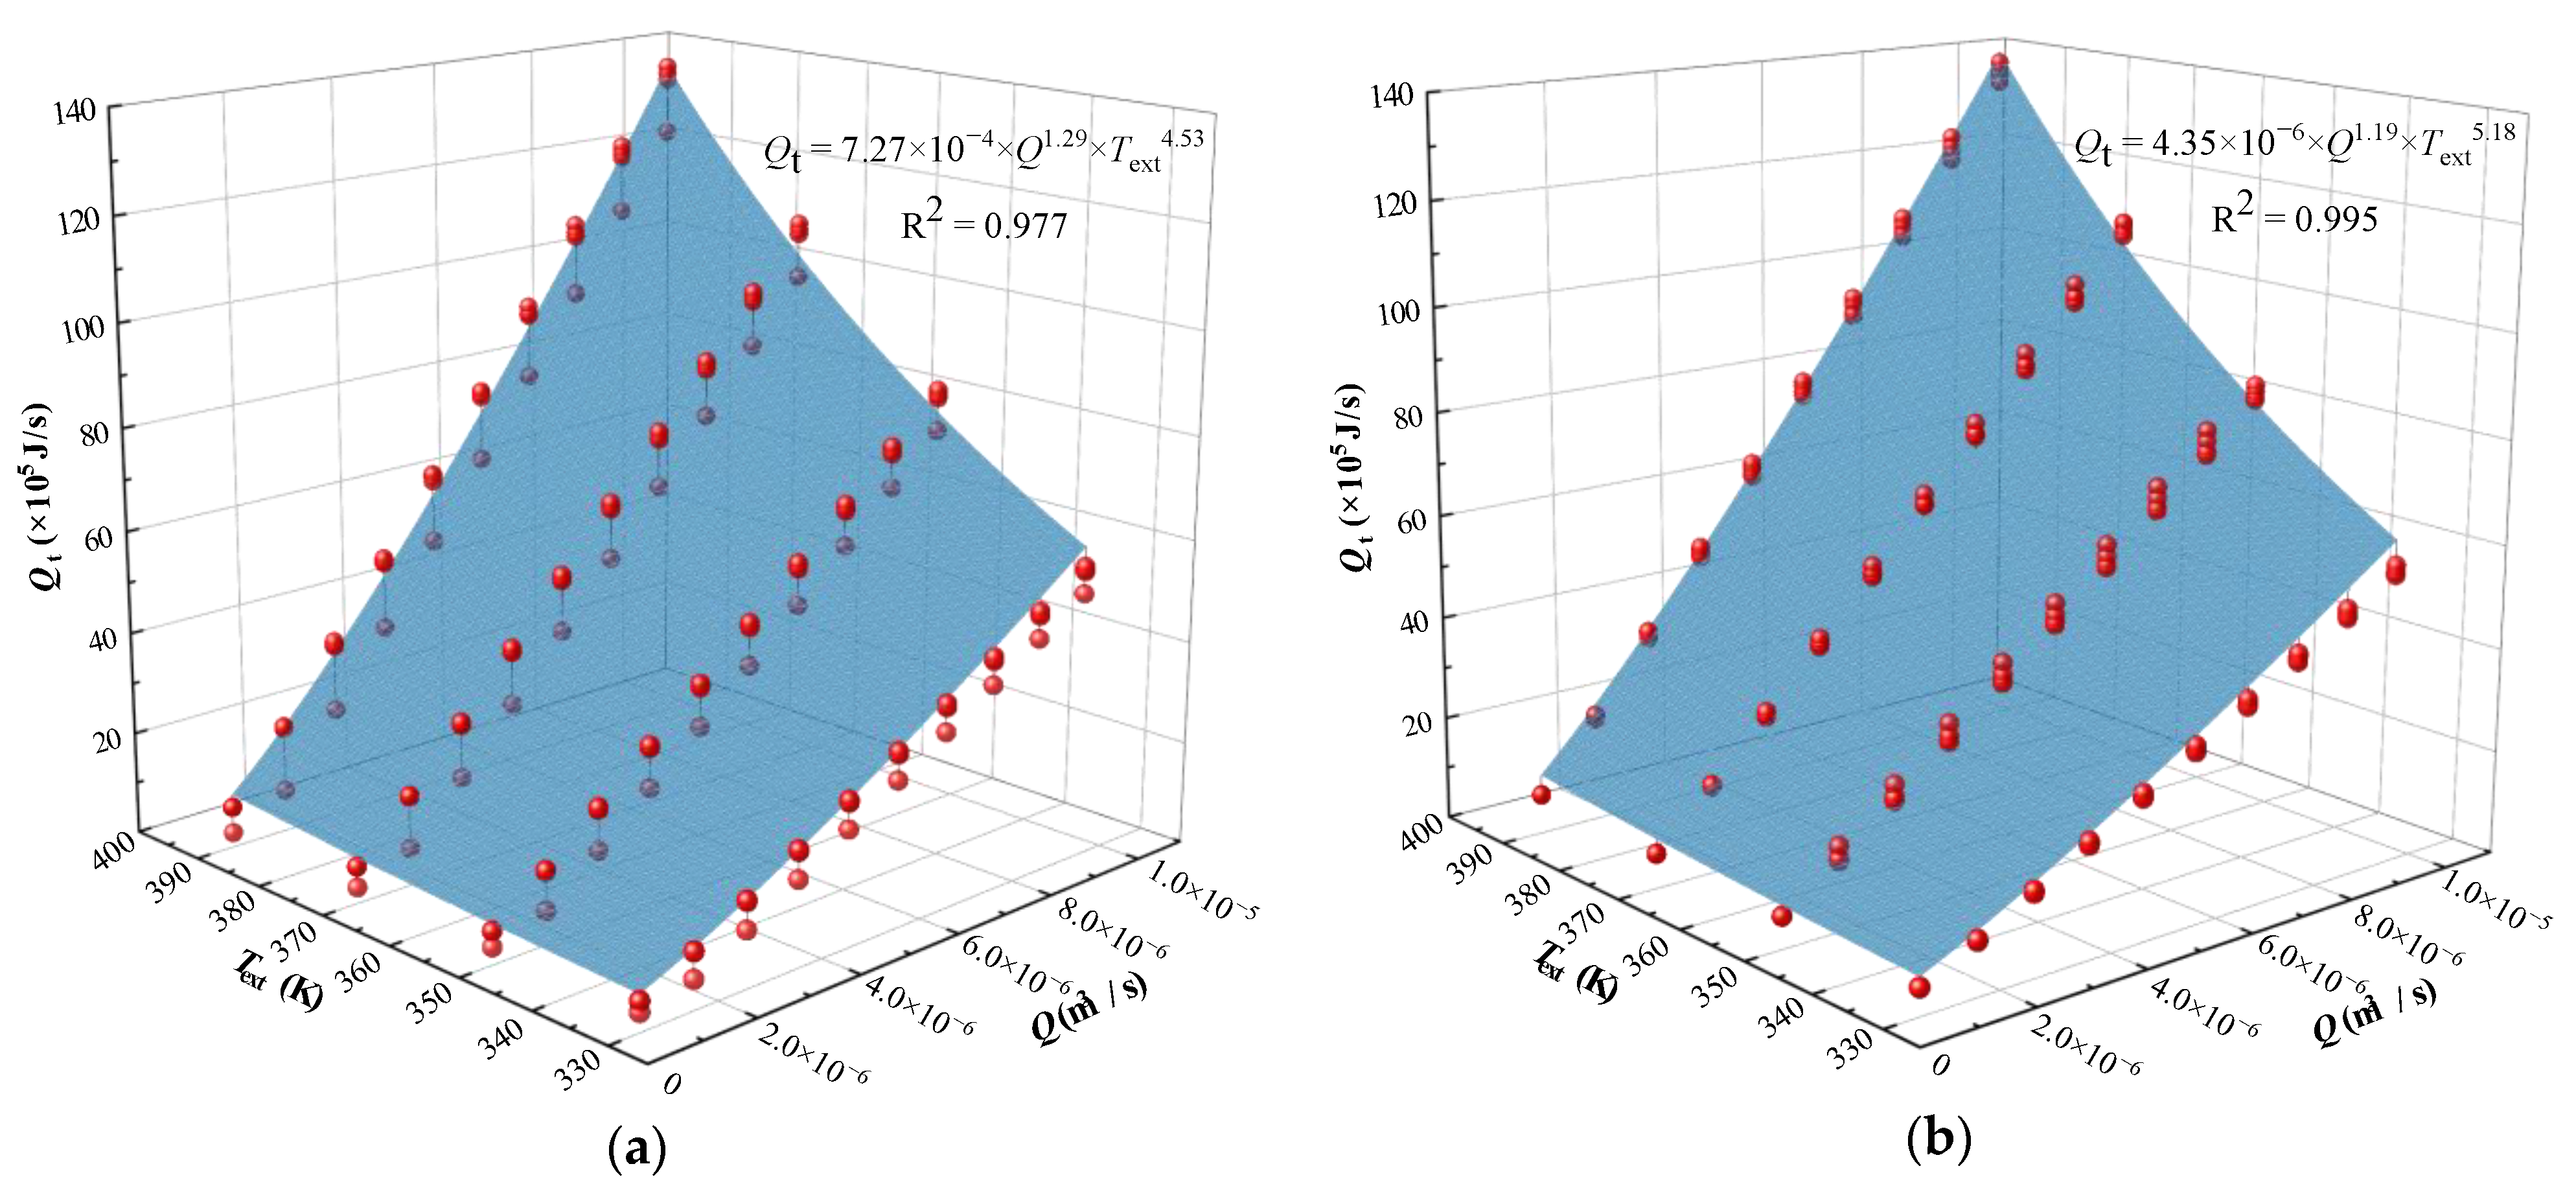
4.3. Energy Extraction Efficiency

The total heat extraction efficiency Qt over the simulation time t is calculated as follows:
Q t = 0 t c p u out ρ tb T out T in dt t
where uout is the outlet flow rate, and Tin and Tout are the inlet and outlet temperatures, respectively.
From Figure 12, it can be observed that the total heat extraction efficiency Qt exhibits a similar increasing trend under different JRC and Text conditions. The total heat extracted by high-velocity fluids is significantly greater than that extracted by low-velocity fluids, while the differences in total heat extraction and heat recovery efficiency between surfaces with varying roughness are relatively minor. For instance, at a volumetric flow rate of 1 × 10⁻⁶ m3/s and an external surface temperature of 393.15 K, the heat extraction efficiencies for JRC1 at fracture apertures of 0.5 mm and 2 mm are 5.22 × 10⁵ J/s and 5.15 × 10⁵ J/s, respectively. For JRC2 at the same apertures, the efficiencies are 5.21 × 10⁵ J/s and 5.07 × 10⁵ J/s, indicating that the effects of roughness and fracture aperture on Qt are limited.
Equation (14) effectively describes the variation in Qt with respect to the volumetric flow rate Q and the external temperature Text.
Q t = α × Q β × T ext γ
The fitted surface of Equation (14) is shown in Figure 13, which demonstrates that Qt significantly increases with the rise in both the Text and the Q. Taking JRC2 and aperture of 0.5 mm as an example, when the values of Text are 333.15 K, 353.15 K, 373.15 K, and 393.15 K, Qt at a Q of 3 × 10⁻⁶ m3/s increases by 178%, 179%, 179%, and 178% compared to a Q of 2 × 10⁻⁶ m3/s. At a Q of 4 × 10⁻⁶ m3/s, compared to 2 × 10⁻⁶ m3/s, we see increases of 259%, 260%, 261%, and 257%, respectively. This clearly demonstrates that increasing the volumetric flow rate can significantly enhance the thermal extraction efficiency of the thermal storage system. Therefore, in the design of geothermal extraction projects, it is essential to select fluid parameters reasonably based on actual conditions to prolong thermal breakthrough time while ensuring an adequate heat extraction efficiency.

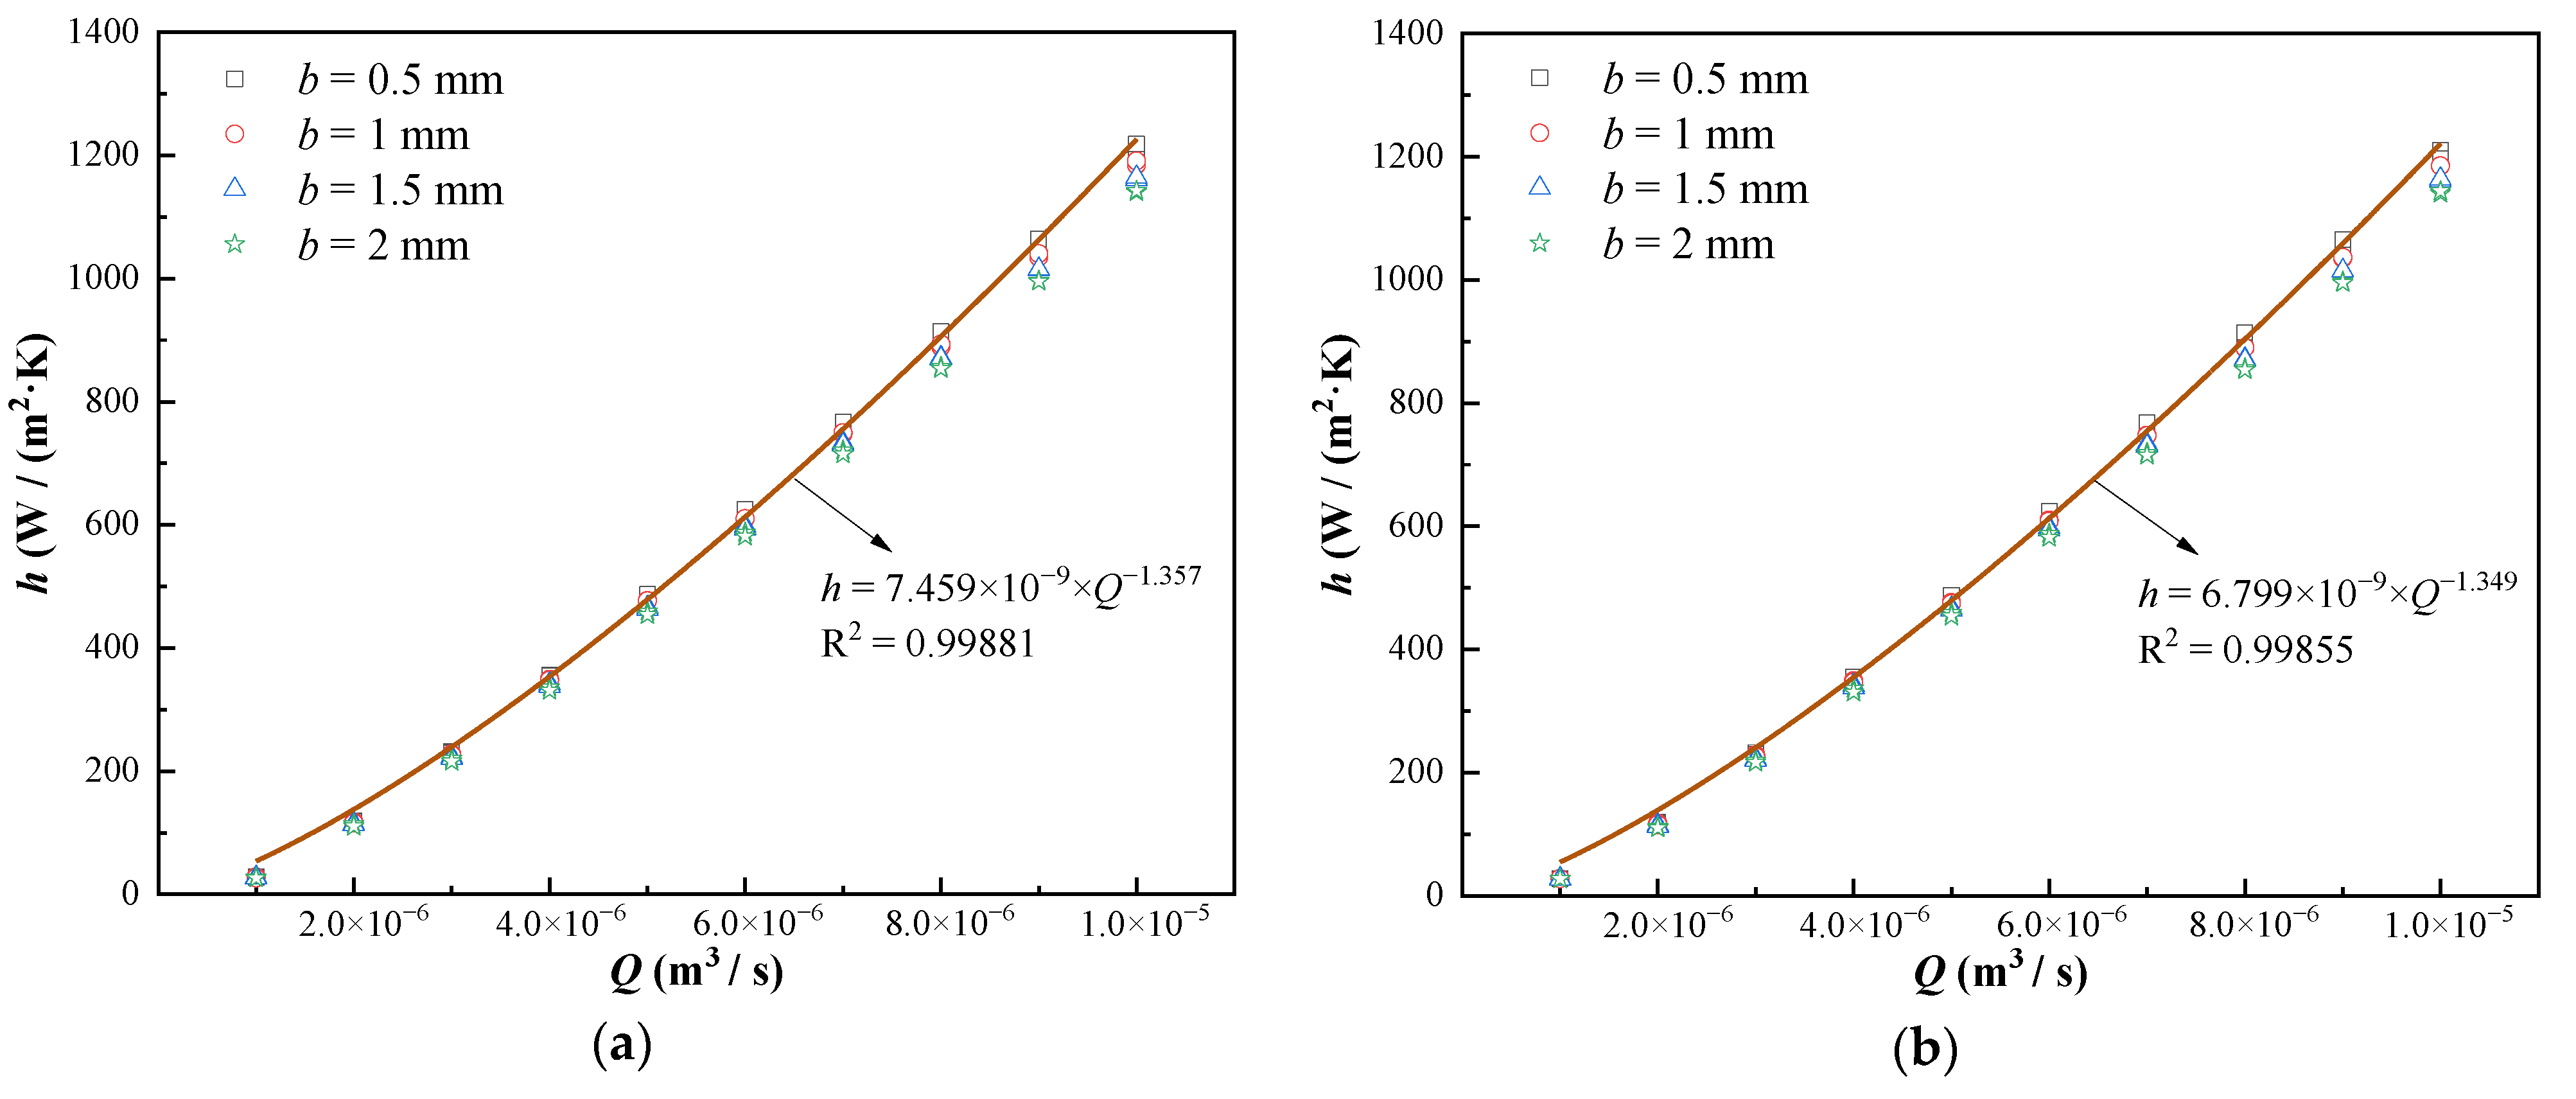
4.4. Heat Transfer Coefficient

The heat transfer coefficient that indicates the heat transfer capacity between the flowing fluid and the rock wall is an important parameter used to evaluate the heat extraction capacity. In this study, the heat transfer coefficient is calculated using the following equation proposed by Bai et al. [19], which assumes that the temperature along the radius direction is a linear function,
h   = c p , w q v ρ w T out T in dL T c T in + T out / 2
where h is the heat transfer coefficient, cp, w is the specific heat capacity of water at a constant pressure, ρw is the density of water, qv is the volumetric flow rate, d is the diameter of the rock, L is the length of the rock, and Tc is the temperature of the external surface of the rock.
As shown in Figure 14, the h is positively correlated with volumetric flow rate. For example, in the case of JRC1 with an external surface temperature of 373.15 K and an aperture of 0.5 mm, when the Q increases from 2 × 10⁻⁶ m3/s to 8 × 10⁻⁶ m3/s, the h rises from 118.65 W/(m2·K) to 909.08 W/(m2·K), with an increase of approximately 7.66 times. This indicates that the increment of the h is greater than that of the Q, suggesting that a higher volumetric flow rate not only enhances the total heat transfer but also increases the heat transfer intensity per unit flow rate. Furthermore, the heat transfer coefficient tends to increase with the rise in rock matrix temperature. For instance, with JRC1 at a volumetric flow rate of 8 × 10⁻⁶ m3/s and an aperture of 0.5 mm, when Text is raised from 333.15 K to 393.15 K, the h increases from 909.08 W/(m2·K) to 914.68 W/(m2·K), with an increase of 1%. This indicates that at the same volumetric flow rate, the h increases with Text. According to boundary layer theory, the boundary layer thickness is related to the dynamic viscosity and flow velocity; a decrease in dynamic viscosity or an increase in flow velocity will reduce the boundary layer thickness [47,48,49]. Therefore, when either the flow velocity increases or the temperature rises, the boundary layer thickness decreases, resulting in a reduced thermal resistance to seepage-heat transfer and an enhanced convective heat transfer intensity.
Additionally, a smaller fracture aperture corresponds to a higher h, indicating that as the fracture aperture decreases, the heat flux density from the fracture surface to the fluid increases. The convective heat transfer intensity for JRC2 is slightly improved compared to JRC1, although the increase is not substantial. For example, at different volumetric flow rate levels of 2 × 10⁻⁶, 4 × 10⁻⁶, 6 × 10⁻⁶, and 8 × 10⁻⁶ m3/s, with an aperture of 0.5 mm and a test temperature of 393.15 K, the increases in the h for JRC2 relative to JRC1 are 1.1%, 0.2%, 0.6%, and 0.03%, respectively.

5. Conclusions

This study provides a comprehensive analysis of the combined effects of volumetric flow rate, surface roughness, aperture size, and rock external temperature on heat transfer within single-fracture systems. A number of 3D geometrically realistic fracture models with varying roughness and apertures were constructed, and fluid seepage-heat transfer processes through those models were simulated. The evolution of key heat transfer metrics, including outlet temperature, thermal breakthrough time, energy extraction efficiency, and heat transfer coefficients, were systematically quantified. The conclusions are as follows:
  • The results indicate that water flow velocity exerts the most significant influence on heat transfer, followed by fracture surface morphology and rock surface temperature. An increase in flow rate markedly enhances heat transfer and boosts total heat extraction within a certain range. Higher volumetric flow rates exacerbate temperature non-uniformity, resulting in a larger temperature differential that improves heat transfer efficiency. Therefore, in the design of geothermal extraction projects, it is essential to carefully select fluid parameters according to actual conditions to ensure optimal heat extraction efficiency;
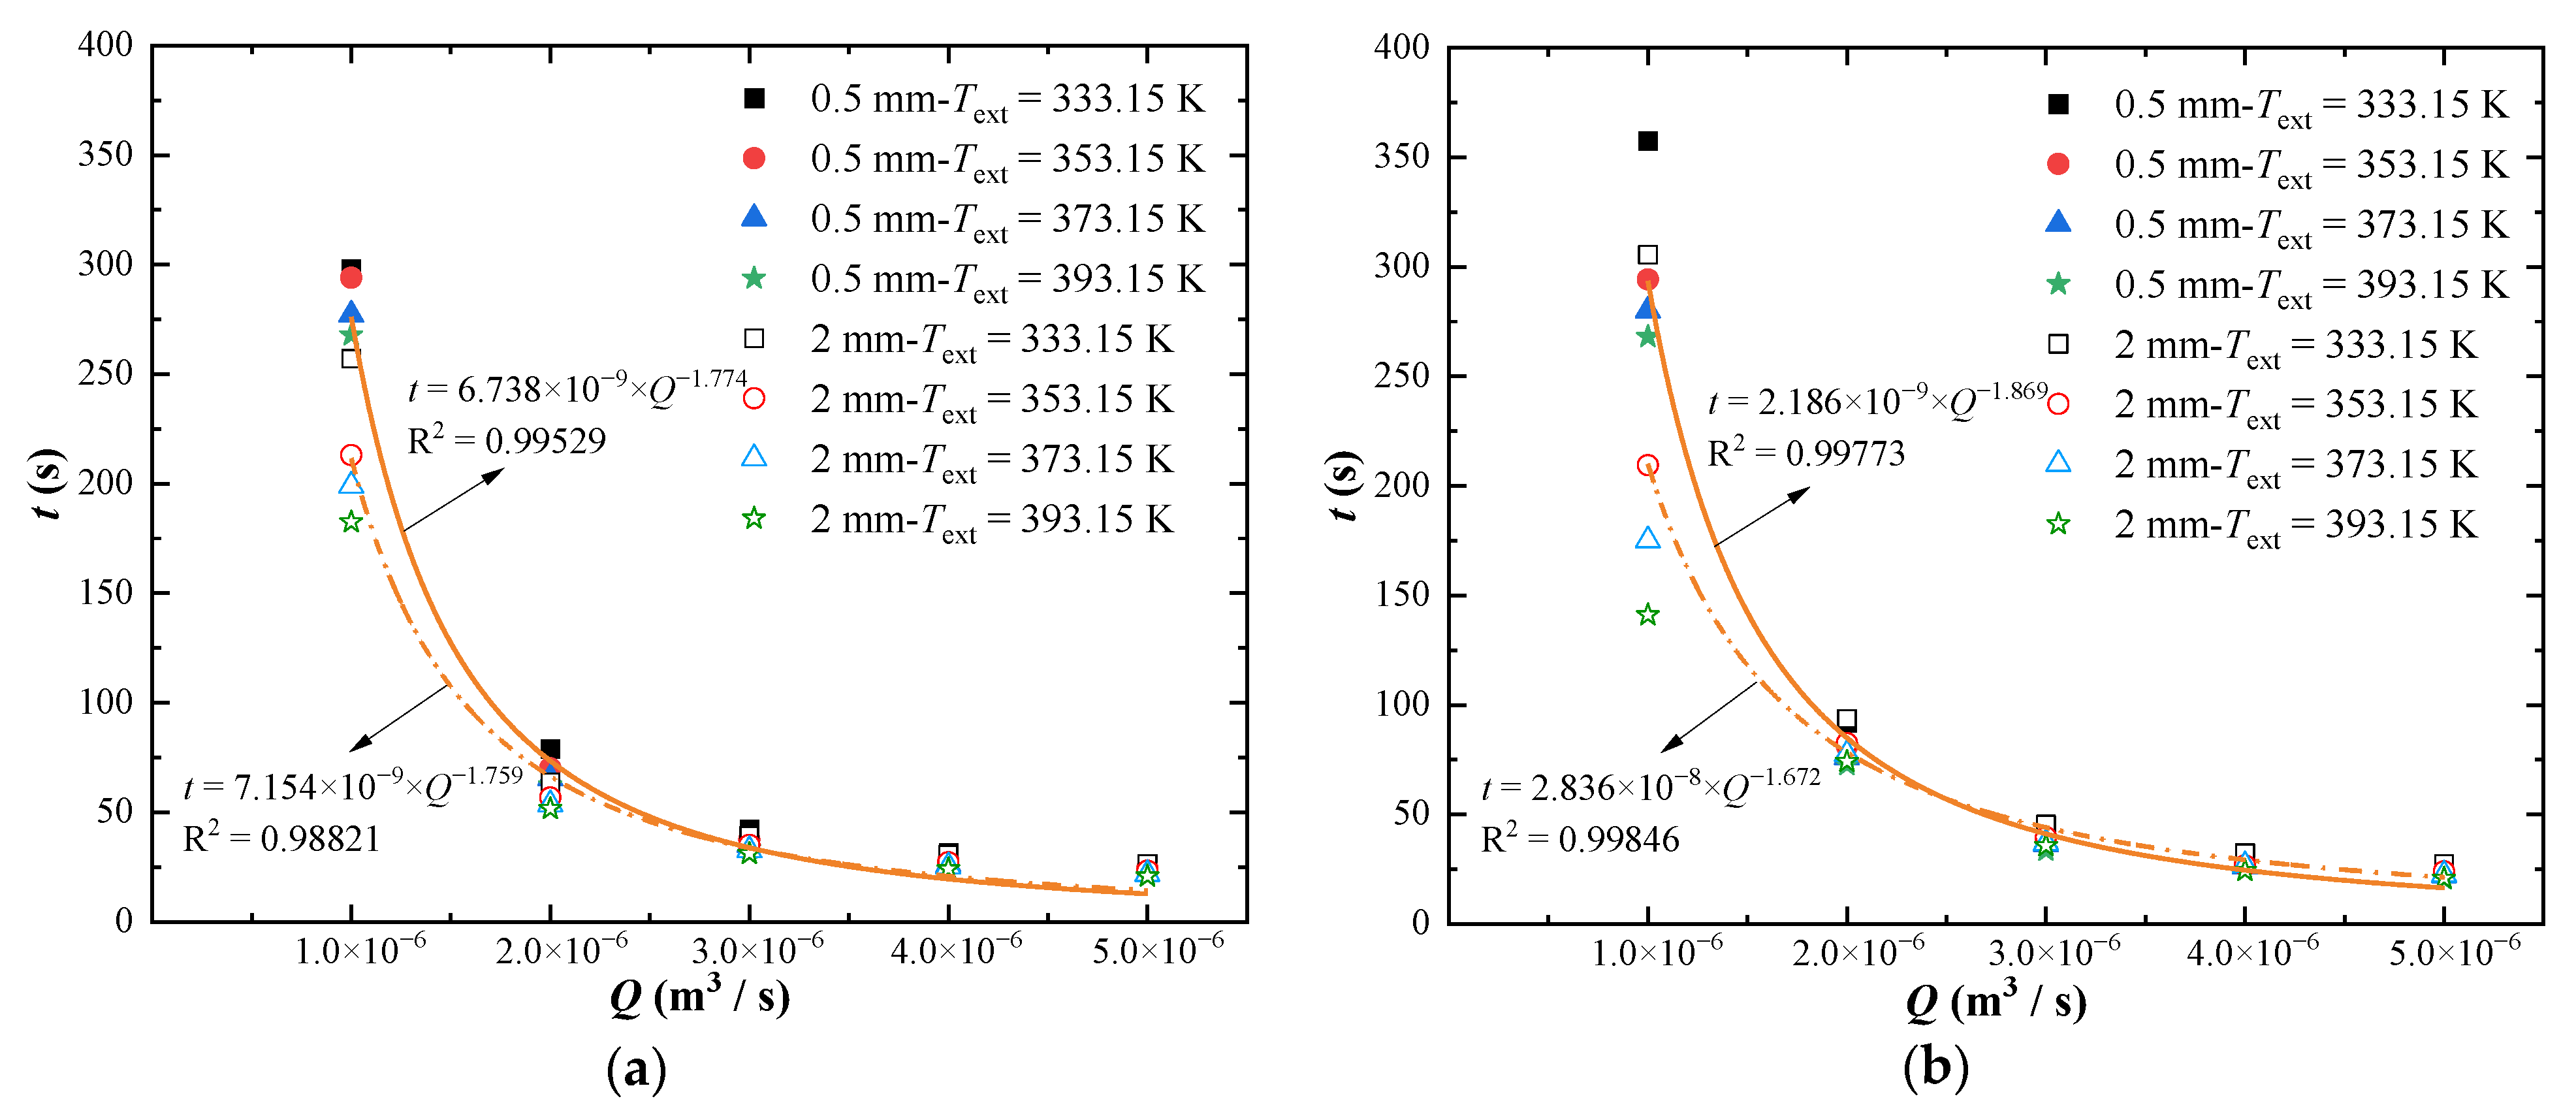
  • Surface roughness has a substantial impact on temperature distribution, leading to heterogeneous thermal profiles, especially in narrower fractures where water–rock heat exchange is enhanced. This highlights the critical role of fracture morphology in heat transfer characteristics. Furthermore, the roughness of fracture surfaces facilitates a decrease in temperature, resulting in lower outlet temperatures. This phenomenon is attributed to the longer flow paths and the increased heat transfer area caused by the surface irregularities;
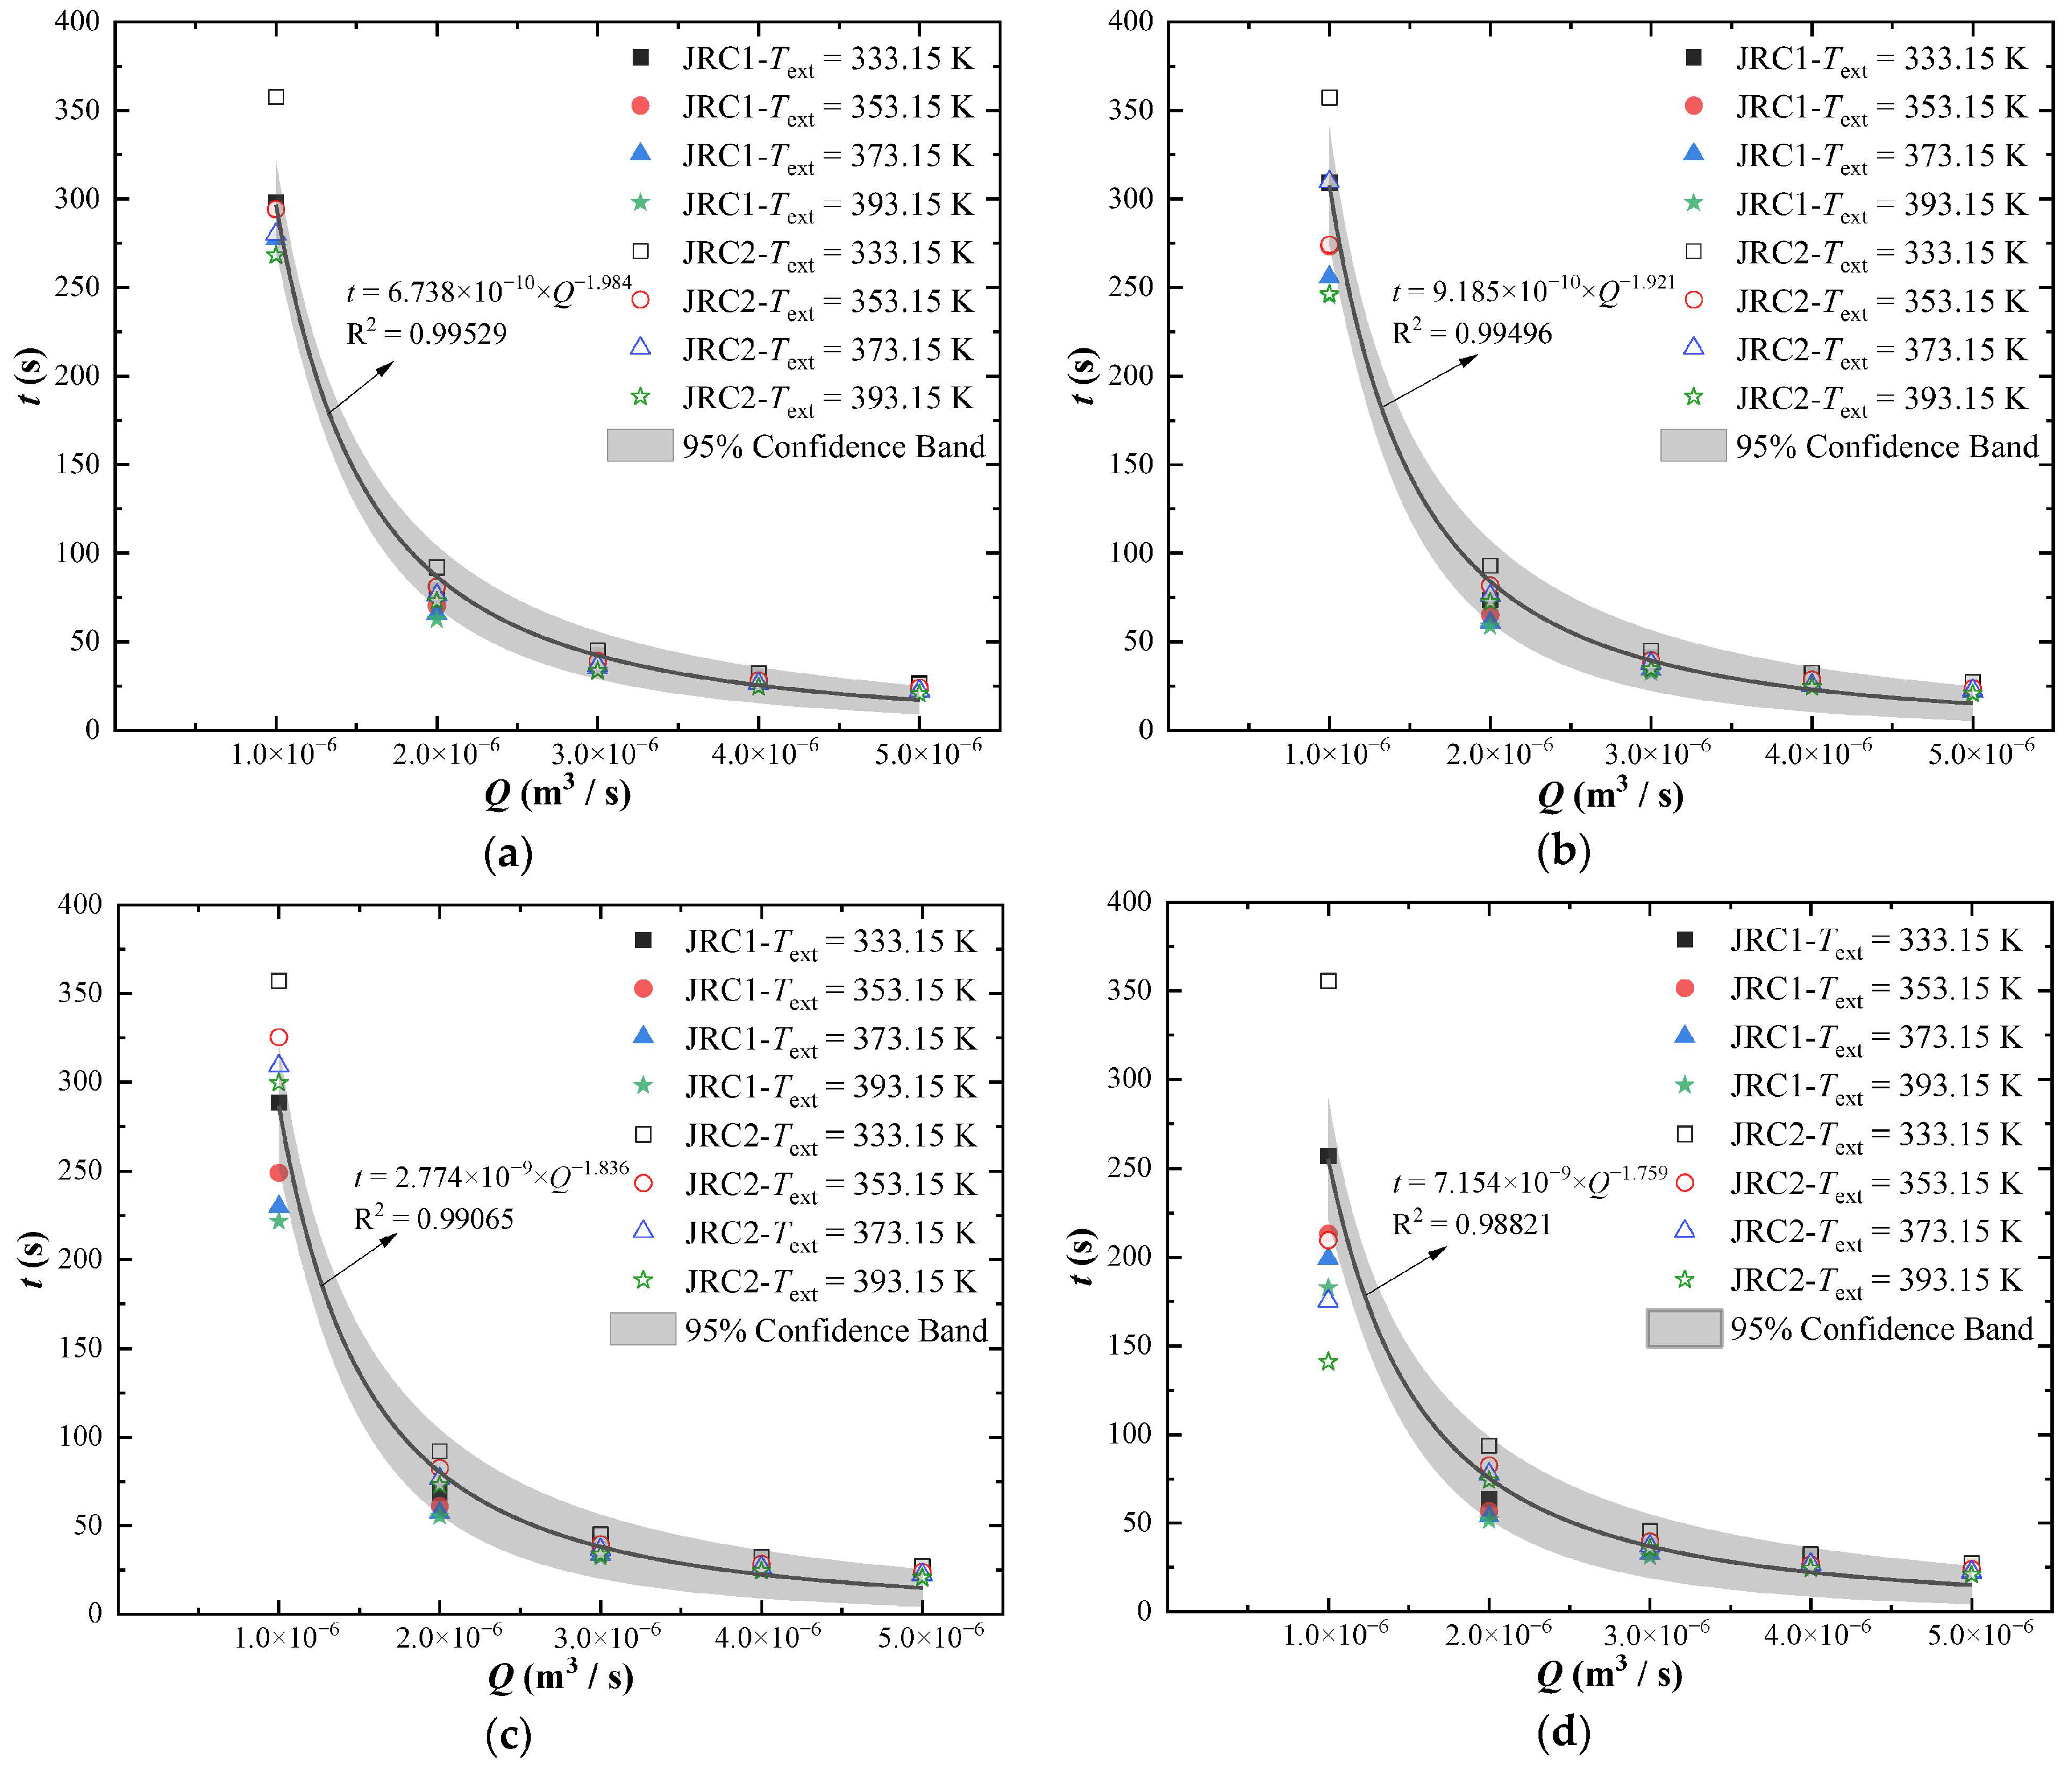
  • The timing of thermal breakthrough is significantly influenced by several factors. Higher external temperatures and flow rates result in faster thermal breakthroughs by reducing thermal resistance and enhancing convective heat transfer. By optimizing injection rates, the lifespan of the reservoir can be prolonged by preventing premature thermal breakthroughs. Furthermore, the relationship between surface roughness and thermal breakthrough time is intricate; increased roughness in smaller apertures tends to prolong breakthrough times, whereas in larger apertures, it can yield the opposite effect.
It should be noted that the numerical simulations in this research do not account for the potential rock deformation caused by hydraulic or thermal fracturing, which could occur under actual geothermal reservoir conditions and should be considered in practical applications.

Author Contributions

Y.Z. conducted the numerical simulation and wrote the main manuscript text. N.H. and Y.J. polished the language. All authors have read and agreed to the published version of the manuscript.

Funding

This study has been partially funded by Research Fund for Young Expert of Taishan Scholars Project in Shandong Province (No. tsqnz20221142) and Major basic research projects of Natural Science Foundation of Shandong Province (No. ZR2019ZD14). These supports are gratefully acknowledged.

Data Availability Statement

The data presented in this study are available from the corresponding author on reasonable request.

Conflicts of Interest

The authors declare no conflicts of interest.

References

  1. Fridleifsson, I.B. Geothermal energy for the benefit of the people. Renew. Sustain. Energy Rev. 2001, 5, 299–312. [Google Scholar] [CrossRef]
  2. Lund, J.W.; Freeston, D.H. World-wide direct uses of geothermal energy. Geothermics 2001, 30, 29–68. [Google Scholar] [CrossRef]
  3. Lu, W.; Xiang, Y. Experiments and sensitivity analyses for heat transfer in a meter-scale regularly fractured granite model with water flow. J. Zhejiang Univ. SCIENCE A 2012, 13, 958–968. [Google Scholar] [CrossRef]
  4. Xu, R.; Zhang, L.; Zhang, F.; Jiang, P. A review on heat transfer and energy conversion in the enhanced geothermal systems with water/CO2 as working fluid. Int. J. Energy Res. 2015, 39, 1722–1741. [Google Scholar] [CrossRef]
  5. Shaik, A.R.; Rahman, S.S.; Tran, N.H.; Tran, T. Numerical simulation of Fluid-Rock coupling heat transfer in naturally fractured geothermal system. Appl. Therm. Eng. 2011, 31, 1600–1606. [Google Scholar] [CrossRef]
  6. Abbasi, M.; Mansouri, M.; Daryasafar, A.; Sharifi, M. Analytical model for heat transfer between vertical fractures in fractured geothermal reservoirs during water injection. Renew. Energy 2019, 130, 73–86. [Google Scholar] [CrossRef]
  7. Zhao, Z. On the heat transfer coefficient between rock fracture walls and flowing fluid. Comput. Geotech. 2014, 59, 105–111. [Google Scholar] [CrossRef]
  8. Li, Z.W.; Feng, X.T.; Zhang, Y.J.; Zhang, C.; Xu, T.F.; Wang, Y.S. Experimental research on the convection heat transfer characteristics of distilled water in manmade smooth and rough rock fractures. Energy 2017, 133, 206–218. [Google Scholar] [CrossRef]
  9. Kamali-Asl, A.; Ghazanfari, E.; Perdrial, N.; Bredice, N. Experimental study of fracture response in granite specimens subjected to hydrothermal conditions relevant for enhanced geothermal systems. Geothermics 2018, 72, 205–224. [Google Scholar] [CrossRef]
  10. Luo, J.; Luo, J.; Zhu, Y.; Guo, Q.; Tan, L.; Zhuang, Y.; Liu, M.; Zhang, C.; Xiang, W.; Rohn, J. Experimental investigation of the hydraulic and heat-transfer properties of artificially fractured granite. Sci. Rep. 2017, 7, 39882. [Google Scholar] [CrossRef]
  11. Huang, F.; Yao, C.; Zhang, X.; Wu, L.; Shao, Y.; Zhou, C. Effects of fracture parameters and roughness on heat-flow coupling in rock masses with two-dimensional fracture networks. Energy Sci. Eng. 2021, 9, 1216–1231. [Google Scholar] [CrossRef]
  12. Klepikova, M.; Méheust, Y.; Roques, C.; Linde, N. Heat transport by flow through rough rock fractures: A numerical investigation. Adv. Water Resour. 2021, 156, 104042. [Google Scholar] [CrossRef]
  13. Luo, S.; Zhao, Z.; Peng, H.; Pu, H. The role of fracture surface roughness in macroscopic fluid flow and heat transfer in fractured rocks. Int. J. Rock Mech. Min. Sci. 2016, 87, 29–38. [Google Scholar] [CrossRef]
  14. Luo, Y.; Xu, W.; Lei, Y.; Wu, P.; Qin, G.; Ba, R. Experimental study of heat transfer by water flowing through smooth and rough rock fractures. Energy Rep. 2019, 5, 1025–1029. [Google Scholar] [CrossRef]
  15. Ma, Y.; Zhang, Y.; Hu, Z.; Yu, Z.; Huang, Y.; Zhang, C. Experimental study of the heat transfer by water in rough fractures and the effect of fracture surface roughness on the heat transfer characteristics. Geothermics 2019, 81, 235–242. [Google Scholar] [CrossRef]
  16. Zhao, J. Experimental study of flow-rock heat transfer in rock fractures. Chin. J. Rock Mech. Eng. 1999, 18, 119–123. [Google Scholar]
  17. Zhao, J.; Tso, C.P. Heat transfer by water flow in rock fractures and the application to hot dry rock geothermal systems. Int. J. Rock Mech. Min. Sci. Geomech. Abstr. 1993, 30, 6. [Google Scholar] [CrossRef]
  18. Ma, Y.; Zhang, Y.; Yu, Z.; Huang, Y.; Zhang, C. Heat transfer by water flowing through rough fractures and distribution of local heat transfer coefficient along the flow direction. Int. J. Heat Mass Transf. 2018, 119, 139–147. [Google Scholar] [CrossRef]
  19. Bai, B.; He, Y.; Li, X.; Li, J.; Huang, X.; Zhu, J. Experimental and analytical study of the overall heat transfer coefficient of water flowing through a single fracture in a granite core. Appl. Therm. Eng. 2017, 116, 79–90. [Google Scholar] [CrossRef]
  20. Bai, B.; He, Y.; Li, X.; Hu, S.; Huang, X.; Li, J.; Zhu, J. Local heat transfer characteristics of water flowing through a single fracture within a cylindrical granite specimen. Environ. Earth Sci. 2016, 75, 1460. [Google Scholar] [CrossRef]
  21. He, Y.; Bai, B.; Hu, S.; Li, X. Effects of surface roughness on the heat transfer characteristics of water flow through a single granite fracture. Comput. Geotech. 2016, 80, 312–321. [Google Scholar] [CrossRef]
  22. He, Y.; Bai, B.; Li, X. Comparative Investigation on the Heat Transfer Characteristics of Gaseous CO2 and Gaseous Water Flowing Through a Single Granite Fracture. Int. J. Thermophys. 2017, 38, 170. [Google Scholar] [CrossRef]
  23. Zhang, B.; Qu, Z.; Guo, T.; Wang, J.; Zhang, Y.; Hao, T. Study on heat transfer characteristics and global sensitivity analysis of a rough single fracture. Prog. Geophys. 2022, 37, 1520–1527. [Google Scholar]
  24. Caulk, R.A.; Ghazanfari, E.; Perdrial, J.N.; Perdrial, N. Experimental investigation of fracture aperture and permeability change within Enhanced Geothermal Systems. Geothermics 2016, 62, 12–21. [Google Scholar] [CrossRef]
  25. Shu, B.; Zhu, R.; Elsworth, D.; Dick, J.; Liu, S.; Tan, J.; Zhang, S. Effect of temperature and confining pressure on the evolution of hydraulic and heat transfer properties of geothermal fracture in granite. Appl. Energy 2020, 272, 115290. [Google Scholar] [CrossRef]
  26. Zhang, L.; Jiang, P.; Wang, Z.; Xu, R. Convective heat transfer of supercritical CO2 in a rock fracture for enhanced geothermal systems. Appl. Therm. Eng. 2017, 115, 923–936. [Google Scholar] [CrossRef]
  27. Chen, Y.; Ma, G.; Wang, H. Heat extraction mechanism in a geothermal reservoir with rough-walled fracture networks. Int. J. Heat Mass Transf. 2018, 126, 1083–1093. [Google Scholar] [CrossRef]
  28. Yao, C.; Shao, Y.; Yang, J.; Huang, F.; He, C.; Jiang, Q.; Zhou, C. Effects of non-darcy flow on heat-flow coupling process in complex fractured rock masses. J. Nat. Gas Sci. Eng. 2020, 83, 103536. [Google Scholar] [CrossRef]
  29. Mohais, R.; Xu, C.; Dowd, P.A. Fluid Flow Through Branched Channels in a Fracture Plane in an Enhanced Geothermal System. ASME International Mechanical Engineering Congress and Exposition. Am. Soc. Mech. Eng. 2012, 45226, 1687–1691. [Google Scholar]
  30. Frank, S.; Heinze, T.; Pollak, S.; Wohnlich, S. Transient heat transfer processes in a single rock fracture at high flow rates. Geothermics 2021, 89, 101989. [Google Scholar] [CrossRef]
  31. Jiang, P.; Zhang, L.; Xu, R. Experimental study of convective heat transfer of carbon dioxide at supercritical pressures in a horizontal rock fracture and its application to enhanced geothermal systems. Appl. Therm. Eng. 2017, 117, 39–49. [Google Scholar] [CrossRef]
  32. Huang, X.; Zhu, J.; Li, J.; Bai, B.; Zhang, G. Fluid friction and heat transfer through a single rough fracture in granitic rock under confining pressure. Int. Commun. Heat Mass Transf. 2016, 75, 78–85. [Google Scholar] [CrossRef]
  33. Luo, J.; Qi, Y.; Zhao, Q.; Tan, L.; Xiang, W.; Rohn, J. Investigation of Flow and Heat Transfer Characteristics in Fractured Granite. Energies 2018, 11, 1228. [Google Scholar] [CrossRef]
  34. Asai, P.; Panja, P.; McLennan, J.; Deo, M. Effect of different flow schemes on heat recovery from Enhanced Geothermal Systems (EGS). Energy 2019, 175, 667–676. [Google Scholar] [CrossRef]
  35. Mandelbrot, B.B.; Van Ness, J.W. Fractional Brownian Motions, Fractional Noises and Applications. SIAM Rev. 1968, 10, 422–437. [Google Scholar] [CrossRef]
  36. Madadi, M.; Sahimi, M. Lattice Boltzmann simulation of fluid flow in fracture networks with rough, self-affine surfaces. Phys. Rev. E 2003, 67, 026309. [Google Scholar] [CrossRef]
  37. Voss, R.F. Random Fractal Forgeries. In Fundamental Algorithms for Computer Graphics; Springer: Berlin/Heidelberg, Germany, 1991; pp. 805–835. [Google Scholar]
  38. Molz, F.J.; Liu, H.H.; Szulga, J. Fractional Brownian motion and fractional Gaussian noise in subsurface hydrology: A review, presentation of fundamental properties, and extensions. Water Resour. Res. 1997, 33, 2273–2286. [Google Scholar] [CrossRef]
  39. Ye, Z.; Liu, H.-H.; Jiang, Q.; Zhou, C. Two-phase flow properties of a horizontal fracture: The effect of aperture distribution. Adv. Water Resour. 2015, 76, 43–54. [Google Scholar] [CrossRef]
  40. Family, F.; Vicsek, T. Dynamics of Fractal Surfaces; World Scientific: Singapore, 1991. [Google Scholar]
  41. Wang, M.; Chen, Y.; Ma, G.; Zhou, J.; Zhou, C. Influence of surface roughness on nonlinear flow behaviors in 3D self-affine rough fractures: Lattice Boltzmann simulations. Adv. Water Resour. 2016, 96, 373–388. [Google Scholar] [CrossRef]
  42. Liu, H.; Bodvarsson, G.; Lu, S.; Molz, F. A Corrected and Generalized Successive Random Additions Algorithm for Simulating Fractional Levy Motions. Math. Geol. 2004, 36, 361–378. [Google Scholar] [CrossRef]
  43. Tse, R.; Cruden, D.M. Estimating joint roughness coefficients. Int. J. Rock Mech. Min. Sci. Geomech. Abstr. 1979, 16, 303–307. [Google Scholar] [CrossRef]
  44. Ungemach, P.; Antics, M.; Lalos, P.; Borozdina, O.; Foulquier, L.; Papachristou, M. Geomodelling and well architecture, key issues to sustainable reservoir development. In Proceedings of the 36th Workshop on Geothermal Reservoir Engineering, Stanford, CA, USA, 31 January–2 February 2011. [Google Scholar]
  45. Huang, Y.; Zhang, Y.; Gao, X.; Ma, Y.; Hu, Z. Experimental and numerical investigation of seepage and heat transfer in rough single fracture for thermal reservoir. Geothermics 2021, 95, 102163. [Google Scholar] [CrossRef]
  46. Shiozawa, S.; McClure, M. EGS designs with horizontal wells, multiple stages, and proppant. In Proceedings of the 39th Workshop on Geothermal Reservoir Engineering, Stanford, CA, USA, 24–26 February 2014. [Google Scholar]
  47. Griffin, K.P.; Fu, L.; Moin, P. General method for determining the boundary layer thickness in nonequilibrium flows. Phys. Rev. Fluids 2021, 6, 024608. [Google Scholar] [CrossRef]
  48. Eckert, E.R.; Drake, R.M., Jr. Analysis of Heat and Mass Transfer; Hemisphere Publishing Corporation: Washington, DC, USA, 1987. [Google Scholar]
  49. Kays, W.M.; Crawford, M.E.; Weigand, B. Convective Heat and Mass Transfer; McGraw-Hill: New York, NY, USA, 1980; Volume 4. [Google Scholar]
Figure 1. Rough surfaces generated using different H values. (a) A 2D representation of the fracture surface height using different colors, parameter z denotes the height of the fracture surface; (b) 3D representation of the fracture surface, where the grayscale intensity and surface undulations represent the roughness (for both figures the upper is JRC1 and the lower is JRC2, Cartesian coordinates have been used).
Processes 12 02821 g001
Figure 2. Initial and boundary conditions for heated-flow model.
Processes 12 02821 g002
Figure 3. Mesh of the simulation model (including fracture and the half part of the rock mass).
Processes 12 02821 g003
Figure 4. Fluid temperature fields in JRC2 when volumetric flow rate Q = 1 × 10⁻⁶ m3/s with different external temperature Text and fracture aperture b ((ad) correspond with different b, and the Text from left to right at each aperture is 333.15 K, 353.15 K, 373.15 K and 393.15 K).
Processes 12 02821 g004aProcesses 12 02821 g004b
Figure 5. Fluid temperature fields in JRC2 when b = 2 mm with different Q and Text ((ad) correspond with different Q, and the Text from left to right at each aperture is 333.15 K, 353.15 K, 373.15 K and 393.15 K).
Processes 12 02821 g005
Figure 6. Fluid temperature fields under b = 2 mm and Q = 9 × 10⁻⁶ m3/s with different Text293.15–311.15.
Processes 12 02821 g006aProcesses 12 02821 g006b
Figure 7. Evolution of Tout with Q under different Text values: (a) JRC1; (b) JRC2.
Processes 12 02821 g007
Figure 8. Double-parameter characterizations of Tout: (a) JRC1; (b) JRC2 (the variations in Tout under the same Text and Q reflect the results for different b).
Processes 12 02821 g008
Figure 9. Variation of Tout with time at different Text and Q when b = 0.5 mm; (a) Q = 1 × 10⁻⁶ m3/s; (b) Q = 2 × 10⁻⁶ m3/s; (c) Q = 3 × 10⁻⁶ m3/s; (d) Q = 4 × 10⁻⁶ m3/s. (The horizontal dashed lines from top to bottom represent the thermal breakthrough temperatures at 393.15, 373.15, 353.15 and 333.15K, respectively).
Processes 12 02821 g009
Figure 10. Relationship between thermal breakthrough time t and Q under different Text and JRC. (a) b = 0.5 mm; (b) b = 1 mm; (c) b = 1.5 mm; (d) b = 2 mm.
Processes 12 02821 g010
Figure 11. Relationship between thermal breakthrough time t and Q under different Text and b; (a) JRC1; (b) JRC2.
Processes 12 02821 g011
Figure 12. Relationship between heat transfer quantities Qt and Q for different Text; (a) JRC1; (b) JRC2 (the variations in Qt under the same Text and Q reflect the results for different b).
Processes 12 02821 g012
Figure 13. Double-parameter characterizations of heat transfer quantities Qt. The differences between the real and fitting values are denoted by the error bar with the vertical lines. (a) JRC1; (b) JRC2 (the variations in Qt under the same Text and Q reflect the results for different b).
Processes 12 02821 g013
Figure 14. Relationship between heat transfer coefficients h and Q; (a) Text = 333.15 K; (b) Text = 353.15 K; (c) Text = 373.15 K; (d) Text = 393.15 K.
Processes 12 02821 g014aProcesses 12 02821 g014b
Table 1. Input parameters for numerical simulations.
ParameterK (W/m·K)ρ (kg/m3)Cp (J/kg·K)
rock3.52200880
fluid0.66210004200
Disclaimer/Publisher’s Note: The statements, opinions and data contained in all publications are solely those of the individual author(s) and contributor(s) and not of MDPI and/or the editor(s). MDPI and/or the editor(s) disclaim responsibility for any injury to people or property resulting from any ideas, methods, instructions or products referred to in the content.

