


Thermodynamic Modeling and Research for Processing Complex Concentrate Blends in Custom Copper Smelters for Maximum Revenue


Abstract
1. Introduction
2. Materials and Methods
2.1. Concentrate Evaluation
2.2. Thermodynamic Calculations
[Cu+2, Fe+2, Fe+3, Ni2+, Al+3, Ca+2, Mg+2, Zn+2, Vacancy0]2octohedralO4, CEF
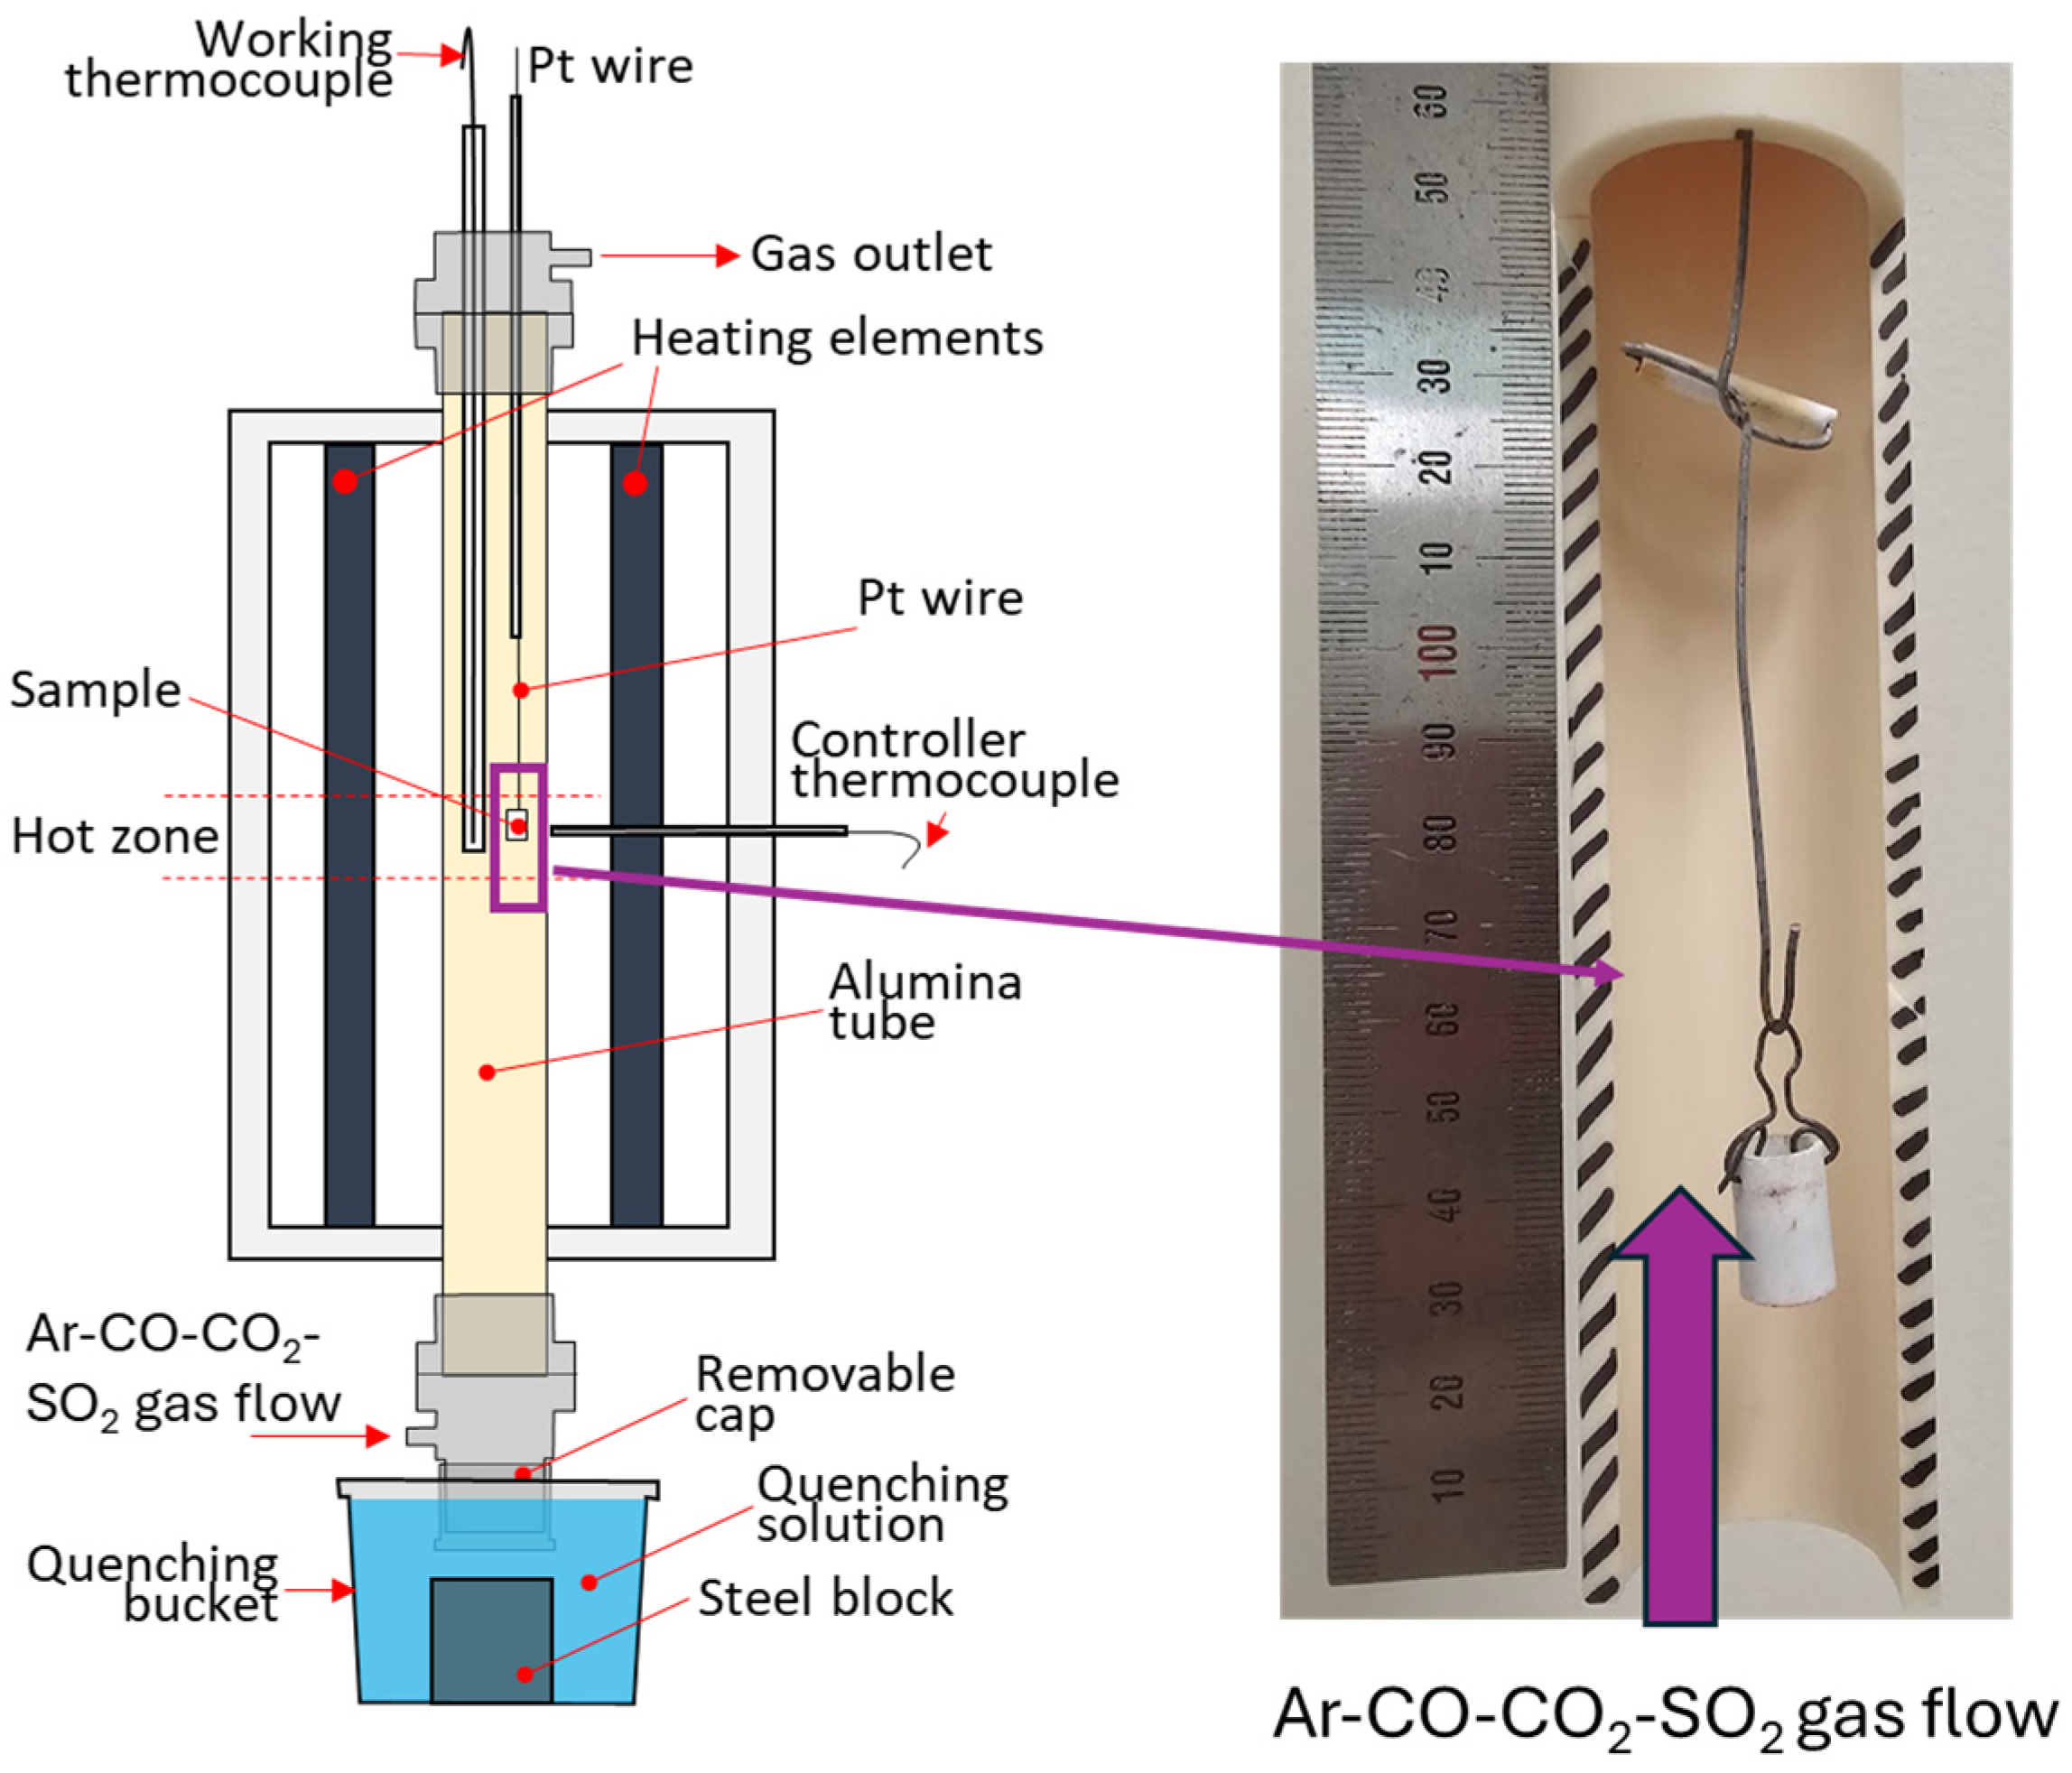
2.3. Experimental Study
3. Results
3.1. Revenue Calculations
3.2. Results of Thermodynamic Calculations

| Compositions | Cu, wt% | Ag ppm | Au ppm | Fe, wt% | O, wt% | S, wt% | SiO2, wt% | Al2O3, wt% | CaO, wt% | MgO, wt% |
| Discard slag Case 1 | 0.6 | 0.7 | 0.1 | 43.9 | 14.4 | 0.4 | 31.2 | 4.1 | 2.5 | 1.6 |
| Discard slag Case 2 | 0.8 | 4.7 | 0.7 | 45.0 | 15.5 | 0.4 | 29.0 | 4.0 | 1.8 | 1.7 |
| Anode copper Case 1 | 99.5 | 161.0 | 15.8 | <0.001 | 1490 ppm | 20 ppm | <0.001 | <0.001 | <0.001 | <0.001 |
| Anode copper Case 2 | 99.0 | 679.3 | 124.4 | <0.001 | 1460 ppm | 8 ppm | <0.001 | <0.001 | <0.001 | <0.001 |
| Smelter dust Case 1 | 11.2 | 19 | 2 | 12.8 | 40.0 | 17.5 | 3.9 | 1.2 | 0.3 | 0.5 |
| Smelter dust Case 2 | 8.2 | 68 | 10 | 11.6 | 37.8 | 15.4 | 4.3 | 1.1 | 0.4 | 0.4 |
| Flowsheet recirculation Case 1, % | 20 | 15 | 15 | 20 | 16 | 10 | 10 | 13 | 65 | 10 |
| Flowsheet recirculation Case 2, % | 14 | 10 | 7 | 11 | 6 | 4 | 12 | 7 | 9 | 7 |
| Compositions (continued) | Pb, wt% | Zn, wt% | Ni, wt% | As, wt% | Sb, wt% | Bi, wt% | Mol As/(Bi +Sb) | Cu recov., % | Ag recov., % | Au recov., % |
| Discard slag Case 1 | 0.1 | 0.8 | <0.01 | 0.4 | 0.03 | 0.01 | ||||
| Discard slag Case 2 | 0.5 | 1.0 | 0.05 | 0.2 | 0.07 | 0.01 | ||||
| Anode copper Case 1 | 830 ppm | 9 ppm | 410 ppm | 930 ppm | 140 ppm | 840 ppm | 2 | 98.5 | 98.9 | 99.2 |
| Anode copper Case 2 | 480 ppm | 9 ppm | 2170 ppm | 2780 ppm | 705 ppm | 1010 ppm | 3 | 97.5 | 97.8 | 98.2 |
| Tolerable levels, ppm [39,40] | 4000 | 100 | 3000 | 500–1500 | 350 | 300 | >2 | |||
| Smelter dust Case 1 | 0.3 | 0.4 | <0.001 | 9.6 | 0.02 | 2.2 | ||||
| Smelter dust Case 2 | 2.1 | 0.7 | 0.03 | 12.6 | 0.06 | 5.2 | ||||
| Flowsheet recirculation Case 1, % | 290 | 40 | 80 | 570 | 30 | 1100 | ||||
| Flowsheet recirculation Case 2, % | 200 | 25 | 50 | 400 | 15 | 1030 |
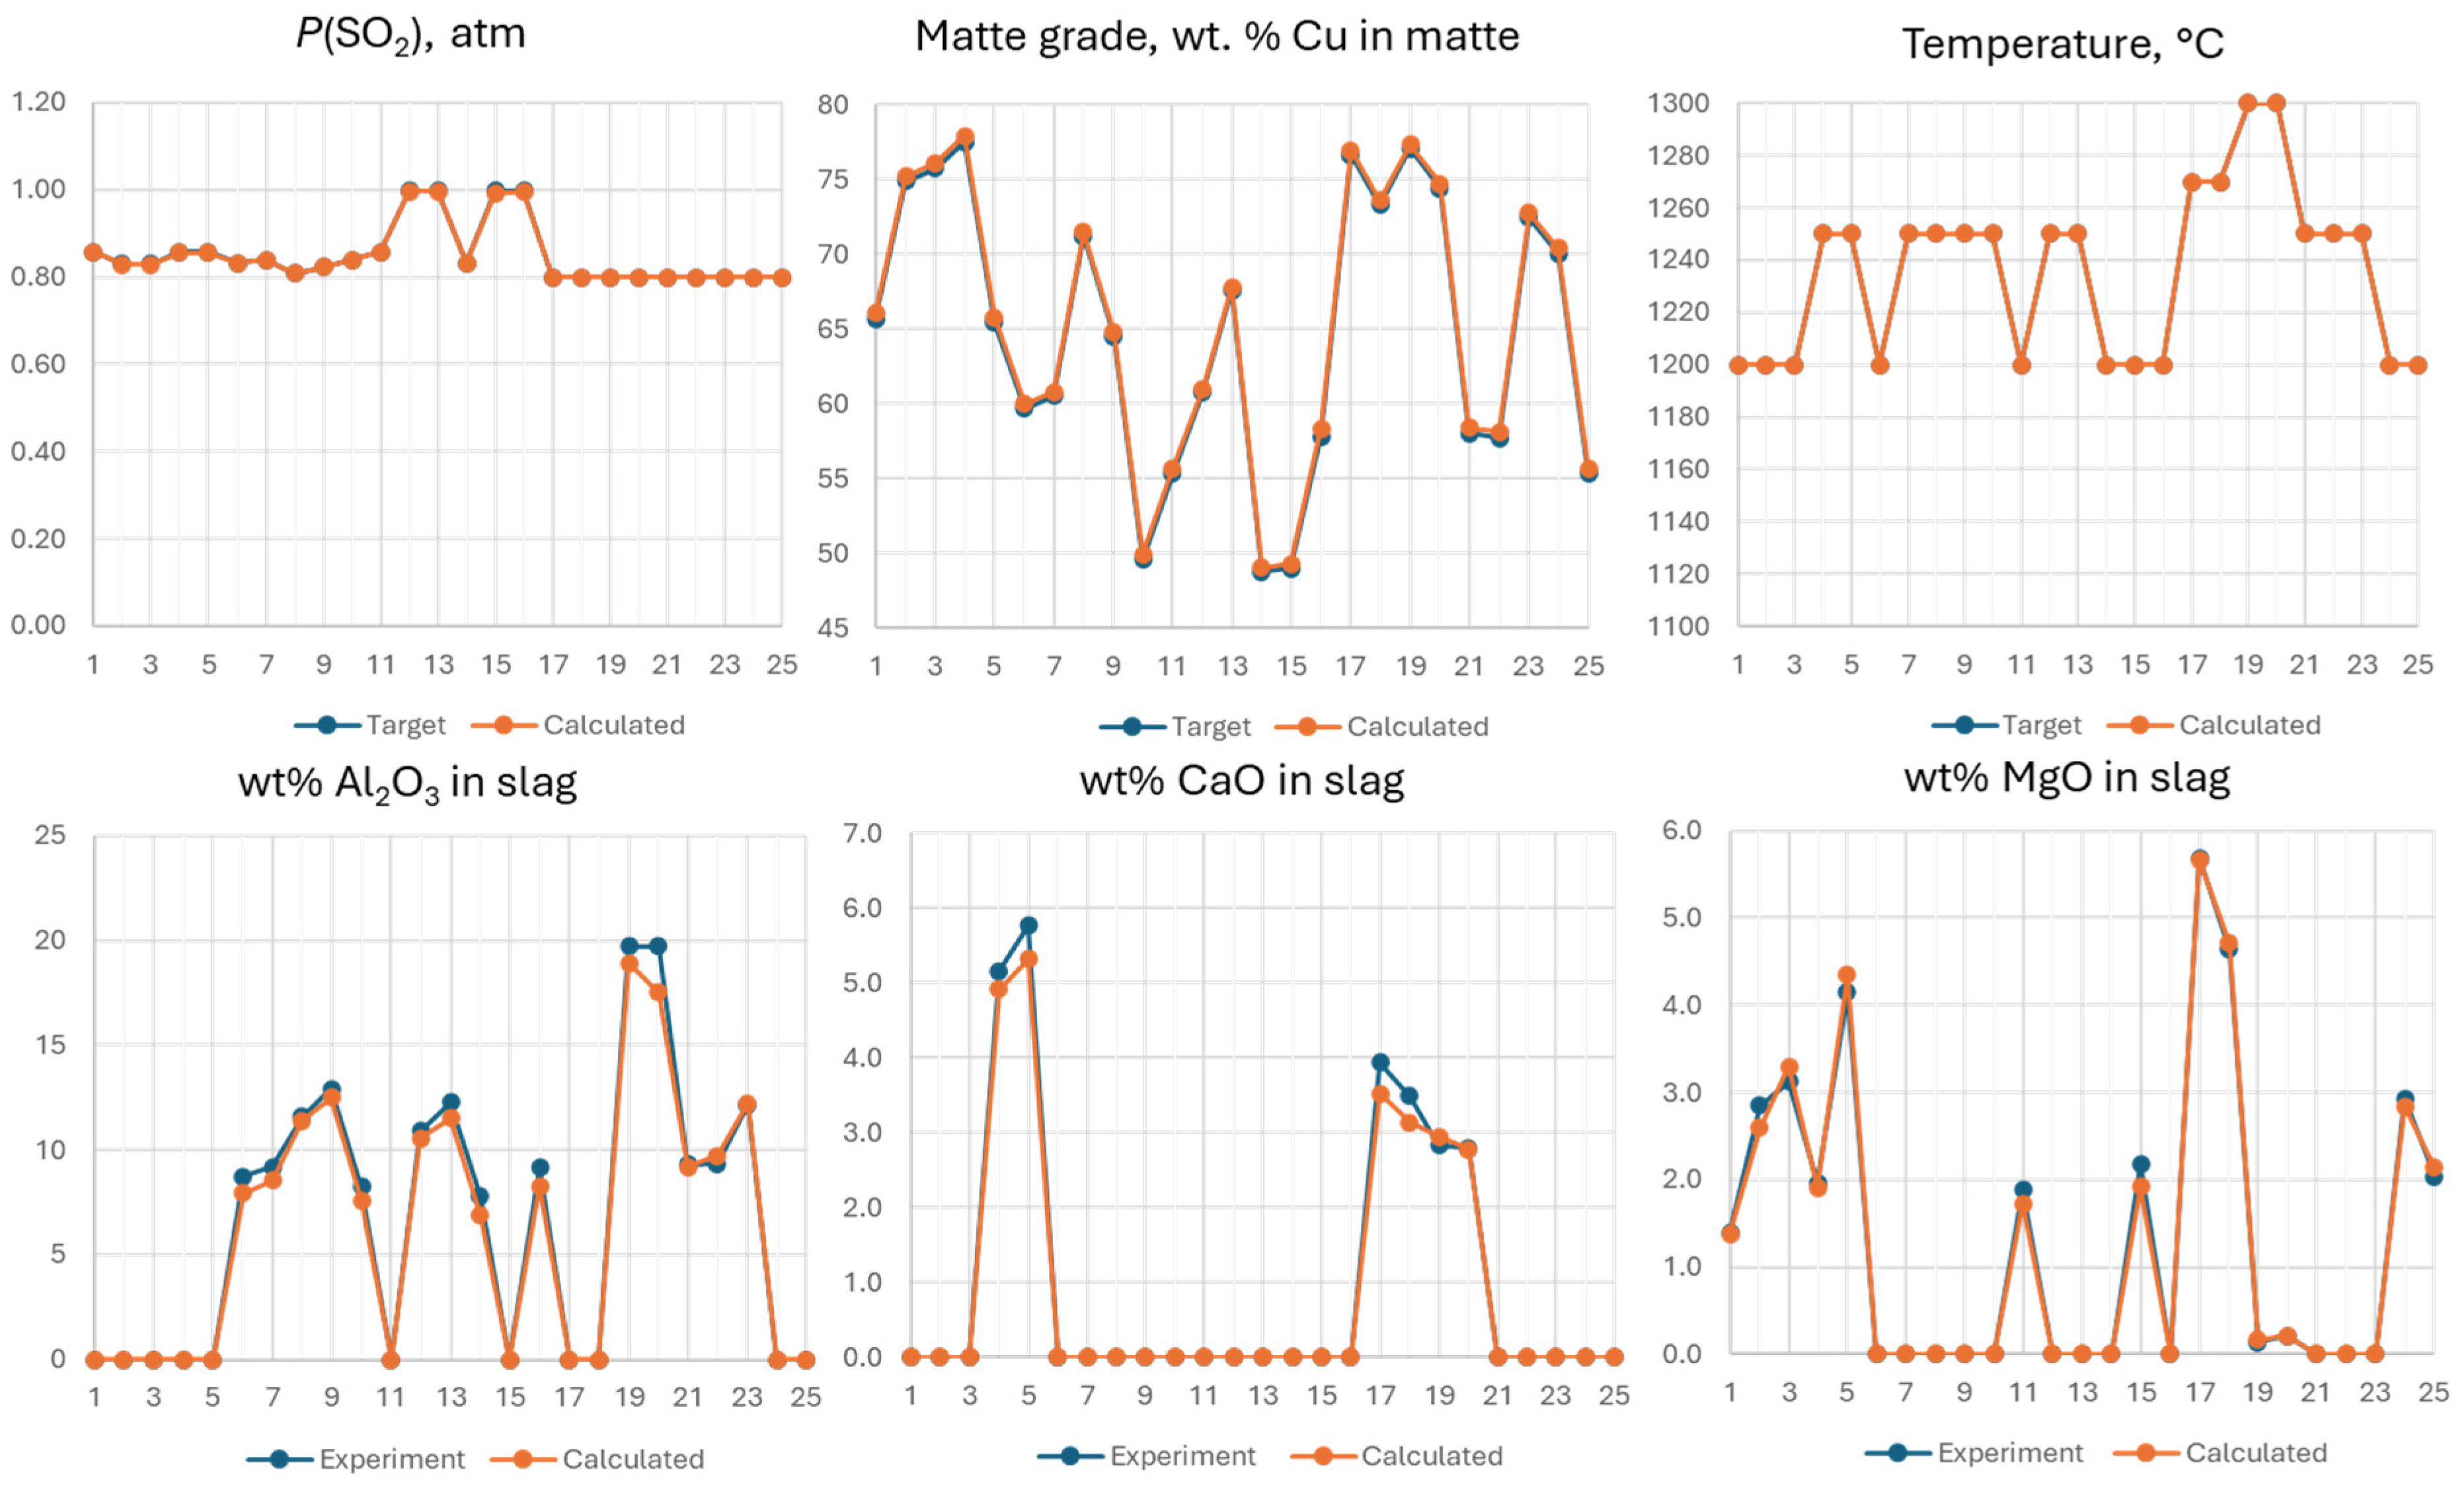
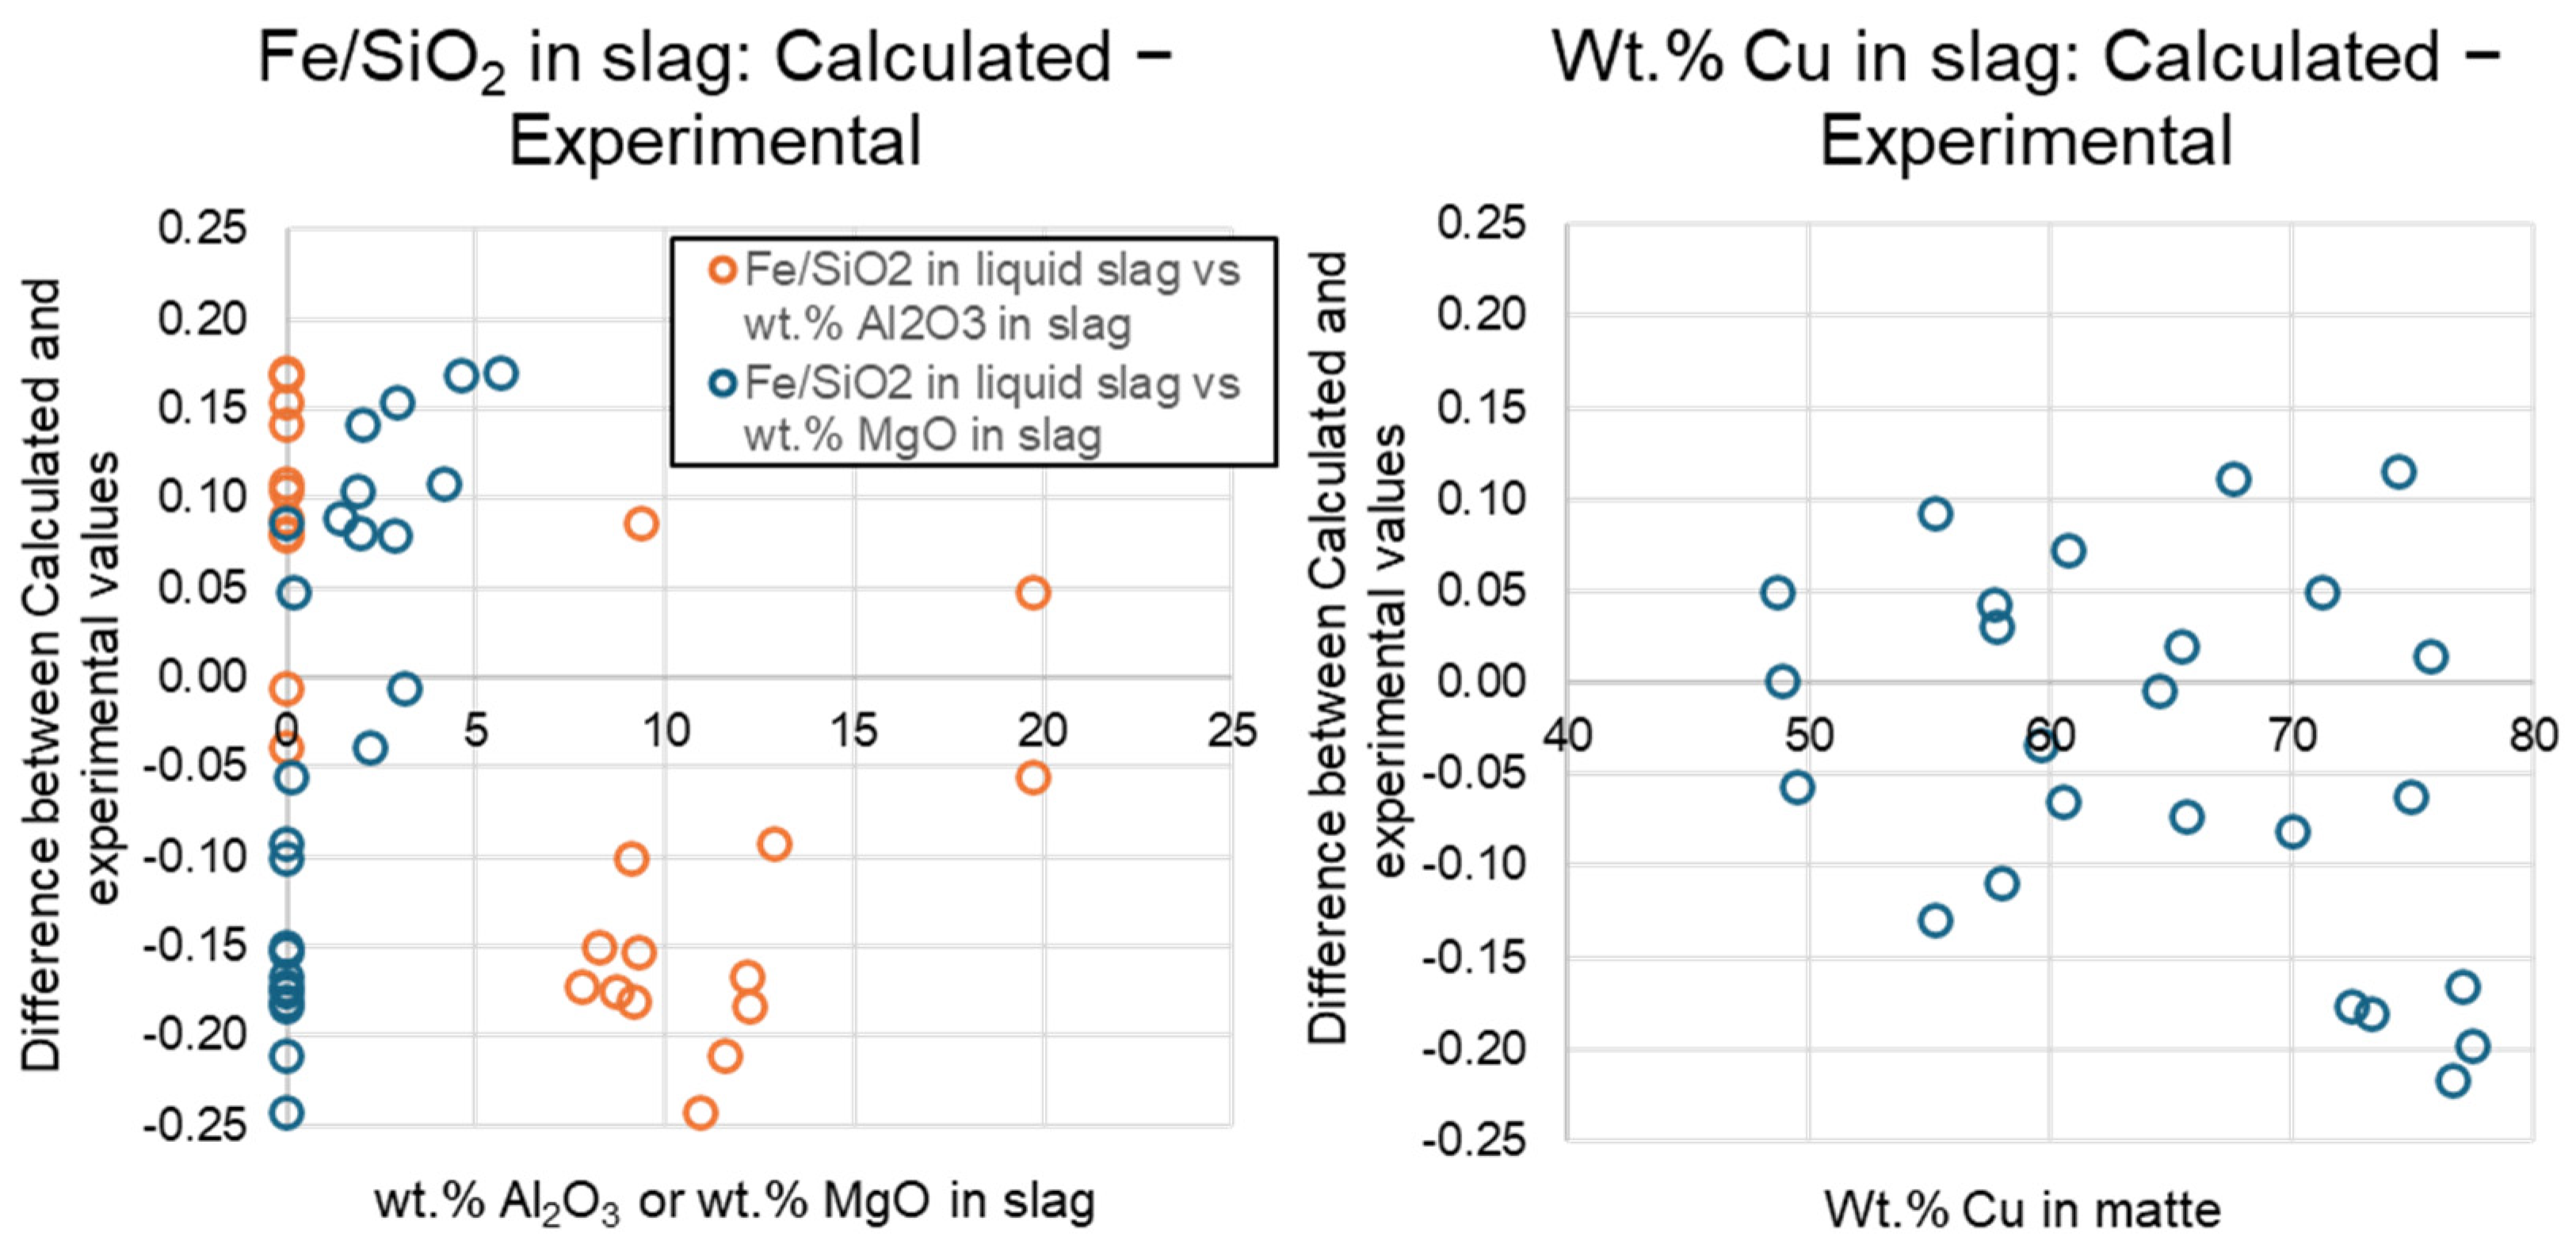
3.3. Analysis of Accuracy of Thermodynamic Predictions
4. Discussion
5. Conclusions
Supplementary Materials
Author Contributions
Funding
Data Availability Statement
Acknowledgments
Conflicts of Interest
References
- Pickens, N.; Griffin, R.G.; Joannides, E.; Liu, Z. Securing copper Supply: No China, No Energy Transition. Horizons Wood Mackenzie. 2024, p. 9. Available online: https://www.woodmac.com/horizons/securing-copper-supply-china-energy-transition/ (accessed on 5 December 2024).
- Zhou, H.; Liu, G.; Zhang, L.; Zhou, C.; Mian, M.M.; Cheema, A.I. Strategies for arsenic pollution control from copper pyrometallurgy based on the study of arsenic sources, emission pathways and speciation characterization in copper flash smelting systems. Environ. Pollut. 2021, 270, 116203. [Google Scholar] [CrossRef] [PubMed]
- Arias, L.; Balladares, E.; Parra, R.; Sbarbaro, D.; Torres, S. Sensors and Process Control in Copper Smelters: A Review of Current Systems and Some Opportunities. Minerals 2021, 11, 1. [Google Scholar] [CrossRef]
- Bale, C.W.; Belisle, E.; Chartrand, P.; Decterov, S.A.; Eriksson, G.; Gheribi, A.E.; Hack, K.; Jung, I.H.; Kang, Y.B.; Melancon, J.; et al. FactSage thermochemical software and databases, 2010–2016. CALPHAD 2016, 54, 35–53. [Google Scholar] [CrossRef]
- Söderström, U. Copper Smelter Revenue Stream. Boliden Capital Markets Day Presentation, 4 November 2008. pp. 1–25. Available online: https://investors.boliden.com/ (accessed on 5 December 2024).
- Payable Metal and Revenue Issues in Relation to Royalty Applying to Prescribed and Particular Minerals. Queensland Government Policy Document, Department of Employment, Economic Development and Innovation, Australia. 2010. Available online: https://www.publications.qld.gov.au/ (accessed on 5 December 2024).
- Salomon-de-Friedberg, H.; Robinson, T. Tackling impurities in copper concentrates. In Proceedings of the ALTA 2015, Perth, Australia, 25–27 May 2015; pp. 398–408. [Google Scholar]
- Shishin, D.; Shevchenko, M.; Jak, E. Challenges and limitations in development of large thermodynamic databases for multiple molten phases using the Modified Quasichemical Formalism. In Proceedings of the Molten 2024, Brisbane, Australia, 17–19 June 2024. [Google Scholar]
- Jak, E.; Shevchenko, M.; Shishin, D.; Nekhoroshev, E.; Chen, J.; Hayes, P. University Research on molten slags, matte, speiss and metal systems for high temperature processing. In Proceedings of the Molten 2024, Brisbane, Australia, 17–19 June 2024. [Google Scholar]
- Shishin, D.; Decterov, S.A.; Jak, E. Thermodynamic assessment of slag-matte-metal equilibria in the Cu-Fe-O-S-Si system. J. Phase Equilib. Diff. 2018, 39, 456–475. [Google Scholar] [CrossRef]
- Shishin, D.; Hidayat, T.; Fallah Mehrjardi, A.; Hayes, P.C.; Decterov, S.A.; Jak, E. Integrated experimental and thermodynamic modelling study of the effects of Al2O3, CaO and MgO on slag–matte equilibria in the Cu-Fe-O-S-Si-(Al, Ca, Mg) system. J. Phase Equilib. Diff. 2018, 40, 445–461. [Google Scholar] [CrossRef]
- Shishin, D.; Hidayat, T.; Chen, J.; Hayes, P.C.; Jak, E. Experimental Investigation and Thermodynamic Modelling of the Distributions of Ag and Au between Slag, Matte and Metal in the Cu-Fe-O-S-Si System. J. Sustain. Metall. 2018, 5, 240–249. [Google Scholar] [CrossRef]
- Pelton, A.D.; Chartrand, P.; Eriksson, G. The modified Quasichemical Model. IV—Two Sublattice Quadruplet Approximation. Metall. Mater. Trans. A 2001, 32, 1409–1415. [Google Scholar] [CrossRef]
- Pelton, A.D.; Chartrand, P. The Modified Quasichemical Model. II—Multicomponent Solutions. Metall. Mater. Trans. A 2001, 32, 1355–1360. [Google Scholar] [CrossRef]
- Shishin, D.; Tripathi, N.; Babaian, I.; Jak, E. The Link Between Slag Chemistry and Arsenic Flows in Primary Copper Smelting. In Proceedings of the 63rd Conference of Metallurgists, COM 2024, Halifax, NS, Canada, 19–22 August 2024; pp. 315–326. [Google Scholar]
- Shishin, D.; Prostakova, V.; Jak, E. Review and thermodynamic analysis of As (arsenic) in copper smelting liquid mattes, metals, slags, speiss and solid phases. In Proceedings of the COPPER 2022, Santiago, Chile, 13–17 November 2022. [Google Scholar]
- Alvear Flores, G.R.F.; Löbbus, M.; Springub, B.; Fallah-Mehrjardi, A.; Tappe, A. Sulfide Smelting: Thirty-Five Years of Continuous Efforts to Find New Value Adding Solutions. In Extraction 2018; The Minerals, Metals & Materials Series; Springer: Cham, Switzerland, 2018; pp. 39–56. [Google Scholar]
- Alexander, C.; Johto, H.; Lindgren, M.; Pesonen, L.; Roine, A. Comparison of environmental performance of modern copper smelting technologies. Clean. Environ. Syst. 2021, 3, 100052. [Google Scholar] [CrossRef]
- Zhao, B.; Liao, J. Development of Bottom-Blowing Copper Smelting Technology: A Review. Metals 2022, 12, 190. [Google Scholar] [CrossRef]
- Liu, Z.; Xia, L. The practice of copper matte converting in China. Miner. Process. Extr. Metall. 2019, 128, 117–124. [Google Scholar] [CrossRef]
- Swinbourne, D.R.; Kho, T.S. Computational Thermodynamics Modeling of Minor Element Distributions During Copper Flash Converting. Metall. Mater. Trans. B 2012, 43, 823–829. [Google Scholar] [CrossRef]
- Kaur, R.; Nexhip, C.; Krippner, D.; George-Kennedy, D.; Routledge, M. Kennecott-Outotec ‘double flash’ technology after 16 years. In Proceedings of the 13th International Flash Smelting Congress, Livingstone, Zambia, 1 October 2011. [Google Scholar]
- Jak, E.; Nexhip, C.; George-Kennedy, D.P. Calcium ferrite slag phase chemistry control used in continuous flash converting. In Proceedings of the Nickolas Themelis Symposium on Pyrometallurgy and Process Engineering, Santiago, Chile, 1–4 December 2013; pp. 503–522. [Google Scholar]
- Wang, Q.; Guo, X. Investigation of the Oxygen Bottom Blown Copper Smelting Process. In Extraction 2018; The Minerals, Metals & Materials Series; Springer: Cham, Switzerland, 2018; pp. 445–461. [Google Scholar]
- Wang, S.; Guo, X. Thermodynamic Modeling of Oxygen Bottom-Blowing Continuous Converting Process; Springer: Berlin/Heidelberg, Germany, 2018; pp. 573–583. [Google Scholar]
- Kaur, R.; Nexhip, C.; Wilson, M.; George-Kennedy, D. Minor element deportment at the Kennecott Utah Copper Smelter. In Proceedings of the Copper 2010, Hamburg, Germany, 6–10 June 2010; pp. 2415–2432. [Google Scholar]
- Xie, S.; Yuan, X.; Liu, F.; Zhao, B. Control of Copper Content in Flash Smelting Slag and the Recovery of Valuable Metals from Slag-A Thermodynamic Consideration. Metals 2023, 13, 153. [Google Scholar] [CrossRef]
- Sineva, S.; Shishin, D.; Starykh, R.; Hayes, P.C.; Jak, E. Equilibrium Distributions of Pb, Bi, and Ag between Fayalite Slag and Copper-Rich Metal, Calcium Ferrite Slag and Copper-Rich Metal. Thermodynamic Assessment and Experimental Study at 1250 °C. J. Sustain. Metall. 2021, 7, 569–582. [Google Scholar] [CrossRef]
- Khartcyzov, G.; Kleeberg, C.; Shevchenko, M.; Shishin, D.; Jak, E. Analysis of slag chemistry in WEEE smelting using experimental and modelling study of the “CuO0.5”-ZnO-FeO-FeO1.5-CaO-SiO2-AlO1.5 system in equilibrium with Cu metal. Ceram. Int. 2024, 50, 26513–26527. [Google Scholar] [CrossRef]
- Yamaguchi, K. Distribution of precious metals between matte and slag and precious metal solubility in slag. In Proceedings of the Copper 2010, Proceedings, Hamburg, Germany, 6–10 June 2010; pp. 1287–1295. [Google Scholar]
- Wang, G.; Zhou, S.; Li, B.; Wei, Y. Copper Concentrate Blending and Melting Prediction Based on Particle Swarm Optimization Algorithm. JOM 2023, 75, 4350–4360. [Google Scholar] [CrossRef]
- Pesonen, L.; Hannu, J.; Jyrkönen, S.; Lindgren, M. Expanded Opex comparison of modern copper smelting technologies and related downstream processes. In Proceedings of the Copper 2022, Santiago, Chile, 13–17 November 2022; Instituto de Ingenieros de Minas de Chile (IIMCh): Santiago, Chile, 2022; Volume 3, pp. 165–181. [Google Scholar]
- Parra, R.; Kapusta, J.P. Early Concept and Development of an “Intelligent Tuyere” for Copper Bath Smelting and Converting; Springer: Cham, Switzerland, 2023; pp. 789–799. [Google Scholar]
- Moosavi-Khoonsari, E.; Tripathi, N. Gold Recovery from Smelting Copper Sulfide Concentrate. Processes 2024, 12, 2795. [Google Scholar] [CrossRef]
- Pavez, O.; Herrera, P.; González, M.T.; Rivera, O. Copper Recovery Through Smelter Slag Flotation in Atacama, Chile: An Industrial Case Study. Ing. E Investig. 2021, 41, e84162. [Google Scholar] [CrossRef]
- Nuorivaara, T.; Klemettinen, A.; Serna-Guerrero, R. Improving the flotation recovery of Cu from flash smelting slags by utilizing cellulose-based frother formulationss. Miner. Eng. 2022, 181, 107522. [Google Scholar] [CrossRef]
- Rinne, T.; Klemettinen, A.; Klemettinen, L.; Ruismäki, R.; O’Brien, H.; Jokilaakso, A.; Serna-Guerrero, R. Recovering Value from End-of-Life Batteries by Integrating Froth Flotation and Pyrometallurgical Copper-Slag Cleaning. Metals 2022, 12, 15. [Google Scholar] [CrossRef]
- Cao, S.; Liu, Z.; Lu, X.; Zhang, L.; Li, Q.; Xia, L. The Phase Transition and Element Distribution of Copper Smelting Slag in the Cooling—Sulfidation Process. Metall. Mater. Trans. B 2023, 54, 969–979. [Google Scholar] [CrossRef]
- Moats, M.S.; Aslin, N.; Pranowo, A.; Alvear Flores, G.R.F. Arsenic’s behaviour and benefits in copper electrorefining. In Proceedings of the COM 2014, 53rd Annual Conference of Metallurgists, Vancouver, BC, Canada, 28 September 1–October 2014. [Google Scholar]
- Larouche, P. Minor Elements in Copper Smelting and Electrorefining. Ph.D. Thesis, McGill University, Montreal, QC, Canada, 2001. [Google Scholar]
- Tan, P.; Woodall, P.; Telford, P. ESP Dust Recovery Process Test Works, Plant Trial, Commissioning, Operations and Metallurgical Performance; Wiley: Hoboken, NJ, USA, 2012; pp. 891–899. [Google Scholar] [CrossRef]
- Joubert, H.; Mc Dougall, I.; Villiers, G.; Nikolic, S.; Dyussekenov, N.; Eggert, M. Design, Construction and Performance of the Copper Cooling System Installed in the First ISACONVERT™ Copper Converting Furnace. In Proceedings of the Copper 2022, Santiago, Chile; 2023; pp. 182–199. [Google Scholar]
- Mwanza, T.; Eggert, M.; Chirwa, W.; Prince, M.; Dyussekenov, N.; Marschall, D. Kansanshi Copper Smelter ISACONVERT™ Furnace Tapping System Design, Operation, and Improvements. In Furnace Tapping; Springer: Berlin/Heidelberg, Germany, 2022; pp. 233–244. [Google Scholar]


| Dry Composition | Cu, wt% | Ag ppm | Au ppm | Fe, wt% | O, wt% | S, wt% | SiO2, wt% | Al2O3, wt% | CaO, wt% | MgO, wt% | +H2O, wt% |
| Concentrate 1 (blend for Case 1) | 25 | 40 | 4 | 28.0 | 0.1 | 34 | 8 | 2.5 | 0.5 | 1.0 | 8.0 |
| Concentrate 2 | 18 | 70 | 80 | 30.0 | 0.3 | 24 | 18 | 4.5 | 2.0 | 2.0 | 8.0 |
| Concentrate 3 | 20 | 3300 | 3 | 20.0 | 0.1 | 31 | 7 | 0.5 | 1.0 | 0.5 | 8.0 |
| Concentrate 4 | 18 | 30 | 3 | 34.5 | 0.1 | 38 | 7 | 1.5 | 0.5 | 0.3 | 8.0 |
| Blend for Case 2 | 21 | 144 | 26.5 | 29.9 | 0.2 | 32 | 10.7 | 2.8 | 1.0 | 1.1 | 8.0 |
| USD/t | USD/g | USD/g | |||||||||
| Price | +9800 | +0.8 | +75 | ||||||||
| Dry Composition (continued) | Pb, wt% | Zn, wt% | Ni, wt% | As, wt% | Sb, wt% | Bi, wt% | Cd, wt% | F, wt% | Hg, wt% | Se, wt% | Price USD/t |
| Concentrate 1 (blend for Case 1) | 0.08 | 0.5 | 0.01 | 0.30 | 0.02 | 0.03 | 0.001 | 0.01 | 0.0003 | 0.005 | 2650 |
| Concentrate 2 | 0.30 | 0.5 | 0.2 | 0.05 | 0.02 | 0.02 | 0.003 | 0.05 | 0.0003 | 0.008 | 7551 |
| Concentrate 3 | 6.50 | 8.5 | 0.01 | 2.40 | 1.50 | 0.30 | 0.003 | 0.01 | 0.0024 | 0.008 | 3940 |
| Concentrate 4 | 0.01 | 0.1 | 0.03 | 0.02 | 0.00 | 0.01 | 0.001 | 0.01 | 0.0004 | 0.017 | 1873 |
| Blend for Case 2 | 0.32 | 0.6 | 0.07 | 0.22 | 0.06 | 0.03 | 0.002 | 0.02 | 0.0004 | 0.009 | 3972 |
| Penalty, USD/0.1 wt. % | −0.3 | −0.3 | −1.0 | −2/−5 | −15 | −25 | −30 | −15 | −3000 | −15 | |
| Penalty limit, wt. % | 1 | 3 | 0.5 | 0.2/1.0 | 0.05 | 0.05 | 0.03 | 0.03 | 0.0005 | 0.03 |
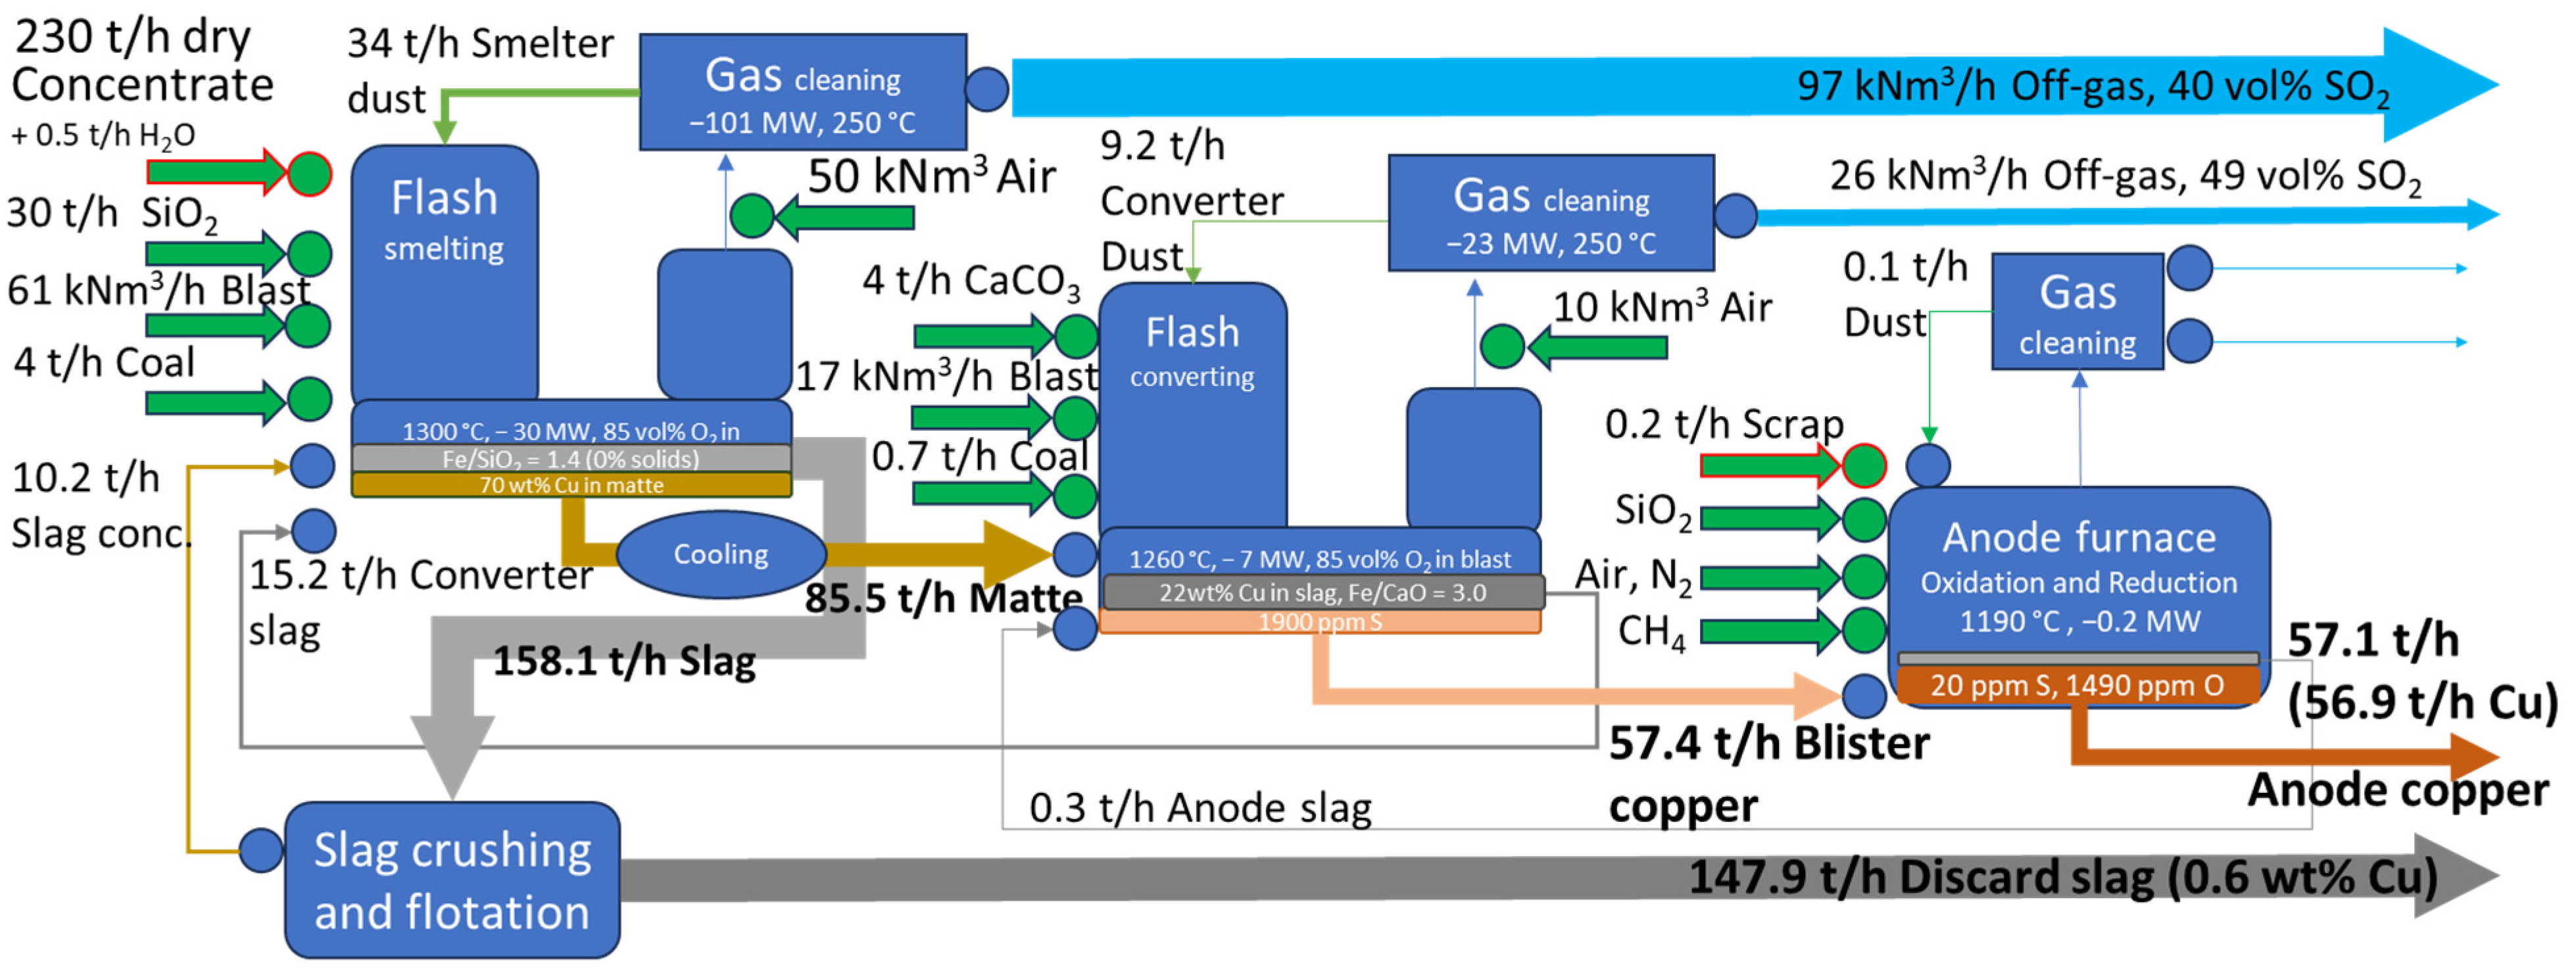
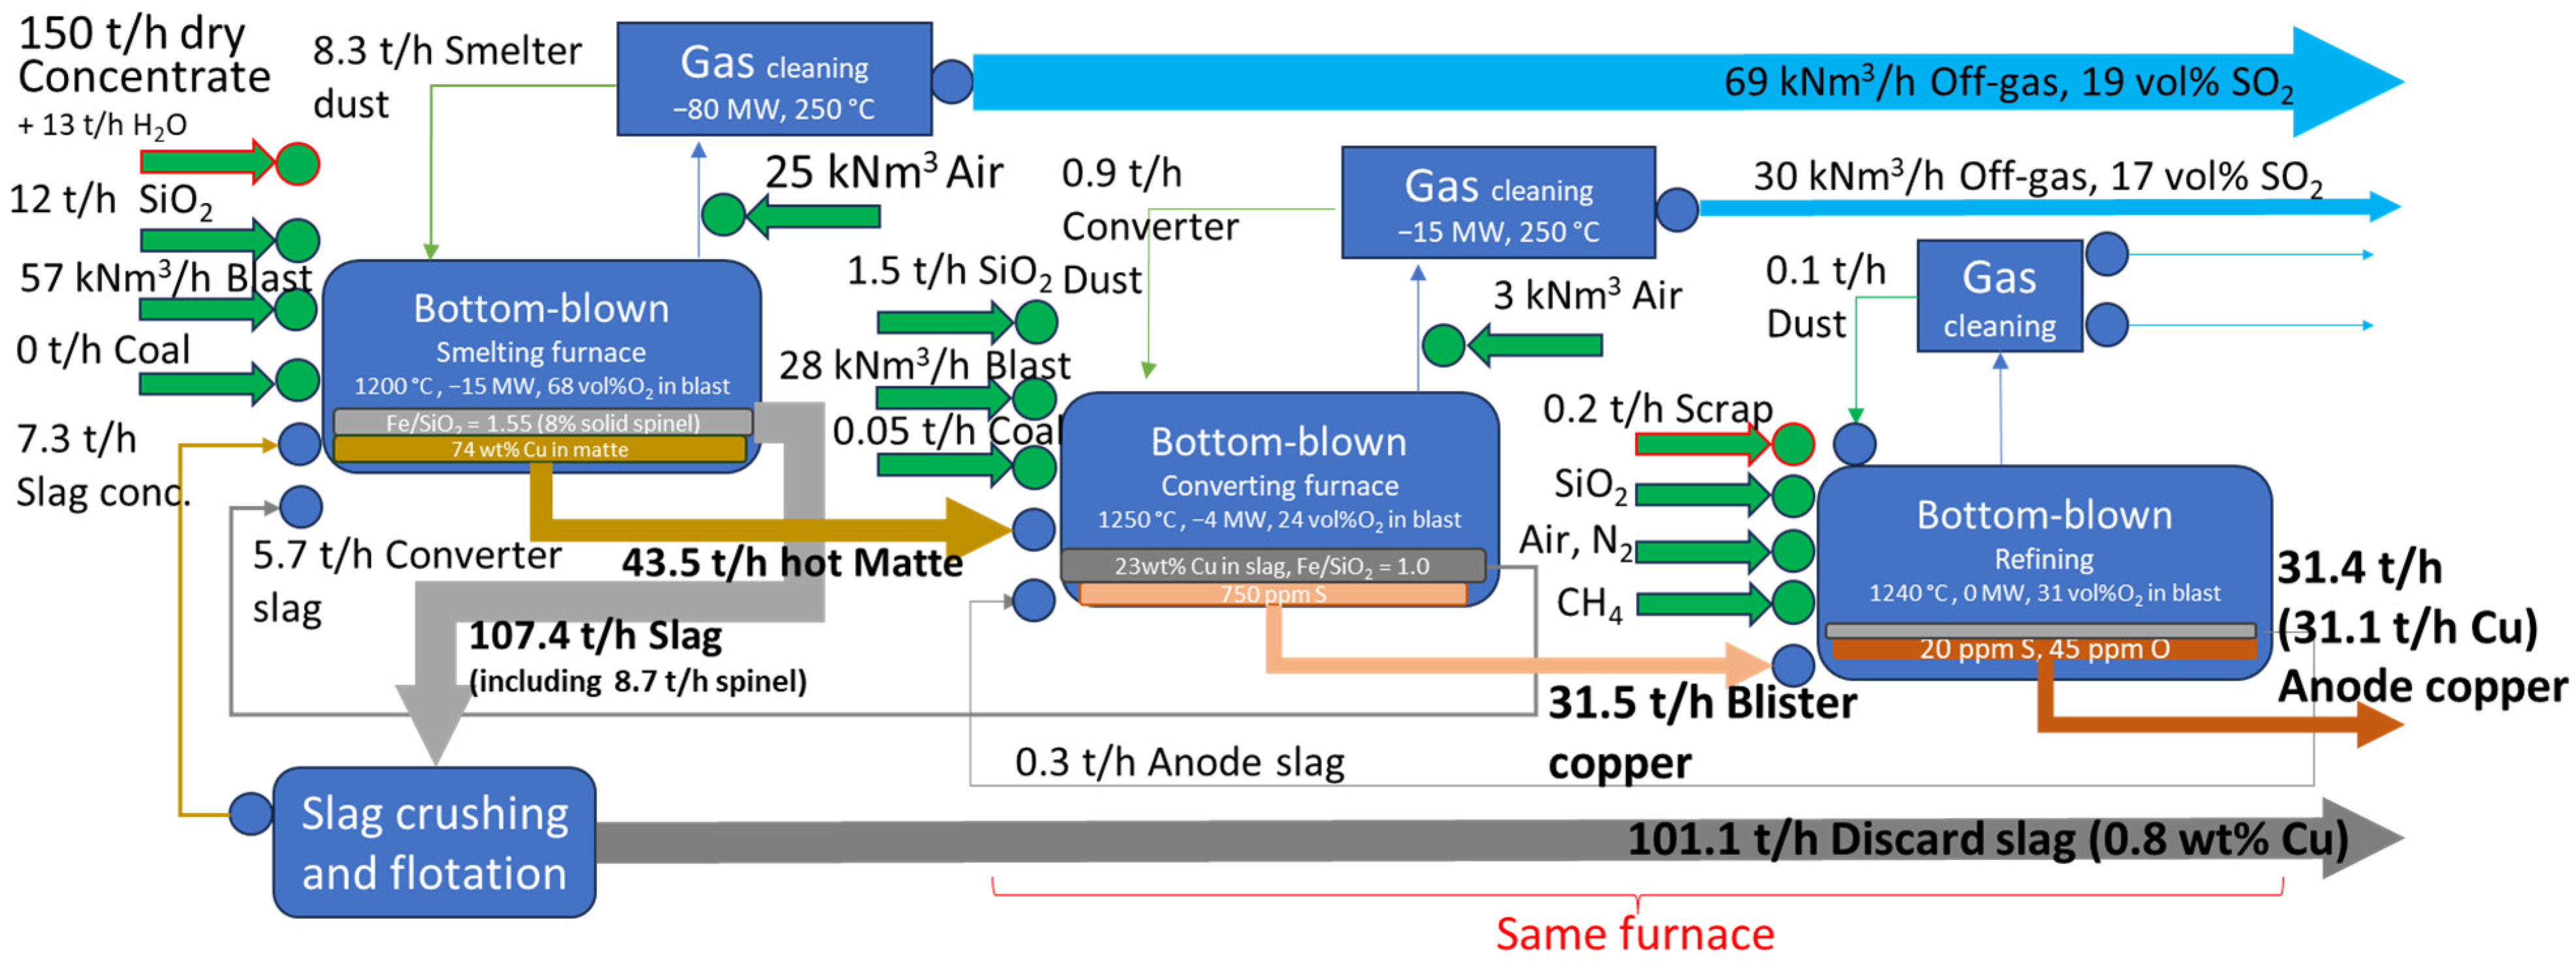
| Process Parameters | Case 1 Smelting | Case 1 Converting | Case 2 Smelting | Case 2 Converting |
|---|---|---|---|---|
| Furnace type | Flash | Flash | Bottom-Blown | Bottom-blown |
| Slag type | Fayalite | Cu2O-Calcium ferrite | Fayalite | Cu2O-Fayalite-based |
| Dry concentrate rate, t/h | 230 [2] | 130 [17] | ||
| Moisture in feed, t/h (%) | 0.5 (0.2%) [18] | 0.0 | 13 (8%) [19] | 0.0 |
| Feed temperature, °C | 150 | 25 | 25 | 1200 [20] |
| Temperature in Reactor zone, °C | 1300 [20] | 1260 [20,21] | 1250 | 1250 [20] |
| Temperature in Settler zone, °C | 1250 [20] | 1250 [20,21] | 1200 [19] | 1250 [20] |
| Oxygen enrichment in the blast, vol. % | 85 [2] | 85 [20] | 68 [19] | 25 [20] |
| Phase equilibria target | Fe/SiO2 in slag = 1.4 (~50 °C above liquidus) [22] | Fe/CaO in slag = 3.0 (~10 °C above liquidus) [22] | Fe/SiO2 in slag + solids = 1.55 (8% solids in slag) [19] | Fe/SiO2 in slag = 1.0 (10 °C above liquidus) [20] |
| Chemical target | 70 wt% Cu in matte [20] | 22 wt% Cu in slag [23] | 74 wt% Cu in matte [24] | 23 wt% Cu in slag [25] |
| Energy balance (−1 × Heat loss), MW | −30 | −7 | −15 | −4 |
| Non-thermodynamic factors | ||||
| Oxygen efficiency, % | 99 | 99 | 90 | 99 |
| Volatile coal, % | 10 | 10 | 10 | 10 |
| Mechanical dust carryover, % | 6 [16] | 5 [20] | 2 [17] | 1 |
| Non-equilibrium As evaporation, % | 60 [16] | 1 [26] | 60 | 1 |
| Entrainment, grams in 100 of slag + solids (estimated from industrial samples) | 1.5 [27] | 0.5 | 2.5 [24] | 0.5 |
| Wt% | Cu | Fe | S | [O] | Al2O3 | SiO2 | Ni | Co | As | Bi | Pb | Zn | Au | Ag | Sb | Mass |
|---|---|---|---|---|---|---|---|---|---|---|---|---|---|---|---|---|
| Slag (exp) | 1.1 | 39.6 | 0.2 | 11.3 | 12.2 | 32.1 | 0.10 | 0.25 | 0.036 | 4.1 × 10⁻⁶ | 0.170 | 0.476 | 5.4 × 10⁻⁵ | 0.005 | 0.55 | 0.90 |
| Matte (exp) | 72.4 | 2.7 | 20.4 | 0.6 | 0.0 | 0.0 | 0.84 | 0.06 | 0.004 | 3.3 × 10⁻⁵ | 0.100 | 0.090 | 0.3920 | 0.478 | 0.11 | 1.00 |
| Spinel (exp) | 0.0 | 48.9 | 0.0 | 14.0 | 31.7 | 0.3 | 0.37 | 0.46 | 0.011 | <1 × 10⁻⁶ | 0.017 | 1.440 | <1 × 10⁻⁶ | 0.000 | 0.01 | 0.10 |
| FactSage Input | 73.4 | 43.3 | 20.5 | 11.9 | 14.1 | 28.9 | 0.96 | 0.33 | 0.038 | 3.7 × 10⁻⁵ | 0.254 | 0.662 | 0.3921 | 0.483 | 0.61 | |
| Slag (calc) | 0.9 | 37.7 | 0.2 | 11.9 | 12.2 | 35.4 | 0.06 | 0.24 | 0.040 | 1.1 × 10⁻⁵ | 0.143 | 0.594 | 6.4 × 10⁻⁵ | 0.004 | 0.63 | 0.82 |
| Matte (calc) | 72.8 | 3.8 | 21.2 | 0.2 | 0.0 | 0.0 | 0.84 | 0.08 | 0.005 | 2.8 × 10⁻⁵ | 0.137 | 0.078 | 0.3924 | 0.480 | 0.09 | 1.00 |
| Spinel (calc) | 0.0 | 53.5 | 0.0 | 19.6 | 25.4 | 0.0 | 0.46 | 0.33 | 0.000 | <1 × 10⁻⁶ | 0.000 | 0.606 | 0.0000 | 0.000 | 0.00 | 0.16 |
Disclaimer/Publisher’s Note: The statements, opinions and data contained in all publications are solely those of the individual author(s) and contributor(s) and not of MDPI and/or the editor(s). MDPI and/or the editor(s) disclaim responsibility for any injury to people or property resulting from any ideas, methods, instructions or products referred to in the content. |
© 2024 by the authors. Licensee MDPI, Basel, Switzerland. This article is an open access article distributed under the terms and conditions of the Creative Commons Attribution (CC BY) license (https://creativecommons.org/licenses/by/4.0/).
Share and Cite
Shishin, D.; Tripathi, N.; Sineva, S.; Jak, E. Thermodynamic Modeling and Research for Processing Complex Concentrate Blends in Custom Copper Smelters for Maximum Revenue. Processes 2024, 12, 2820. https://doi.org/10.3390/pr12122820
Shishin D, Tripathi N, Sineva S, Jak E. Thermodynamic Modeling and Research for Processing Complex Concentrate Blends in Custom Copper Smelters for Maximum Revenue. Processes. 2024; 12(12):2820. https://doi.org/10.3390/pr12122820
Chicago/Turabian StyleShishin, Denis, Nagendra Tripathi, Svetlana Sineva, and Evgueni Jak. 2024. "Thermodynamic Modeling and Research for Processing Complex Concentrate Blends in Custom Copper Smelters for Maximum Revenue" Processes 12, no. 12: 2820. https://doi.org/10.3390/pr12122820
APA StyleShishin, D., Tripathi, N., Sineva, S., & Jak, E. (2024). Thermodynamic Modeling and Research for Processing Complex Concentrate Blends in Custom Copper Smelters for Maximum Revenue. Processes, 12(12), 2820. https://doi.org/10.3390/pr12122820