
Estimation Model of Rockfall Trajectory Lateral Dispersion on Slopes with Loose Granular Cushion Layer Based on Three-Dimensional Discrete Element Method Simulations

Abstract
1. Introduction
2. Construction and Verification of Discrete Element Model
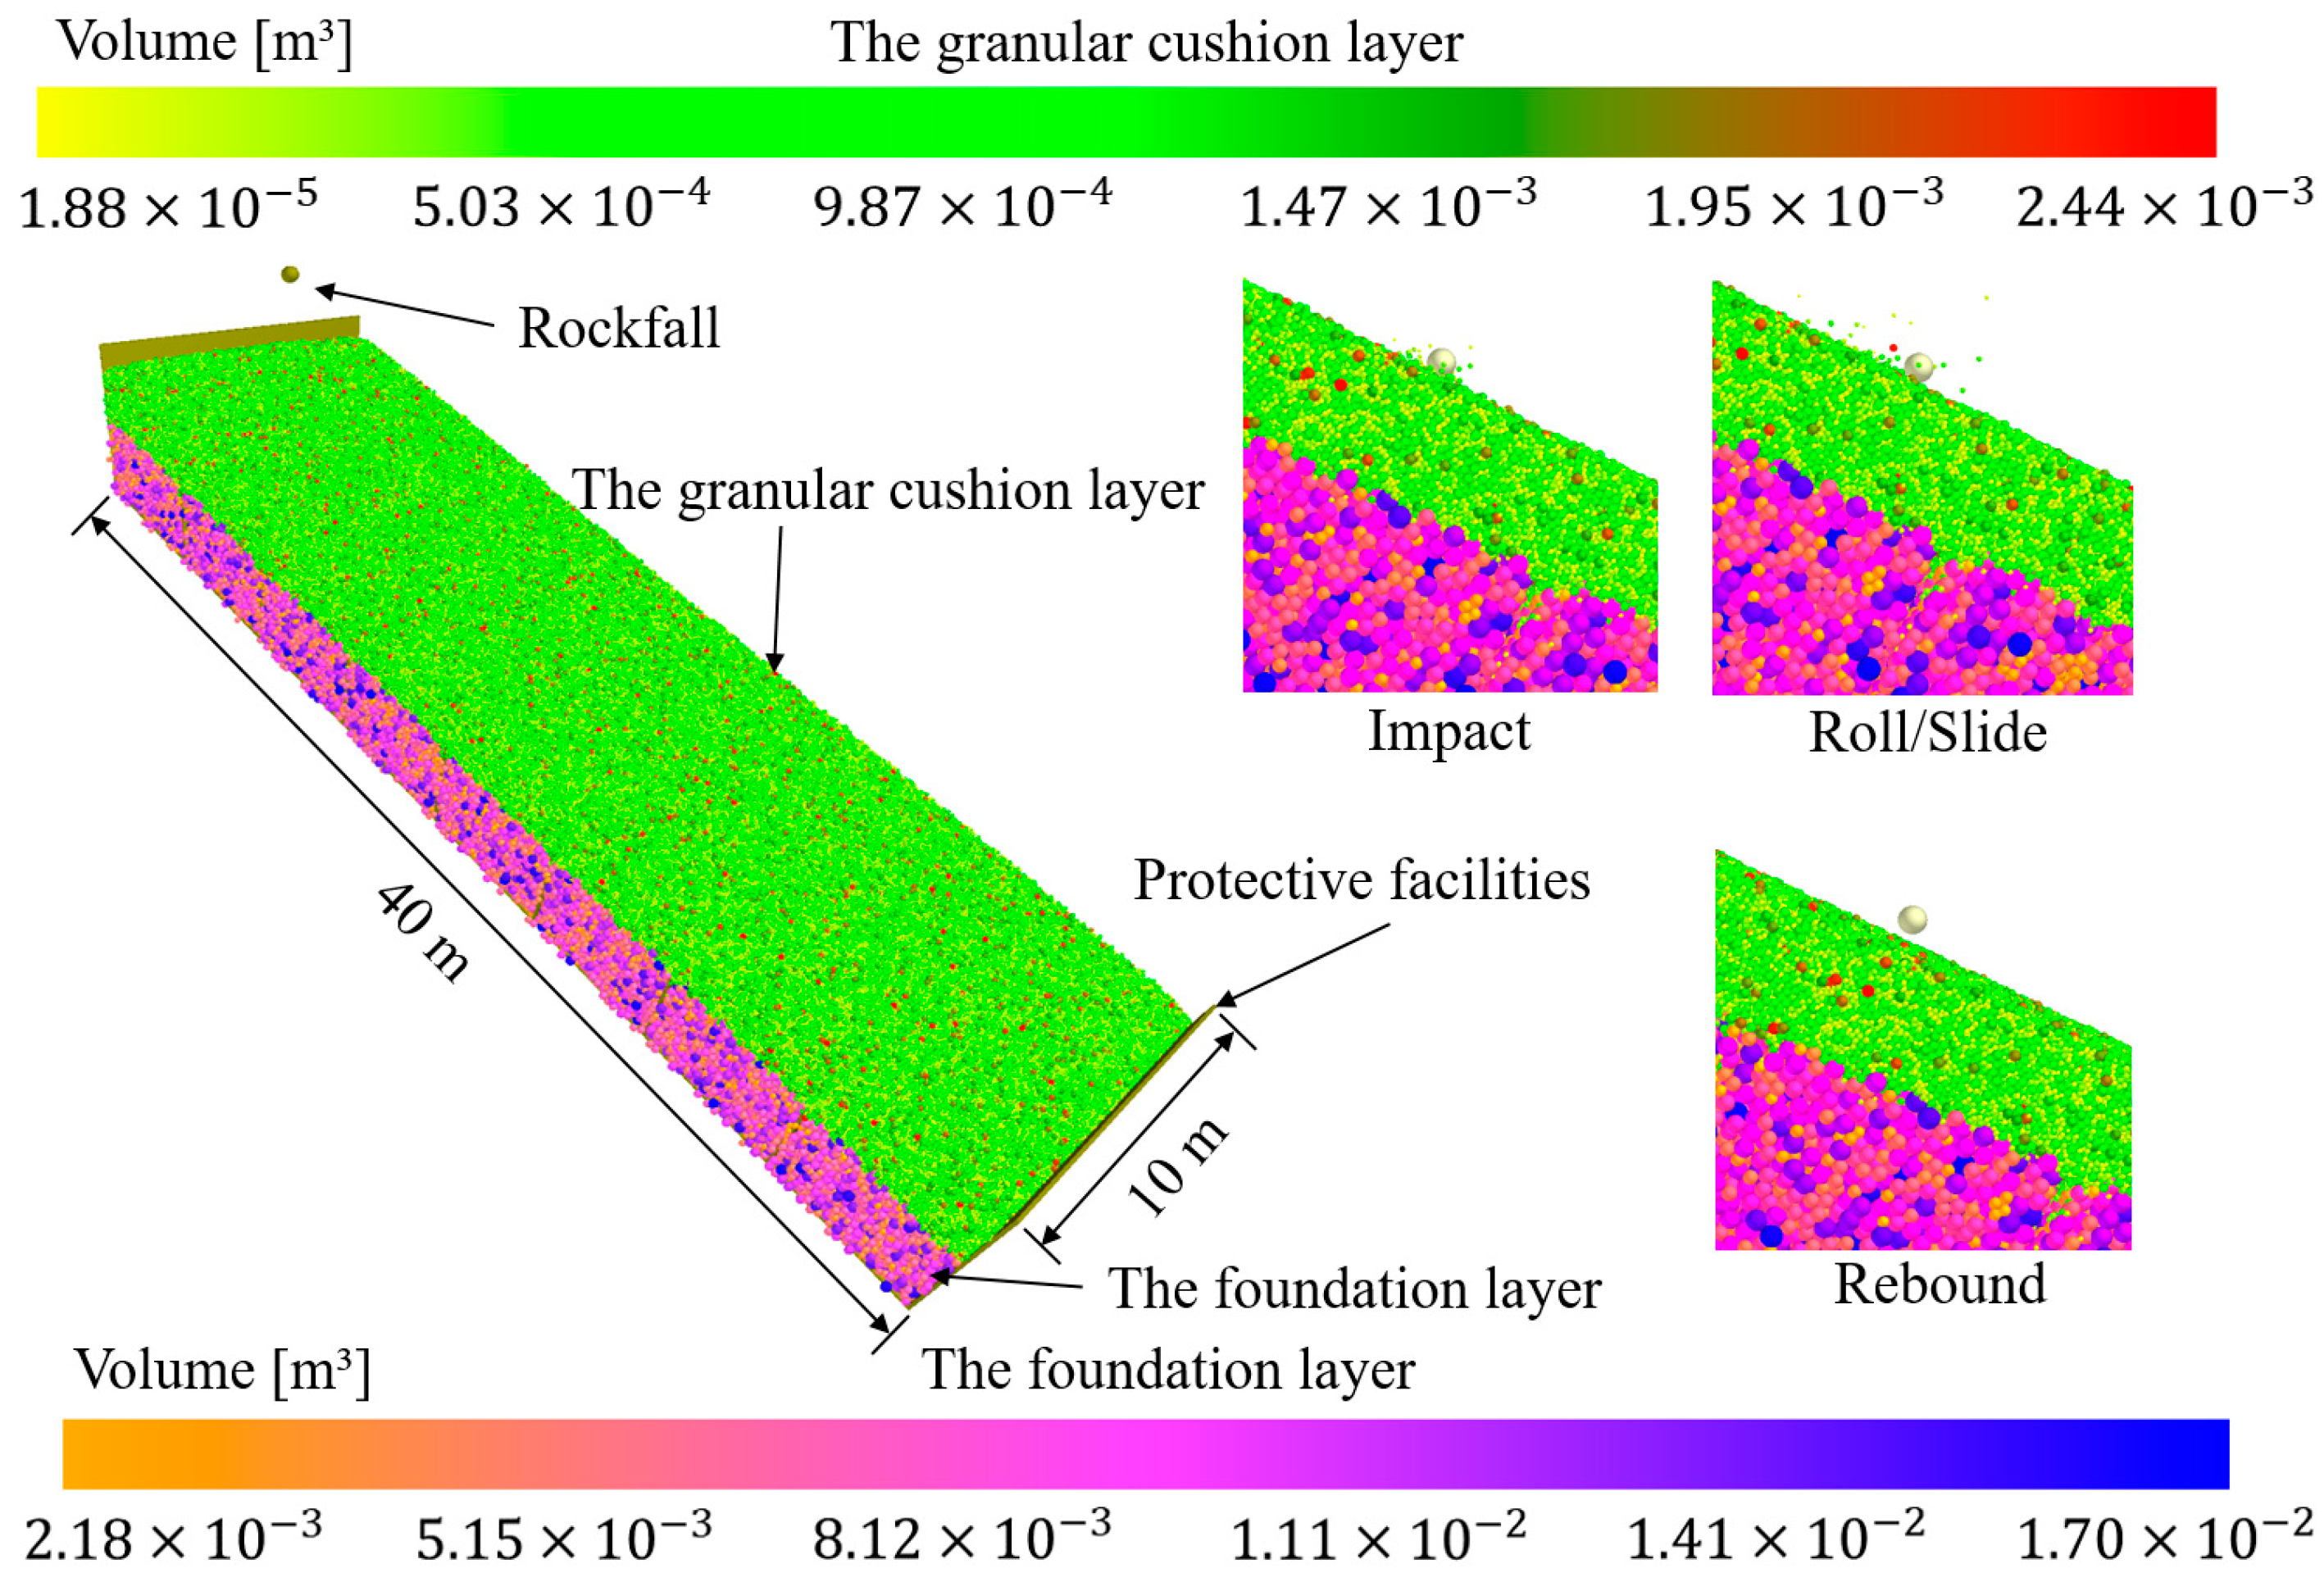
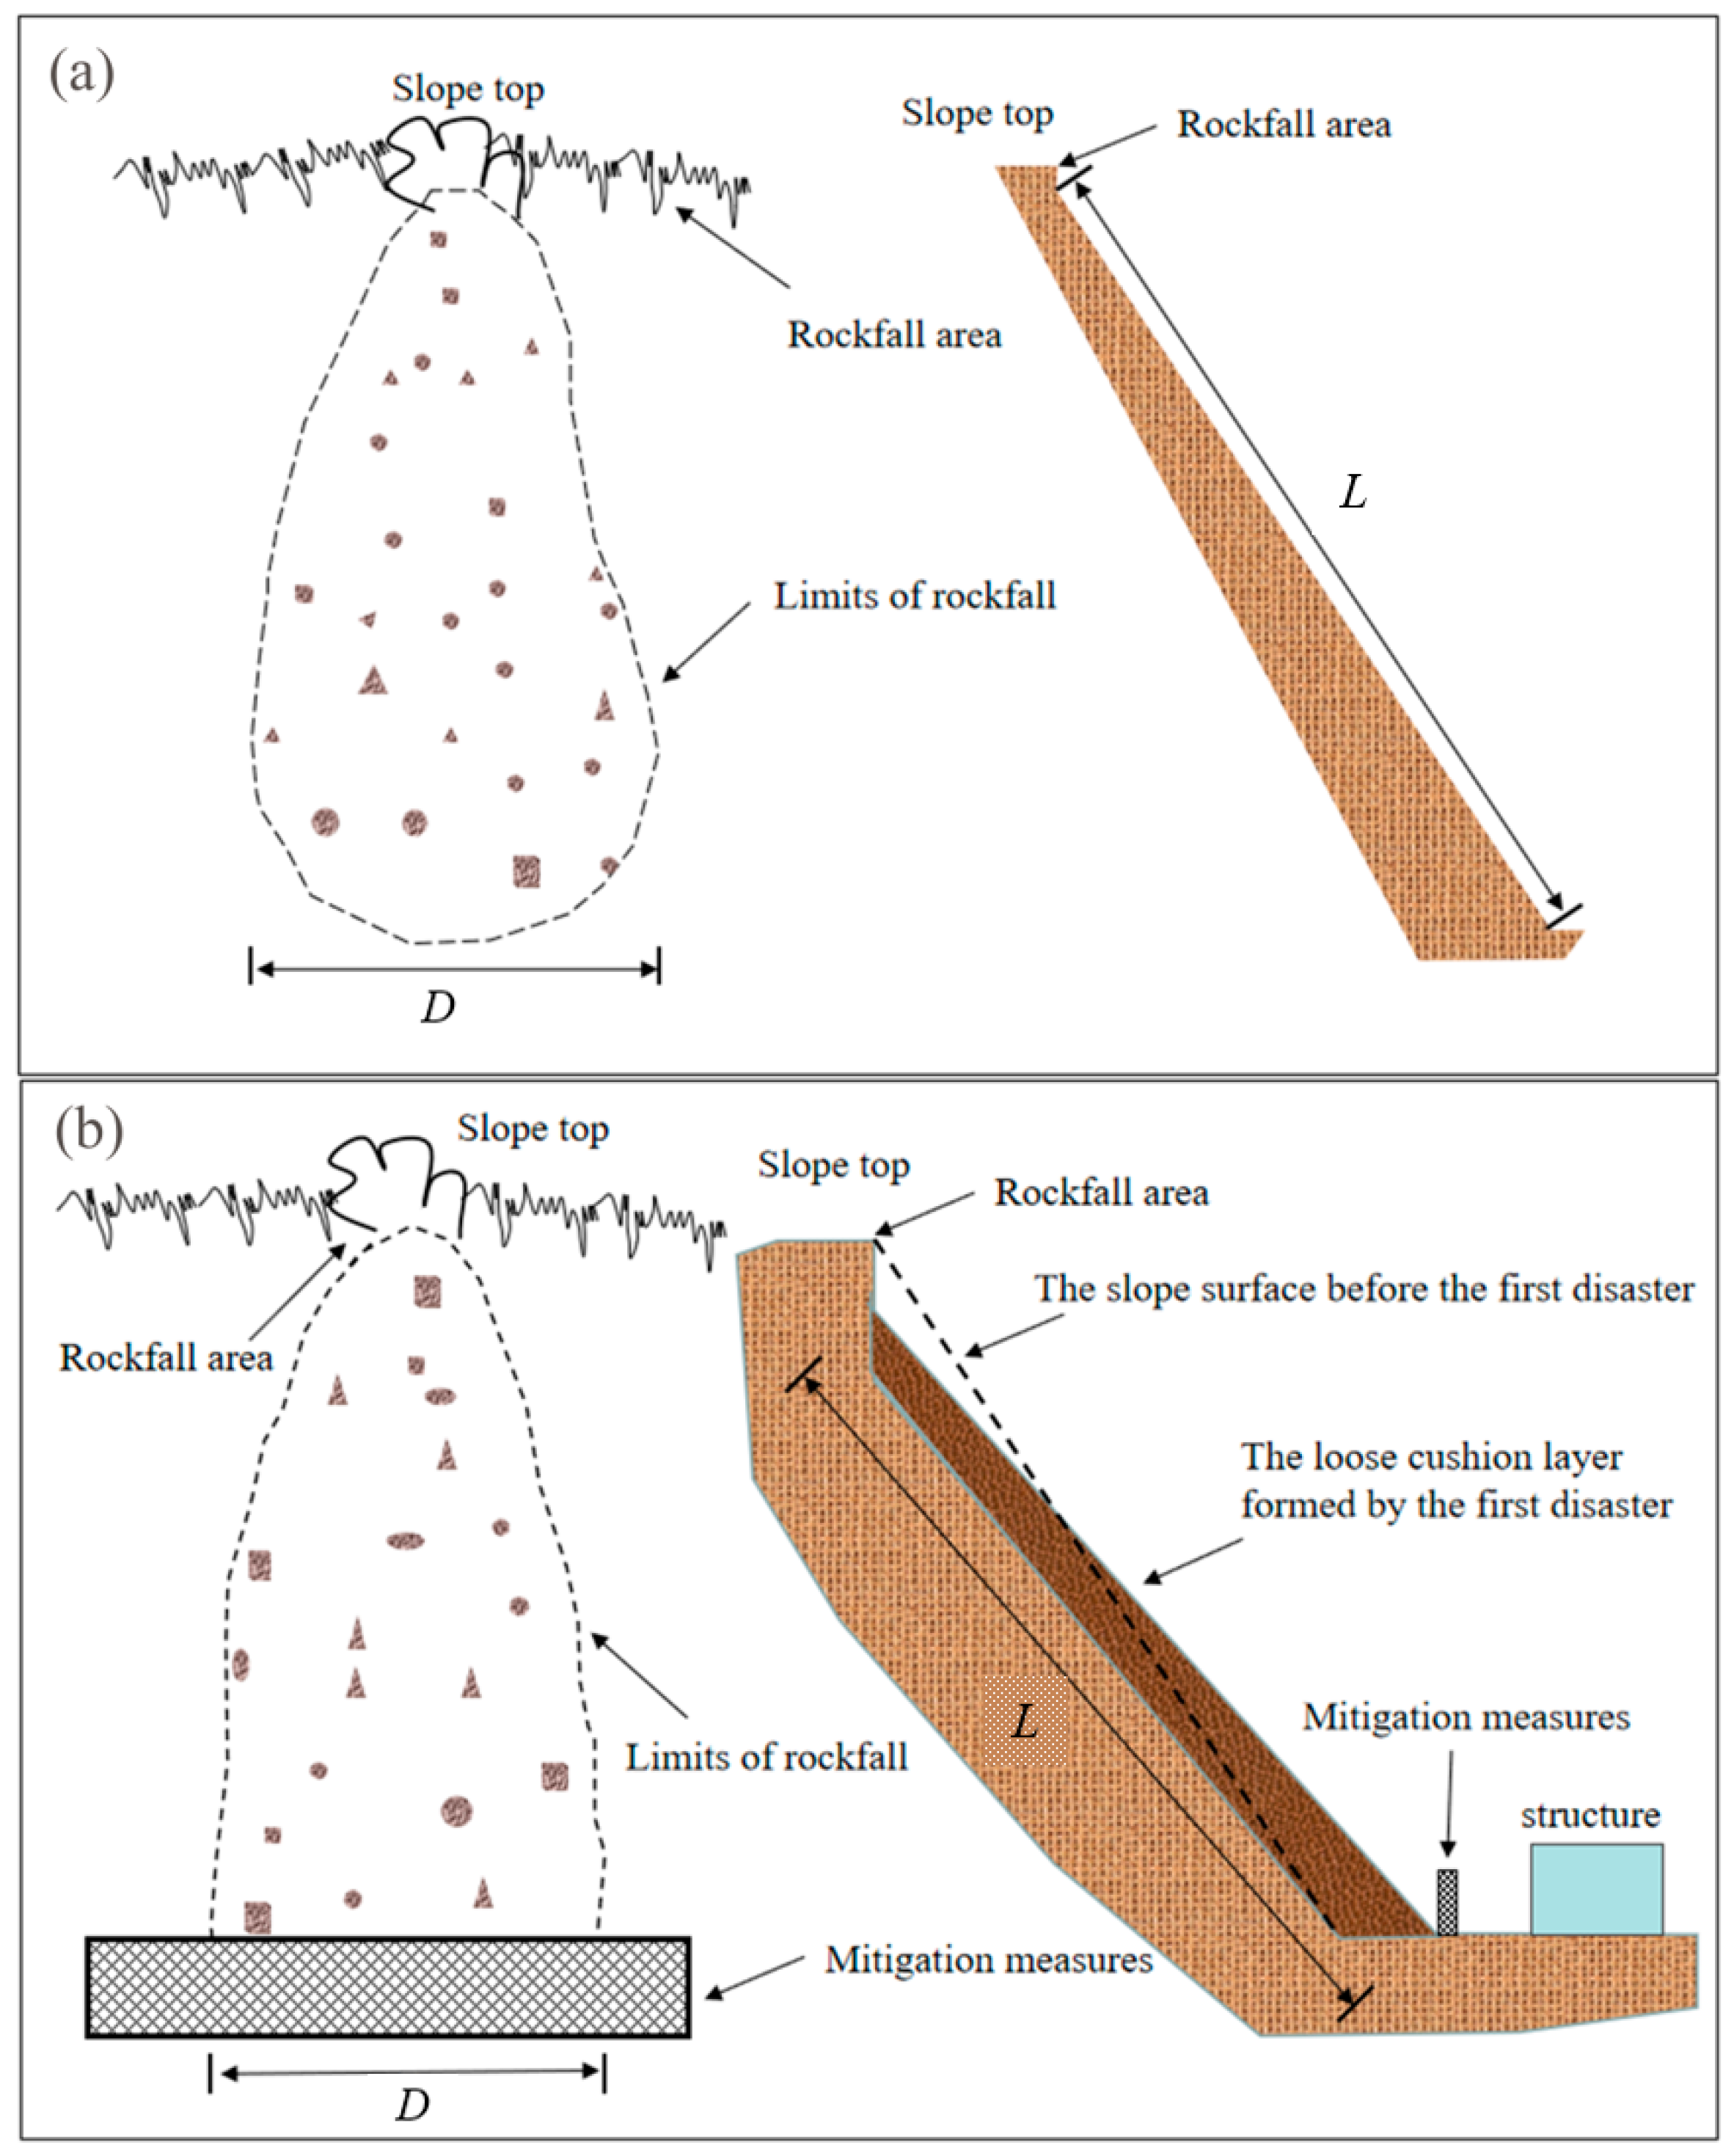
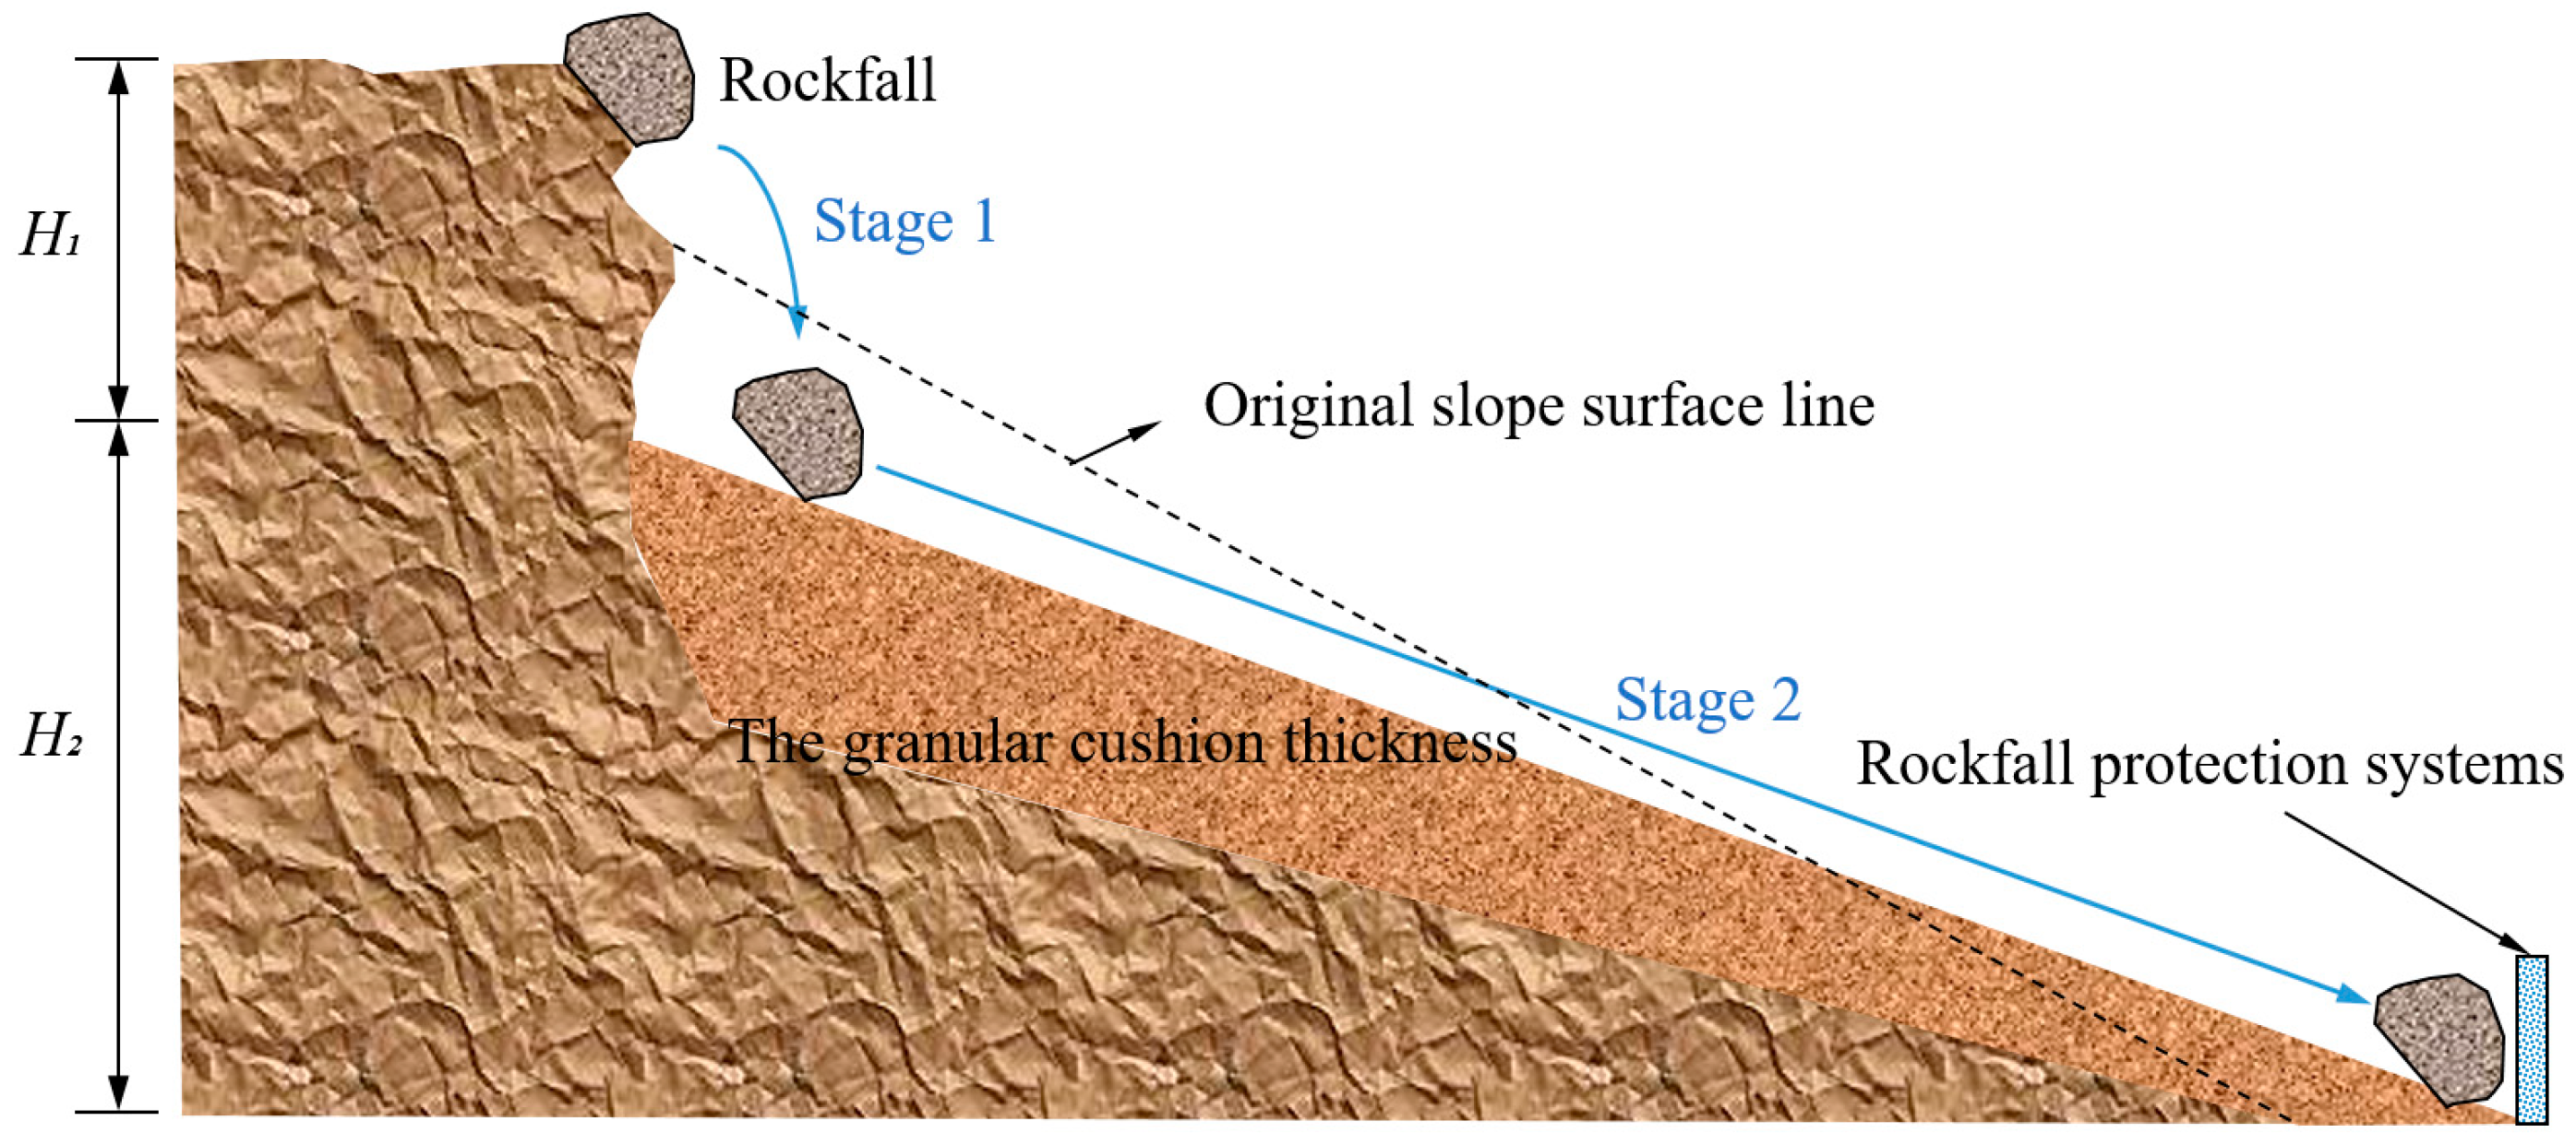
2.1. Construction of Discrete Element Model
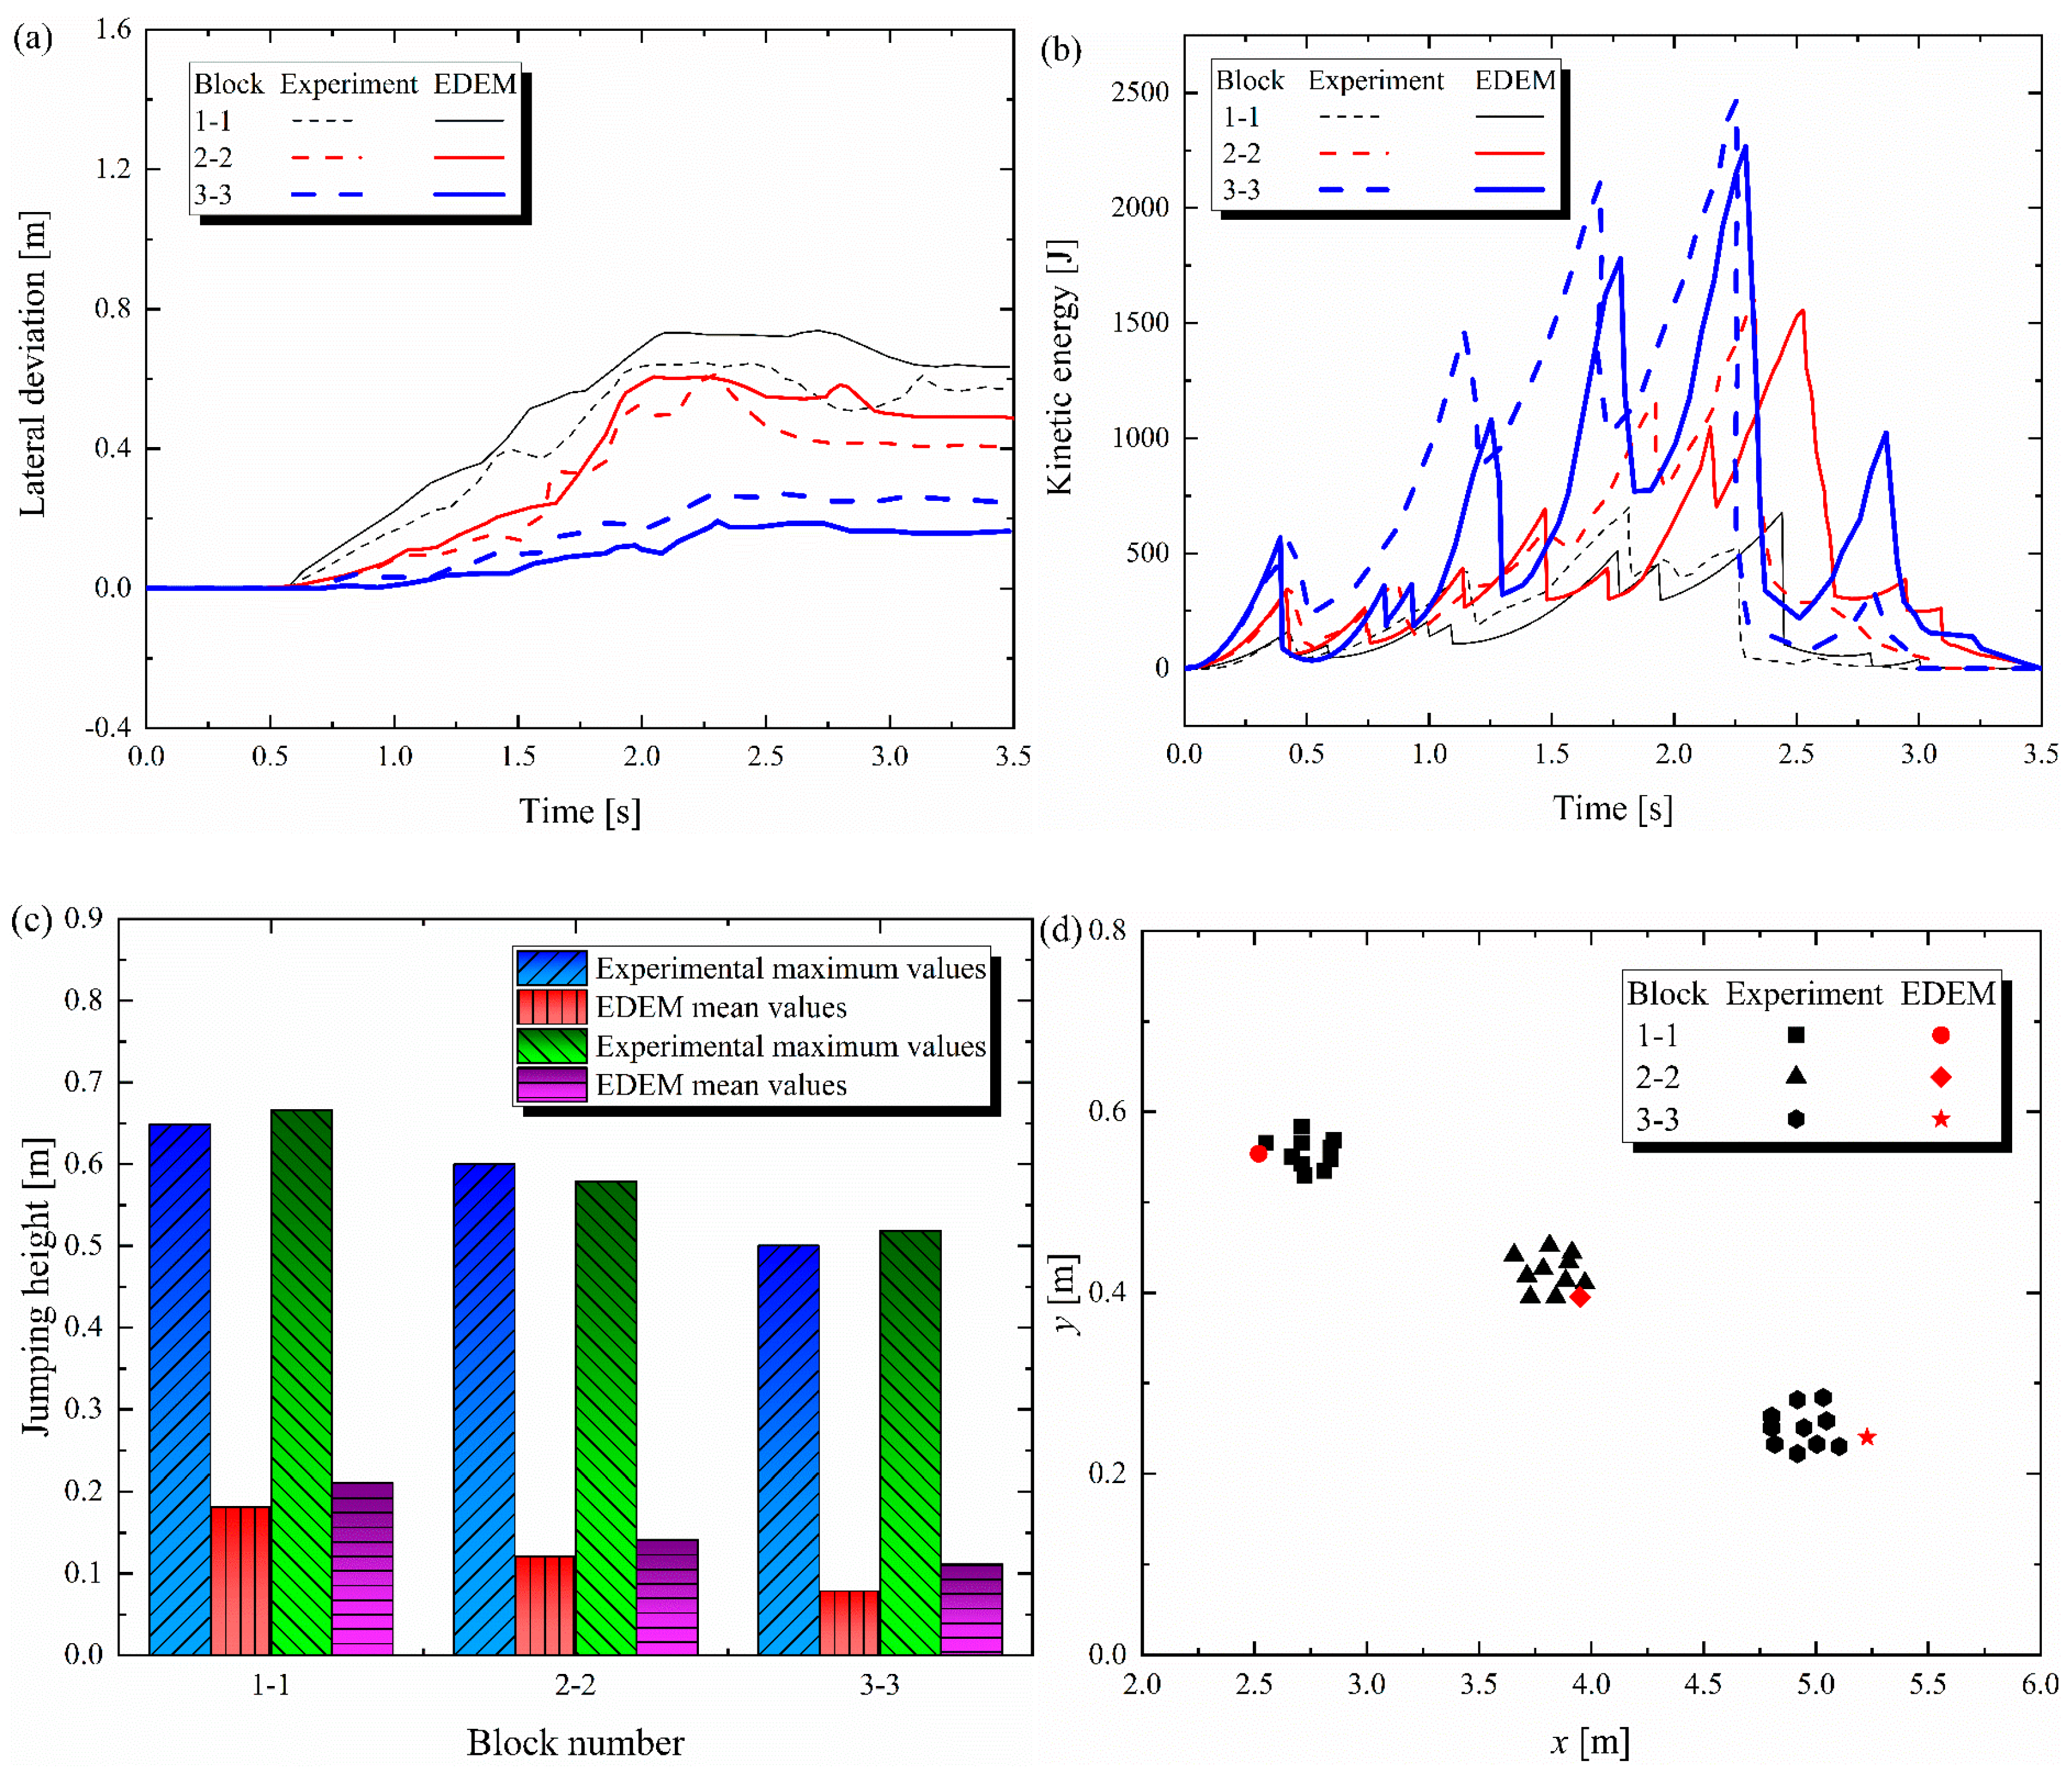
2.2. Feasibility Verification
3. Analysis of Numerical Simulation Results
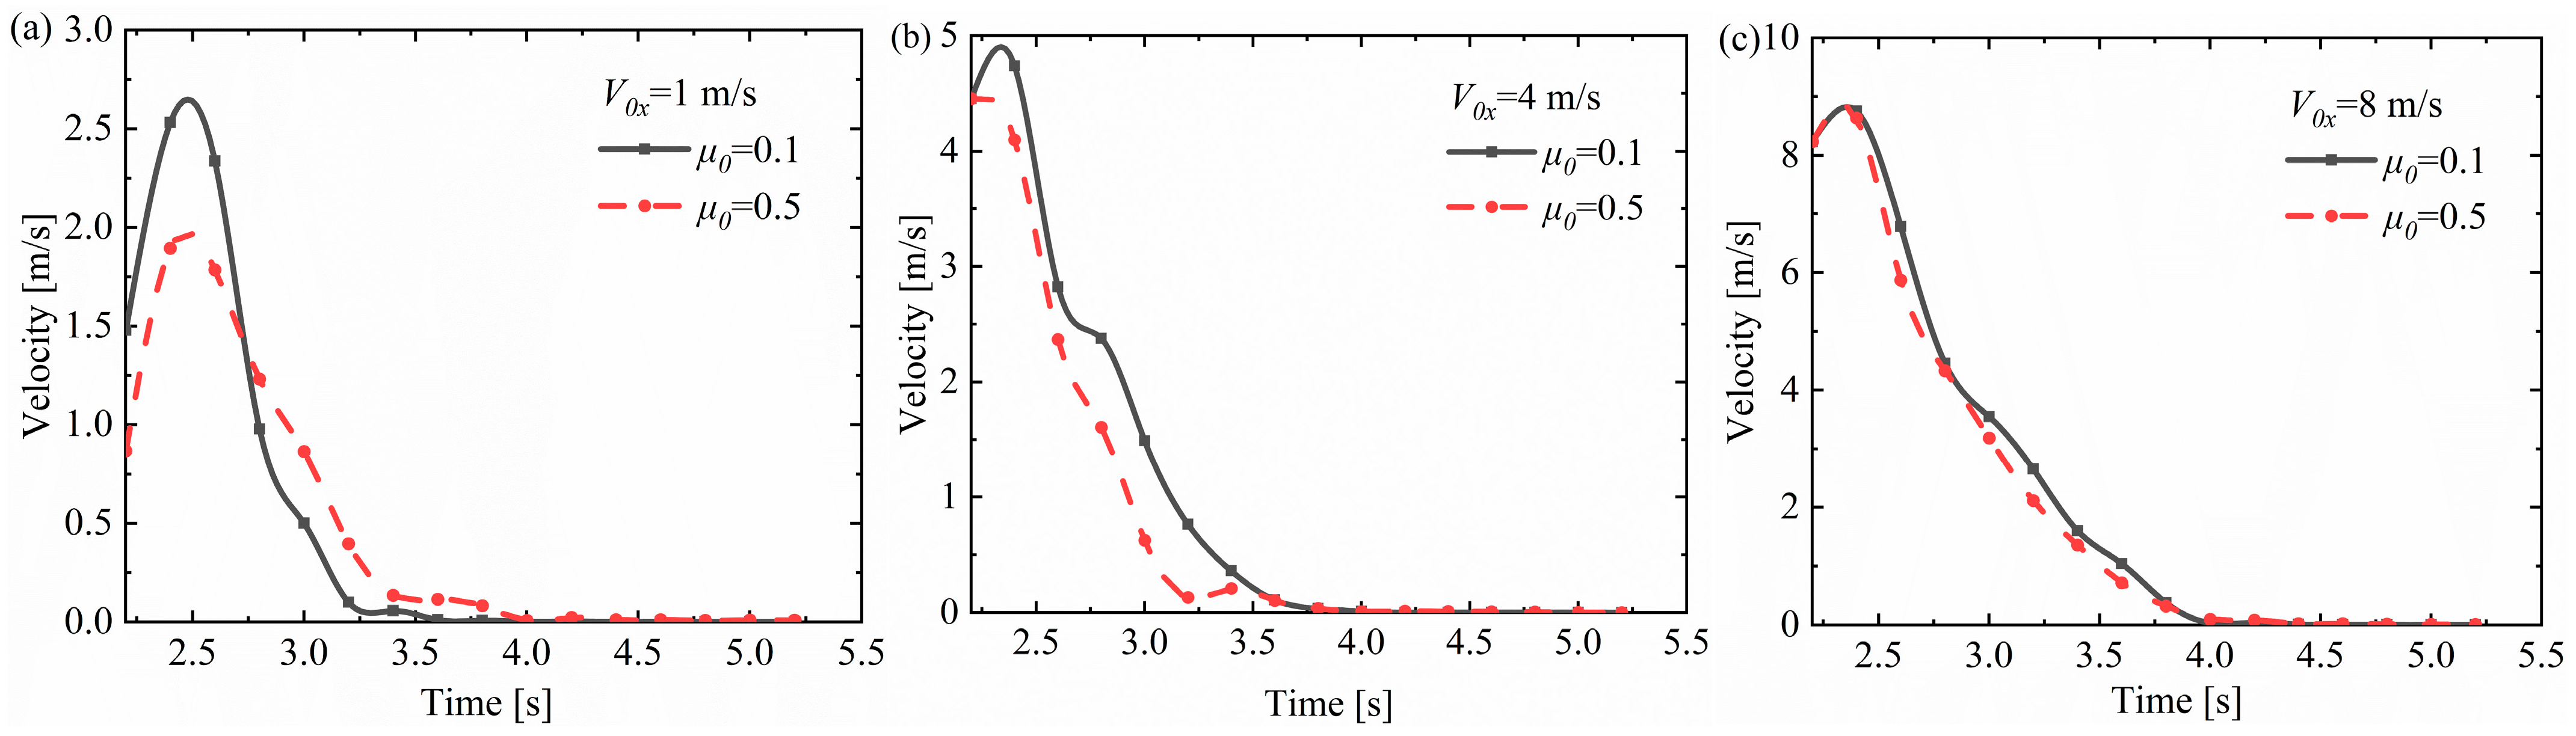
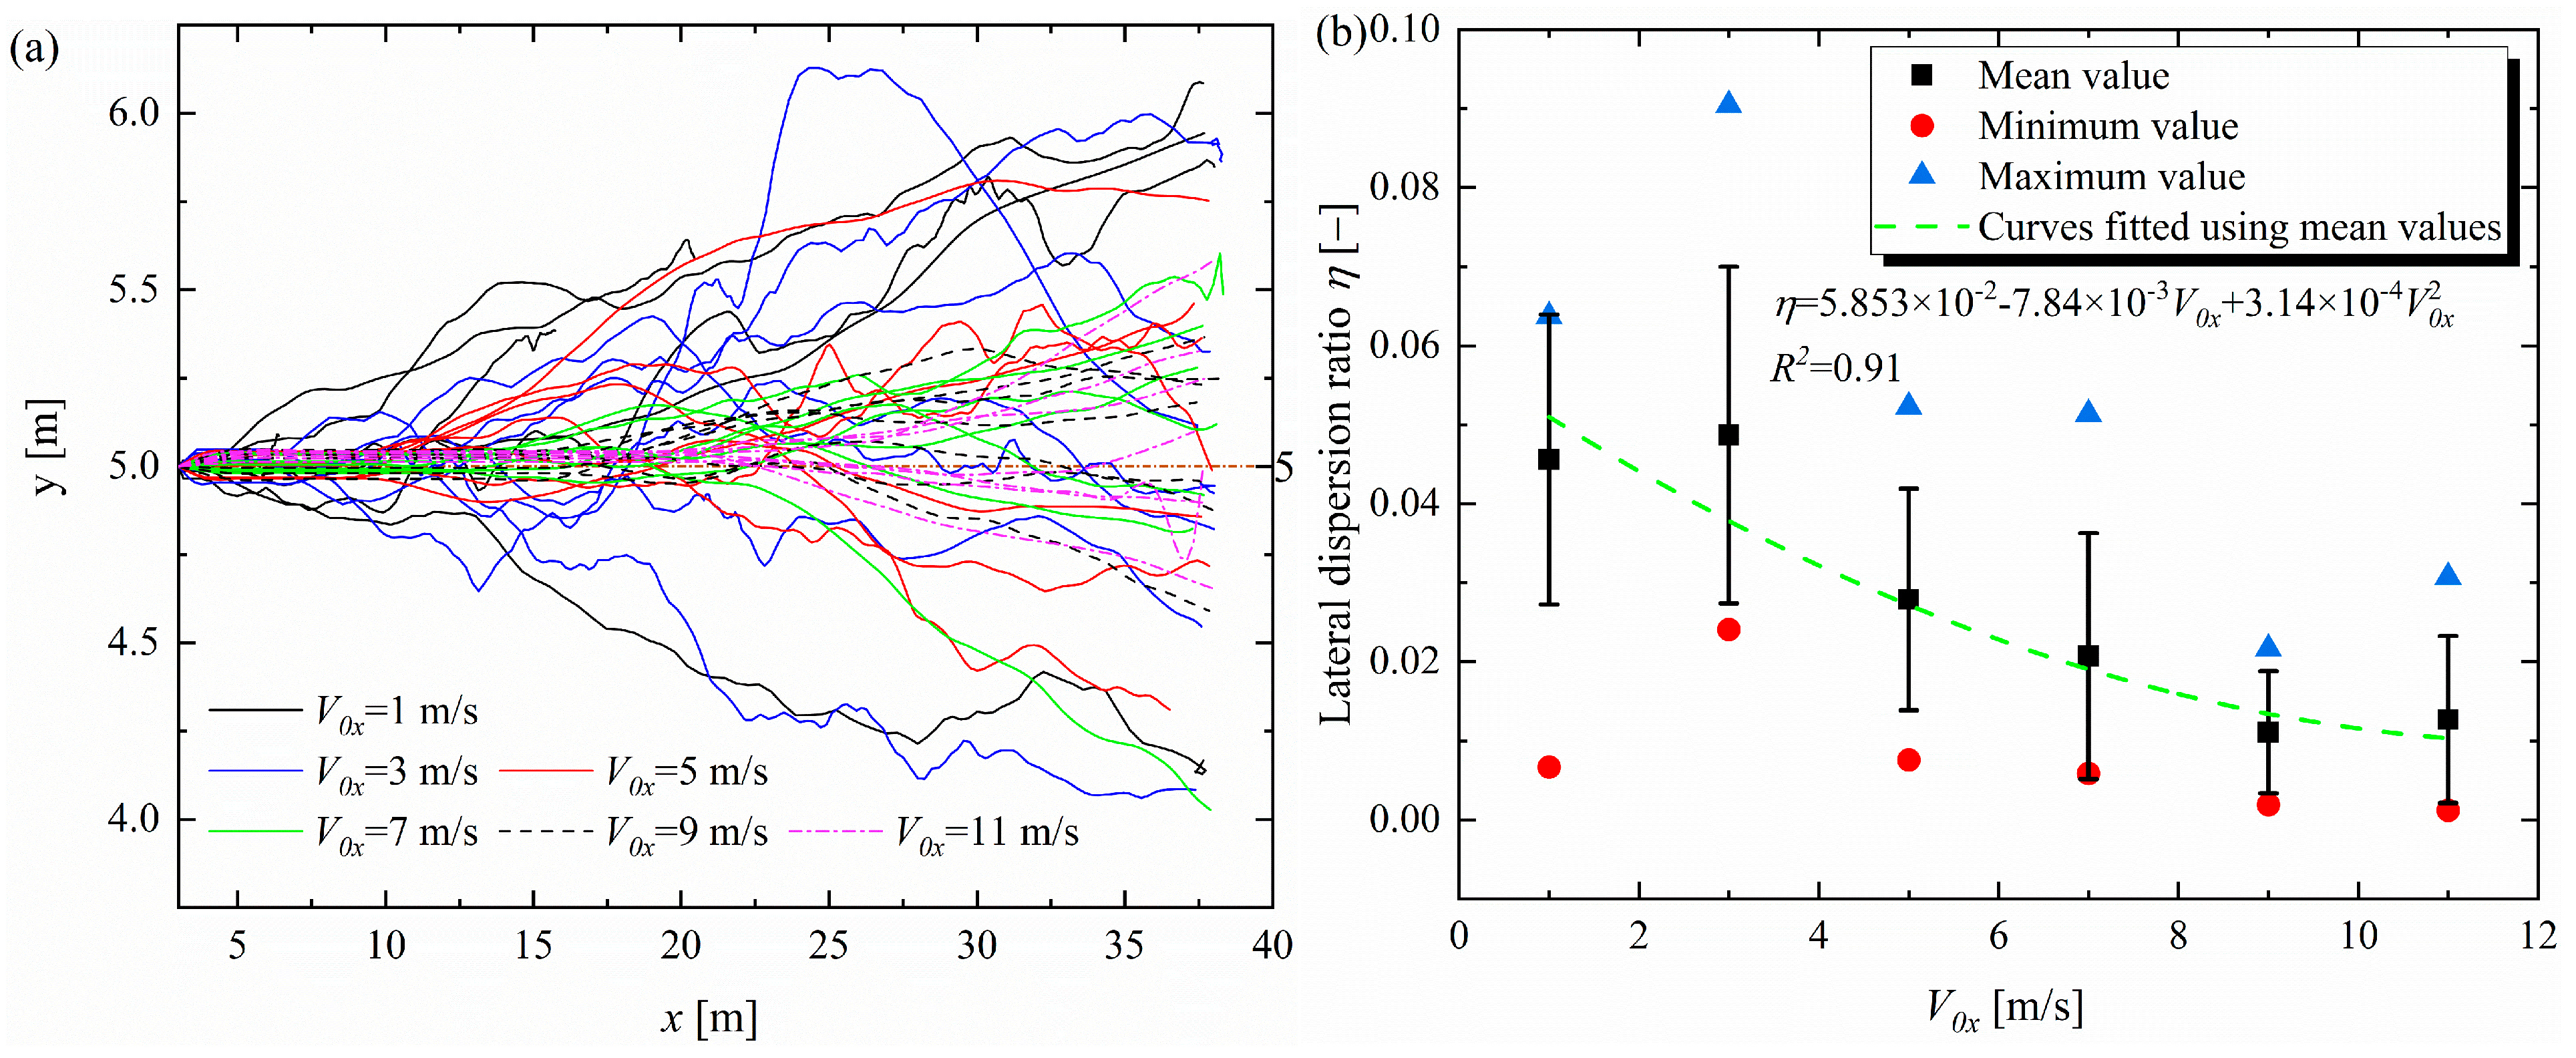
3.1. Effect of Horizontal Velocity
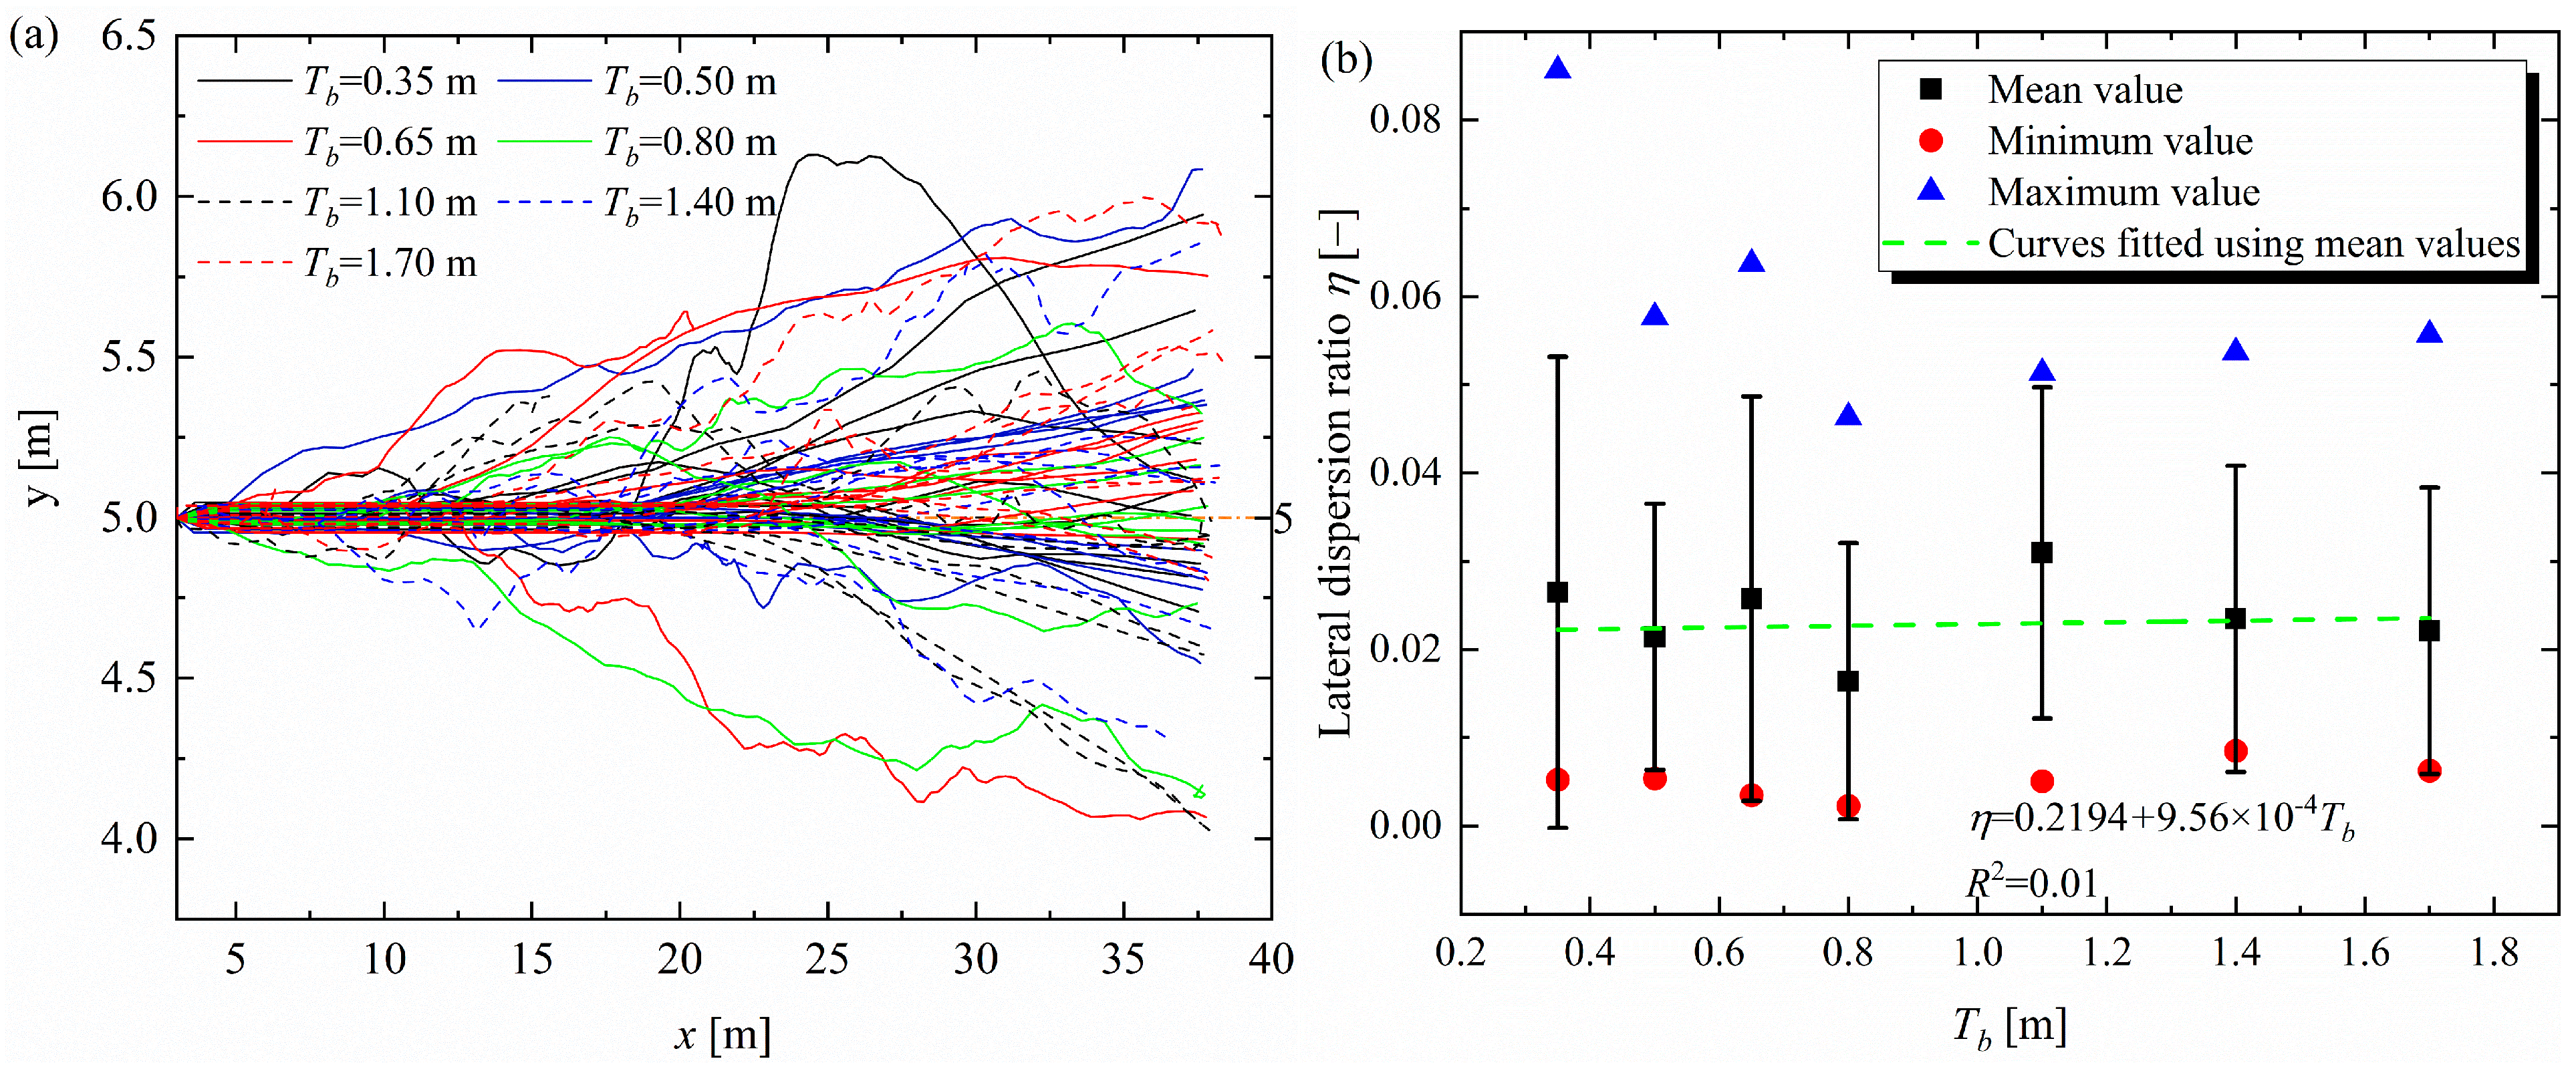
3.2. Effect of the Thickness of the Granular Cushion Layer
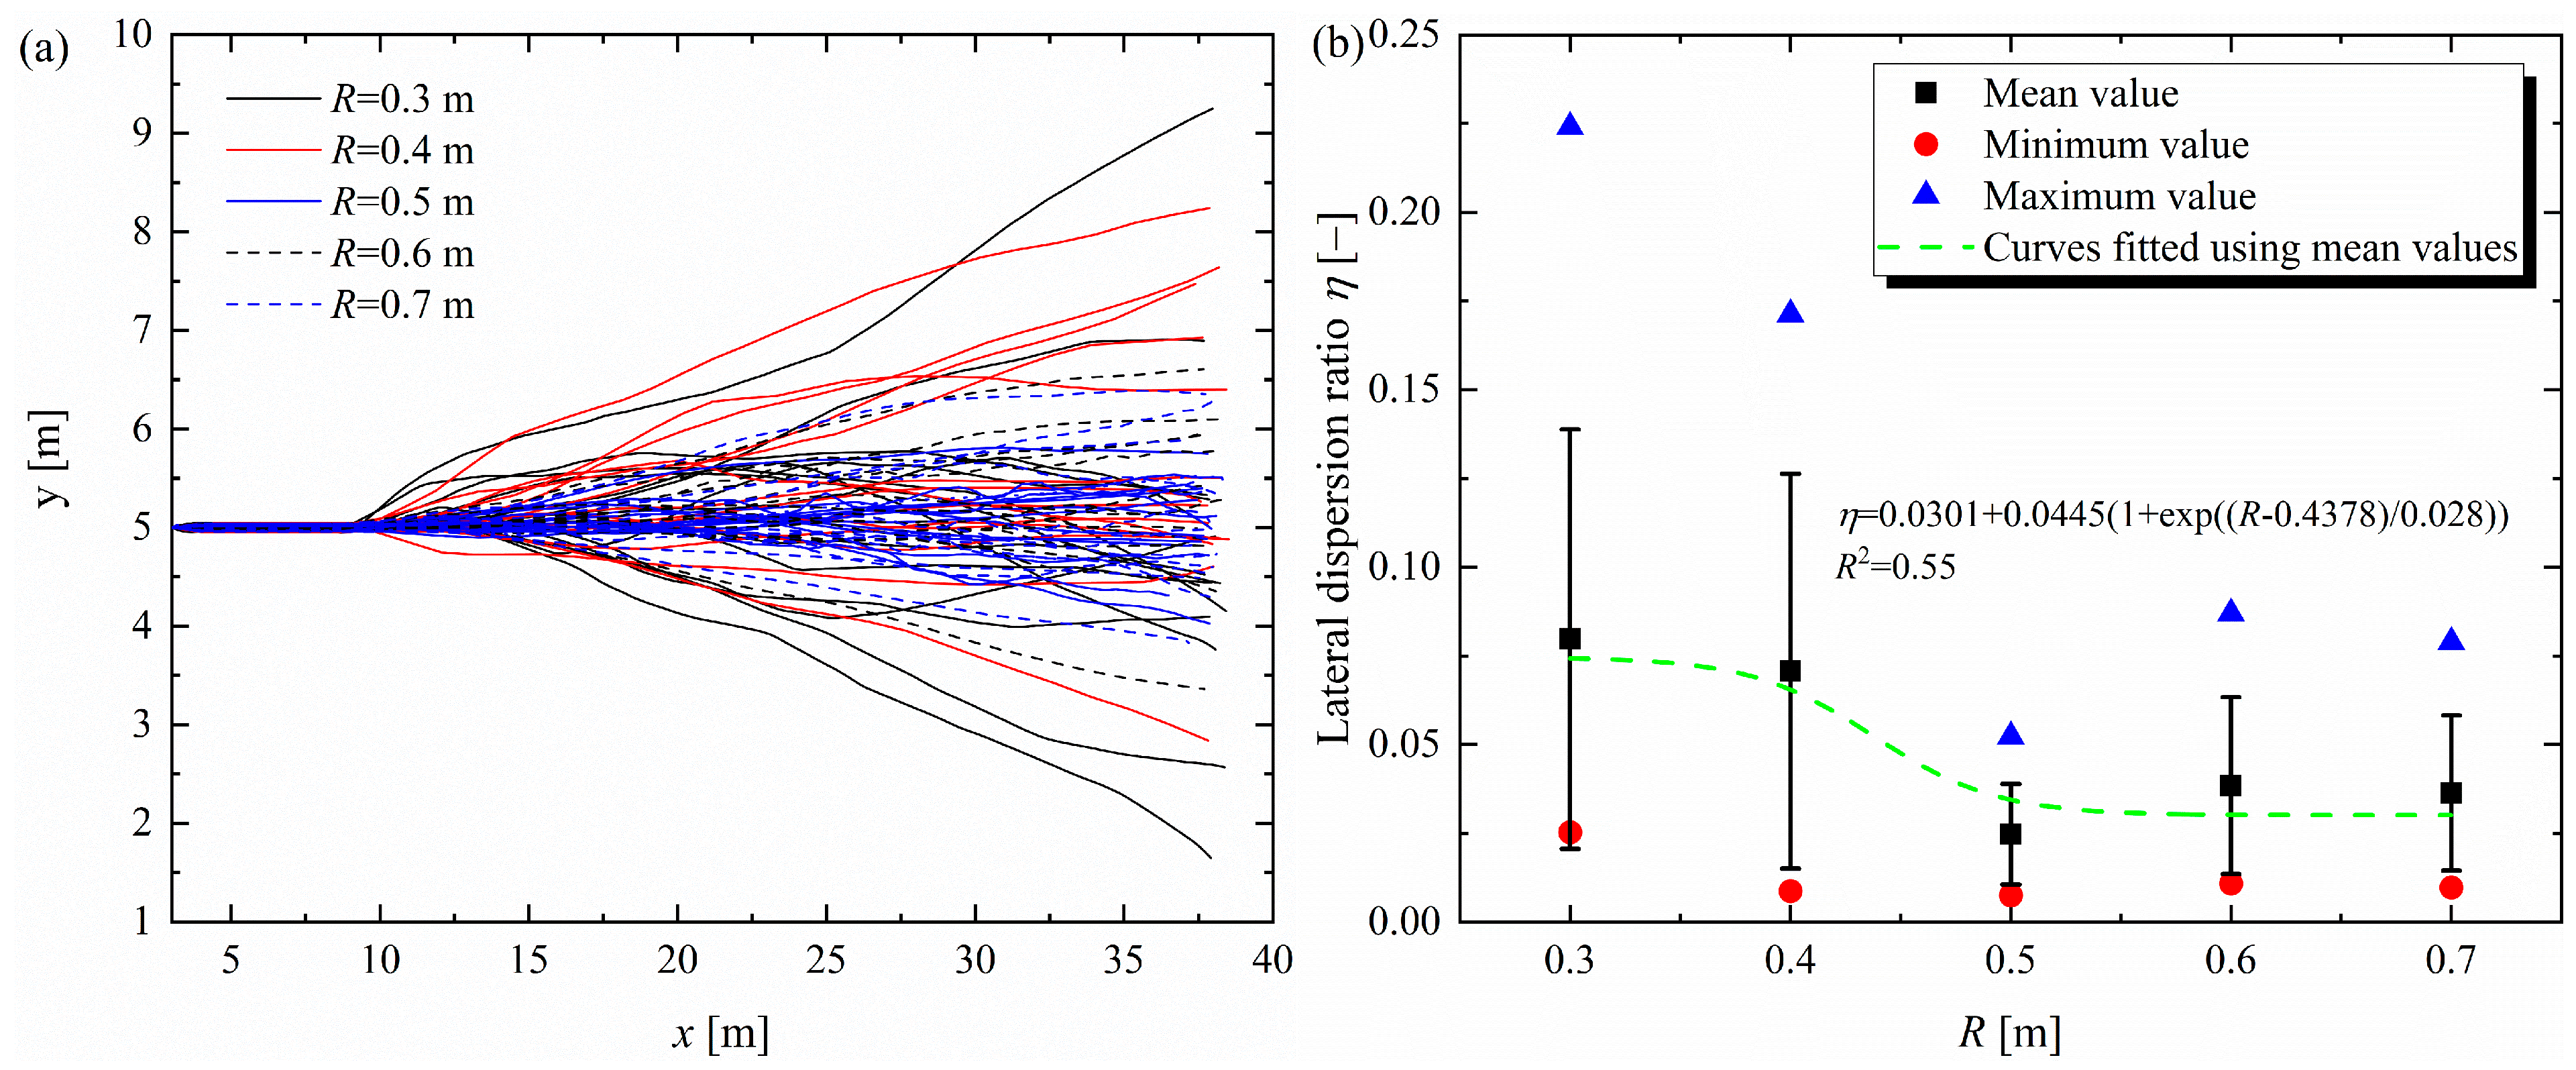
3.3. Effect of Rockfall Radius
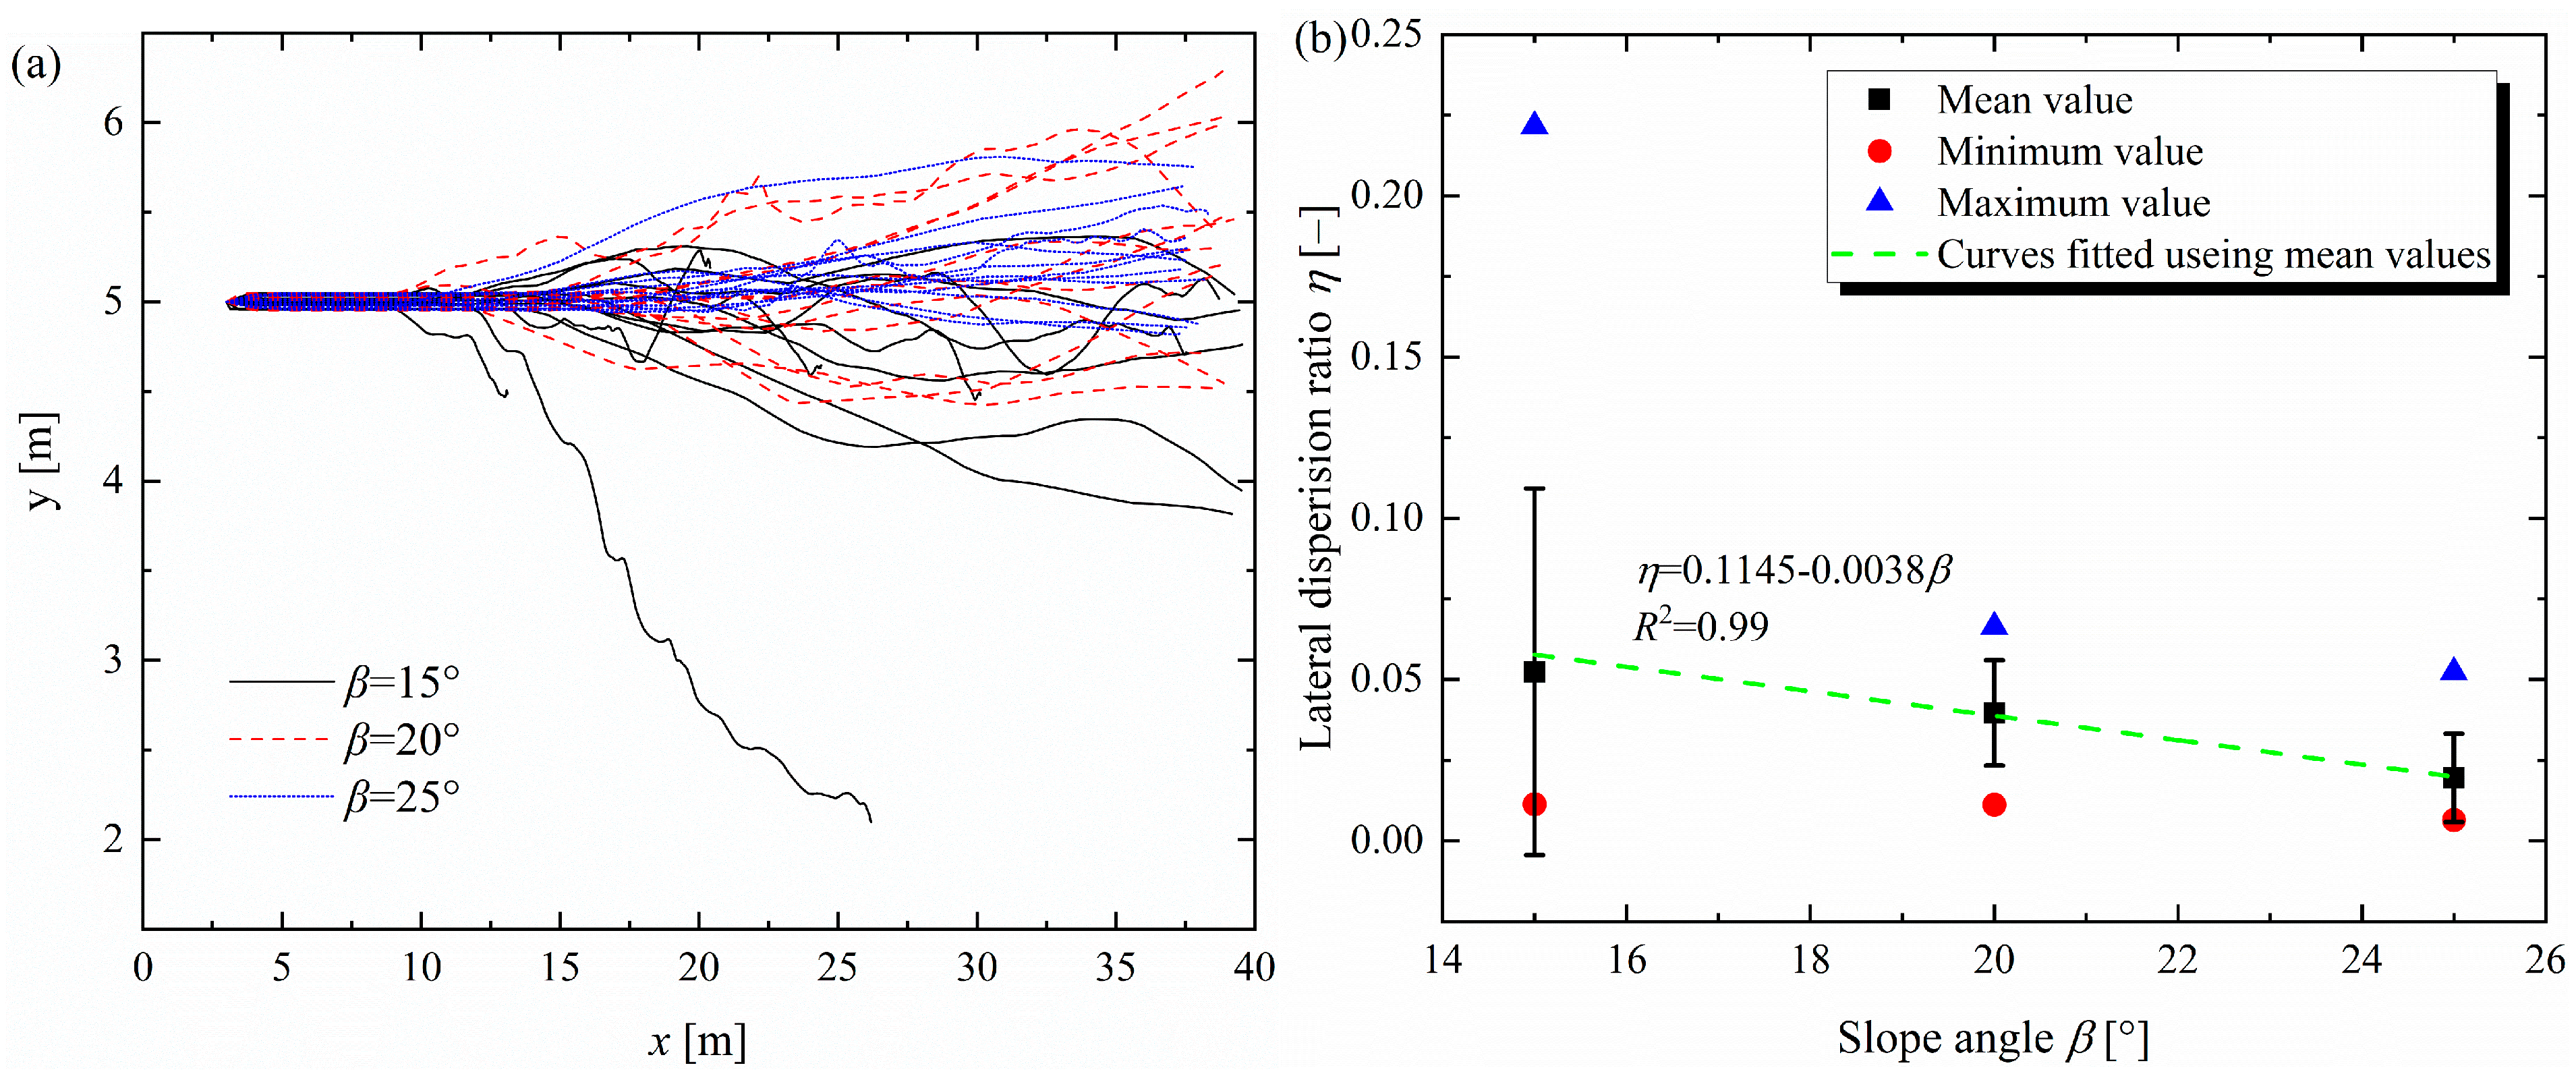
3.4. Effect of Slope Inclination
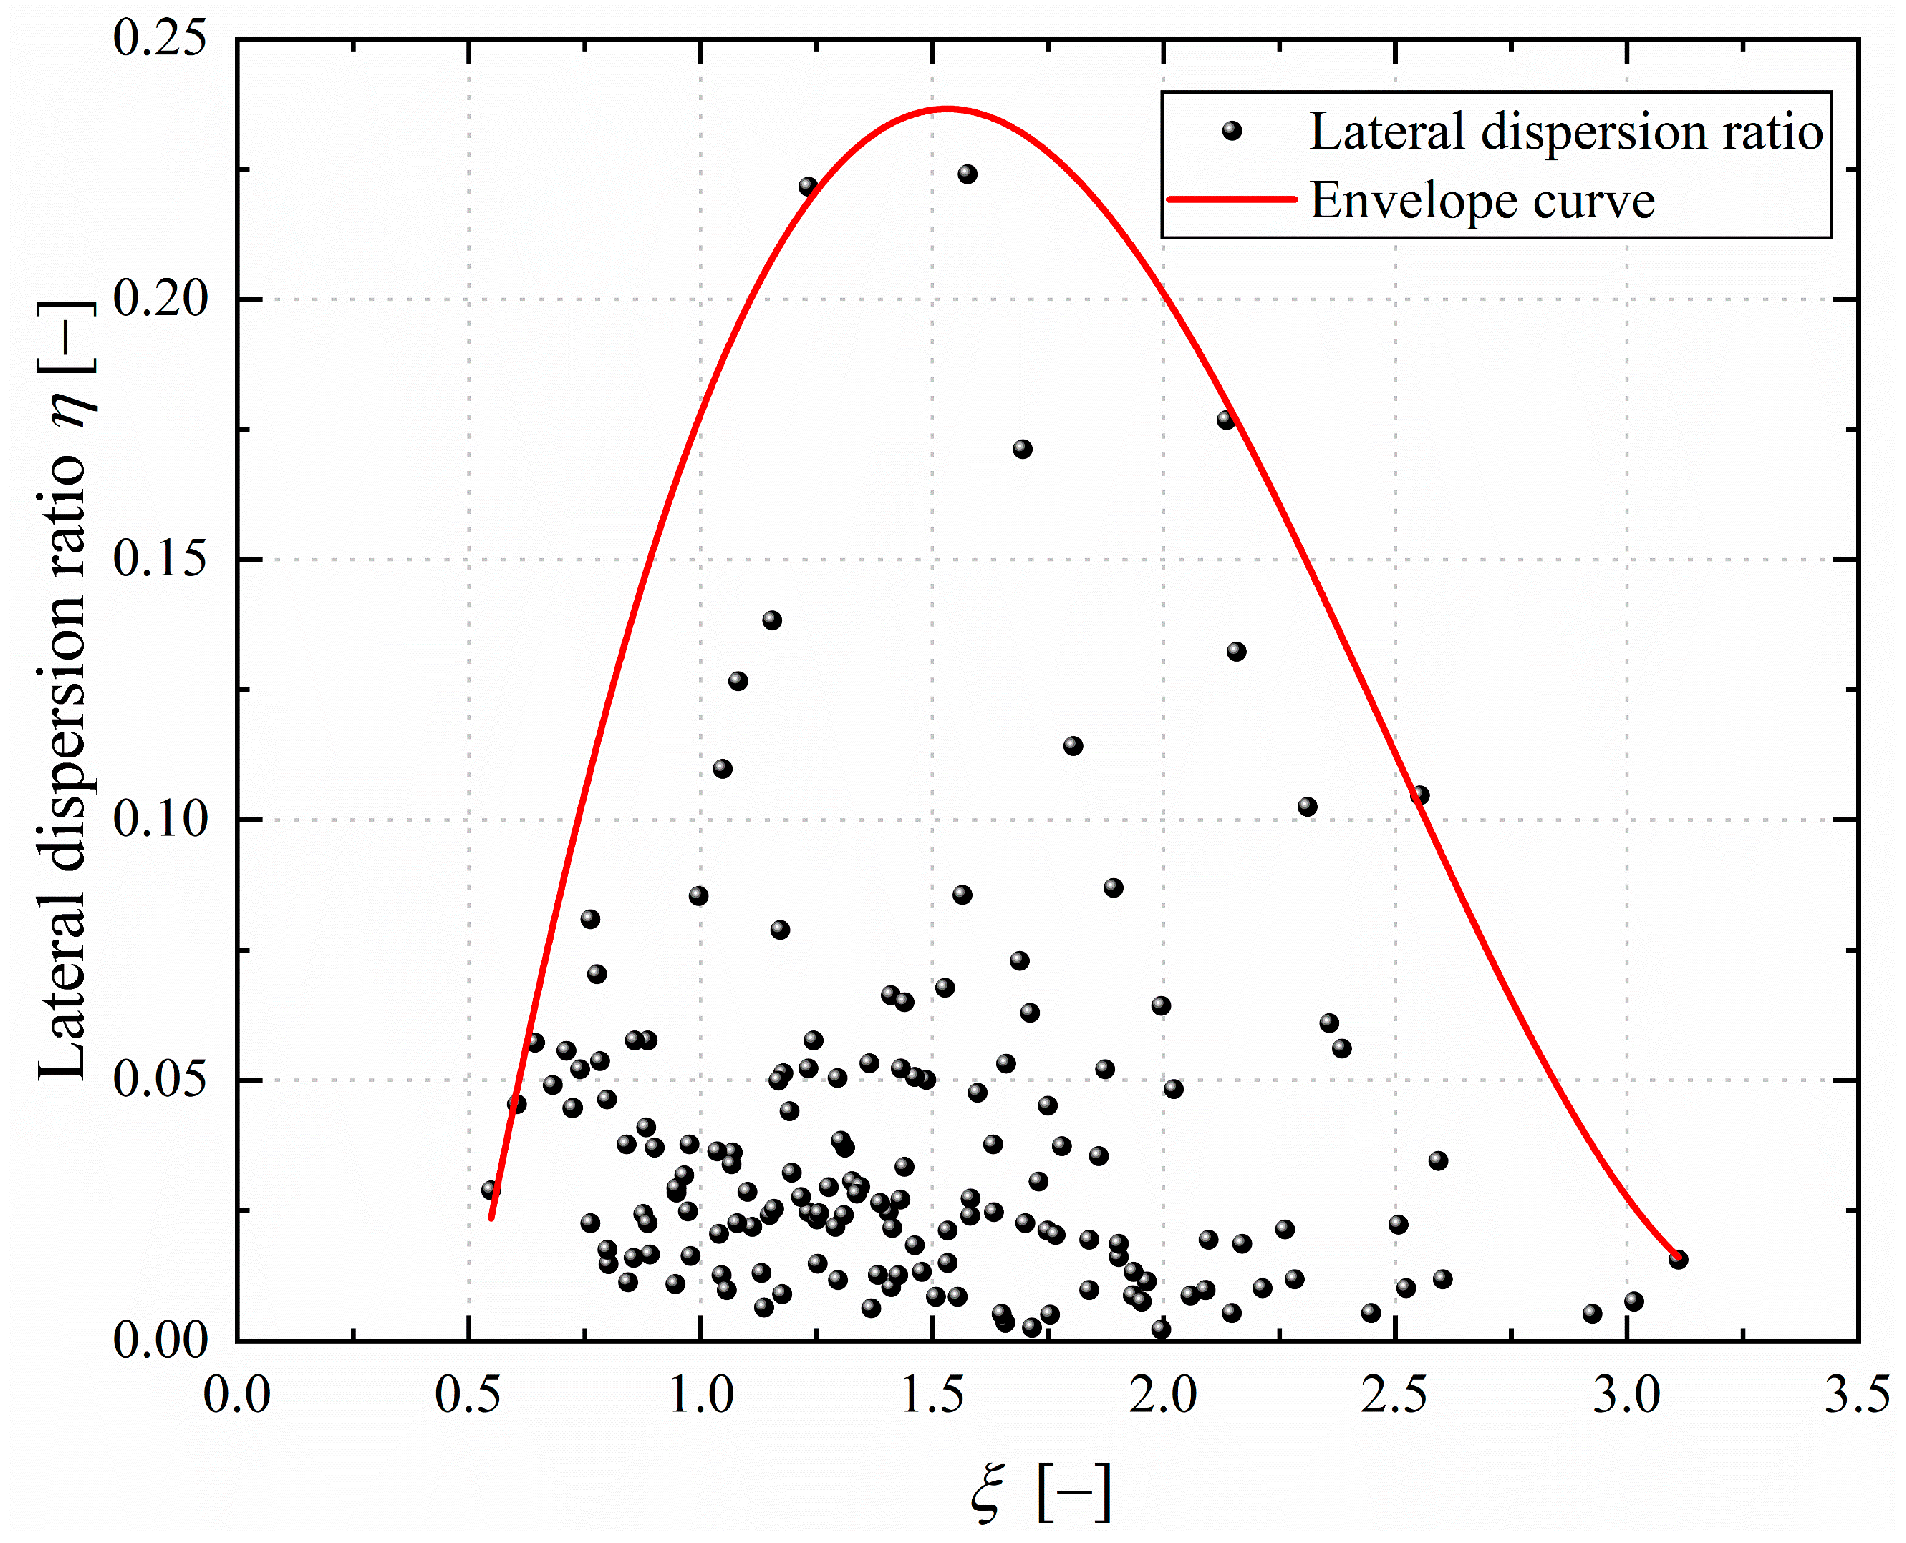
4. Rapid Estimation Model of the Lateral Dispersion Ratio of Rockfall
5. Conclusions
- (1)
- In order to construct the prediction model, the lateral dispersion ratio of rockfall trajectories under a variety of conditions is calculated based on the numerical simulation results. Furthermore, the variation rule of the lateral dispersion ratio of rockfall trajectories under the influence of a single factor is analyzed. We fit the curve equation and addressed the fact that the trajectory lateral dispersion ratio of rockfall varies with the influence factor.
- (2)
- Considering the influence of characteristics of each factor of change on the lateral dispersion ratio and the rationality of the formula dimension, a nondimensional parameter can be identified, and the envelope equation of the rockfall lateral dispersion ratio can be determined. It is only necessary to know limited parameters: the radius of the rockfall, the elevation difference between the source area of the rockfall and the cushion layer, the slope inclination, and the thickness of the particle cushion layer, which are easy to obtain so that the maximum of the rockfall dispersion ratio can be quickly estimated under the specified conditions. This prediction model can help the relevant engineering design and construction personnel to quickly determine the rockfall lateral dispersion ratio according to the specific situation, which is convenient for reasonably designing and planning rockfall protection measures.
- (3)
- The rockfall lateral dispersion model constructed in this paper is applied to the rapid placement of protection measures after a disaster at a site, so the parameters selected are obtained as quickly as possible. And because the number of particles in the model can reach up to 1,020,000, which leads to huge calculations, the shape of the rolling stone is simplified to a spherical shape. In future work, the current discrete element model can be improved to consider the influence of the shape of the rolling stone without increasing the amount of computation.
Author Contributions
Funding
Data Availability Statement
Conflicts of Interest
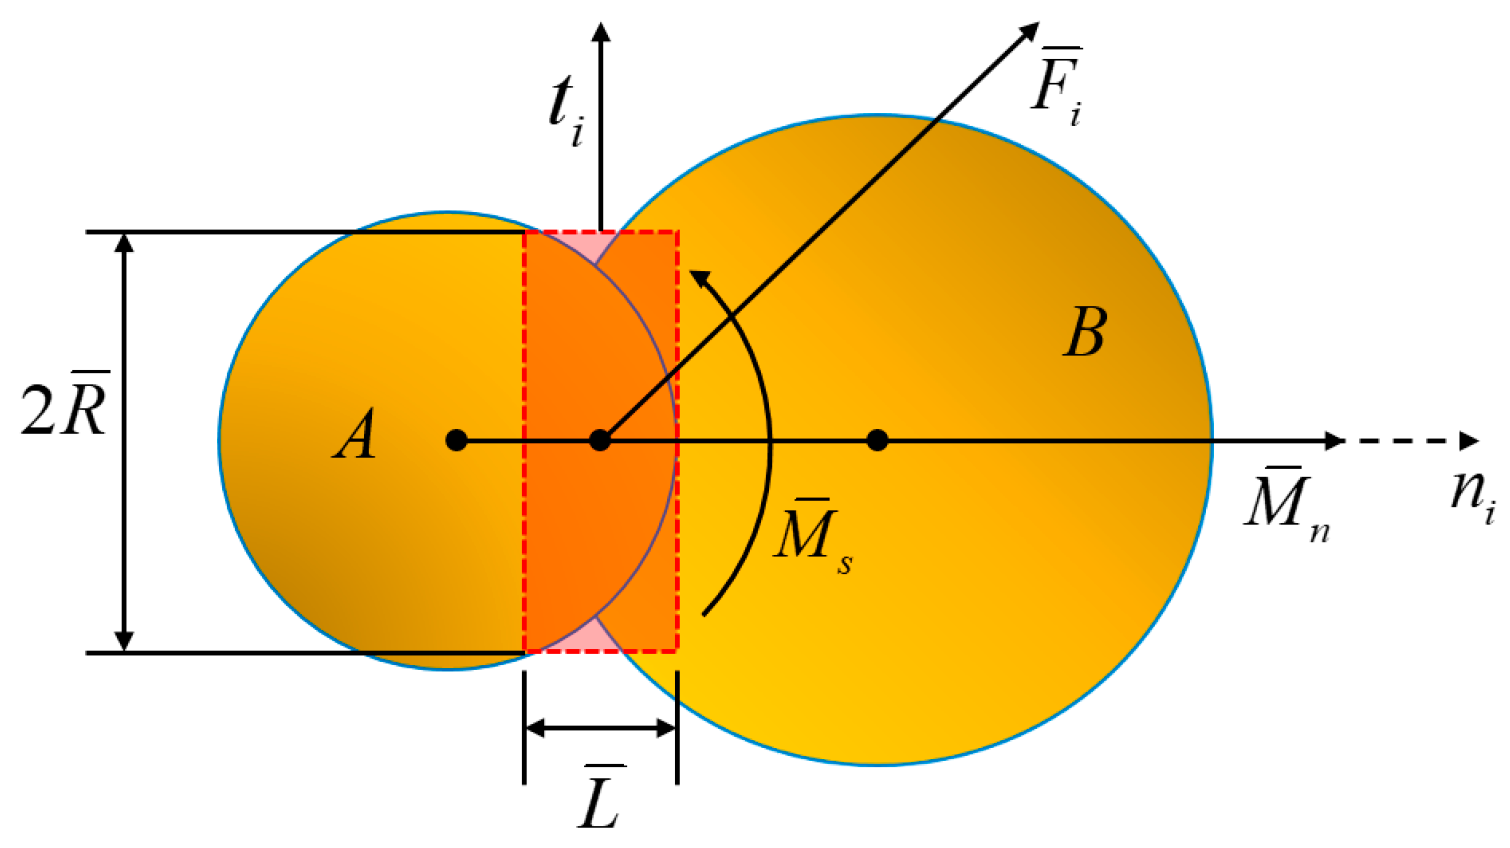
List of Symbols and Abbreviations
| Total force [N] | Tangential velocities of the particles [m/s] | ||
| Normal spring stiffness [N/m] | Normal angular velocities [rad/s] | ||
| Normal damping coefficient [Ns/m] | Tangential angular velocities [rad/s] | ||
| Normal overlap [m] | Cross-section of the parallel bonding bond [m2] | ||
| Normal component of the relative velocity [m/s] | Polar moment of inertia [kg·m2] | ||
| Total tangential force [N] | Length of the slope [m] | ||
| Tangential spring stiffness [N/m] | Slope inclination angle [°] | ||
| Tangential damping coefficient [Ns/m] | Width of the slope [m] | ||
| Tangential overlap [m] | Spherical rockfall radius [m] | ||
| Static friction coefficient [-] | Coefficient of restitution [-] | ||
| Tangential component of the relative velocity [m/s] | The granular cushion layer thickness [m] | ||
| Rolling friction coefficient [-] | Initial horizontal velocities [m/s] | ||
| Distance between the center of mass and the contact point [m] | Total thickness of particle layer [m] | ||
| Unit angular velocity vector of the object at the contact point [rad/s] | Distance between the two extreme fall paths of rockfall [m] | ||
| Normal stiffness [N/m] | Rockfall relative radius [m] | ||
| Shear stiffness [N/m] | [-] | ||
| Time step [s] | The mass of the rockfall [kg] | ||
| Normal velocities of the particles [m/s] | The elevation difference between the source area of the rockfall and the double granular layer slope [m] | ||
| DEM | The discrete element method | BPM | The Bonding Particle Model |
References
- Guzzetti, F.; Reichenbach, P.; Ghigi, S. Rockfall hazard and risk assessment along a transportation corridor in the Nera Valley Central Italy. Environ. Manag. 2004, 34, 191–208. [Google Scholar] [CrossRef] [PubMed]
- Sarro, R.; Mateos, R.M.; García-Moreno, I.; Herrera, G.; Reichenbach, P.; Laín, L.; Paredes, C. The Son Poc rockfall (Mallorca Spain) on the 6th of March 2013: 3D simulation. Landslides 2014, 11, 493–503. [Google Scholar] [CrossRef]
- Liu, G.; Li, J.; Wang, Z. Experimental verifications and applications of 3D-DDA in movement characteristics and disaster processes of rockfalls. Rock Mech. Rock Eng. 2021, 54, 2491–2512. [Google Scholar] [CrossRef]
- Evans, S.; Hungr, O. The assessment of rockfall hazard at the base of talus slopes. Can. Geotechical J. 1993, 30, 620–636. [Google Scholar] [CrossRef]
- Zhang, J.; Li, H.; Yang, X.; Jiang, N.; Zhou, J. Quantitative assessment of rockfall hazard in post-landslide high rock slope through terrestrial laser scanning. Bull. Eng. Geol. Environ. 2021, 80, 7315–7331. [Google Scholar] [CrossRef]
- Li, H.; Li, X.; Li, W.; Zhang, S.; Zhou, J. Quantitative assessment for the rockfall hazard in a post-earthquake high rock slope using terrestrial laser scanning. Eng. Geol. 2019, 248, 1–13. [Google Scholar] [CrossRef]
- Frattini, P.; Crosta, G.; Carrara, A.; Agliardi, F. Assessment of rockfall susceptibility by integrating statistical and physically-based approaches. Geomorphology 2008, 94, 419–437. [Google Scholar] [CrossRef]
- Morales, T.; Clemente, J.A.; Mollá, L.D.; Izagirre, E.; Uriarte, J.A. Analysis of instabilities in the Basque Coast Geopark coastal cliffs for its environmentally friendly management (Basque-Cantabrian basin northern Spain). Eng. Geol. 2021, 283, 106023. [Google Scholar] [CrossRef]
- Chai, B.; Tang, Z.; Zhang, A.; Du, J.; Su, H.; Yi, H. An uncertainty method for probabilistic analysis of buildings impacted by rockfall in a Limestone Quarry in Fengshan, Southwestern China. Rock Mech. Rock Eng. 2015, 48, 1981–1996. [Google Scholar] [CrossRef]
- Walton, G.; Christiansen, C.; Kromer, R.; Silaev, A. Evaluation of rockfall trends at a sedimentary rock cut near Manitou Springs, Colorado, using daily photogrammetric monitoring. Landslides 2023, 20, 2657–2674. [Google Scholar] [CrossRef]
- Zhang, L.; Yang, Z.; Xu, B. Rockfalls and Rockfall Hazards. J. Eng. Geol. 2004, 12, 225–231. [Google Scholar]
- Labiouse, V.; Heidenreich, B. Half-scale experimental study of rockfall impacts on sandy slopes. Nat. Hazards Earth Syst. Sci. 2009, 9, 1981–1993. [Google Scholar] [CrossRef]
- Chau, K.; Wong, R.; Wu, J. Coefficient of restitution and rotational motions of rockfall impacts. Int. J. Rock Mech. Min. Sci. 2002, 39, 69–77. [Google Scholar] [CrossRef]
- Azzoni, A.; Freitas, M. Experimentally gained parameters, decisive for rock fall analysis. Rock Mech. Rock Eng. 1995, 28, 111–124. [Google Scholar] [CrossRef]
- Paronuzzi, P. Field Evidence and Kinematical Back-Analysis of Block Rebounds: The Lavone Rockfall, Northern Italy. Rock Mech. Rock Eng. 2009, 42, 783–813. [Google Scholar] [CrossRef]
- Dincer, I.; Orhan, A.; Frattini, P.; Crosta, G. Rockfall at the heritage site of the Tatlarin Underground City (Cappadocia, Turkey). Nat. Hazards 2016, 82, 1075–1098. [Google Scholar] [CrossRef]
- Okura, Y.; Kitahara, H.; Sammori, T.; Kawanami, A. The effects of rockfall volume on runout distance. Eng. Geol. 2000, 58, 109–124. [Google Scholar] [CrossRef]
- Hu, J.; Li, S.; Shi, S.; Li, L.; Qian, Z.; Liu, H.; Peng, H. Experimental Study on Parameters Affecting the Runout Range of Rockfall. Adv. Civ. Eng. 2018, 2, 4739092. [Google Scholar] [CrossRef]
- Crosta, G.B.; Agliardi, F. Parametric evaluation of 3D dispersion of rockfall trajectories. Nat. Hazards Earth Syst. Sci. 2004, 4, 583–598. [Google Scholar] [CrossRef]
- Li, B.; Pei, X.; Cheng, Q.; Li, S. Research on disaster characteristics of earthquake collapse of Rockfall. Gansu Water Conserv. Hydropower Technol. 2010, 46, 11–13. [Google Scholar]
- Barrios, G.; Carvalho, R.; Kwade, A.; Tavares, L. Contact parameter estimation for DEM simulation of iron ore pellet handling. Powder Technol. 2013, 248, 8493. [Google Scholar] [CrossRef]
- Potyondy, D.; Cundall, P. A bonded-particle model for rock. Int. J. Rock Mech. Min. Sci. 2004, 41, 1329–1364. [Google Scholar] [CrossRef]
- Nakajima, S.; Abe, K.; Shinoda, M.; Nakamura, S.; Nakamura, H. Experimental study on impact force due to collision of rockfall and sliding soil mass caused by seismic slope failure. Landslides 2020, 18, 195–216. [Google Scholar] [CrossRef]
- Blasio, F.; Sæter, M. Small-scale experimental simulation of talus evolution. Earth Surf. Process. Landf. 2009, 34, 1685–1692. [Google Scholar] [CrossRef]
- He, Y.; Nie, L.; Lv, Y.; Wang, H.; Jiang, S.; Zhao, X. The study of rockfall trajectory and kinetic energy distribution based on numerical simulations. Nat. Hazards 2021, 106, 213–233. [Google Scholar] [CrossRef]
- Asteriou, P.; Tsiambaos, G. Empirical model for predicting rockfall trajectory direction. Rock Mech. Rock Eng. 2016, 49, 927–941. [Google Scholar] [CrossRef]
- Lo, S.; Wang, W. Generation of anisotropic mesh by ellipse packing over an unbounded domain. Eng. Comput. 2005, 20, 372–383. [Google Scholar] [CrossRef]
- Azzoni, A.; La Barbera, G.; Zaninetti, A. Analysis and prediction of rockfalls using a mathematical model. Int. J. Rock Mech. Min. Sci. 1995, 32, 709–724. [Google Scholar] [CrossRef]
- Tan, L.B. Study on the Damage Mechanism of Rolling Stone Impact Pier and the Stress Characteristics of Pier. Master’s Thesis, Southwest University of Science and Technology, Mianyang, China, 2022. [Google Scholar] [CrossRef]
- Chen, H.; Tang, H.; Wang, L.; Ye, S. Collapse Evolution Theory of Dangerous Rock and Its Application; Science Press: Beijing, China, 2009. [Google Scholar]
- Guo, B.; Fu, X.; Zhang, Z. The relationship between the distribution of post-earthquake secondary geological hazards and the evolution of landforms and riverbeds in Longxi River Basin. J. Basic Sci. Eng. 2013, 21, 1005–1017. [Google Scholar]
- Shen, W.G.; Zhao, T.; Crosta, G.B.; Dai, F.; Dattola, G. Influence of interparticle friction and damping on the dynamics of spherical projectile impacting onto a soil bed. Front. Earth Sci. 2022, 10, 835271. [Google Scholar] [CrossRef]
- Seguin, A.; Bertho, Y.; Gondret, P. Influence of confinement on granular penetration by impact. Phys. Rev. E 2008, 78, 010301. [Google Scholar] [CrossRef] [PubMed]
- Ye, S.; Chen, H.; Tang, H. Research on the offset and random characteristics of the rockfall during the falling process by field tests. China Railw. Sci. 2011, 32, 74–79. [Google Scholar]
- Liu, D.; Ye, S.; Huang, J. Research on the offset ratio of rockfall movement by model tests. J. Yangtze River Sci. Res. Inst. 2014, 31, 29–32. [Google Scholar] [CrossRef]


| DEM Parameter | Value | DEM Parameter | Value |
|---|---|---|---|
| Length of the slope L [m] | 40 | Particle density [kg/m3] | 2700 |
| Slope inclination angle β [°] | 15/20/25 | Young’s modulus [Pa] | 1.00 × 10⁸ |
| Width of the slope W [m] | 10 | Poisson’s ratio [-] | 0.25 |
| Average particle radius of the foundation layer [m] | 0.125 | Normal bond stiffness [N/m3] | 1.00 × 10⁷ |
| Particle bond radius of the foundation layer [m] | 0.12 | Tangential bond stiffness [N/m3] | 1.00 × 10⁷ |
| Average particle radius of the granular cushion layer [m] | 0.05 | Normal tensile strength [Pa] | 1.00 × 10¹⁰ |
| Spherical rockfall radius R [m] | 0.3/0.4/0.5/0.6/0.7 | Tangential tensile strength [Pa] | 1.00 × 10¹⁰ |
| Coefficient of restitution e [-] | 0.8 | Coefficient of rolling friction [-] | 0.1 |
| Coefficient of static friction [-] | 0.5 | Gravitational acceleration [m/s2] | 9.81 |
| Initial horizontal velocities V0x [m/s] | 1/3/5/7/9/11 | The foundation layer’s thickness [m] | 3.4 |
| The granular cushion layer thickness [m] | 0.35/0.5/0.65/0.8/1.1/1.4/1.7 | ||
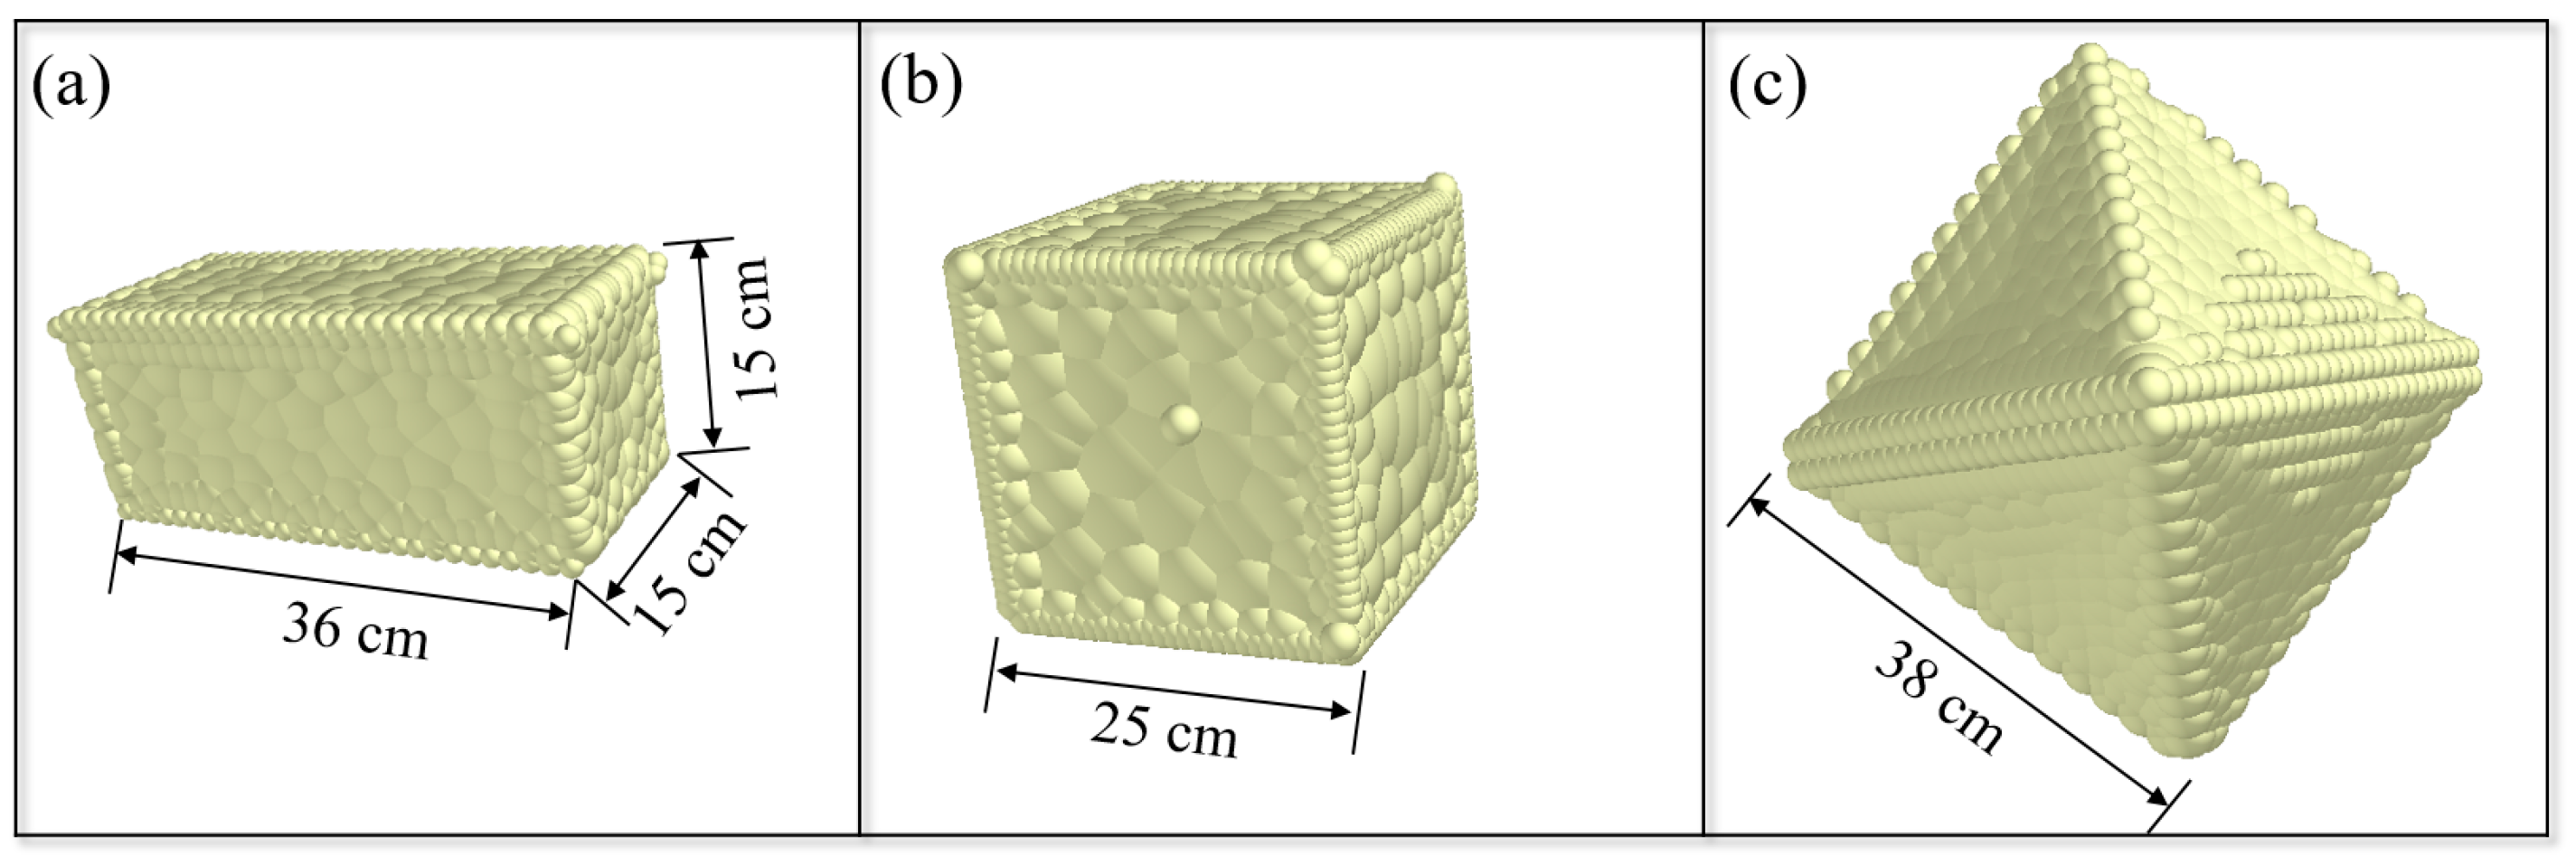
| Block | Number | Dimension [cm] | Mass [kg] (Experiment) | Mass [kg] (DEM) |
|---|---|---|---|---|
| Cuboid | 1−1 | 36 × 15 × 15 | 19.10 | 18.86 |
| Cube | 2−2 | Edge length 25 | 41.20 | 40.81 |
| Regular octahedron | 3−3 | Edge length 38 | 68.40 | 71.35 |
Disclaimer/Publisher’s Note: The statements, opinions and data contained in all publications are solely those of the individual author(s) and contributor(s) and not of MDPI and/or the editor(s). MDPI and/or the editor(s) disclaim responsibility for any injury to people or property resulting from any ideas, methods, instructions or products referred to in the content. |
© 2024 by the authors. Licensee MDPI, Basel, Switzerland. This article is an open access article distributed under the terms and conditions of the Creative Commons Attribution (CC BY) license (https://creativecommons.org/licenses/by/4.0/).
Share and Cite
Qian, T.; Luo, W.; Zheng, B.; Feng, Y.; Yin, D. Estimation Model of Rockfall Trajectory Lateral Dispersion on Slopes with Loose Granular Cushion Layer Based on Three-Dimensional Discrete Element Method Simulations. Processes 2024, 12, 2788. https://doi.org/10.3390/pr12122788
Qian T, Luo W, Zheng B, Feng Y, Yin D. Estimation Model of Rockfall Trajectory Lateral Dispersion on Slopes with Loose Granular Cushion Layer Based on Three-Dimensional Discrete Element Method Simulations. Processes. 2024; 12(12):2788. https://doi.org/10.3390/pr12122788
Chicago/Turabian StyleQian, Tingbin, Wei Luo, Baojing Zheng, Yixin Feng, and Desheng Yin. 2024. "Estimation Model of Rockfall Trajectory Lateral Dispersion on Slopes with Loose Granular Cushion Layer Based on Three-Dimensional Discrete Element Method Simulations" Processes 12, no. 12: 2788. https://doi.org/10.3390/pr12122788
APA StyleQian, T., Luo, W., Zheng, B., Feng, Y., & Yin, D. (2024). Estimation Model of Rockfall Trajectory Lateral Dispersion on Slopes with Loose Granular Cushion Layer Based on Three-Dimensional Discrete Element Method Simulations. Processes, 12(12), 2788. https://doi.org/10.3390/pr12122788