Article

Efficient One-Pot Hydrothermal Synthesis of TiO2 Nanostructures for Reactive Black 5 Dye Removal: Experimental and Theoretical Insights

1
Department of Chemistry, College of Science, King Faisal University, Al-Ahsa 31982, Saudi Arabia
2
Chemistry Department, Faculty of Science, Benha University, Benha 13518, Egypt
3
Environmental Research Department, Soil, Water and Environmental Institute, Agriculture Research Center, Giza 12619, Egypt
4
Energy Materials Laboratory, School of Sciences and Engineering, The American University in Cairo, New Cairo 11835, Egypt
5
Department of Chemistry, Faculty of Science, Islamic University of Madinah, Madinah 42351, Saudi Arabia
6
Department of Chemistry, Faculty of Science, Sohag University, Sohag 82534, Egypt
7
Chemistry Department, Faculty of Science, Zagazig University, Zagazig 44519, Egypt
*
Authors to whom correspondence should be addressed.
These authors contributed equally to this work.
Processes 2024, 12(12), 2786; https://doi.org/10.3390/pr12122786
Submission received: 31 August 2024 / Revised: 7 October 2024 / Accepted: 2 December 2024 / Published: 6 December 2024
(This article belongs to the Section Environmental and Green Processes)

Abstract

Water scarcity continues to be a major worldwide issue. Therefore, from a scientific perspective, it is crucial to develop a highly effective, affordable, environmentally friendly, and readily available metal-based adsorbent for wastewater treatment. This study focuses on synthesizing a mesoporous/nanosphere TiO2 using a free-template and eco-friendly method to effectively remove Reactive Black 5 (RB5) dye. The synthesis of TiO2 nanospheres was achieved through the use of titanium isopropoxide at 100 °C for 12 h in a one-pot hydrothermal process, successfully regulating their morphology and crystallite size. The TiO2 nanospheres were extensively characterized using multiple techniques, such as XRD, FE-SEM, zeta potential, FT-IR, HR-TEM, and BET surface area tools. Adsorption experiments revealed a notable capacity of 109 mg g−1 for RB5 dye, following pseudo-second-order kinetic behavior. The equilibrium data conformed well to the Langmuir isotherm model, indicating monolayer adsorption. Thermodynamic evaluations confirmed that the process was spontaneous, endothermic, and governed by physisorption. Calculations using density functional theory (DFT) provided additional support for the experimental findings, demonstrating strong binding interactions between the dye and the TiO2 (101) surface. The TiO2 nano-adsorbent showed excellent reusability and maintained high adsorption efficiency over multiple cycles, making it a promising candidate for wastewater treatment.

1. Introduction

Water pollution, particularly from toxic organic dyes, poses a significant threat to the environment, particularly aquatic ecosystems and human health. Some of the main pollutants released into water bodies are these dyes, which are produced in large quantities by industries like textiles, rubber, paper, leather, plastic, and pottery [1]. Because reactive dyes can make strong covalent bonds with cotton fibers to produce vibrant and long-lasting colors, the textile industry in particular depends heavily on them. However, because of their toxicity, carcinogenic nature, and resistance to biodegradation, reactive dyes like Reactive Black 5 (RB5) are a major cause for concern [2]. It is thought that these dyes’ complex chemical structures, which include azo groups and aromatic rings, contribute to their environmental durability by making it difficult for them to degrade naturally [3]. The widespread use of such dyes necessitates effective methods for their removal to remove them from wastewater to prevent environmental and health risks. In response to the environmental and health challenges posed by these dyes, various physical and chemical methods were developed to eliminate them from wastewater. Techniques such as reverse osmosis [4], membrane filtration [5], chemical precipitation [6], flocculation [7], bio-sorption [8], solvent extraction [9], and adsorption [3,10,11,12,13] were explored. Among these, adsorption stands out as a prominent method for dye removal due to its high efficiency, cost effectiveness, and eco-friendly nature [1]. Adsorption is a versatile technology that can selectively remove pollutants even in low concentrations and is therefore extremely effective for wastewater treatment. Furthermore, it allows for straightforward operation and can be utilized under various conditions, thereby rendering it ideal for extensive industrial applications.
Numerous materials were explored as adsorbents to eliminate dyes, including agricultural byproducts, activated carbon and carbon nanotubes, and plant wastes [13,14]. These materials vary in their adsorption efficiency and capacity depending on factors such as surface area, porosity, and chemical functionalization [14]. However, conventional adsorbents often have significant limitations, including having low adsorption capacity and being time-consuming, expensive, and complex, as well as challenges related to regeneration and reusability [14]. Consequently, there is a growing need to develop more efficient, cost-effective, and easier-to-produce adsorbents.
Nanoscale titanium dioxide (TiO2) has emerged as a promising adsorbent for organic pollutants in water, attributed to its non-toxic nature, affordability, high surface area, and strong adsorption capacity. Titanium dioxide (TiO2) is present in three distinct crystalline structures, brookite, rutile, and anatase, among which anatase is recognized as the most thermodynamically stable form, valued for its excellent photocatalytic activity and thermal stability [15]. Due to these properties, TiO2 is widely used in applications such as photocatalysis, solar cells, fuel cells, CO2 reduction, antimicrobial treatments, and wastewater treatment [15,16,17,18,19]. Various methods, such as hydrothermal synthesis [20], combustion [21], chemical vapor deposition [22], anodization [23], and sol–gel [24], have been used to produce TiO2. Hydrothermal synthesis is characterized by its simplicity, low cost, and scalability, allowing precise control of morphology and crystallite size without the need for post-synthesis heat treatment, making it an energy-efficient and cost-effective technique [25,26,27].
This study introduces a straightforward one-pot hydrothermal synthesis of TiO2 nanoparticles, accomplished without requiring any post-synthesis thermal treatment. Notably, the resulting porous TiO2 nanoparticles demonstrated a remarkably high surface area of 379.4 m2/g, significantly surpassing the value previously reported in our earlier work [21]. The synthesis was performed under milder temperature and time conditions compared to previous methods [21,28,29]. These as-prepared TiO2 nanoparticles exhibited excellent adsorption capacity and fast Reactive Black 5 dye removal kinetics. A comprehensive assessment of the adsorption performance was carried out using various kinetic and thermodynamic models, and the adsorption process was further investigated using DFT calculations. FT-IR and SEM analyses provided insights into the underlying adsorption mechanisms. TiO2 was found to be extremely effective in decolorizing water and exhibited excellent adsorption capacity, kinetics, recovery, regeneration, and reusability.

2. Experimental Section

2.1. Materials and Reagents

Titanium isopropoxide (97%) and Reactive Black 5 dye (Reactive Black 5: Table 1) were acquired from Sigma–Aldrich Chemical Co. (Saint Louis, MO, USA). Nitric acid, HNO3, and ethyl alcohol, C2H5OH, were sourced from El-Nasr Pharmaceutical Chemicals Company (Cairo, Egypt). No additional purification was performed on the chemicals, and they were utilized as supplied.

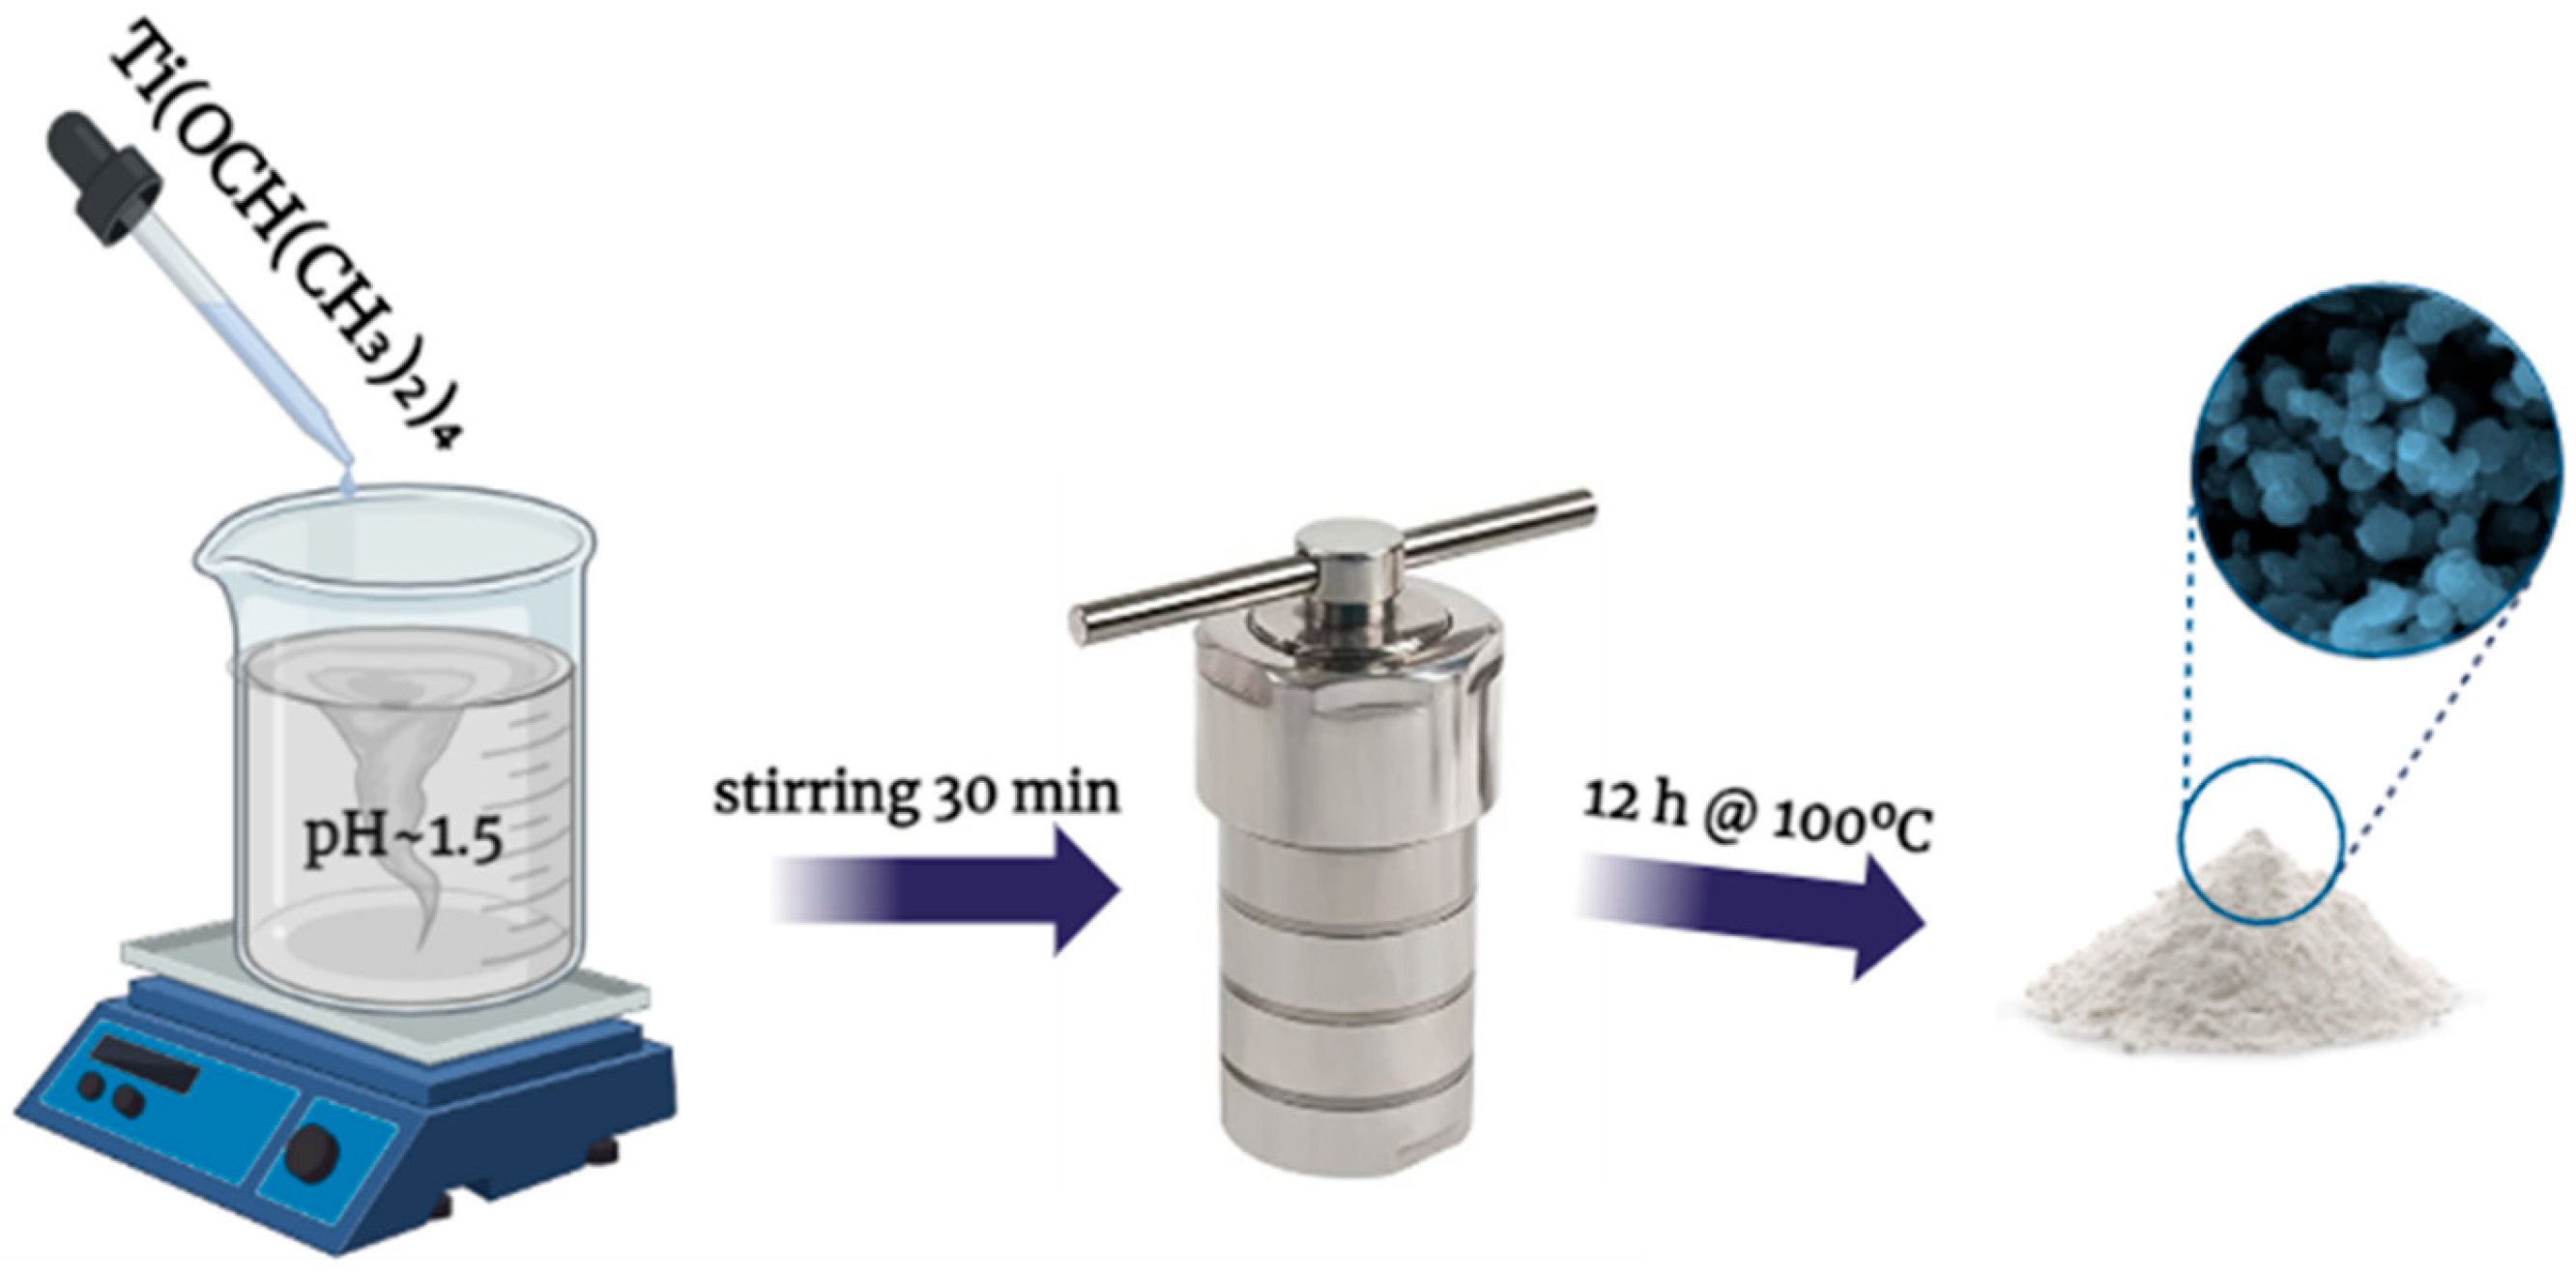
2.1.1. Synthesis of TiO2 (Titania) Nanoparticles

A 1 mL aliquot (0.937 g, 0.165 mol) of titanium tetra-isopropoxide was introduced into 20 mL of deionized water, with the pH adjusted to below 1.75 using nitric acid. The resultant mixture was vigorously agitated for 30 min. Subsequently, the reaction blend was then placed into a 50 mL Teflon-sealed vessel and incubated at 100 °C over 12 h. Following the reaction, the autoclave was permitted to cool naturally before collecting the sample. The product was washed extensively with deionized water until the pH became neutral, and it was subsequently dried overnight at 60 °C to produce pure anatase-phase TiO2 nanoparticles (Figure 1). Various experimental conditions, including reaction temperature (100–230 °C), reaction duration (10, 12, 16, 20, and 24 h), and titanium ion concentration (0.165, 0.330, and 0.495 mol), were systematically explored to adjust the hydrothermal synthesis process for TiO2 nanoparticles. Notably, the optimization of TiO2 synthesis was performed using the one-variable-at-a-time (OVAT) approach.

2.1.2. Characterization

A D8 Advance diffractometer (Bruker, Karlsruhe, Germany) was employed, utilizing monochromatic Cu Ka radiation (λ = 1.54178 Å) in the 2θ range 10° to 80°, using a step size of 0.02° and a scanning rate of 2° per minute to acquire the XRD spectra. The high-resolution transmission electron microscopy (HRTEM) image was captured at an accelerating voltage of 200 kV using a JEM-2100 instrument (JEOL Ltd., Akishima, Tokyo, Japan). TiO2 nanostructure morphology was examined with a field emission scanning electron microscope (FE-SEM, JEOL JSM-6390) (JEOL Ltd., Akishima, Tokyo, Japan)., and the energy dispersive X-ray (EDX) analysis of the sample was obtained using this microscope. The chemical structure variation was measured using a Fourier transform infrared spectrometer (Thermo Scientific, model Nicolet iS10, Waltham, Massachusetts, USA) across the range of 4000 to 400 cm−1 with KBr pellets. Titania (TiO2) nanoparticles underwent additional examination utilizing a Raman microscope (Pro Raman-L Analyzer). The N2-adsorption–desorption isotherms (Nova 2000 series, Florida, USA), madzu, model TA-60WS, at 77 K in nitrogen in the liquid phase were employed to determine the surface area and pore structure of the TiO2 adsorbent. The specific surface area (SSA) of the product was determined using the Brunauer–Emmett–Teller (BET) method. Pore volume and pore size (PS) distributions were derived from the adsorption branches of the isotherms utilizing the Barrett–Joyner–Halenda (BJH) model and the density functional theory (DFT) model, respectively. A TiO2 nanostructure isoelectric point (IEP) was estimated by assessing the zeta potential with a Zetasizer Nano series meter (Nano ZS, Malvern, UK) in pH solutions ranging from 2 to 10, using a 0.01 M NaCl solution. For the adsorption studies, the absorbance of the aqueous dye solution was assessed using a UV-Vis spectrophotometer (Jasco-model V-670).

2.2. Adsorption Studies

The adsorption characteristics of the mesoporous TiO2 nanostructure were evaluated utilizing RB5 dye as a model adsorbate under various experimental conditions. Batch adsorption experiments were performed with parameters including pH (1–9), contact time (0–110 min), initial dye concentrations (from 50 to 500 mg L−1), KCl dosage (0–500 mg), and temperature (298–318 K). A 50 mL RB5 dye solution of 250 mg L−1 initial concentration at pH 1.5 was stirred at 400 rpm with TiO2 (0.10 g) at 25 °C to ensure thorough interaction. At predetermined intervals, aliquots were taken from the adsorption medium, and centrifuged to isolate the TiO2 nanoparticles, and the dye concentration in the liquid phase was quantified using a Jasco UV-Vis spectrophotometer at 598 nm. The removal percentage (% uptake) of the dye and adsorption capacity were computed utilizing Equations (1) and (2), respectively:
%   uptake = ( C 0 C t ) C 0 × 100
q t = V ( C 0 C t ) m
where C0 represents the initial dye concentration (mg L−1), and Ct is the dye concentration remaining at t time (mg L−1). V is the dye solution volume (L), m is the adsorbent weight (g), and qt is the adsorbent adsorption capacity (mg g−1).

2.3. Theoretical Calculations

The spin-polarized density functional theory (DFT+U) was employed to conduct geometry optimization, energy, and charge density difference calculations, as implied in the CASTEP code. In these calculations, density functional calculations were conducted utilizing the Generalized Gradient Approximation (GGA) for the exchange–correlation functional, specifically GGA-PW91 [30], with the interaction between electrons and ions described by the Ultrasoft pseudopotential [31]. The Broyden–Fletcher–Goldfarb–Shanno (BFGS) scheme was employed to carry out the minimization algorithm, utilizing a plane wave cut-off energy of 400 eV. The Monkhorst–Pack mesh for k-point sampling was configured with a separation of 0.04 1/Å. To address the self-interaction error that GGA functionals experience in the context of wide bandgap transition metal oxides [32,33], we employed the Hubbard correction method [34], setting the effective Hubbard parameter (U) to 7 eV for the Ti d orbitals. The selection of these values is grounded in the findings from earlier studies [35].

3. Results and Discussion

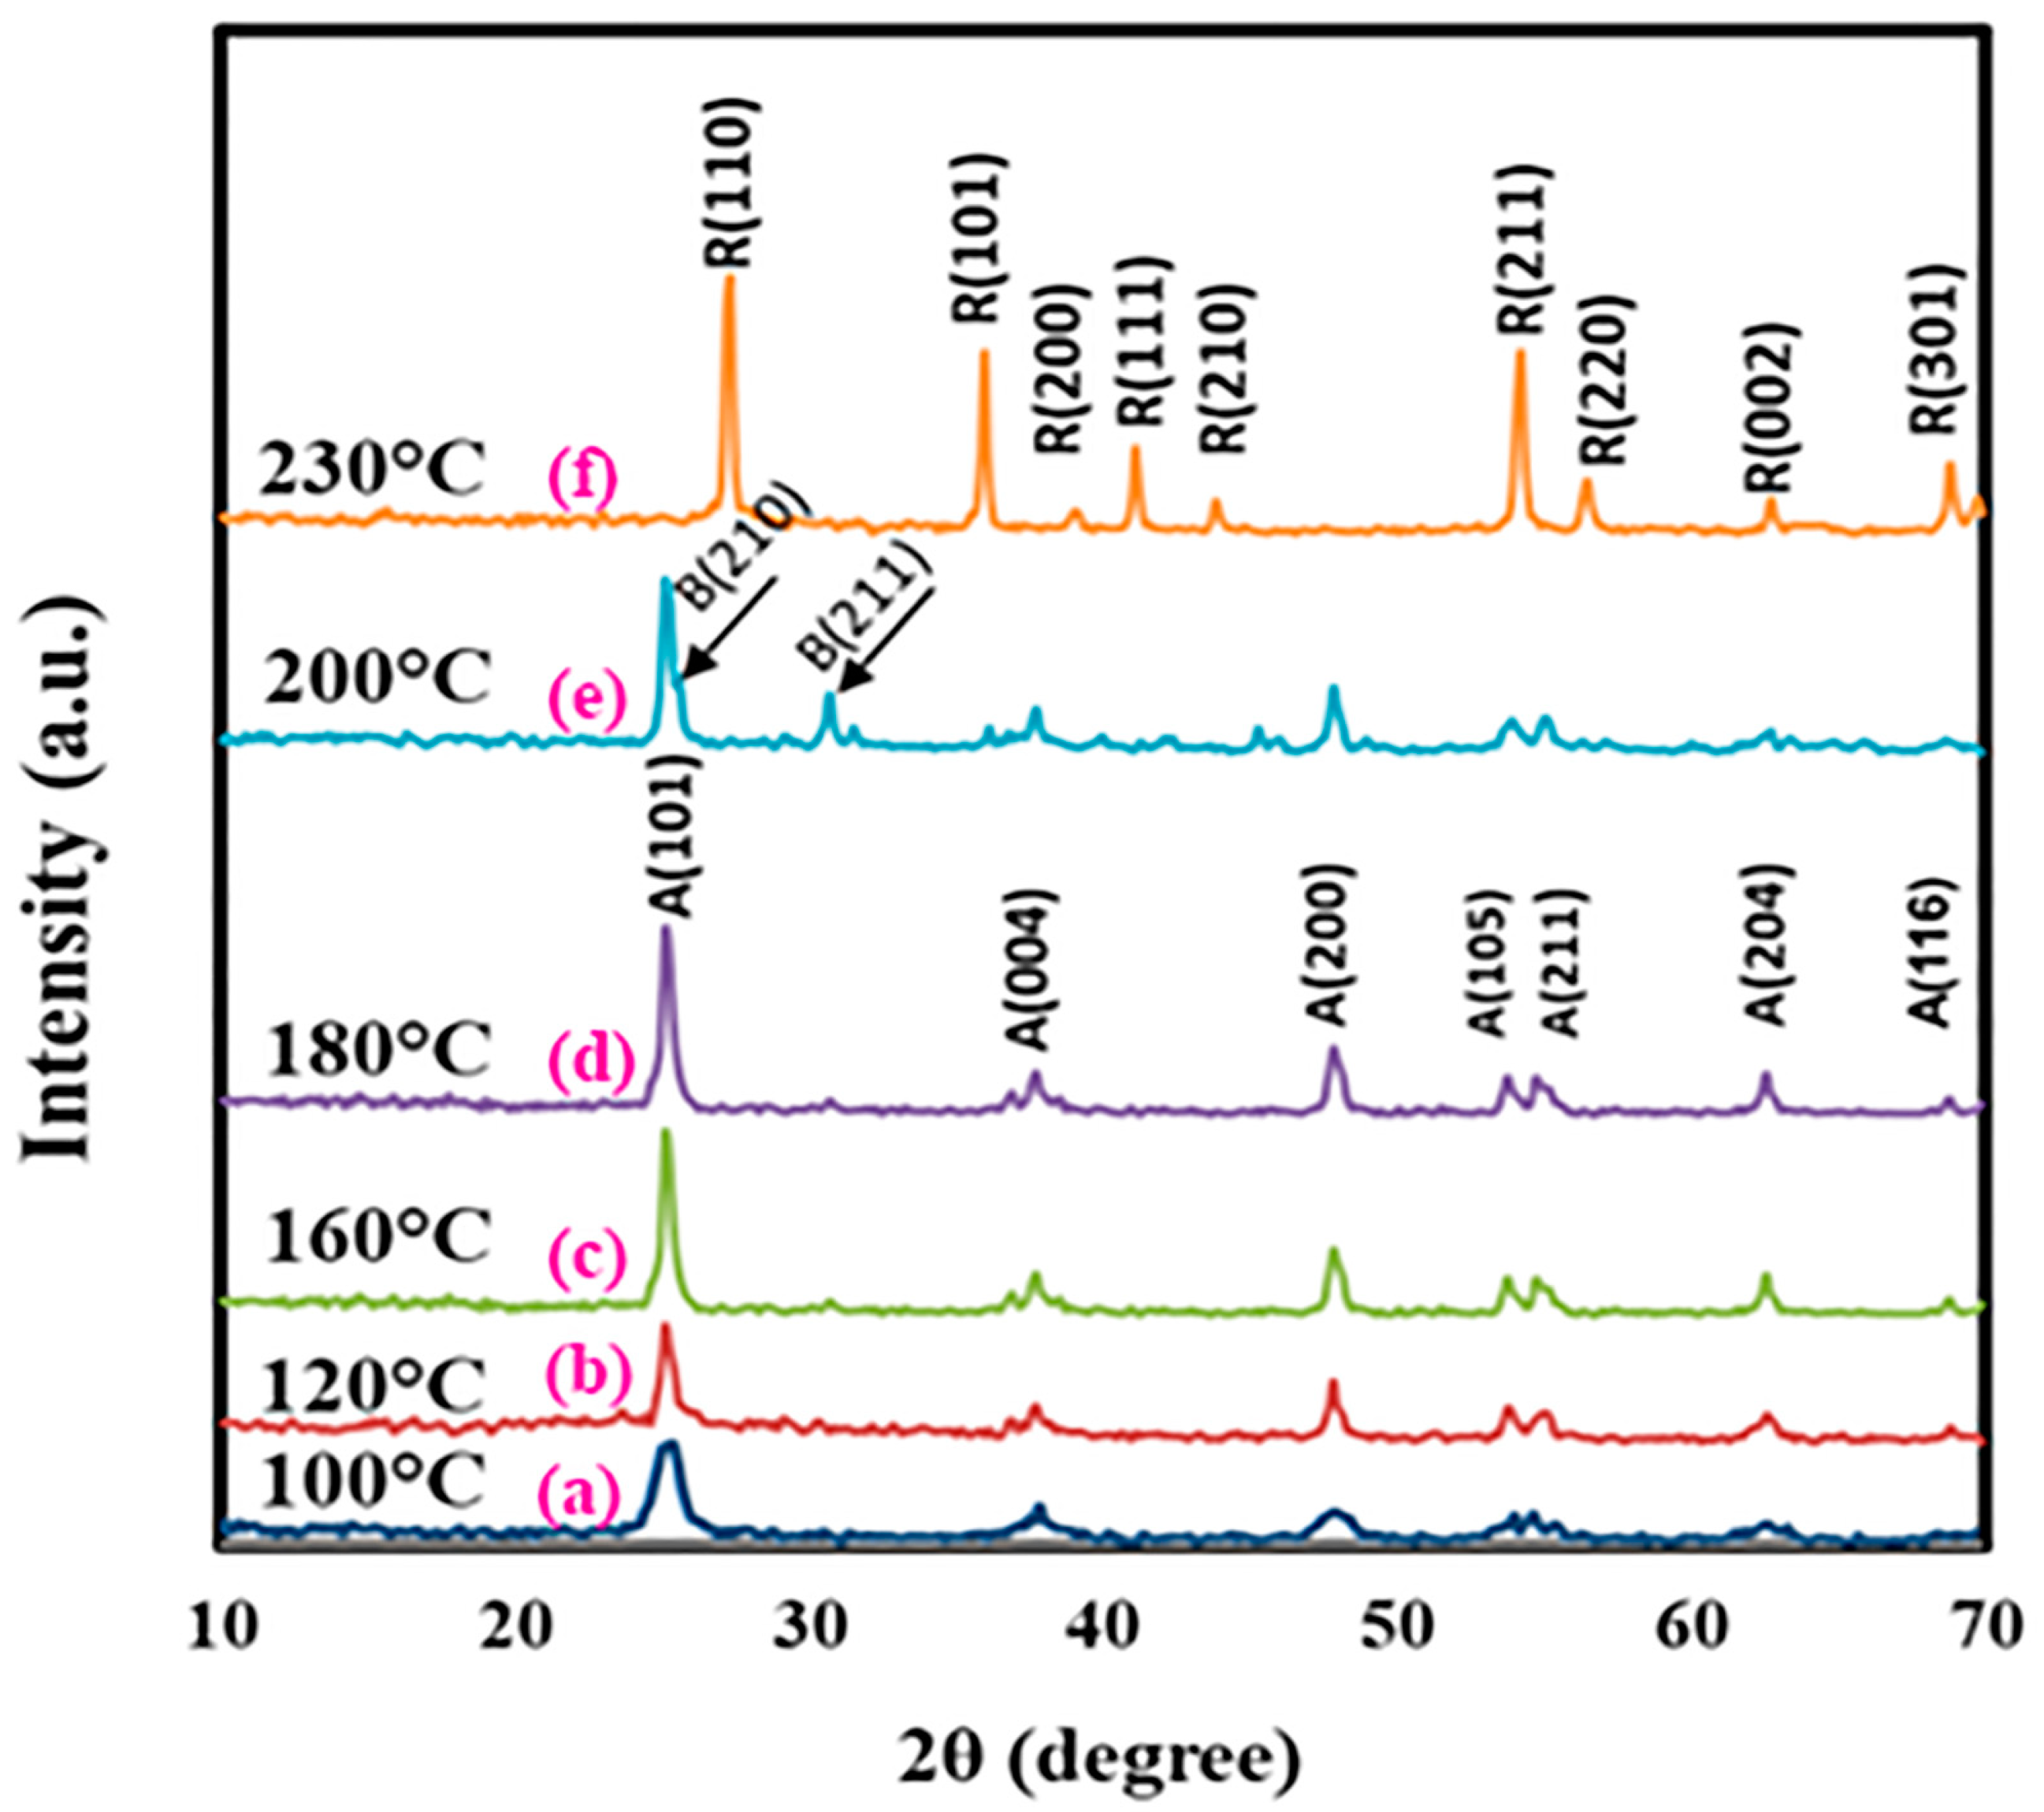
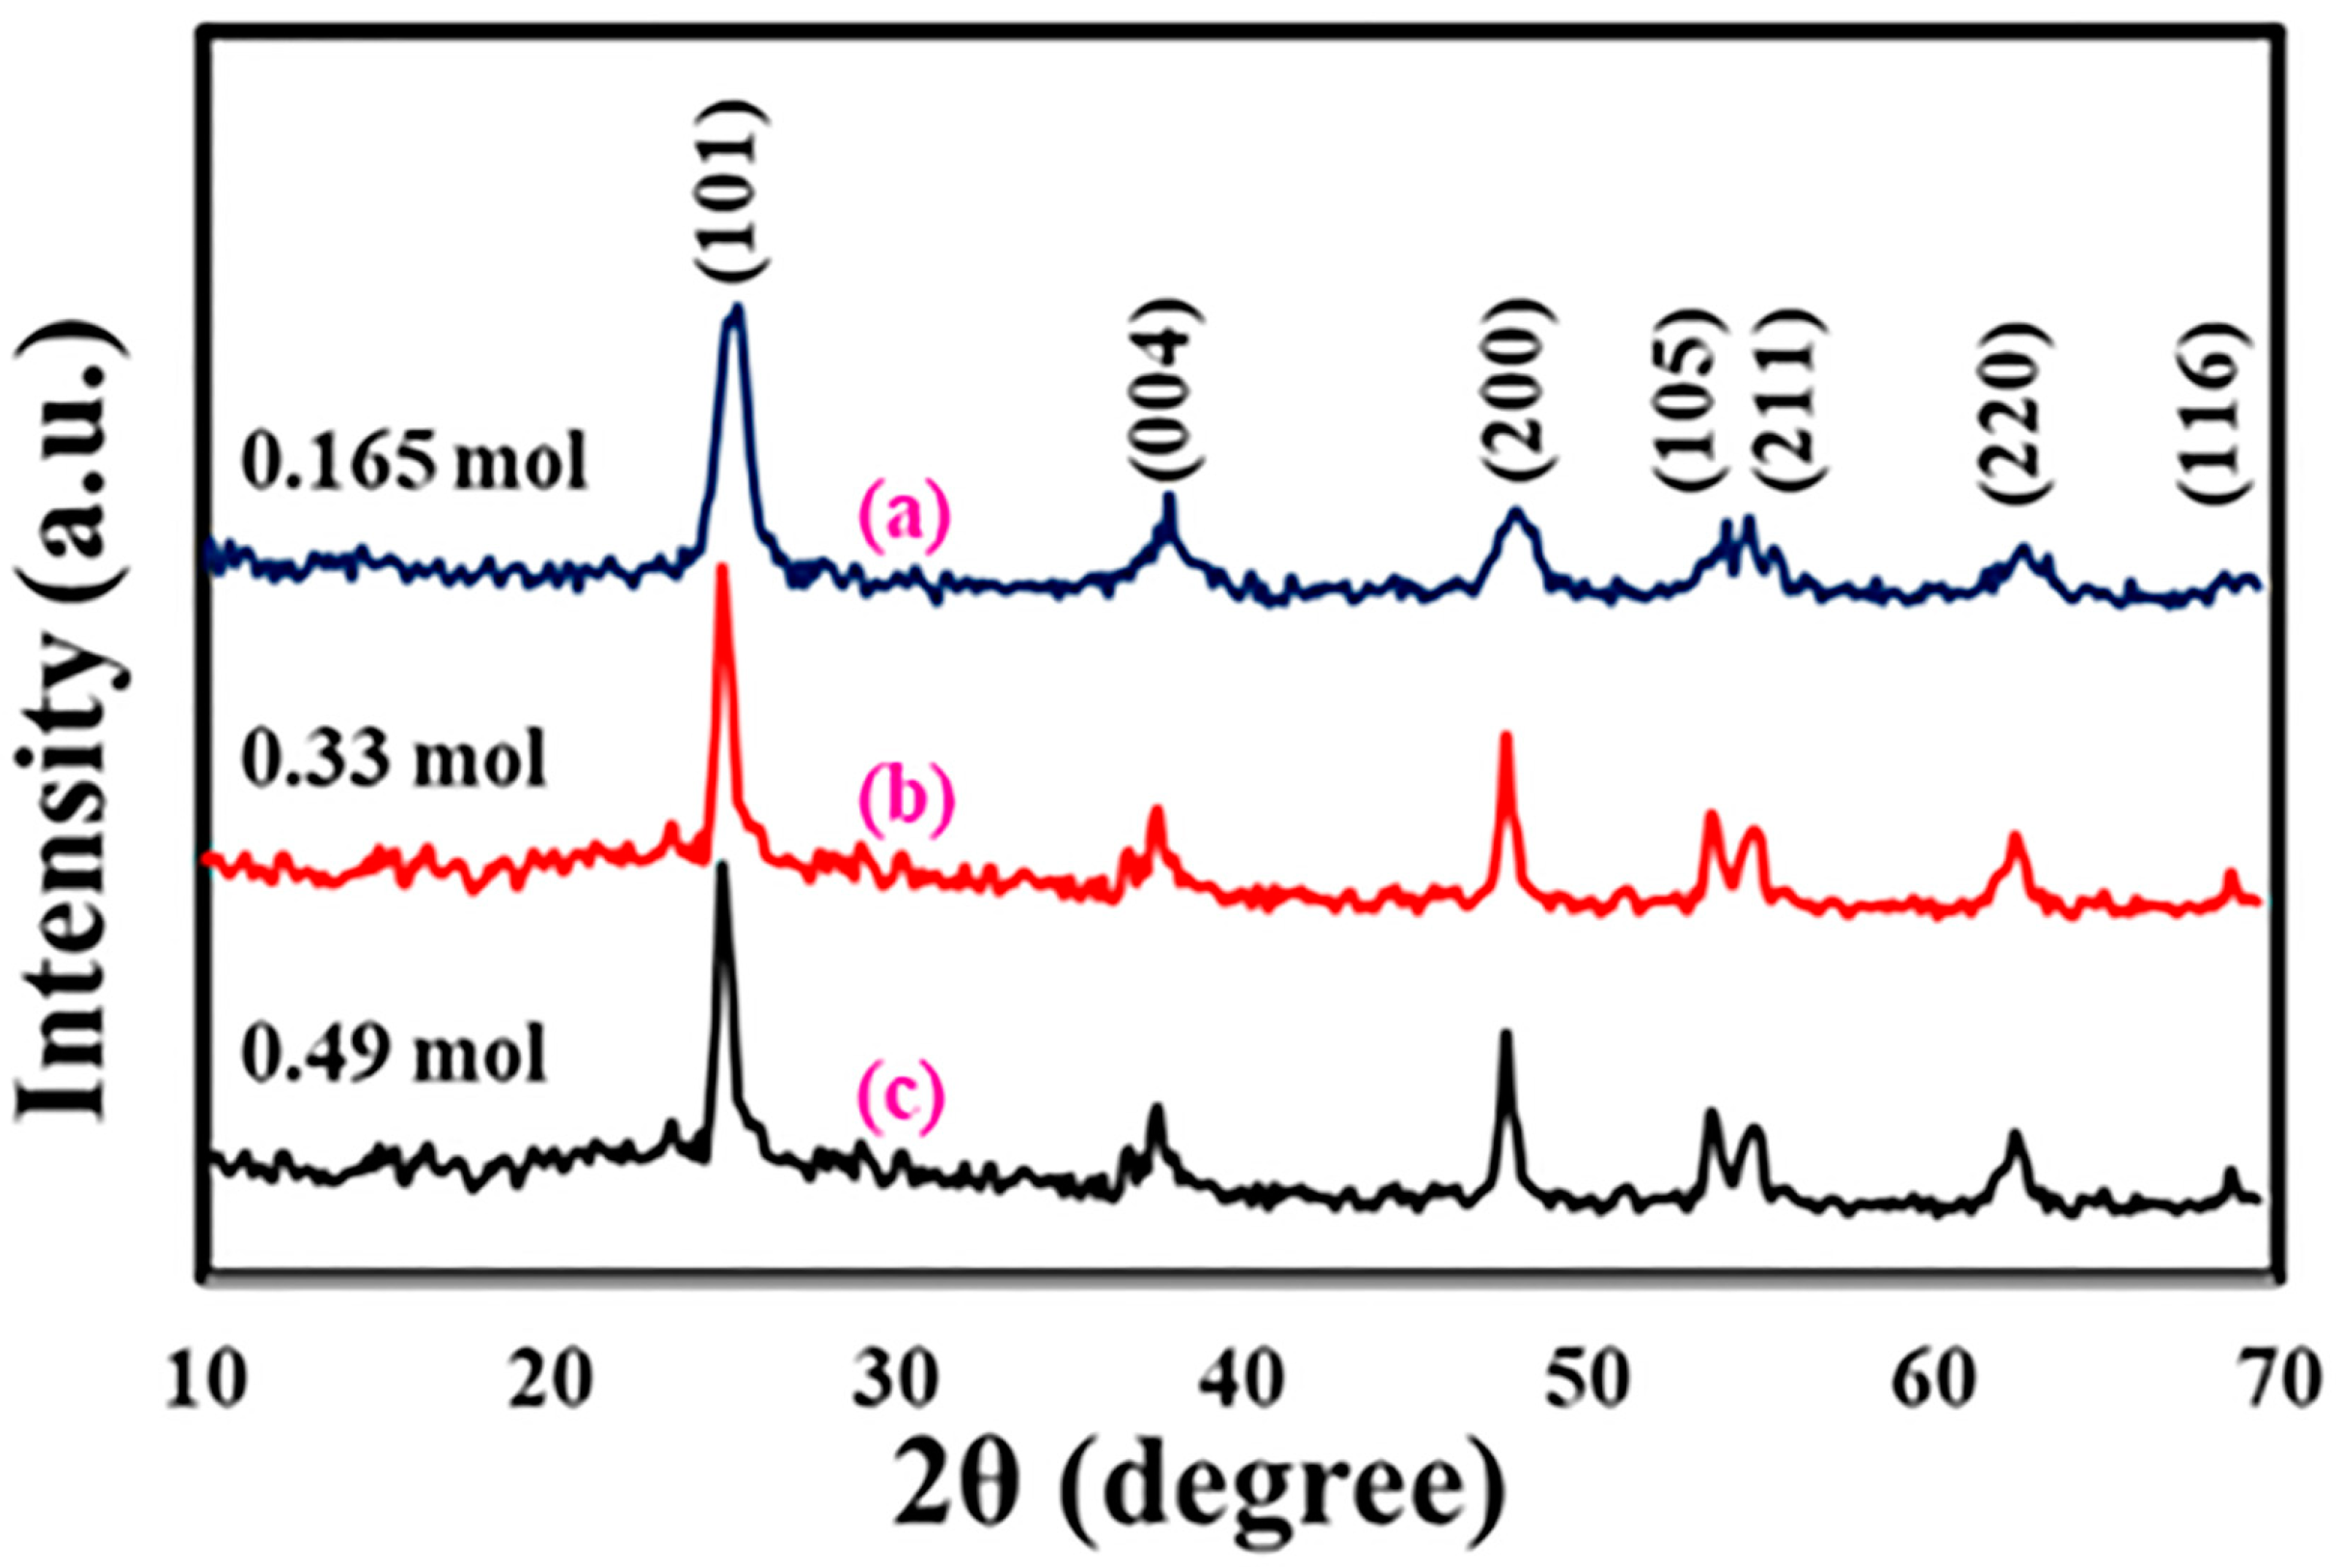
3.1. Fabrication and Analysis of TiO2 Nanostructures

TiO2 nanoparticles were effectively synthesized using a one-step hydrothermal process by utilizing titanium tetraisopropoxide and an aqueous nitric acid solution. This method integrates hydrolysis, in which the titanium precursor reacts with water, and condensation, which together result in the formation of titanium dioxide. The presence of nitric acid is crucial as it helps regulate the reaction environment and influences the final properties of the TiO2 nanoparticles. An optimization study revealed that the optimal results were obtained at a reaction temperature of 100 °C for a duration of 12 h. Under these optimized conditions, the resulting TiO2 nanoparticles had an average crystallite size of approximately 5.4 nm. This approach demonstrates the effectiveness of combining hydrothermal treatment with the sol–gel method using specific chemical additives to adjust the size and quality of the nanoparticle products. The TiO2 nanostructures were analyzed through various techniques, such as XRD, FT-IR, TEM, EDS, XPS (Al Kα source, hν = 1486.7 eV), Raman spectroscopy, FE-SEM, and BET surface investigation. Figure 2a illustrates the XRD pattern of TiO2 fabricated under the optimal conditions. The diffraction peaks identified at 2θ = 25.3°, 37.7°, 48°, 35.8°, 53.9°, 55.1°, and 62.6° correspond to the (101), (004), (200), (105), (211), and (204) crystal planes, respectively, implying the formation of pure tetragonal phase TiO2 (anatase). The cell constants are a = 3.7822 Å, b = 3.7822 Å, and c = 9.5023 Å (space group I41/AMD, JCPDS card 084-1286), consistent with earlier research [21]. The crystallite size (D) was computed using the Debye–Scherrer equation (Equation (3)), where λ denotes the X-ray wavelength; β, FWHM, refers to the full width at half maximum of the XRD peaks; and θB indicates the Bragg’s angle of diffraction.
D = 0.9 λ / β cos θ B
Our study investigated various parameters affecting the hydrothermal synthesis of pure mesoporous TiO2 nanoparticles from anatase in a single, simple step without the need for additional thermal treatment. Optimization factors included reaction temperature, time, and titanium precursor concentration. First, we investigated the influence of reaction temperature on TiO2 nanoparticle synthesis in the range of 230 °C, 200 °C, 180 °C, 160 °C, 120 °C, and 100 °C. The XRD patterns of TiO2 nanoparticles synthesized at different temperatures over 24 h (Figure 2) showed that 100 °C was the optimal reaction temperature and yielded a large amount of the pure anatase phase. Higher temperatures also led to the formation of impurities. At temperatures ranging from 100 °C to 160 °C, the product consisted of a pure anatase phase without impurities. In contrast, at temperatures ≥ 160 °C, peaks at 2θ = 27.4° and 41.5°, corresponding to the (210) and (211) crystal planes of orthorhombic brookite TiO2 (space group Pbca, JCPDS card 076-1937), began to appear. At ≥ 200 °C, rutile (tetragonal phase, space group P42/mnm, JCPDS card 087-0920) became the dominant phase (Figure 2(f)). Furthermore, increasing the reaction temperature resulted in larger crystallite sizes.
The effect of hydrothermal treatment time (24, 20, 18, 12, and 10 h) on TiO2 nanoparticle synthesis at 100 °C was investigated, as displayed in Figure 3. The findings revealed that 12 h was the optimal reaction time for producing pure anatase TiO2 nanoparticles, yielding a product free from impurities and with a sufficient quantity. Additionally, the influence of titanium precursor concentration on the hydrothermal process was studied using concentrations of 0.165, 0.33, and 0.49 mol at 100 °C for 12 h. Figure 4 presents the XRD patterns of the obtained products. The data exhibited that variations in precursor concentration had a slight impact on the crystallite size of the TiO2 formed. Increasing the titanium precursor concentration from 0.165 to 0.49 mol led to a gradual decrease in crystallite size. Higher precursor concentrations during the hydrothermal reaction resulted in smaller TiO2 nanoparticles due to a larger number of TiO2 nuclei. However, at concentrations exceeding 0.49 mol, TiO2 particles began to agglomerate [36].

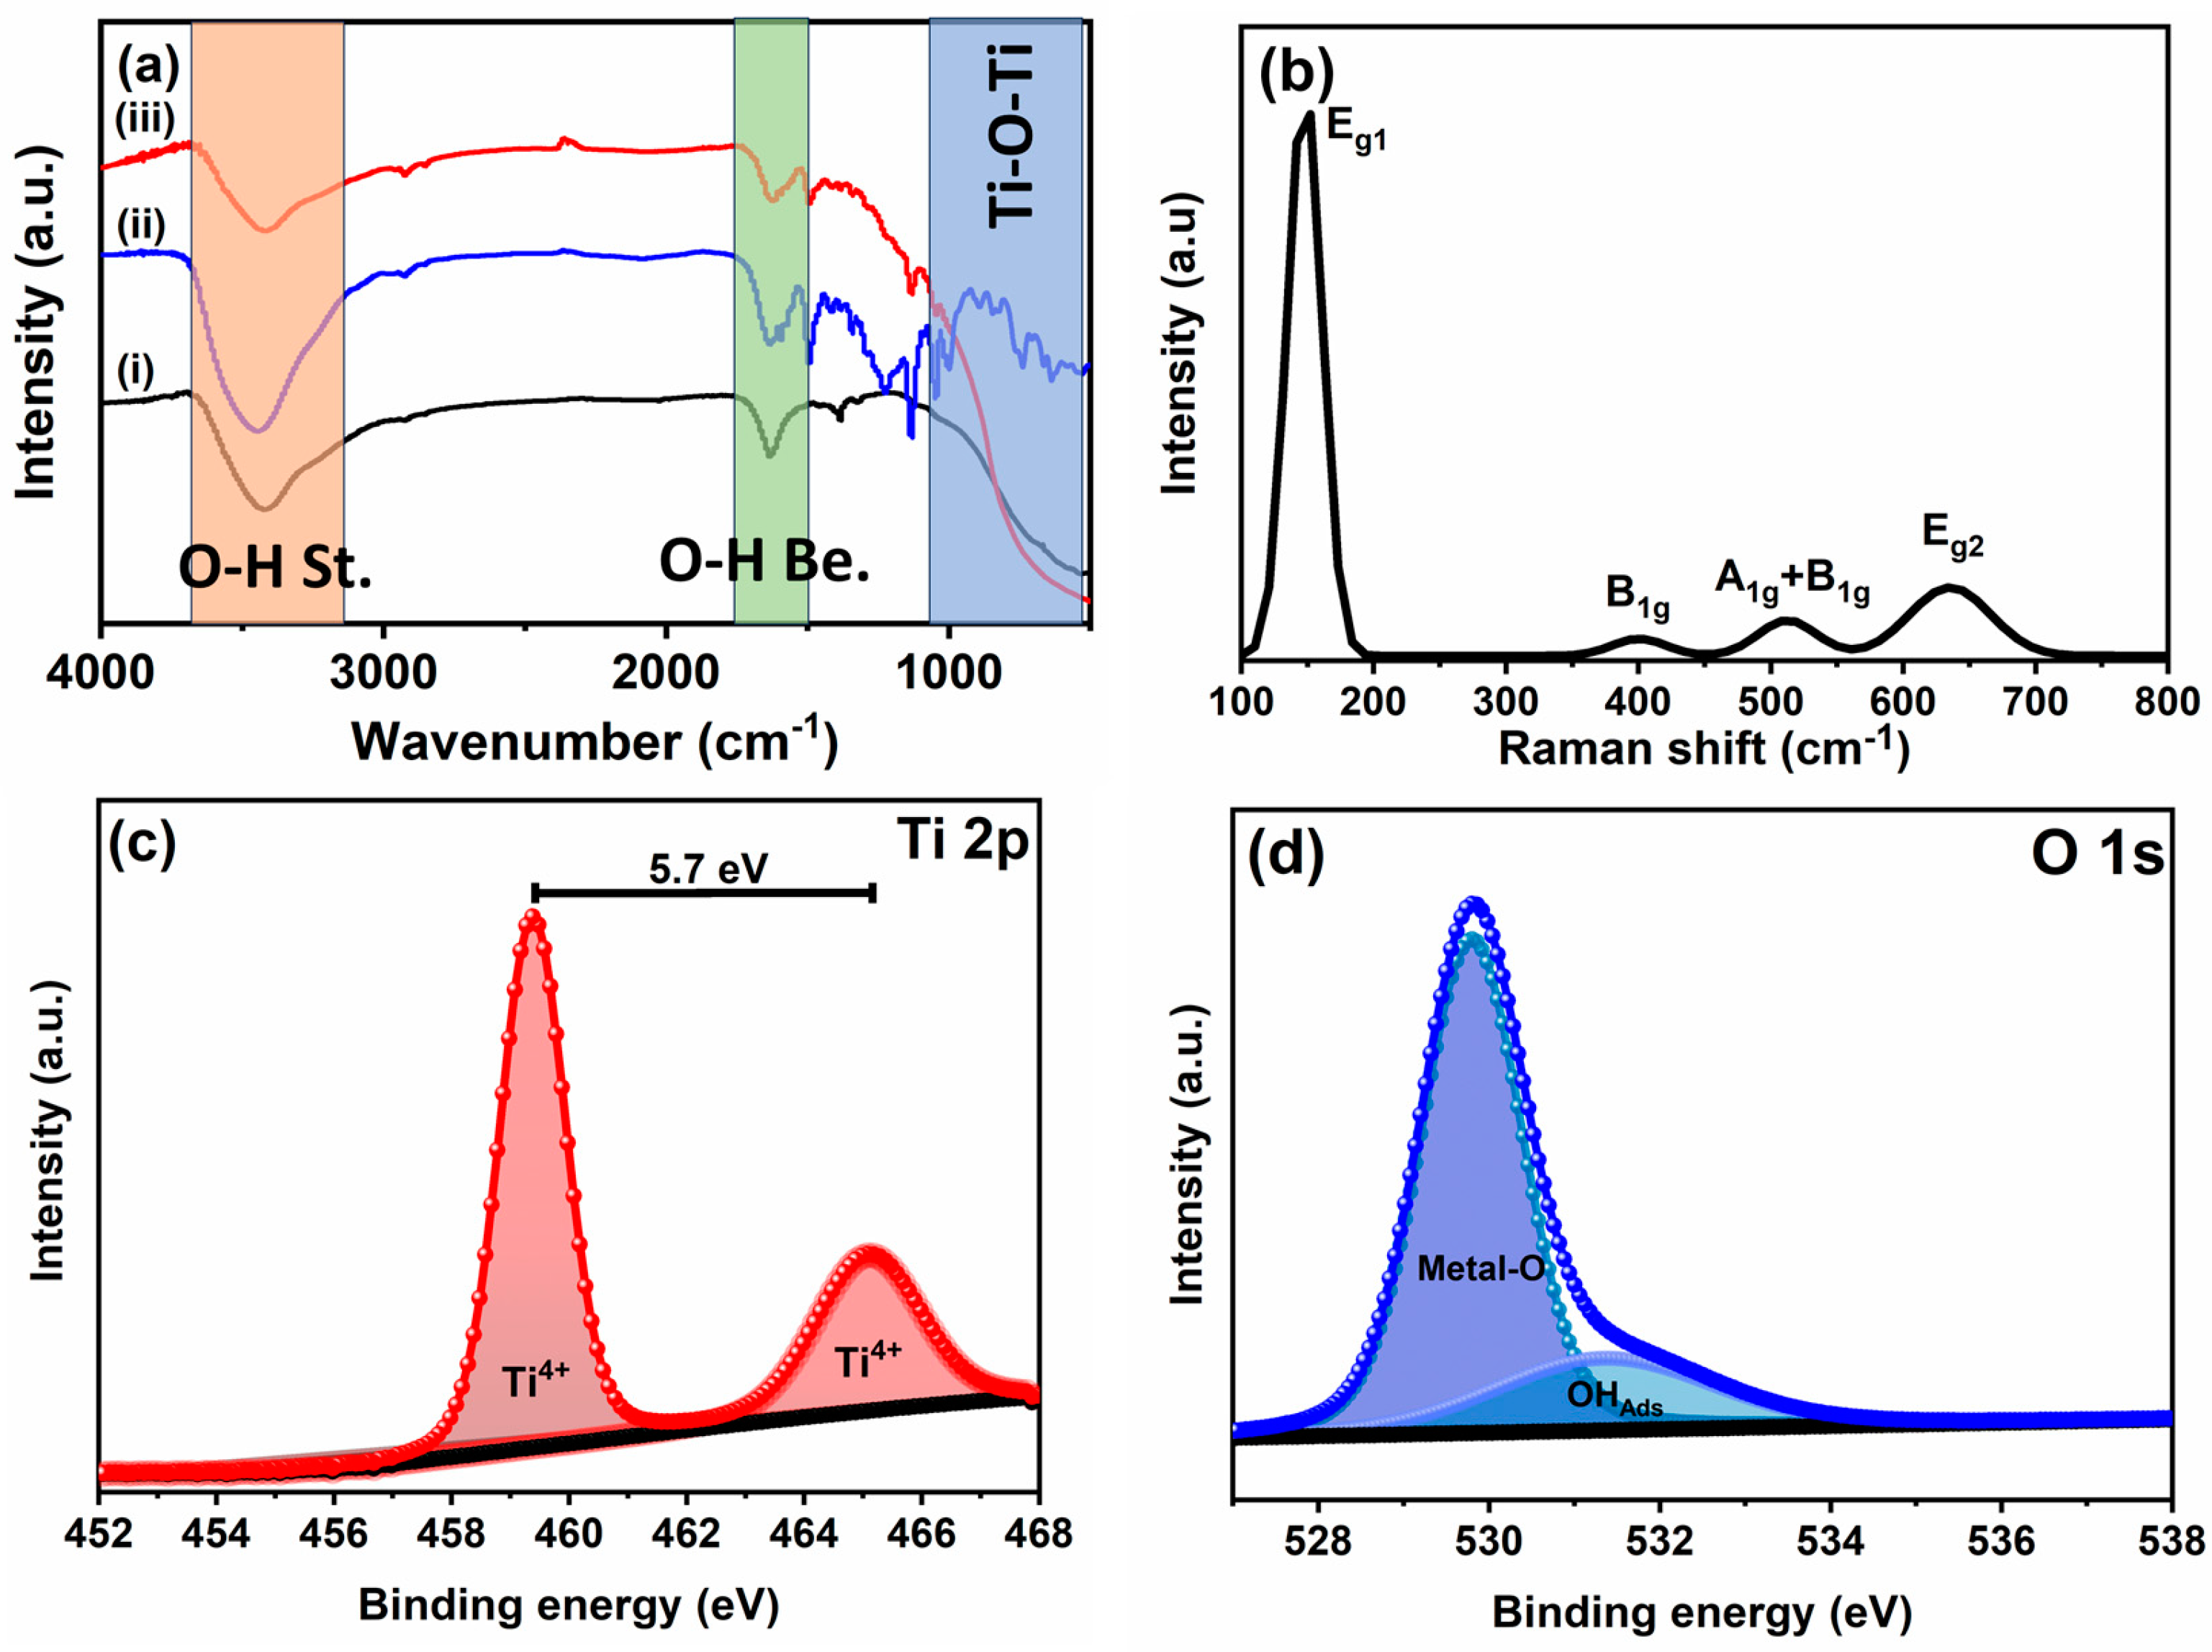
3.1.1. FT-IR, Raman, and XPS Analyses

The structural properties of TiO2 nanoparticles prepared under optimal conditions at 100 °C for 12 h were investigated using FT-IR spectroscopy, as shown in Figure 5a. A broad and intense absorption band between 500 and 900 cm−1 was observed, which is due to the stretching or bending frequencies of (Metal, Ti)–(Oxygen, O)–(Metal, Ti) bonds in TiO2 [21]. Furthermore, the wide peak at 3450 cm−1 was assigned to the stretching modes of surface-absorbed water molecules or surface hydroxyl groups, which is probably due to physically absorbed water [21]. The absorption band observed at 1640 cm−1 corresponds to the bending vibrations of surface hydroxyl groups, in line with the characteristic peaks of O–H bonds on the surface, as reported in the literature [3]. To further verify the structural properties of TiO2, Raman spectroscopy was performed, as displayed in Figure 6. The recorded Raman spectrum of the TiO2 nanoparticles showed four prominent bands characteristic of the anatase phase. These bands were observed at 148, 401, 512, and 636 cm−1 and correspond to the active vibration modes Eg1, B1g, A1g, and Eg2. Each of these bands indicates the different vibrational modes associated with the anatase phase, which further confirms the structure of the synthesized TiO2 nanoparticles. To explore the surface chemistry of TiO2, an XPS analysis was performed (Figure 5c,d), and the data verify the existence of Ti and O elements. The deconvolution of the Ti 2p high-resolution spectrum (Figure 5c) revealed two peaks at 459 eV and 465.7 eV, corresponding to Ti 2p1/2 and Ti 2p3/2, respectively. The orbital splitting value of 5.7 eV is characteristic of Ti4+ in TiO2. Furthermore, the O 1s spectrum revealed a Ti-O peak at 530 and 531.5 eV assigned to the oxygen of the oxide phase and adsorbed hydroxyl group, respectively (Figure 5d) [37,38].

3.1.2. Morphological Studies

The morphology of the tetragonal mesoporous TiO2 nanoparticles produced under optimal conditions was analyzed utilizing FE-SEM and TEM. Figure 6a,b show FE-SEM images of the TiO2 product at low and high magnifications, respectively. These images show that the grain size of the TiO2 largely corresponds to the original particle size and the surface roughness contributes to the formation of spherical and irregularly shaped nanoparticles. The TEM analysis shown in Figure 6c also identified the presence of significantly irregular spherical particles with a narrow size distribution ranging from 3 to 8 nm and conformed by histogram-form TEM as shown in Figure 6e. The EDX examination displayed in Figure 6d confirmed the existence of oxygen (O) and titanium (Ti) in the nanoparticles, with the EDX mapping confirming the homogeneity of Ti and O elements on the surface given in the inset of Figure 6d.

3.1.3. Pore Structure Characterization of Prepared TiO2

For optimal adsorption performance, it is crucial to utilize titanium dioxide that possesses an extensive surface area and a well-suited pore size distribution. Therefore, the pore size characteristics of TiO2 and its BET specific surface area were evaluated using N2 adsorption–desorption isotherms. The comprehensive data are presented in Table 2 and Figure 7. Figure 7a illustrates that the N2 sorption isotherm of TiO2 displays porous characteristics that align with a type IV (a) isotherm at elevated relative pressures, accompanied by a type H1 hysteresis loop within the range of 0.5 < P/P₀ < 1. This indicates the presence of a significant amount of mesopores as well as a small proportion of macropores, as reflected in the corresponding pore size distribution in Figure 7b [39].

3.1.4. Zero-Charge Point (pHpzc) and Isoelectric Point (IEP) Investigation

The pHpzc of the TiO2 nanoparticles was assessed through the pH drift method [3]. The process included the preparation of multiple Erlenmeyer flasks, with each flask containing 25 mL of a 0.01 M NaCl solution serving as a supporting electrolyte. The starting pH of the solutions was modified to fall within a range of 1–10 using 0.1 M NaOH or 0.1 M HCl. Following that, 0.05 g of TiO2 was incorporated into each pH-adjusted solution, and the mixtures were agitated for 48 h at 25 °C. Following the centrifugation of the TiO2 suspensions, the supernatant final pH was documented. A diagram depicting the initial pH (pHinitial) versus the final pH (pHfinal) was generated, as illustrated in Figure 8a. The pHpzc was determined as the point where the pHinitial–pHfinal curve intersects with the line where pHinitial equals pHfinal. The TiO2 adsorbent pHpzc was found to be around 6.1, consistent with previously reported values. Additionally, the zeta potential analyzer was employed to assess the zeta potential (ZP) of the synthesized TiO2 nanostructures to ascertain the isoelectric point pH (IEP) at 25 °C. Zeta potentials were assessed for TiO2 in a series of 0.01 M NaCl solutions across varying pH levels from 1 to 10, adjusted using 0.1 M NaOH or HCl. Figure 8b demonstrates the correlation between zeta potentials and initial pH values. The findings indicate an IEP value of approximately 6 for the synthesized TiO2, aligning with the data documented in the literature [40].

3.2. Adsorption Investigation

The adsorption behavior of the fabricated mesoporous TiO2 was assessed using RB5 as a model dye pollutant. The FT-IR spectra of TiO2 loaded with RB5 provide evidence of the adsorption process [3,41]. Figure 5a illustrates the TiO2 FT-IR spectra prior to adsorption, following the RB5 dye adsorption, and of the RB5 dye alone, respectively. The RB5-adsorbed TiO2 FT-IR spectrum exhibited significant variations when compared to the pristine TiO2 prior to adsorption. The vibrational absorption band at 3450 cm−1, due to the stretching and bending of adsorbed surface water molecules (O-H groups) on the TiO2 nano-adsorbent (Figure 5a), exhibited a shift to a lower frequency of 3445 cm−1 following the adsorption process (Figure 5a). In contrast, the bending vibration of the surface hydroxyl groups, initially observed at 1640 cm−1, exhibited a shift to a higher frequency following adsorption. The widening of the peak at 3445 cm−1 resulted from the stretching vibration of the amino groups (NH2) from the adsorbed dye molecules, thereby confirming the adsorption process. Moreover, the stretching band in the range of 500–700 cm−1 for bare TiO2 exhibited a broader profile following the adsorption process. Additionally, the emergence of new vibration bands at 1130, 1490, and 1020 cm−1 provides further validation of the successful adsorption of RB5 on TiO2.

3.2.1. pH Effect

The RB5 dye, an organic compound characterized by unsaturated bonds and diverse functional groups, exhibits varying degrees of ionization correlated with the pH value. The relationship between the dye and the TiO2 surface is characterized by the features of their structures. To explore the role of pH in the adsorption process, we conducted experiments at various pH levels (from 1.5 to 9) by modifying the pH using 0.1 M NaOH and HCl. A specific quantity of the nano-adsorbent (0.05 g) was employed to adsorb 25 mL of the dye at an initial concentration of 250 mg L−1, with a contact duration of 24 h at 25 °C, as illustrated in Figure 8c. The findings indicated that the adsorption capacity of RB5 dye enhanced as the pH value decreased. The adsorption capacity exhibited a gradual decline as the pH rose from 1.5 to 5, followed by a sharp decrease at pH levels of 6 and above. At pH values below 6.1, which is less than both the pHpzc and the IEP of the TiO2 nano-adsorbent, the surface of the TiO2 nanostructures exhibited a positive charge. The electrostatic attraction enhances the adsorption of the anionic dye RB5, leading to increased adsorption capacities. In contrast, at pH levels exceeding 6.1, the TiO2 nanoparticles developed a negative surface charge, leading to electrostatic repulsion between the dye molecules, which shared the same charge, and the nanoparticle surface. The repulsion negatively impacted the adsorption process, leading to a notable decrease in adsorption capacity. As a result, additional experiments were conducted at pH 1.5 to enhance the adsorption efficiency.

3.2.2. Impact of Ionic Strength

The effluent from drying processes often contains various inorganic salts such as KCl and NaCl, which can reduce the adsorption capacity by competing with dye molecules, during the adsorption process, for the available active sites on TiO2 [41]. To investigate the influence of salt concentration on adsorption performance, we conducted experiments with 250 mg L−1 initial dye concentration at 25 °C with a solution volume of 25 mL, 0.05 g TiO2, and varying KCl concentrations ranging from 0 to 0.5 g in 0.1 g increments. Figure 8d shows that the addition of KCl slightly affected the adsorption performance of TiO2 at low concentrations, with the uptake percentage decreasing with increasing KCl concentration. This observation supports the idea that the majority of the adsorption mechanism originated from electrostatic interactions between the mesoporous TiO2 surface and molecules of the dye [41,42].

3.2.3. Contact Time and Kinetics

The impact of contact time on RB5 dye adsorption was thoroughly investigated at the optimal 1.5 pH, using 0.05 g TiO2, with initial dye concentrations ranging from 100 to 250 mg L−1 at 25 °C. As depicted in Figure 9a, the adsorption capacity surged rapidly during the first 10 min, followed by a slower increase, and finally reached a plateau after 100 min. To assess the contact time impact on the capacity of the adsorption, four initial dye concentrations (100, 150, 200, and 250 mg L−1) were chosen. The equilibrium adsorption capacity was observed to rise with increasing initial concentrations, with a rapid adsorption phase occurring within the first 10 min, followed by a gradual stabilization. This trend can be attributed to the abundance of available active sites at the beginning of adsorption, which decreased as these sites became increasingly occupied.
For better understanding of the adsorption kinetics of RB5 on TiO2, the experimental kinetic data were plotted in two linear kinetic models: the pseudo-first-order (Equation (4)) and pseudo-second-order (Equation (5)) models [43,44].
log ( q e q t ) = logq e k 1 2.303 t
t q t = 1 k 2   q e 2 + t q e
where t represents time of adsorption (min), qt represents capacity of adsorption (mg g−1) of the TiO2 nano-adsorbent at any t time, qe is capacity of equilibrium adsorption (mg g−1) of the TiO2 nano-adsorbent at the equilibrium time, k1 is the rate adsorption constant of the pseudo-first-order adsorption process in min−1, and k2 is the rate constant of the pseudo-second-order adsorption process (g mg−1min−1). The regression coefficient (r2) values from the plot of log ( q e q t ) versus t were 0.33, 0.09, 0.46, and 0.31 for initial dye concentration of 100, 150, 200, and 250 mg L−1, respectively, indicating that the adsorption of RB5 dye on TiO2 does not follow a pseudo-first-order kinetic model.
Furthermore, the adsorption kinetic parameters, including the experimentally determined equilibrium adsorption capacity (qe(exp)), the calculated equilibrium adsorption capacity (qe(cal)), and the pseudo-second-order rate constant (k2), were computed and summarized in Table 3. The close agreement between qe(exp) and qe(cal) demonstrates that the adsorption process follows a pseudo-second-order kinetic model.
The sorption constant h, computed using Equation (6), shows a direct proportionality to the initial dye concentration, increasing rapidly with higher dye amounts, as presented in Table 2.
h = k 2 q e 2
The adsorption mechanism rate-determining step was further analyzed, employing the Weber–Morris equation (Equation (7)) [45].
q t = k i t 0.5 + C
where qt (mg·g−1) represents the amount of the dye adsorbed at time t (min), ki is the intra-particle diffusion constant (mg·g−1·min−0.5), and C reflects boundary layer thickness. The plot of qt versus t0.5 (Figure 9c) reveals segmented linear behavior that does not pass through the origin, as shown in Figure 9c, suggesting that the adsorption mechanism is governed by more than just intra-particle diffusion, with additional factors such as bulk and film diffusion playing significant roles [45].

3.2.4. Adsorption Isotherms

The adsorption isotherm serves as a vital framework for analyzing adsorption behavior and provides insight into the amount of analyte absorbed on an adsorbent under constant temperature conditions [46,47]. The Langmuir and Freundlich isotherms are among the most utilized models for this analysis. In this investigation, the adsorption of RB5 onto TiO2 nanoparticles was examined using both models. The Langmuir model, which postulates monolayer adsorption on a uniform surface without lateral interactions between adsorbed molecules, is expressed by the following equation (Equation (8)):
C e q e = 1 K L q m + C e q m
where qe represents the capacity of equilibrium adsorption (mg g−1), qm represents the maximum adsorption capacity (mg g−1), Ce is the equilibrium concentration of RB5 dye (mg L−1), and KL is the Langmuir constant (L mol−1). Plotting Ce/qe against Ce yielded a linear relationship with a high regression coefficient (r2 = 0.998), as shown in Figure 10a. The intercept and slope were used to compute qm and KL, as tabulated in Table 3. This indicates that the adsorption process aligns well with the Langmuir isotherm, suggesting monolayer coverage of the dye molecules on the TiO2 surface. The favorability of the adsorption can be further assessed by the separation factor (RL), defined as follows [46]:
R L = 1 1 + bC e
with the Langmuir constant (b, L mg−1) and the initial dye concentration (Ce, mg L−1). The RL indicates the adsorption possibility of dye molecules on the nano-adsorbent, whether it is irreversible where RL = 0, favorable where 0 < RL < 1, or linear where RL = 1, or unfavorable where RL > 1 [46].
The Langmuir and Freundlich isotherm constants for RB5 adsorption onto TiO2 nanoparticles are outlined in Table 4. The RL value, calculated at 298 K, was found to be between 0 and 1, indicating that TiO2 nanoparticles are a favorable adsorbent for RB5 dye. On the other hand, the data was checked against the Freundlich isotherm model and we supposed that the adsorption process arises on a heterogeneous surface using the following linear-form equation, Equation (10):
ln q e = ln K F + 1 n   lnC e
In this context, qe and Ce denote the adsorption capacity and equilibrium concentration, respectively, while n is a constant that signifies the adsorption intensity. Additionally, KF is the Freundlich constant, which represents the capacity of adsorption, as illustrated in Figure 10b. The value of n can be classified into three categories: n = 1 for homogeneous adsorption, n > 1 for favorable adsorption, and n < 1 for unfavorable adsorption [47]. The experimental data also fit this model reasonably well, with a regression coefficient of 0.9. The n value, calculated to be 6.79, suggests a favorable adsorption process. Although the Langmuir isotherm is typically used to deduce the maximum adsorption capacity qm, the Freundlich model can also provide an estimate using the following equation (Equation (11)) [48]:
K F = q e C o 1 / n
The maximum adsorption capacity qm assessed utilizing the Freundlich model was 190.53 mg g−1. However, the experimental data perfectly associate with the Langmuir model, as deduced by the higher r2 magnitude and the closer match between the value of qm calculated and the value of experimental qm, confirming that the RB5 dye adsorption onto TiO2 occurs primarily as monolayer coverage.

3.2.5. Thermodynamic Evaluations

The effect of temperature on the adsorption process at equilibrium was studied at 298, 308, 318, and 328 K to explore the underlying energetic changes in the adsorption. This study utilized an approximation of the Langmuir equilibrium parameter (KL), which was converted from units of L/mg to L/mol using Equation (12), to calculate the adsorption equilibrium constant (Kad) and, in turn, determine the thermodynamic parameters [49].
K L ( L mol ) = K L   ( L mg ) × 1000 ( mg g ) × Mwt .   ( g mol )
where the adsorbate molecular weight is represented by Mwt (g/mol) (i.e., RB5 dye). In addition, the unitless constant of the adsorption equilibrium (Kad) was subsequently calculated utilizing Equation (13) [49].
K ad = K L ( L mol ) × C ref ( mol L ) × γ 1
where Cref refers to the molar concentration of the reference state, while γ represents the activity coefficient calculated based on ionic strength. Under the traditional method, the reference concentration of the adsorbate is conventionally set at 1 M (Cref = 1 mol/L). As a result, KL and Kad are numerically the same when Cref = 1 M. However, in certain instances, the pollutant’s water solubility is lower than 1 M, making this reference concentration unsuitable. In such cases, the saturation concentration (CS) is used instead.
For instance, the estimated solubility of Reactive Black 5 dye is approximately 100 g/L (0.1008 mol/L), and in this case, the saturated solution is treated as the reference concentration (Cref = CS, mol/L). In the first method, Kad was calculated using Equation (13), with the activity coefficient (γ) determined using the Davis relation. In the second method, Kad was equated to the dimensionless equilibrium parameter KML from the modified Langmuir isotherm model (i.e., Kad = KML). The revised Langmuir isotherm model is given by Equation (14) [49].
q e = q m K ML C e ( C s C e ) +   K ML C e
where Ce (mg/L) represents the equilibrium concentration of the adsorbate, while CS (mg/L) indicates the concentration of its aqueous saturated solution. The term KML (dimensionless) represents the modified Langmuir constant, which reflects the ratio of the adsorption rate constant (ka) to the desorption rate constant (kd); i.e., KML = ka/kd. The primary difference between KML and KL is that KML is dimensionless, whereas KL is measured in units of L/mg. This makes KML directly applicable to thermodynamic calculations without the need for additional mathematical conversions. As a result, two approaches were employed to determine the thermodynamic parameters. Subsequently, the adsorption Gibbs free energy change (∆G) was computed utilizing Equation (15) [49].
Δ G ° = R g T ln K ad
where T stands for the absolute temperature (in Kelvin), and Rg is the universal gas constant (Rg = 8.314 J/(K·mol)). The adsorption enthalpy change (∆H) was computed utilizing the Van’t Hoff isochore equation, represented by Equation (16).
Δ H = R g ln K ad , T 2 K ad ,   T 1 1 T 2 1 T 1
where Kad,T1 and Kad,T2 are the adsorption equilibrium constants at temperatures T1 and T2. The change in entropy (∆Sad) was calculated using the corresponding thermodynamic equation, Equation (17).
Δ S ad = Δ H ad + Δ G ad T
The thermodynamic parameters calculated from both methods are summarized in Table 5, showing similar results between the approaches. As shown in Table 5, the negative Gibbs free energy values (∆Gad < 0) confirmed the spontaneity (exergonic nature) of the adsorption processes. Additionally, ∆Gad values below −20 kJ/mol suggest a possible ion-exchange mechanism [50].
Furthermore, we determined the adsorption activation energy (Ea) for RB5 dye onto the synthesized mesoporous titania using the Arrhenius equation (modified form) (Equation (14)) based on coverage of the surface (θ) [51]. The sticking probability (S*) is a function of the adsorbate and adsorbent interaction and is temperature-dependent; it can be expressed as
S * = ( 1 θ ) e E a RT
where θ is defined as [1 − (Ce/C0)]. In addition, S* is an adsorbate and adsorbent function and is temperature-dependent, which is in the range of 0 < S* < 1, with Ce and C0 representing the equilibrium and initial concentrations, respectively. Substituting θ into Equation (14) yields
ln ( 1 θ ) = ln S * + E a RT
The activation energy (Ea) can be inferred from the slope of the plot of 1/T (Figure 10e), which indicates the nature of the adsorption process—whether it is physisorptive or chemisorptive. For our system, the calculated Ea value for the adsorption of RB5 dye on the TiO2 nano-adsorbent was found to be 39.07 kJ mol−1, suggesting a physisorptive mechanism [52].

3.2.6. Regeneration of TiO2 Nano-Adsorbent and Its Comparison with Alternative Adsorbents

Regeneration is an important consideration for determining the cost effectiveness of adsorbents in wastewater treatment. Reusing adsorbents significantly reduces costs, and titanium dioxide nanoparticles are particularly advantageous due to their easy separation and regeneration potential. In particular, TiO2 can be recovered by soaking the material in acetone for one hour. As depicted in Figure 10f, the adsorption capacity for TiO2 remains high even after five regeneration cycles for RB5. The morphology of TiO2 before and after was investigated using SEM (Figure 11), confirming the adsorption and recycling processes. In addition, the adsorption capacity (qm) of the synthesized TiO2 adsorbent was evaluated in relation to other adsorbents reported in the literature. The findings are summarized in Table 6. This comparison highlights the effectiveness of the synthesized TiO2 as a promising candidate for RB5 dye removal. Remarkably, the synthesized TiO2 showed a higher qm than other reported adsorbents, highlighting its superior adsorption ability. These results highlight that TiO2 not only exhibits efficient adsorption but also offers easy separation and excellent recyclability, making it well suited for large-scale commercial applications.

3.2.7. Theoretical Calculation Study

The geometry optimization calculations were conducted using CASTEP (version 2017) within Material Studio 2017, continuing until the force on the atomic nuclei fell below 0.03 eV/Å and the energy variation per atom was reduced to below 1 × 10⁻⁵ eV. To verify the computational findings, we compared the optimized lattice parameters of bulk TiO2 with the corresponding experimental data. Our calculations yielded lattice parameters of a = 3.87 Å and b = 9.84 Å, which align well with experimental values [56] and previous theoretical results [57,58]. Building on these experimental observations, we investigated the adsorption mechanism of RB5 dye on the TiO2 (101) surface in an aqueous solution. The characterization of the nanoparticles confirmed that they were single-phase anatase TiO2, with the main XRD peak corresponding to the (101) plane. Accordingly, we simulated the geometry-optimized (101) surface of bulk anatase TiO2 for the pristine surface, as shown in Figure 12a. For the surface structures shown in Figure 13, the TiO2 (101) surface was modeled using a two-layer TiO2 slab with a 2 × 2 supercell and a 15 Å vacuum gap to minimize interactions between adsorbates and adjacent slab surfaces in this periodic setup [58]. The aqueous surface model included the optimized TiO2 (101) surface with an adsorbed H2O molecule, depicted in Figure 12b. Due to computational constraints, we modeled only the active group of the Reactive Black 5 dye to study its interaction with the surface, as shown in Figure 12c.
To achieve a more thorough theoretical insight into the strong attachment of the dye to the TiO2 (101) surface in the presence of an H2O molecule, density functional theory (DFT) calculations were executed to elucidate the fundamental interaction mechanisms. This analysis focused on the structure, charge distribution, and adsorption energy. After optimizing the geometry of the adsorbed active group, the final configuration is presented in Figure 13a. The oxygen atom of the adsorbent, singly bonded to the sulfur atom ([O]-S), is positioned 1.718 Å from the hydrogen atom of the H2O molecule. Concurrently, the H atom from the H2O molecule shifts toward the [O]-S atom, causing the H-O bond to stretch by approximately 0.02 Å and increasing the H-O-H bond angle by 1.2 degrees. This structural distortion indicates a significant interaction between the active group and the aqueous surface. The analysis of the electron charge density difference reveals a notable shift in the electron distribution of the [O]-S atoms towards the H atom of the H2O molecule, elucidating the intense physical bonding between the dye and the surface. Moreover, the adsorption energy (Eads) was calculated using Equation (18), where a more negative Eads signifies stronger, more stable adsorption. The calculated adsorption energy of −0.88 eV corresponds to an exothermic reaction and is consistent with experimental observations.
E ads =   E ( adsorbent / surface ) E surface E adsorbent

4. Conclusions

This study illustrated the formation of mesoporous TiO2 nanoparticles exhibiting a substantial surface area of 379.5 m2/g, indicating significant potential as an adsorbent for the elimination of Reactive Black 5 (RB5) dye from aqueous solutions. The nanoparticles demonstrated a maximal adsorption capacity of 109.7 mg/g. The FT-IR analysis confirmed the adsorption mechanism, revealing a significant pH impact on the adsorption process. The kinetic analysis indicated that the adsorption process adhered to a pseudo-second-order model. Isotherm studies based on the Langmuir model suggested monolayer adsorption. Thermodynamic evaluation demonstrated that the adsorption process was both spontaneous and exothermic, with ΔG° values between −27 and −34 kJ/mol and ΔH° values of about −15 kJ/mol, which points to a physisorption mechanism. The low activation energy of 25.33 kJ/mol further supported this conclusion. The calculations conducted using density functional theory (DFT) offered a deeper understanding of the robust bonding interactions that exist between the dye molecules and the TiO2 surface. The TiO2 nano-adsorbent showed excellent regeneration performance and maintained high adsorption efficiency over multiple cycles. The findings highlight the remarkable efficiency and reusability of the synthesized TiO2 nanoparticles, making them promising candidates for large-scale wastewater treatment applications.

Author Contributions

Conceptualization, M.Y.N.; Methodology, M.M.T. and S.T.; Software, S.T.; Validation, M.Y.N., M.M.T. and E.M.M.; Investigation, M.Y.N. and M.M.T.; Visualization, M.M.T. and S.T.; Project administration, M.Y.N.; Writing—original draft, M.M.T.; Writing—review & editing, M.Y.N., M.M.T., E.M.M., M.S.S.A. and A.K.; Supervision, M.Y.N. All authors have read and agreed to the published version of the manuscript.

Funding

This research was funded by the Deputyship for Research and Innovation, Ministry of Education in Saudi Arabia (project number INST228).

Data Availability Statement

The original contributions presented in the study are included in the article; further inquiries can be directed to the corresponding authors.

Acknowledgments

The authors extend their appreciation to the Deputyship for Research and Innovation, Ministry of Education in Saudi Arabia, for funding this research work through the project number INST228.

Conflicts of Interest

The authors declare no conflicts of interest.

References

  1. Ciğeroğlu, Z.; El Messaoudi, N.; Şenol, Z.M.; Başkan, G.; Georgin, J.; Gubernat, S. Clay-based nanomaterials and their adsorptive removal efficiency for dyes and antibiotics: A review. Mater. Today Sustain. 2024, 26, 100735. [Google Scholar] [CrossRef]
  2. Cavalcante, L.C.; de Carvalho, K.Q.; Bassetti, F.J.; Coral, L.A.A. Kinetic, isothermal and thermodynamic studies of Reactive Black 5 removal using rice husk ashes and powdered activated carbon. Desalination Water Treat. 2024, 320, 100606. [Google Scholar] [CrossRef]
  3. Nassar, M.Y.; Moustafa, M.M.; Taha, M.M. Hydrothermal tuning of the morphology and particle size of hydrozincite nanoparticles using different counterions to produce nanosized ZnO as an efficient adsorbent for textile dye removal. RSC Adv. 2016, 6, 42180–42195. [Google Scholar] [CrossRef]
  4. Radjenović, J.; Petrović, M.; Ventura, F.; Barceló, D. Rejection of pharmaceuticals in nanofiltration and reverse osmosis membrane drinking water treatment. Water Res. 2008, 42, 3601–3610. [Google Scholar] [CrossRef]
  5. Prabhakar, N.; Isloor, A.M.; Padaki, M.; Ismail, A.F. Fabrication of TiO2@ZIF-67 metal organic framework composite incorporated PVDF membranes for the removal of hazardous reactive black 5 and Congo red dyes from contaminated water. Chem. Eng. J. 2024, 498, 155270. [Google Scholar] [CrossRef]
  6. Matlock, M.M.; Howerton, B.S.; Atwood, D.A. Chemical precipitation of heavy metals from acid mine drainage. Water Res. 2002, 36, 4757–4764. [Google Scholar] [CrossRef]
  7. Sadri Moghaddam, S.; Alavi Moghaddam, M.R.; Arami, M. Coagulation/flocculation process for dye removal using sludge from water treatment plant: Optimization through response surface methodology. J. Hazard. Mater. 2010, 175, 651–657. [Google Scholar] [CrossRef]
  8. Ajao, V.; Nam, K.; Chatzopoulos, P.; Spruijt, E.; Bruning, H.; Rijnaarts, H.; Temmink, H. Regeneration and reuse of microbial extracellular polymers immobilised on a bed column for heavy metal recovery. Water Res. 2020, 171, 115472. [Google Scholar] [CrossRef]
  9. Uğan, M.; Onac, C.; Kaya, A.; Köseoğlu, D.; Akdoğan, A. Removal of Reactive Red 195 dye from textile industry wastewater with Deep Eutectic Solvent-based green extraction. J. Mol. Liq. 2024, 398, 124249. [Google Scholar] [CrossRef]
  10. Bazarin, G.; Módenes, A.N.; Espinoza-Quiñones, F.R.; Borba, C.E.; Trigueros, D.E.G.; Dall’Oglio, I.C. High removal performance of reactive blue 5G dye from industrial dyeing wastewater using biochar in a fixed-bed adsorption system: Approaches and insights based on modeling, isotherms, and thermodynamics study. J. Environ. Chem. Eng. 2024, 12, 111761. [Google Scholar] [CrossRef]
  11. Mustafa, G.; Munir, R.; Sadia, B.; Younas, F.; Sayed, M.; Muneer, A.; Sardar, M.F.; Albashe, G.; Noreen, S. Synthesis of polymeric ferrite composites (Ni-CoFe2O4/Chitosan, Zn-NiFe2O4/Starch, Co-NiZnFe2O4/Polyaniline, Ni doped CrZnFe2O4/Alginate, and Cr doped ZnCoFe2O4/PVA) for the removal of reactive golden yellow-160 dye from wastewater. J. Environ. Chem. Eng. 2024, 12, 112581. [Google Scholar] [CrossRef]
  12. Wang, L.; Yu, Y.; Hu, H.; Xie, B.; Du, Y.; Zhu, Q. Quaternized hollow TiO2-enhanced the dye adsorption capacity and photogenerated carrier separation for efficient reactive dye removal. Appl. Surf. Sci. 2024, 644, 158764. [Google Scholar] [CrossRef]
  13. Abdulhameed, A.S.; Wu, R.; Musa, S.A.; Agha, H.M.; ALOthman, Z.A.; Jawad, A.H.; Algburi, S. Bisphenol-A-diglycidyl ether modified chitosan/nano-SiO2 via hydrothermal process: A statistical modeling and adsorption mechanism for reactive orange 16 dye removal. Int. J. Biol. Macromol. 2024, 256, 128267. [Google Scholar] [CrossRef] [PubMed]
  14. Chaabane, L.; Beyou, E.; El Ghali, A.; Baouab, M.H.V. Comparative studies on the adsorption of metal ions from aqueous solutions using various functionalized graphene oxide sheets as supported adsorbents. J. Hazard. Mater. 2020, 389, 121839. [Google Scholar] [CrossRef] [PubMed]
  15. Abbas, W.A.; Ramadan, M.; Faid, A.Y.; Abdellah, A.M.; Ouf, A.; Moustafa, N.; Allam, N.K. Photoactive catalysts for effective water microbial purification: Morphology-activity relationship. Environ. Nanotechnol. Monit. Manag. 2018, 10, 87–93. [Google Scholar] [CrossRef]
  16. Asemi, M.; Ghanaatshoar, M. Hydrothermal growth of one-dimensional Ce-doped TiO2 nanostructures for solid-state DSSCs comprising Mg-doped CuCrO2. J. Mater. Sci. 2017, 52, 489–503. [Google Scholar] [CrossRef]
  17. Chen, Q.; Zhou, M.; Zhang, Z.; Tang, T.; Wang, T. Preparation of TiO2 nanotubes/reduced graphene oxide binary nanocomposites enhanced photocatalytic properties. J. Mater. Sci. Mater. Electron. 2017, 28, 9416–9422. [Google Scholar] [CrossRef]
  18. Amiri, R.; Bourezgui, A.; Djeridi, W.; Dappozze, F.; Houas, A.; Guillard, C.; Elsellami, L. Surface modification of TiO2 with a less expensive metal (iron) to exploit solar energy in photocatalysis: An ecological and economical solution. Int. J. Hydrogen Energy 2024, 51, 638–647. [Google Scholar] [CrossRef]
  19. Trommetter, G.; Mendret, J.; Khaska, S.; La Salle, C.; Brosillon, S.; Goetz, V.; Plantard, G. Removal efficiencies for 52 pesticides and pharmaceuticals from wastewater effluent by coupling solar heterogeneous photo-oxidation with TiO2 and infiltration in saturated soil column. Sci. Total Environ. 2024, 956, 177278. [Google Scholar] [CrossRef]
  20. Chen, Z.; Zhuo, H.; Hu, Y.; Zhong, L.; Peng, X.; Jing, S.; Liu, Q.; Zhang, X.; Liu, C.; Sun, R. Self-Biotemplate Preparation of Hierarchical Porous Carbon with Rational Mesopore Ratio and High Oxygen Content for an Ultrahigh Energy-Density Supercapacitor. ACS Sustain. Chem. Eng. 2018, 6, 7138–7150. [Google Scholar] [CrossRef]
  21. Nassar, M.Y.; Ali, E.I.; Zakaria, E.S. Tunable auto-combustion preparation of TiO2 nanostructures as efficient adsorbents for the removal of an anionic textile dye. RSC Adv. 2017, 7, 8034–8050. [Google Scholar] [CrossRef]
  22. Pradhan, S.K.; Reucroft, P.J.; Yang, F.; Dozier, A. Growth of TiO2 nanorods by metalorganic chemical vapor deposition. J. Cryst. Growth 2003, 256, 83–88. [Google Scholar] [CrossRef]
  23. Naghibi, S.; Faghihi Sani, M.A.; Madaah Hosseini, H.R. Application of the statistical Taguchi method to optimize TiO2 nanoparticles synthesis by the hydrothermal assisted sol-gel technique. Ceram. Int. 2014, 40, 4193–4201. [Google Scholar] [CrossRef]
  24. Hakki, H.K.; Allahyari, S.; Rahemi, N.; Tasbihi, M. Surface properties, adherence, and photocatalytic activity of sol–gel dip-coated TiO2–ZnO films on glass plates. Comptes Rendus Chim. 2019, 22, 393–405. [Google Scholar] [CrossRef]
  25. Nassar, M.Y.; Abdallah, S. Facile controllable hydrothermal route for a porous CoMn2O4 nanostructure: Synthesis, characterization, and textile dye removal from aqueous media. RSC Adv. 2016, 6, 84050–84067. [Google Scholar] [CrossRef]
  26. Nassar, M.Y.; Ahmed, I.S.; Hendy, H.S. A facile one-pot hydrothermal synthesis of hematite (α-Fe2O3) nanostructures and cephalexin antibiotic sorptive removal from polluted aqueous media. J. Mol. Liq. 2018, 271, 844–856. [Google Scholar] [CrossRef]
  27. Refat, N.M.; Nassar, M.Y.; Sadeek, S.A. A controllable one-pot hydrothermal synthesis of spherical cobalt ferrite nanoparticles: Synthesis, characterization, and optical properties. RSC Adv. 2022, 12, 25081–25095. [Google Scholar] [CrossRef]
  28. Fan, Y.; Lu, H.-T.; Liu, J.-H.; Yang, C.-P.; Jing, Q.-S.; Zhang, Y.-X.; Yang, X.-K.; Huang, K.-J. Hydrothermal preparation and electrochemical sensing properties of TiO2-graphene nanocomposite. Colloids Surfaces B Biointerfaces 2011, 83, 78–82. [Google Scholar] [CrossRef]
  29. Nagaraju, G.; Ebeling, G.; Gonçalves, R.V.; Teixeira, S.R.; Weibel, D.E.; Dupont, J. Controlled growth of TiO2 and TiO2–RGO composite nanoparticles in ionic liquids for enhanced photocatalytic H2 generation. J. Mol. Catal. A Chem. 2013, 378, 213–220. [Google Scholar] [CrossRef]
  30. Ferreira, L.G.; Marques, M.; Teles, L.K. An approximation to density functional theory for an accurate calculation of band-gaps of semiconductors. Phys. Rev. B 2008, 78, 125116. [Google Scholar] [CrossRef]
  31. Perdew, J.P.; Wang, Y. Accnrate and simple analytic representation of the electron-gas correlation energy. Phys. Rev. B 1992, 45, 13244–13249. [Google Scholar] [CrossRef] [PubMed]
  32. Vanderbilt, D. Soft self-consistent pseudopotentials in a generalized eigenvalue formalism. Phys. Rev. B 1990, 41, 7892–7895. [Google Scholar] [CrossRef] [PubMed]
  33. Pfrommer, B.G.; Côté, M.; Louie, S.G.; Cohen, M.L. Relaxation of Crystals with the Quasi-Newton Method. J. Comput. Phys. 1997, 131, 233–240. [Google Scholar] [CrossRef]
  34. Delley, B. Hardness conserving semilocal pseudopotentials. Phys. Rev. B–Condens. Matter Mater. Phys. 2002, 66, 155125. [Google Scholar] [CrossRef]
  35. Tolba, S.A.; Gameel, K.M.; Ali, B.A.; Almossalami, H.A.; Allam, N.K. The DFT+U: Approaches, Accuracy, and Applications. In Density Functional Calculations-Recent Progresses of Theory and Application; IntechOpen: London, UK, 2018; pp. 3–30. [Google Scholar] [CrossRef]
  36. Kinsinger, N.M.; Wong, A.; Li, D.; Villalobos, F.; Kisailus, D. Nucleation and Crystal Growth of Nanocrystalline Anatase and Rutile Phase TiO2 from a Water-Soluble Precursor. Cryst. Growth Des. 2010, 10, 5254–5261. [Google Scholar] [CrossRef]
  37. Dahiya, S.; Shoran, S.; Sharma, D.; Rao, V.; Chaudhary, S.; Nehra, S.; Sharma, A. Bioengineered sustainable phytofabrication of anatase TiO2 -adorned g-C3N4 nanocomposites and unveiling their photocatalytic potential towards advanced environmental remediation. Chemosphere 2024, 362, 142456. [Google Scholar] [CrossRef]
  38. Qahtan, T.F.; Owolabi, T.O.; Saleh, T.A. X-ray photoelectron spectroscopy of surface-treated TiO2 mesoporous film by 500 eV argon ion beam. J. Mol. Liq. 2024, 393, 123556. [Google Scholar] [CrossRef]
  39. Carrott, P.J.M.; Roberts, R.A.; Sing, K.S.W. Adsorption of nitrogen by porous and non-porous carbons. Carbon. N. Y 1987, 25, 59–68. [Google Scholar] [CrossRef]
  40. Kosmulski, M. pH-dependent surface charging and points of zero charge. IV. Update and new approach. J. Colloid. Interface Sci. 2009, 337, 439–448. [Google Scholar] [CrossRef]
  41. Nassar, M.Y.; Amin, A.S.; Ahmed, I.S.; Abdallah, S. Sphere-like Mn2O3 nanoparticles: Facile hydrothermal synthesis and adsorption properties. J. Taiwan. Inst. Chem. Eng. 2016, 64, 79–88. [Google Scholar] [CrossRef]
  42. Al-Degs, Y.S.; El-Barghouthi, M.I.; El-Sheikh, A.H.; Walker, G.M. Effect of solution pH, ionic strength, and temperature on adsorption behavior of reactive dyes on activated carbon. Dyes Pigments 2008, 77, 16–23. [Google Scholar] [CrossRef]
  43. Ho, Y.S.; McKay, G. A Comparison of Chemisorption Kinetic Models Applied to Pollutant Removal on Various Sorbents. Process Saf. Environ. Prot. 1998, 76, 332–340. [Google Scholar] [CrossRef]
  44. Ho, Y.S.; McKay, G. Pseudo-second order model for sorption processes. Process Biochem. 1999, 34, 451–465. [Google Scholar] [CrossRef]
  45. Weber, W.J.; Morris, J.C. Proceedings of the International Conference on Water Pollution Symposium; Pergamon Press: Oxford, UK, 1962. [Google Scholar]
  46. Langmuir, I. The adsorption of gases on plane surfaces of glass, mica and platinum. J. Am. Chem. Soc. 1918, 40, 1361–1403. [Google Scholar] [CrossRef]
  47. Freundlich, H. Über die Adsorption in Lösungen. Z. Phys. Chem. De Gruyter 1907, 57, 385–470. [Google Scholar] [CrossRef]
  48. Halsey, G.D. The Role of Surface Heterogeneity in Adsorption. In Advances in Catalysis; Frankenburg, W.G., Komarewsky, V.I., Rideal, E.K., Eds.; Academic Press: Cambridge, MA, USA, 1952; Volume 4, pp. 259–269. [Google Scholar]
  49. Enache, A.-C.; Predeanu, G.; Cojocaru, C.; Samoila, P.; Ciornea, V.; Apolzan, R.; Harabagiu, V. Adsorption of Brilliant Green Dye onto a Mercerized Biosorbent: Kinetic, Thermodynamic, and Molecular Docking Studies. Molecules 2023, 28, 4129. [Google Scholar] [CrossRef]
  50. Ghaedi, M.; Jah, A.H.; Khodadoust, S.; Sahraei, R.; Daneshfar, A.; Mihandoost, A.; Purkait, M.K. Cadmium telluride nanoparticles loaded on activated carbon as adsorbent for removal of sunset yellow. Spectrochim. Acta Part A Mol. Biomol. Spectrosc. 2012, 90, 22–27. [Google Scholar] [CrossRef]
  51. Tran, H.N.; You, S.-J.; Hosseini-Bandegharaei, A.; Chao, H.-P. Mistakes and inconsistencies regarding adsorption of contaminants from aqueous solutions: A critical review. Water Res. 2017, 120, 88–116. [Google Scholar] [CrossRef]
  52. Ma, J.; Jia, Y.; Jing, Y.; Yao, Y.; Sun, J. Kinetics and thermodynamics of methylene blue adsorption by cobalt-hectorite composite. Dyes Pigments 2012, 93, 1441–1446. [Google Scholar] [CrossRef]
  53. Cardoso, N.F.; Pinto, R.B.; Lima, E.C.; Calvete, T.; Amavisca, C.V.; Royer, B.; Cunha, M.L.; Fernandes, T.H.; Pinto, I.S. Removal of remazol black B textile dye from aqueous solution by adsorption. Desalination 2011, 269, 92–103. [Google Scholar] [CrossRef]
  54. Khosravi, M.; Azizian, S. Synthesis of Fe3O4 flower-like hierarchical nanostructures with high adsorption performance toward dye molecules. Colloids Surfaces A Physicochem. Eng. Asp. 2015, 482, 438–446. [Google Scholar] [CrossRef]
  55. González, J.A.; Villanueva, M.E.; Piehl, L.L.; Copello, G.J. Development of a chitin/graphene oxide hybrid composite for the removal of pollutant dyes: Adsorption and desorption study. Chem. Eng. J. 2015, 280, 41–48. [Google Scholar] [CrossRef]
  56. Yamamoto, T.; Ohno, T. A hybrid density functional study on the electron and hole trap states in anatase titanium dioxide. Phys. Chem. Chem. Phys. 2012, 14, 589–598. [Google Scholar] [CrossRef] [PubMed]
  57. Deák, P.; Aradi, B.; Frauenheim, T. Polaronic effects in TiO2 calculated by the HSE06 hybrid functional: Dopant passivation by carrier self-trapping. Phys Rev B–Condens Matter Mater Phys 2011, 83, 155207. [Google Scholar] [CrossRef]
  58. Deák, P.; Aradi, B.; Frauenheim, T. Oxygen deficiency in TiO2: Similarities and differences between the Ti self-interstitial and the O vacancy in bulk rutile and anatase. Phys. Rev. B–Condens. Matter Mater. Phys. 2015, 92, 045204. [Google Scholar] [CrossRef]
Figure 1. Schematic diagram of stepwise preparation process of TiO2.
Processes 12 02786 g001
Figure 2. XRD patterns of the fabricated TiO2 nanoparticles at various temperatures, (a) 100 °C, (b) 120 °C, (c) 160 °C, (d) 180 °C, (e) 200 °C, and (f) 230 °C, over a duration of 24 h.
Processes 12 02786 g002
Figure 3. XRD patterns of fabricated TiO2 nanoparticles at 100 °C under hydrothermal time process for (a) 10, (b) 12, (c) 18, (d) 20, and (e) 24 h.
Processes 12 02786 g003
Figure 4. XRD patterns of the fabricated TiO2 nanoparticles at 100 °C during a 12 h hydrothermal process with varying concentrations of the titanium precursor: (a) 0.165 mol, (b) 0.33 mol, and (c) 0.49 mol.
Processes 12 02786 g004
Figure 5. (a) FT-IR spectra of the fabricated mesoporous TiO2 (i), TiO2 loaded with RB5 (ii), and RB5 dye (iii); (b) Raman spectrum; (c) XPS spectrum of Ti 2p; and (d) XPS spectrum of O 1s of mesoporous TiO2 nanoparticles.
Processes 12 02786 g005
Figure 6. The SEM images, (a) high magnification and (b) low magnification; (c) HR-TEM image; (d) EDX spectrum; and (e) histogram from TEM of synthesized TiO2.
Processes 12 02786 g006
Figure 7. The N2-adsorption–desorption isotherm at 77 K (a) and DFT pore size distribution (b).
Processes 12 02786 g007
Figure 8. (a) Zeta potential as pH function for calculation of IEP, (b) plot of initial pH versus final pH, (c) effects of pH, and (d) effect of ionic strength of adsorption on mesoporous TiO2.
Processes 12 02786 g008
Figure 9. (a) Impact of contact time, (b) fitting of the adsorption data to the pseudo-second-order kinetic model, (c) and the Weber–Morris model for the adsorption of RB5 dye onto TiO2 nanoparticles.
Processes 12 02786 g009
Figure 10. (a) Langmuir isotherm plots, (b) Freundlich isotherm plots, (c) effect of temperature on adsorption capacity, (d) ln Kc versus 1/T plots, (e) ln(1 − θ) versus 1/T plots for adsorption, and (f) regeneration efficiency of TiO2 adsorbent in removal of RB5 dye.
Processes 12 02786 g010
Figure 11. FE-SEM images of (a) the pristine TiO2 nanostructure before adsorption and (b) after adsorption, and (c) post-regeneration for RB5 dye.
Processes 12 02786 g011
Figure 12. Structures of (a) TiO2 (101) and (b) H2O/TiO2 (101) surfaces, and (c) SO32− active group.
Processes 12 02786 g012
Figure 13. (a) The lowest-energy structure of the SO32− adsorbed. (b) The blue zones represent locations of electron density.
Processes 12 02786 g013
Table 1. Composition and structural details of RB5 dye.
Dye Reactive Black 5 (RB5)
Processes 12 02786 i001
Molecular formula C26H21N5Na4O19S6
Molecular weight 991.82
λmax598 nm
Type Anionic dye
Chemical class Azo derivative compound
Solubility Water-soluble
C.I. number Remazol Black B
Table 2. Textural properties of TiO2 sample.
SBET 
m2 g−1
Smeso
m2 g−1
Smacro
m2 g−1
Smicro/SmesoVtot.
cm3 g−1
Vmacro
cm3 g−1
Vmeso
cm3 g−1
Vavar.
nm
Pore Size, nm
BJHDFT
379.5335.743.80.260.620.130.4913.7321.6731.68
Table 3. Pseudo-second-order kinetic parameters for RB5 dye adsorption onto TiO2 adsorbent at varying initial dye concentrations (C0).
Pseudo-Second-Order Model for RB5
C0 [mg L−1]K2 [g mg−1min−1]qe(cal) [mg g−1]r12h [g mg−1min−1]qe(exp) [mg g−1]
1000.000449.750.99928,042.5249.92
1500.0002366.290.9866.0164.62
2000.0001485.710.99829.9784.15
2508.3 × 10−5110.090.9948.71109.54
Table 4. Isotherm parameters (Langmuir and Freundlich) for RB5 adsorption onto TiO2 nanoparticles.
Adsorption Model IsothermParametersValue
LangmuirKL (L mol−1)6.18 × 10⁻³
qm(cal) (mg g−1)109.7
r120.999
RL0.246
qe(exp) (mg g−1)109.5
FreundlichKF [(mg g−1).(L mg−1)1/n]51.46
qm(cal) (mg g−1)190.53
r220.905
qe,(exp) (mg g−1)109.5
n6.79
Table 5. Thermodynamic constants for adsorption of RB5 onto TiO2 adsorbent using two approaches.
Approach Temperature (K)Kad∆Gad
kJ mol−1
∆Sad
[J mol−1 K−1]
∆Had
[kJ mol−1]
Ea
[kJ mol−1]
S*
K ad = K L × C S × γ 1 2987.57 × 104−27.83451.464−12.50325.3355 × 10−3
3084.82 × 104−27.61249.073
3184.95 × 104−28.579350.570
3283.12 × 104−28.21947.931
K ad = K ML 2983.89 × 105−31.8965.075−12.49425.3355 × 10−3
308 3.25 × 10⁵−32.5062.687
3182.92 × 105−33.2864.174
3282.80 × 105−34.2061.536
where γ = 0.518.
Table 6. Comparative analysis of maximum adsorption capacities of diverse adsorbents for RB5 dye removal.
Adsorbent MaterialMaximum Adsorption Capacity,
qm (mg g−1)
Reference
Mn2O314.6[41]
Activated carbon22.5[53]
AC/PW (natural form of AC) 78.5[53]
Fe3O488.4[54]
Chitin 92[55]
TiO2109.7This work
Disclaimer/Publisher’s Note: The statements, opinions and data contained in all publications are solely those of the individual author(s) and contributor(s) and not of MDPI and/or the editor(s). MDPI and/or the editor(s) disclaim responsibility for any injury to people or property resulting from any ideas, methods, instructions or products referred to in the content.

