Article

Design of CO2 Huff-n-Puff Parameters for Fractured Tight Oil Reservoirs Considering Geomechanical Effects

1
School of Petroleum Engineering, Yangtze University, Wuhan 430100, China
2
Hubei Key Laboratory of Oil and Gas Drilling and Production Engineering, Yangtze University, Wuhan 430100, China
3
School of Petroleum Engineering, National Engineering Research Center for Oil & Gas Drilling and Completion Technology, Yangtze University, Wuhan 430100, China
4
Leicester International Institute, Dalian University of Technology, Dalian 116000, China
*
Author to whom correspondence should be addressed.
Processes 2024, 12(12), 2777; https://doi.org/10.3390/pr12122777
Submission received: 11 November 2024 / Revised: 2 December 2024 / Accepted: 4 December 2024 / Published: 6 December 2024
(This article belongs to the Section Energy Systems)

Abstract

:
CO2-Huff-n-Puff (CO2-HnP) is an effective method for improving oil recovery in conventional reservoirs and has been widely applied to tight oil reservoirs. Recently, there has been a series of studies published on the oil increase mechanism and huff-n-puff parameter optimization of CO2-HnP. However, the understanding of the influence of fracture characterization, threshold pressure gradient (TPG), and geomechanical effects on CO2-HnP in fractured tight oil reservoirs is still limited. In this paper, a numerical model based on the embedded discrete fracture model (EDFM) was constructed to investigate the impact of TPG and geomechanical effects on cumulative oil production (COP). The effects of various huff-n-puff parameters, including bottomhole pressure, oil recovery rate, total CO2 injection amount, number of huff-n-puff cycles, timing of production transfer injection, production time, injection time, CO2 injection rate, and soaking time on the COP and oil replacement ratio were also explored in the paper. The results include the following: (1) The TPG and geomechanical effects led to significantly reduced COP. (2) A positive correlation with COP was found for parameters such as timing of production transfer injection and production time, while negative correlations were found for cycles, soaking time, and injection rate. For oil replacement ratio, soaking time and injection rate were positively correlated, while CO2 injection amount and number of cycles showed negative correlation. (3) With a constant injection volume, it is crucial to avoid an excessive number of cycles that reduce COP. On the basis of this parameter optimization, the oil replacement ratio can be enhanced by advancing the production transfer injection, shortening the injection time, and extending the soaking time. The findings can help optimize CO2-HnP strategies to improve oil recovery and economic benefits from the reservoir. This paper provides an effective numerical simulation method for CO2-HnP in fractured tight oil reservoirs, which has certain reference value.

1. Introduction

In recent years, fractured tight oil reservoirs have been regarded as an important part of unconventional oil and gas resources due to their vast potential and extensive geographical distribution. However, the exploitation efficiency of these reservoirs is generally low, with the average recovery of natural depletion development worldwide being only between 3% and 10% [1,2,3]. Because tight reservoirs have nanometer pore-throat characteristics, it is difficult to solve the problems of high pressure in water injection for conventional water flooding development; therefore, the huff-n-puff pattern has been intensively studied [4,5,6]. Among the various possible injection media, CO2 has attracted widespread attention at home and abroad due to its proven oil displacement effects in conventional reservoirs. After years of research and development, it is widely believed that CO2-HnP technology has significant potential in improving the recovery rate of fractured tight oil reservoirs. The CO2 injection process not only effectively reduces the viscosity of crude oil and improves its flowability, but also enhances the mobility and displacement efficiency of oil and gas by dissolving and diffusing with the crude oil in the reservoir. This breakthrough overcomes the bottleneck of traditional development methods in fractured tight reservoirs, significantly improving the recovery rate [7,8,9,10].
Recently, there has been a series of studies on the oil enhancement mechanism of CO2-HnP and the optimization of huff-n-puff parameters, but there is less research on numerical simulation models that combine the geological characteristics of fractured tight oil reservoirs. In fractured tight reservoirs, due to the extremely tight matrix itself and the application of artificial fracturing technology, the fracture network is widely developed, forming complex and diverse flow units in the numerical simulation model, including matrix–matrix, artificial fracture–matrix, natural fracture–matrix, etc. [11]. There are various simulation methods to characterize the distribution of this complex porous medium. Traditional fracture network simulation methods include dual-medium models (DPDP) and discrete fracture models (DFMs) [12,13]. The DPDP simplifies the problem by treating the fracture network as a continuous medium with dual permeability [14,15]. DFMs capture the actual geometry of the fracture using unstructured grids and consider the impact of each individual fracture on the flow. However, both of these methods have their own limitations. The DPDP fracture network description is overly simplistic, neglecting the flow within the matrix and the flow between fractures at various scales, which results in lower prediction accuracy when applied in fractured tight oil reservoirs; DFMs are able to accurately describe the flow relationships between fractures, matrix, and matrix, but they generate a large number of nodes and elements due to the discretization of fractures, making such models difficult to apply in macroscopic reservoir simulations. EDFM combines the advantages of DPDP and DFMs [16,17,18]. In simulating fractured tight oil reservoirs, EDFM moderately simplifies the fracture on the basis of discrete fracture networks, allowing it to adapt to various fracture morphologies and distributions, including natural and artificial fractures, without requiring an extensive array of nodes and elements. Besides, when simulating TPG and stress-sensitive effects, EDFM has better adaptability in characterizing fracture distributions [19,20]. Therefore, EDFM has clear advantages in the numerical simulation of fractured tight reservoirs, especially in improving simulation accuracy while optimizing computational efficiency, demonstrating significant superiority over traditional methods.
Numerical simulation studies of fractured tight oil reservoirs need to thoroughly consider the nanometer pore-throat characteristics of tight oil reservoirs, especially the impact of TPG and stress sensitivity on flow and reservoir performance during the CO2-HnP process. Jiang et al. [21] proposed a variable TPG model based on stress sensitivity to describe the flow characteristics of heavy oil under different pressure gradients, and validated the model’s predictions of flow behavior through simulation. Wang et al. [22] studied the TPG effect in low-permeability cores and its interaction with stress sensitivity through laboratory experiments, and further revealed the impact of stress and permeability changes on oil reservoir development through numerical simulation. Zhu et al. [23] discussed the TPG during fracture depletion, emphasizing the coupling effect between fractures and the matrix. Zhu et al. [24] conducted an in-depth exploration of the impact of TPG and stress sensitivity on oil production index. However, these studies are still lacking, especially in considering the role of reservoir rock physical parameters (such as elastic modulus, Poisson’s ratio, etc.) on flow and reservoir response during the CO2-HnP displacement process. In the CO2-HnP production process, the alternating changes of injection and production pressures have complex effects on effective permeability, porosity, and stress fields, a phenomenon particularly pronounced in fractured tight oil reservoirs [25,26]. Many studies [27,28] have investigated the coupling geomechanical effect and fluid flow simulation of single-well oil and gas reservoirs during the production process, but have not applied it to the CO2-HnP process to study how geomechanical effects affect the development of huff-n-puff processes. The existing CO2-HnP studies mostly focus on simulating TPG and permeability changes, while failing to systematically consider how geomechanical effects influence the CO2-HnP development process. This study attempts to fill this gap by further expanding the existing research framework, introducing geomechanical effects, and combining TPG to deeply analyze their impact on the development potential and optimization strategies of fractured tight oil reservoirs during the CO2-HnP process, while also providing a more accurate prediction of the dynamic behavior of fractured reservoirs.
CO2-HnP in fractured tight oil reservoirs is influenced by a combination of reservoir geological factors and injection and production parameters. There is currently a lack of quantitative understanding of the controlling factors in CO2-HnP production, and there is insufficient consideration of the characteristics of fractured tight reservoirs such as TPG and geomechanical effects, which presents certain limitations. This paper established a numerical model of a fractured horizontal well oil reservoir in a fractured tight oil reservoir to simulate the CO2-HnP process. The model considered the impact of TPG, geomechanical effects, and other factors on COP and oil replacement ratio. Using EDFM technology to establish a fracture model, the complex fracture network was coupled with the flow field. A series of relevant analyses were then conducted to weigh the main controlling factors affecting COP and oil replacement ratio, such as total CO2 injection amount, number of huff-n-puff cycles, timing of production transfer injection, production time, injection time, CO2 injection rate, and soaking time. The aim of this paper is to establish an effective numerical simulation method for CO2-HnP in fractured tight oil reservoirs and to optimize parameters, which helps to better understand the main controlling parameters of the CO2-HnP process in fractured tight oil reservoirs and has certain reference value.

2. Materials and Methods

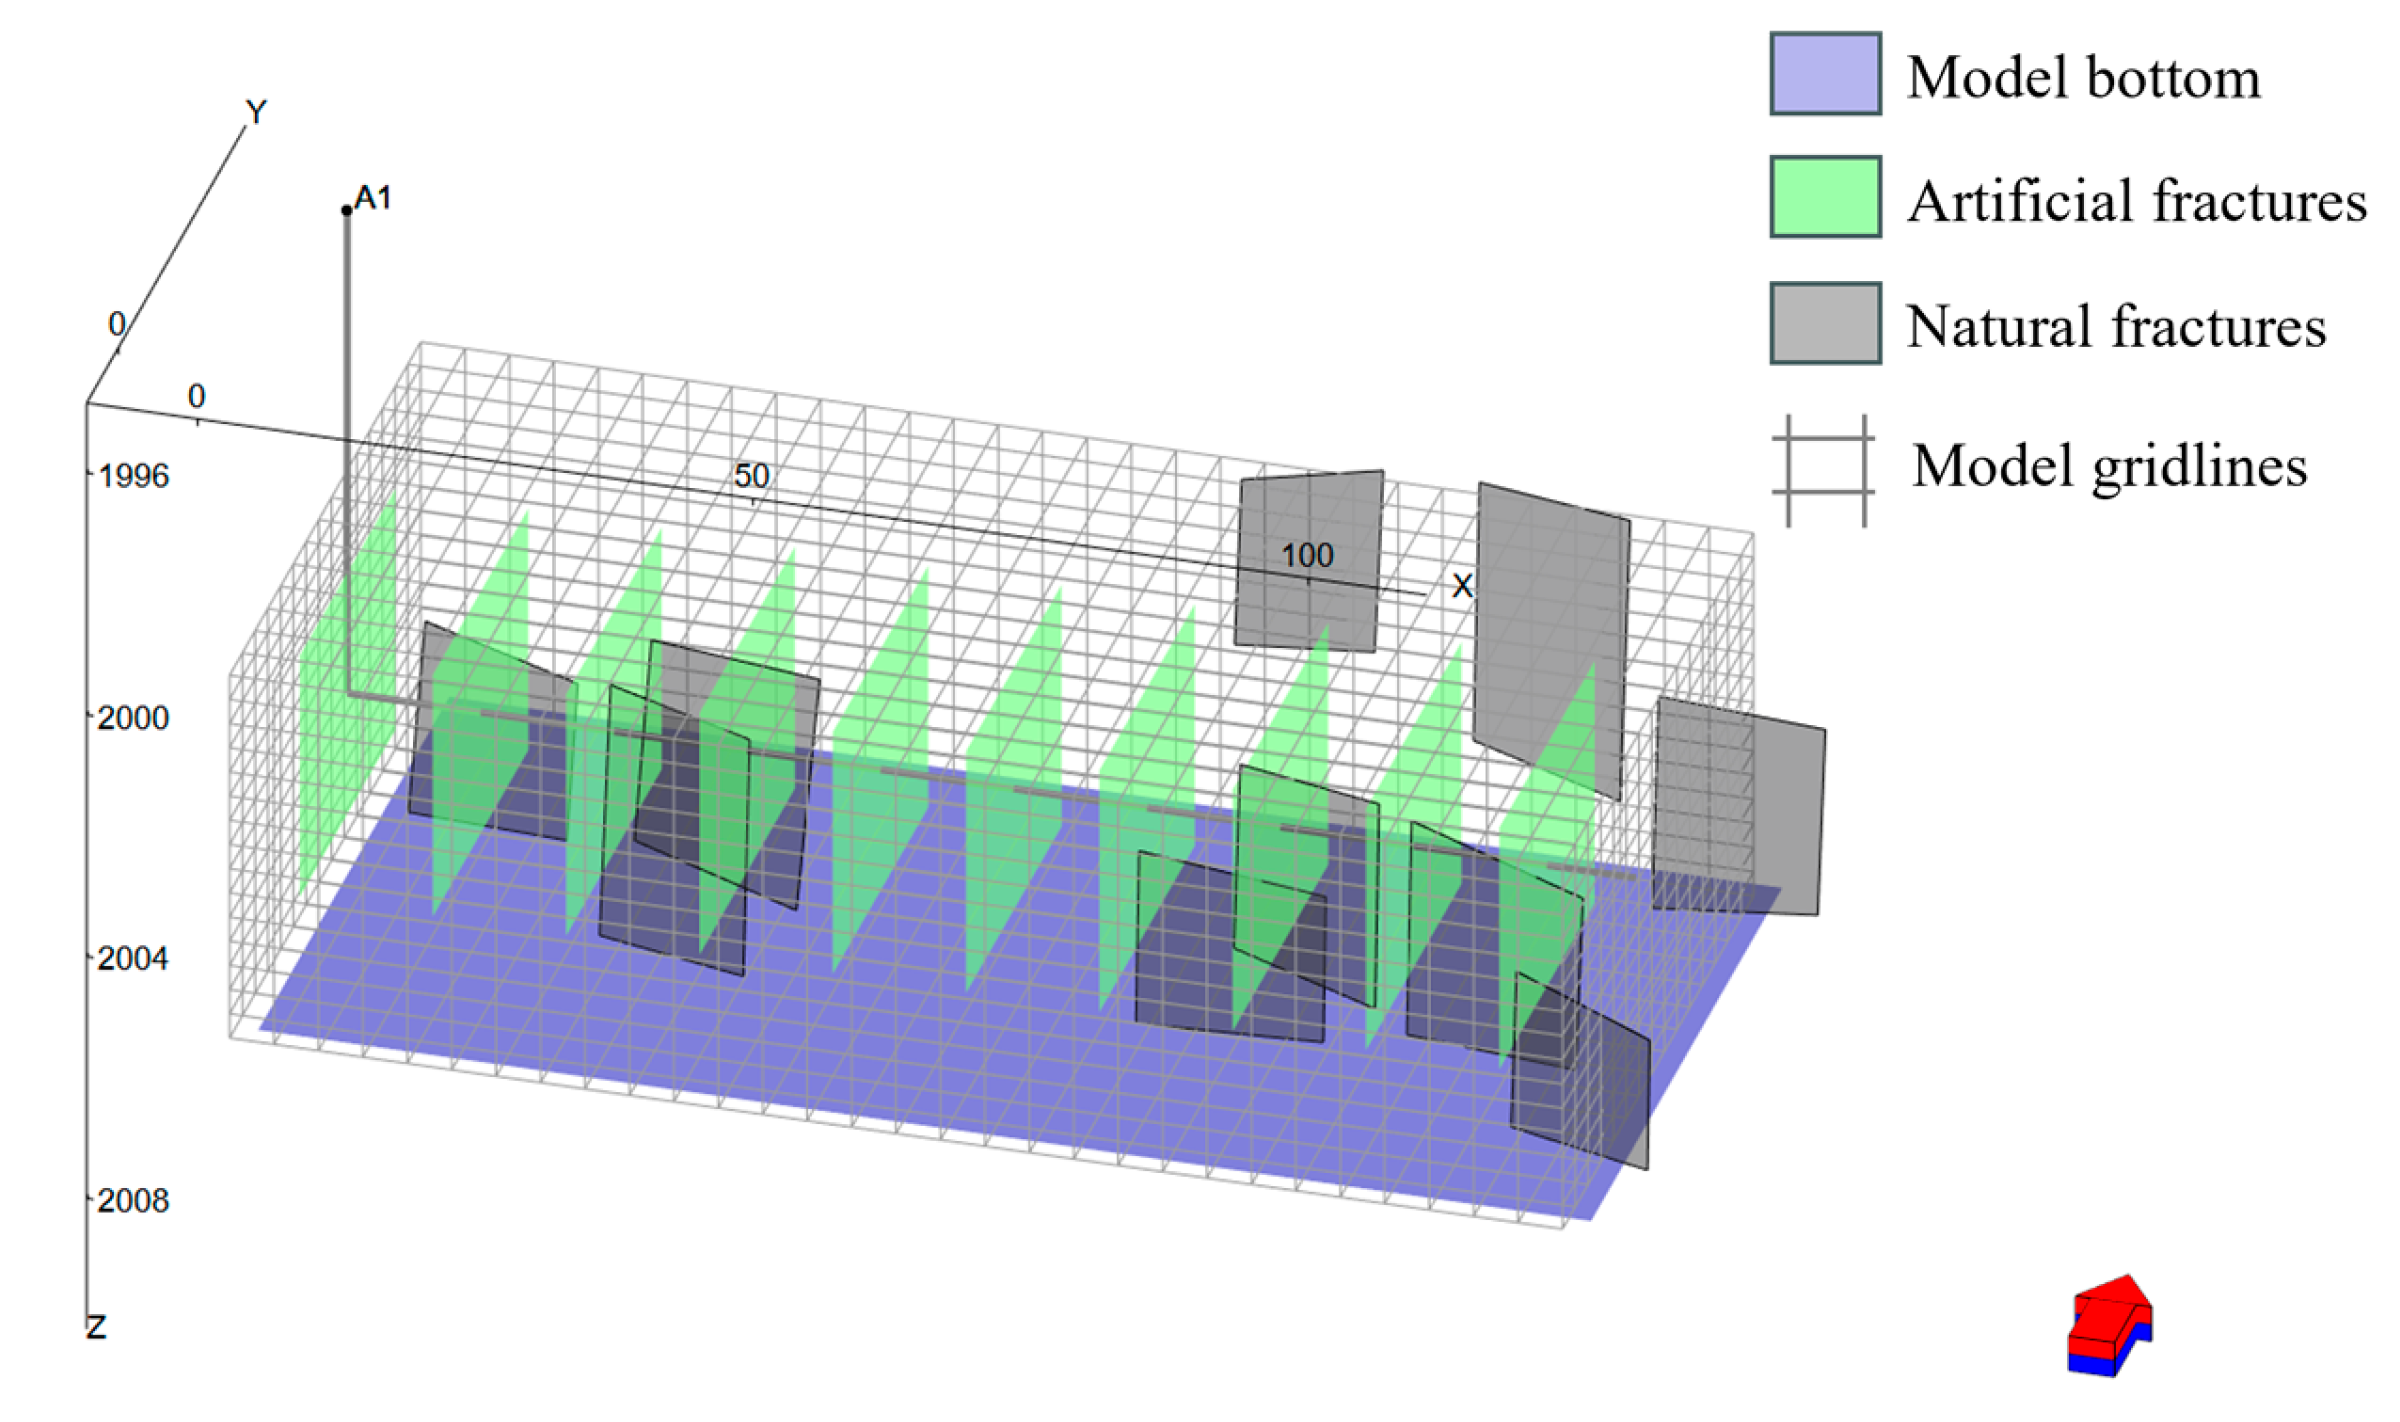
2.1. Model Parameter Settings

In this study, a fractured tight reservoir from the Jidong Oilfield was selected as the target reservoir, and reservoir numerical simulation software tNavigator Version 23.4 (Colchis Petroconsulting, Beijing, China) was used for the simulation. Considering the issue of model convergence, the reservoir with dimensions of 1200 m (length) × 600 m (width) × 60 m (thickness) was scaled down proportionally, and a three-dimensional model was established to create the corresponding fractured tight oil reservoir model with dimensions set to 120 m (length) × 60 m (width) × 6 m (thickness). The numerical simulation model is shown in Figure 1. The gray tubular line in the center of the model in Figure 1 represents a horizontal well, named A1. The 10 green rectangles perpendicular to the horizontal well represent artificial fractures, while the gray rectangles distributed at arbitrary angles around the outer perimeter of the horizontal well represent natural fractures. The artificial fractures were set to be evenly spaced and of equal length, characterized using local grid refinement (LGR). The distribution and orientation of natural fractures were set according to the actual proportional scale-down, and characterized using EDFM technology. The basic data of the reservoir model and the important data of the artificial fractures are listed in Table 1.
For the fractured tight oil reservoirs model, this paper assumes a composition of six components: CO2, N2, C1, C2–C3, C4–C6, C7–C12+, with molar fractions of 0.96%, 3.10%, 40.06%, 12.97%, 11.07%, and 31.84%, respectively. Table 2 lists the detailed component data of the fluid model. The relative permeability curves are presented in Figure 2.
Table 2. Compositional data of the fluid components.
ComponentMolar
Fraction
Critical
Pressure (Bar)
Critical
Temperature (K)
Critical
Volume
[m3/(kg·mol)]
Molecular
Weight
Acentric
Factor
CO20.009673.886304.7000.094044.010.225
N20.031033.944126.2000.090028.010.040
C10.400646.042190.6000.098016.040.013
C2–C30.129746.257331.8410.139735.860.121
C4–C60.110734.447455.2830.546669.490.234
C7–C12+0.318420.793663.8570.7997192.170.704

2.2. Simulation of the TPG

The simulation of the TPG in tNavigator Version 23.4 (Colchis Petroconsulting, Beijing, China) for each grid within the model, including the X, Y, and Z directions, can be directly assigned the same value through the keywords PTHRESHX, PTHRESHY, and PTHRESHZ. The advanced calculator (ARITHMETIC) function of tNavigator Version 23.4 (Colchis Petroconsulting, Beijing, China) can also apply empirical formulas to the model, restoring the real formation flow environment, and the simulated predicted production indicators are more instructive for actual oil reservoirs [23,29,30].
Based on the core experimental data of the TPG in a fractured tight reservoir from the Jidong Oilfield, the permeability, viscosity, and TPG are related by a power function, as shown in Figure 3. This relationship can be expressed as follows:
D = 0.428 × ( K / μ ) 0.957
where K is permeability in mD, μ is fluid viscosity in mPa·s, and D is TPG in MPa/m.
In the simulation of this paper, it is assumed that TPG is mainly controlled by permeability and viscosity, ignoring the time-varying permeability and the variation of TPG with injected CO2 concentration.
Based on the different permeabilities of different grids in the entire work area, different TPGs can be directly assigned to the X, Y, and Z directions between each grid, to simulate the impact of the TPG on the pressure field and the COP of the well. The CO2-HnP development plan is set as follows: A1 produces for 9 months, followed by 2 months of CO2 injection and 1 month of CO2 soaking. After 4 cycles of CO2-HnP, a production period of 5 years is achieved. Well A1 always maintains a bottomhole pressure limit of 50 bar, produces at a rate of 5% of the oil recovery rate, and the injection rate of CO2 is set to 200 m3/day using the similarity criterion. Two scenarios are set up: one considers the TPG, and the other does not, to analyze the impact of the TPG on the effectiveness of CO2-HnP.

2.3. Simulation of the Geomechanical Effects

Building on the example of CO2-HnP in Section 2.2, which takes into account the TPG, this paper further investigates the impact of incorporating geomechanical effects (relevant parameters shown in Table 3), alongside another scenario that does not consider them. A comparative study is conducted to analyze the effects of adding geomechanical parameters on the formation pressure field, residual oil saturation field, porosity field, and COP of the well after considering the TPG in CO2-HnP.

2.4. CO2-HnP Parameter Settings

In the CO2-HnP process, after considering the TPG and adding geomechanical parameters, the impact of CO2-HnP injection and production parameters such as bottomhole pressure, oil production rate, total CO2 injection amount, number of huff-n-puff cycles, timing of production transfer injection, production time, injection time, CO2 injection rate, and soaking time on COP and oil replacement ratio was analyzed.
Firstly, appropriate bottomhole pressure limits were selected, and numerical simulation calculations were performed with six bottomhole pressure values set to 100 bar, 90 bar, 70 bar, 50 bar, 30 bar, and 20 bar, while maintaining an oil recovery rate of 5% and a CO2 injection rate of 200 m3/d. Under the appropriate bottomhole pressure limit, the oil recovery rate was further optimized by performing numerical simulation calculations with six oil recovery rate values set to 3%, 4%, 5%, 6%, 7%, and 8%, with all other huff-n-puff parameters remaining the same.
Under the appropriate bottomhole pressure limit and oil recovery rate, the following orthogonal experiments were designed: the total CO2 injection amount was set to 38,000 m3, 48,000 m3, 58,000 m3, and 68,000 m3; the number of CO2-HnP cycles was set to 3, 4, 5, and 6; the timing of CO2 injection transfer was set to the 1st, 2nd, 3rd, 4th, 5th, 7th, and 9th month; the production time was set to 5, 7, 9, and 11 month; CO2 injection time was set to 1, 2, 3, 4, 5 and 6 months; CO2-soaking time was set to 1, 2, 3, 4, 5 and 6 months, while the total simulation duration remained 60 months. CO2 injection rate in the cycle would change accordingly with different total CO2 injection amount, different numbers of cycles, and different injection times. The specific orthogonal experiment plan is set out in Table 4.

2.5. Multi-Factor Analysis Method

Using total CO2 injection amount, number of huff-n-puff cycles, timing of production transfer injection, production time, injection time, CO2 injection rate, and soaking time as independent variables, and COP and oil replacement ratio as dependent variables for Random Forest modeling, feature weight values were obtained from a Random Forest model, and the impact of each independent variable on COP and oil replacement ratio was analyzed. By employing the Pearson correlation coefficient method to obtain the Pearson correlation coefficients of various injection and production parameters with respect to COP and oil replacement ratio, the impact of each factor on COP and oil replacement ratio was analyzed. Multiple multi-factor analysis methods were integrated for cross validation to verify the robustness of research results.

3. Results

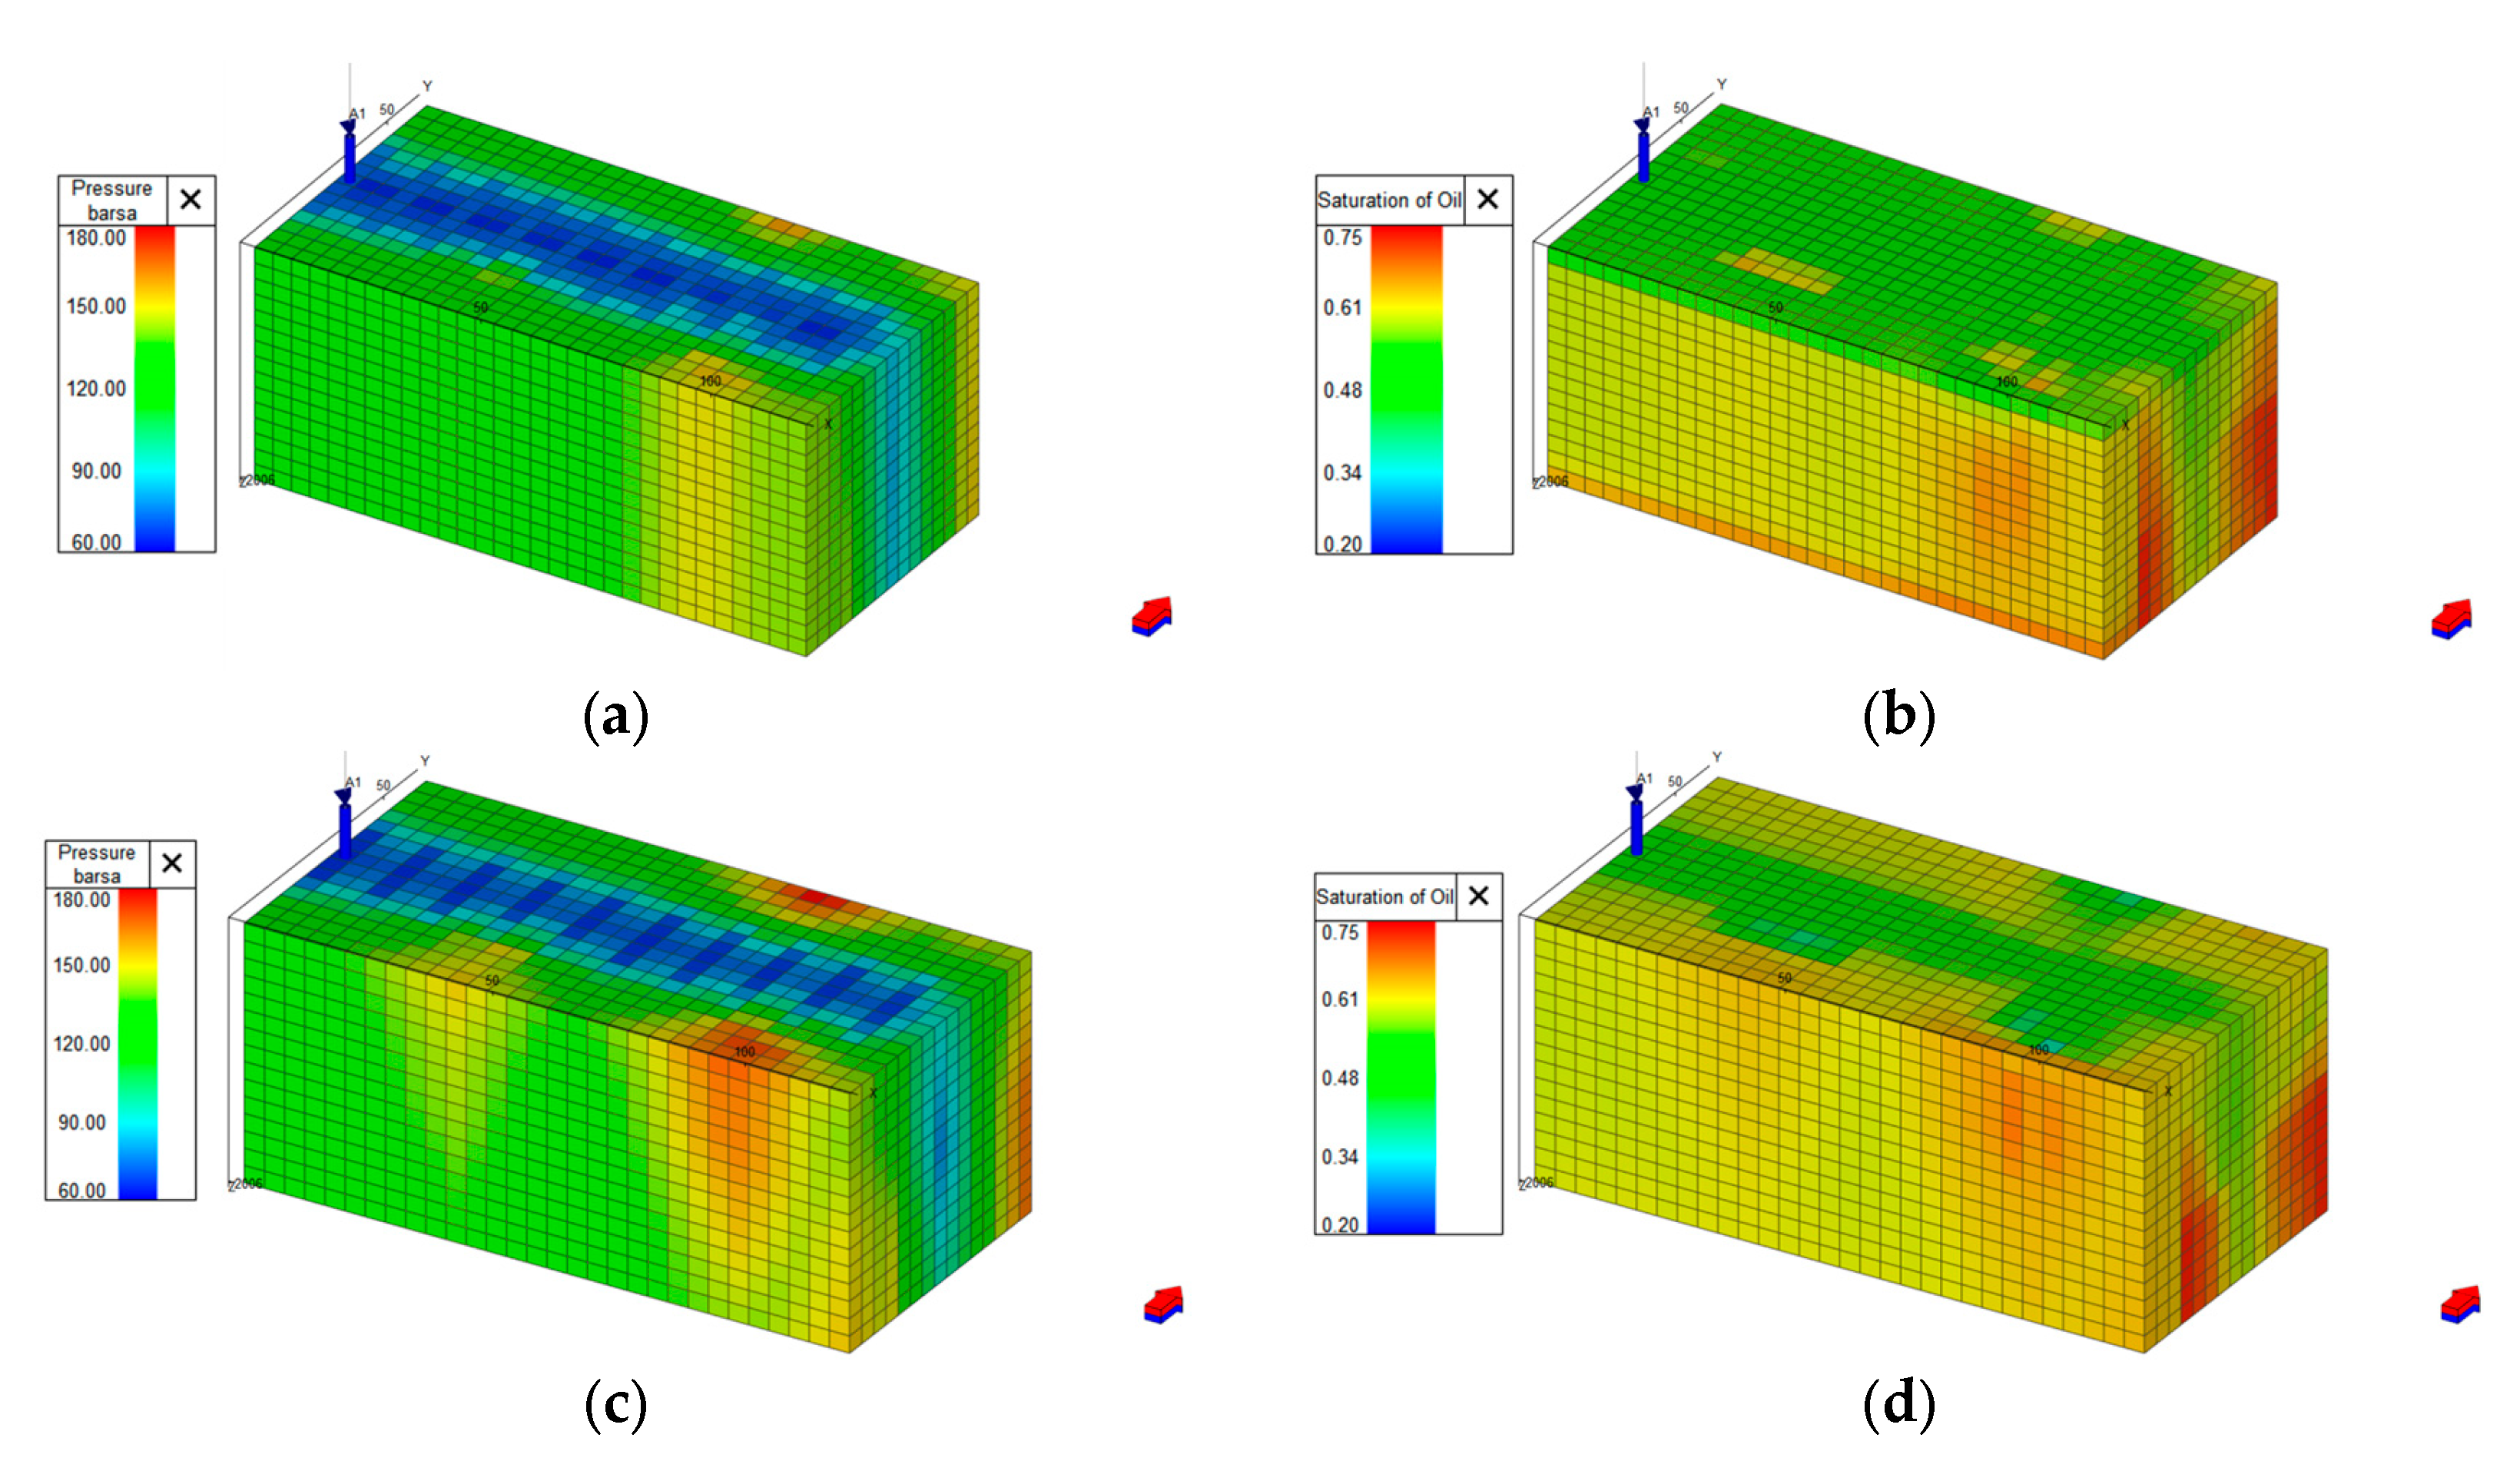
3.1. Impact and Analysis of the TPG

TPG was incorporated into the model to investigate its impact on the formation pressure field and the COP of the well. After four cycles of CO2-HnP, the change in COP is shown in Figure 4. It was found that after 5 years of development considering the TPG, the COP decreased by 11.02% compared to the case where it was not considered. Therefore, the impact of the TPG cannot be ignored in the numerical simulation of fractured tight oil reservoirs.
Comparing the CO2-HnP numerical simulations that consider the TPG with those that do not, the changes in the pressure field and oil saturation field after four rounds of CO2-HnP are shown in Figure 5. In the pressure field map that takes into account the TPG, the pressure is lower at the artificial fractures and higher at the natural fractures; in the saturation field map that considers the TPG, the residual oil saturation at the artificial fractures and their intersections with natural fractures is lower compared to other areas. This indicates that when the TPG is taken into account, the horizontal development range will be reduced, being limited to areas with high permeability, that is, the artificial fractures and their intersections with natural fractures, leading to a decrease in production.

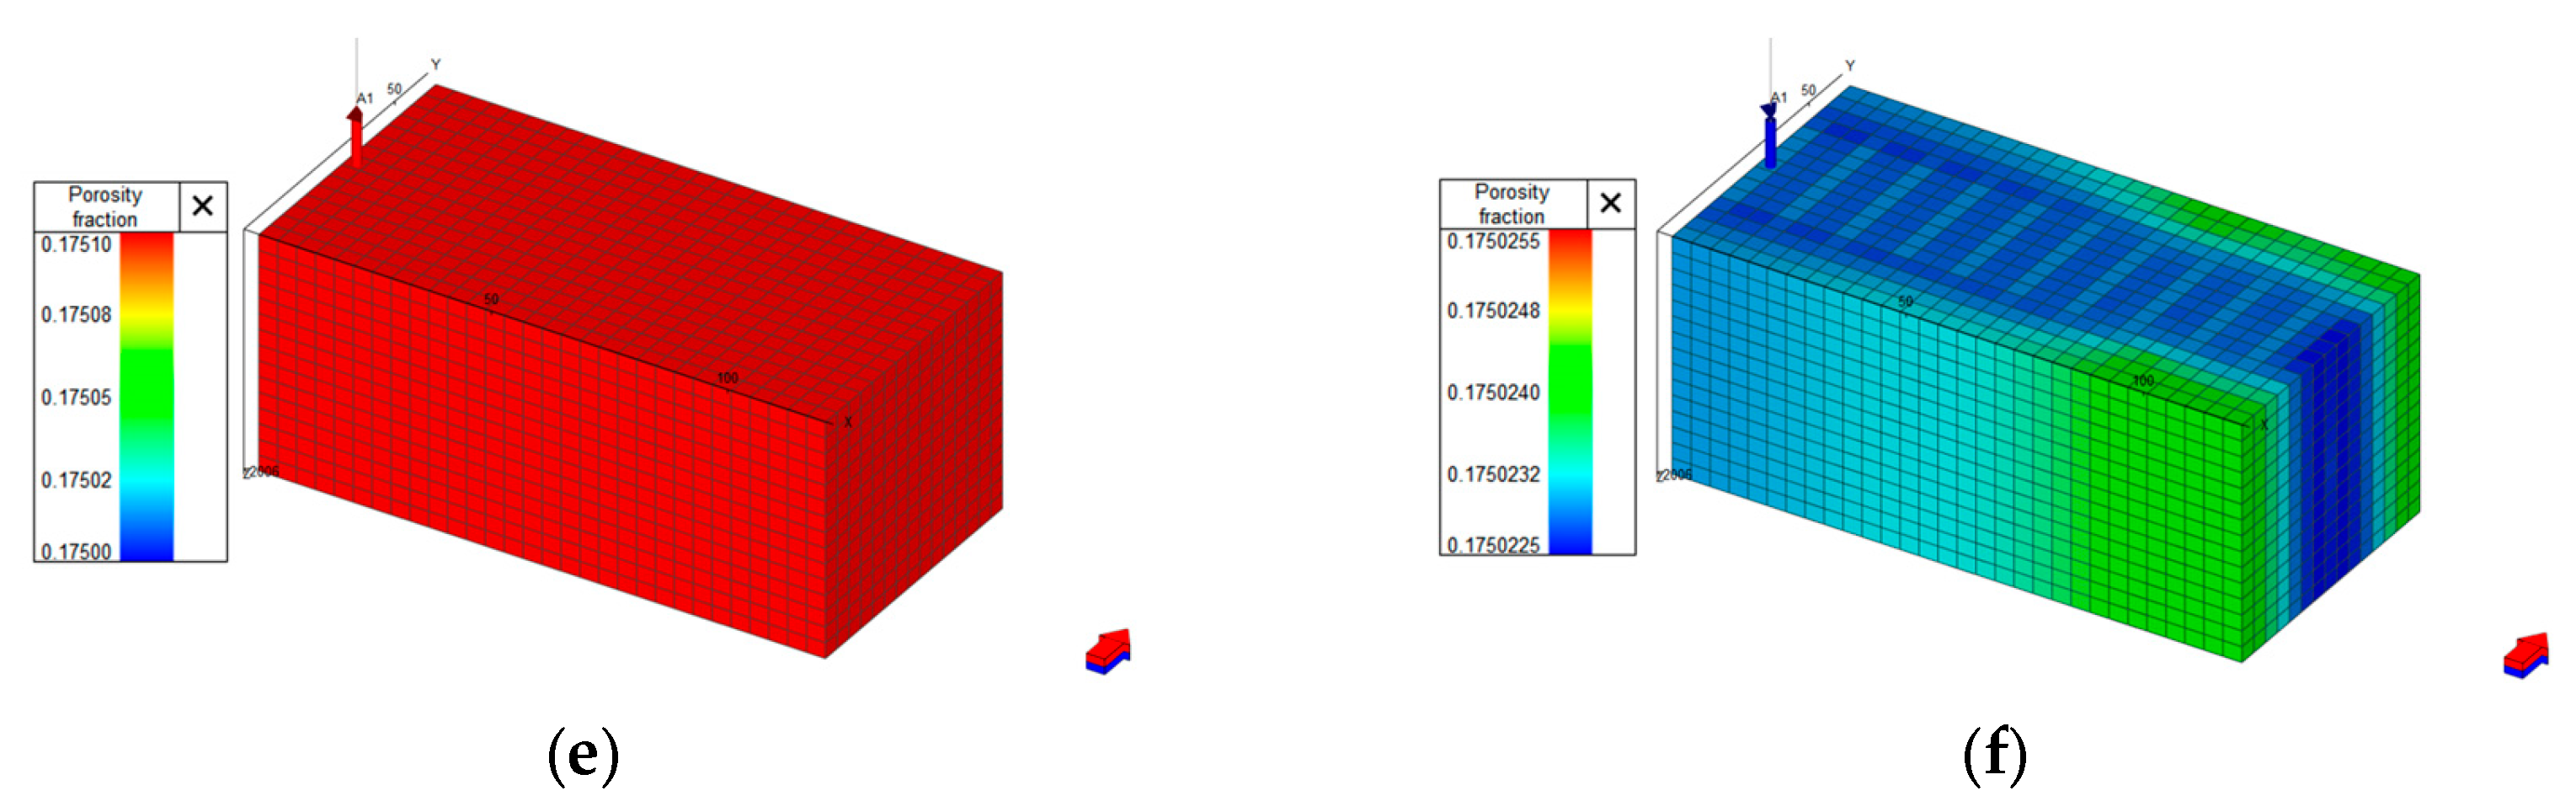
3.2. Impact and Analysis of the Geomechanical Effects

The impact of incorporating geomechanical effects into the formation pressure field after considering the TPG was studied over four CO2-HnP development cycles and a total of 5 years of production. The COP curve in Figure 6 indicates that, compared to the model that does not consider geomechanical effects, when geomechanical effects are taken into account, the deformation of the reservoir’s soil and rock has a significant impact on the rock properties, significantly affecting the development indicators calculated by the simulation. The COP decreased by 64.88% compared to the case where it is not considered, reducing the ultimate recovery rate of the oil field. For fractured tight oil reservoirs, the porous medium of the reservoir deforms under the action of geomechanical effects, leading to changes in porosity and permeability, which in turn affect the flow and development dynamics of the reservoir.
The simulation results of the pressure field and porosity field maps in Figure 7 indicate that near the well bottom, there are significant changes in pressure and porosity parameters, which decrease as the distance from the wellbore increases. Temporally, for this closed oil reservoir, during the initial production phase, there are substantial changes in stress–strain, porosity, and permeability. Subsequently, these changes tend to stabilize as the elastoplastic variations gradually decrease, as shown in Figure 8. Therefore, production measures that cause sudden and drastic changes in the bottomhole pressure gradient should be avoided to prevent damage to the reservoir.
Generally speaking, geomechanical effects tend to slow down the pressure drawdown rate in oil reservoirs, but the smaller the permeability, the more pronounced the impact of geomechanical effects on the pressure distribution in the reservoir; the greater the fluid production rate, the greater the impact of geomechanical effects on the bottomhole flowing pressure. In Figure 9, it can be seen that the average formation pressure is about 50 bar, while the average formation pressure without considering geomechanical effects is about 100 bar. This indicates that the original normal pressure drawdown development strategy may cause a sudden and significant change in the bottomhole pressure gradient under the conditions of geomechanical effects. The deformation of the reservoir’s soil and rock has a significant impact on the rock property parameters. In the numerical simulation of fractured tight oil reservoirs, the influence of geomechanical effects is not negligible.

3.3. Impact and Analysis of the CO2-HnP Parameters

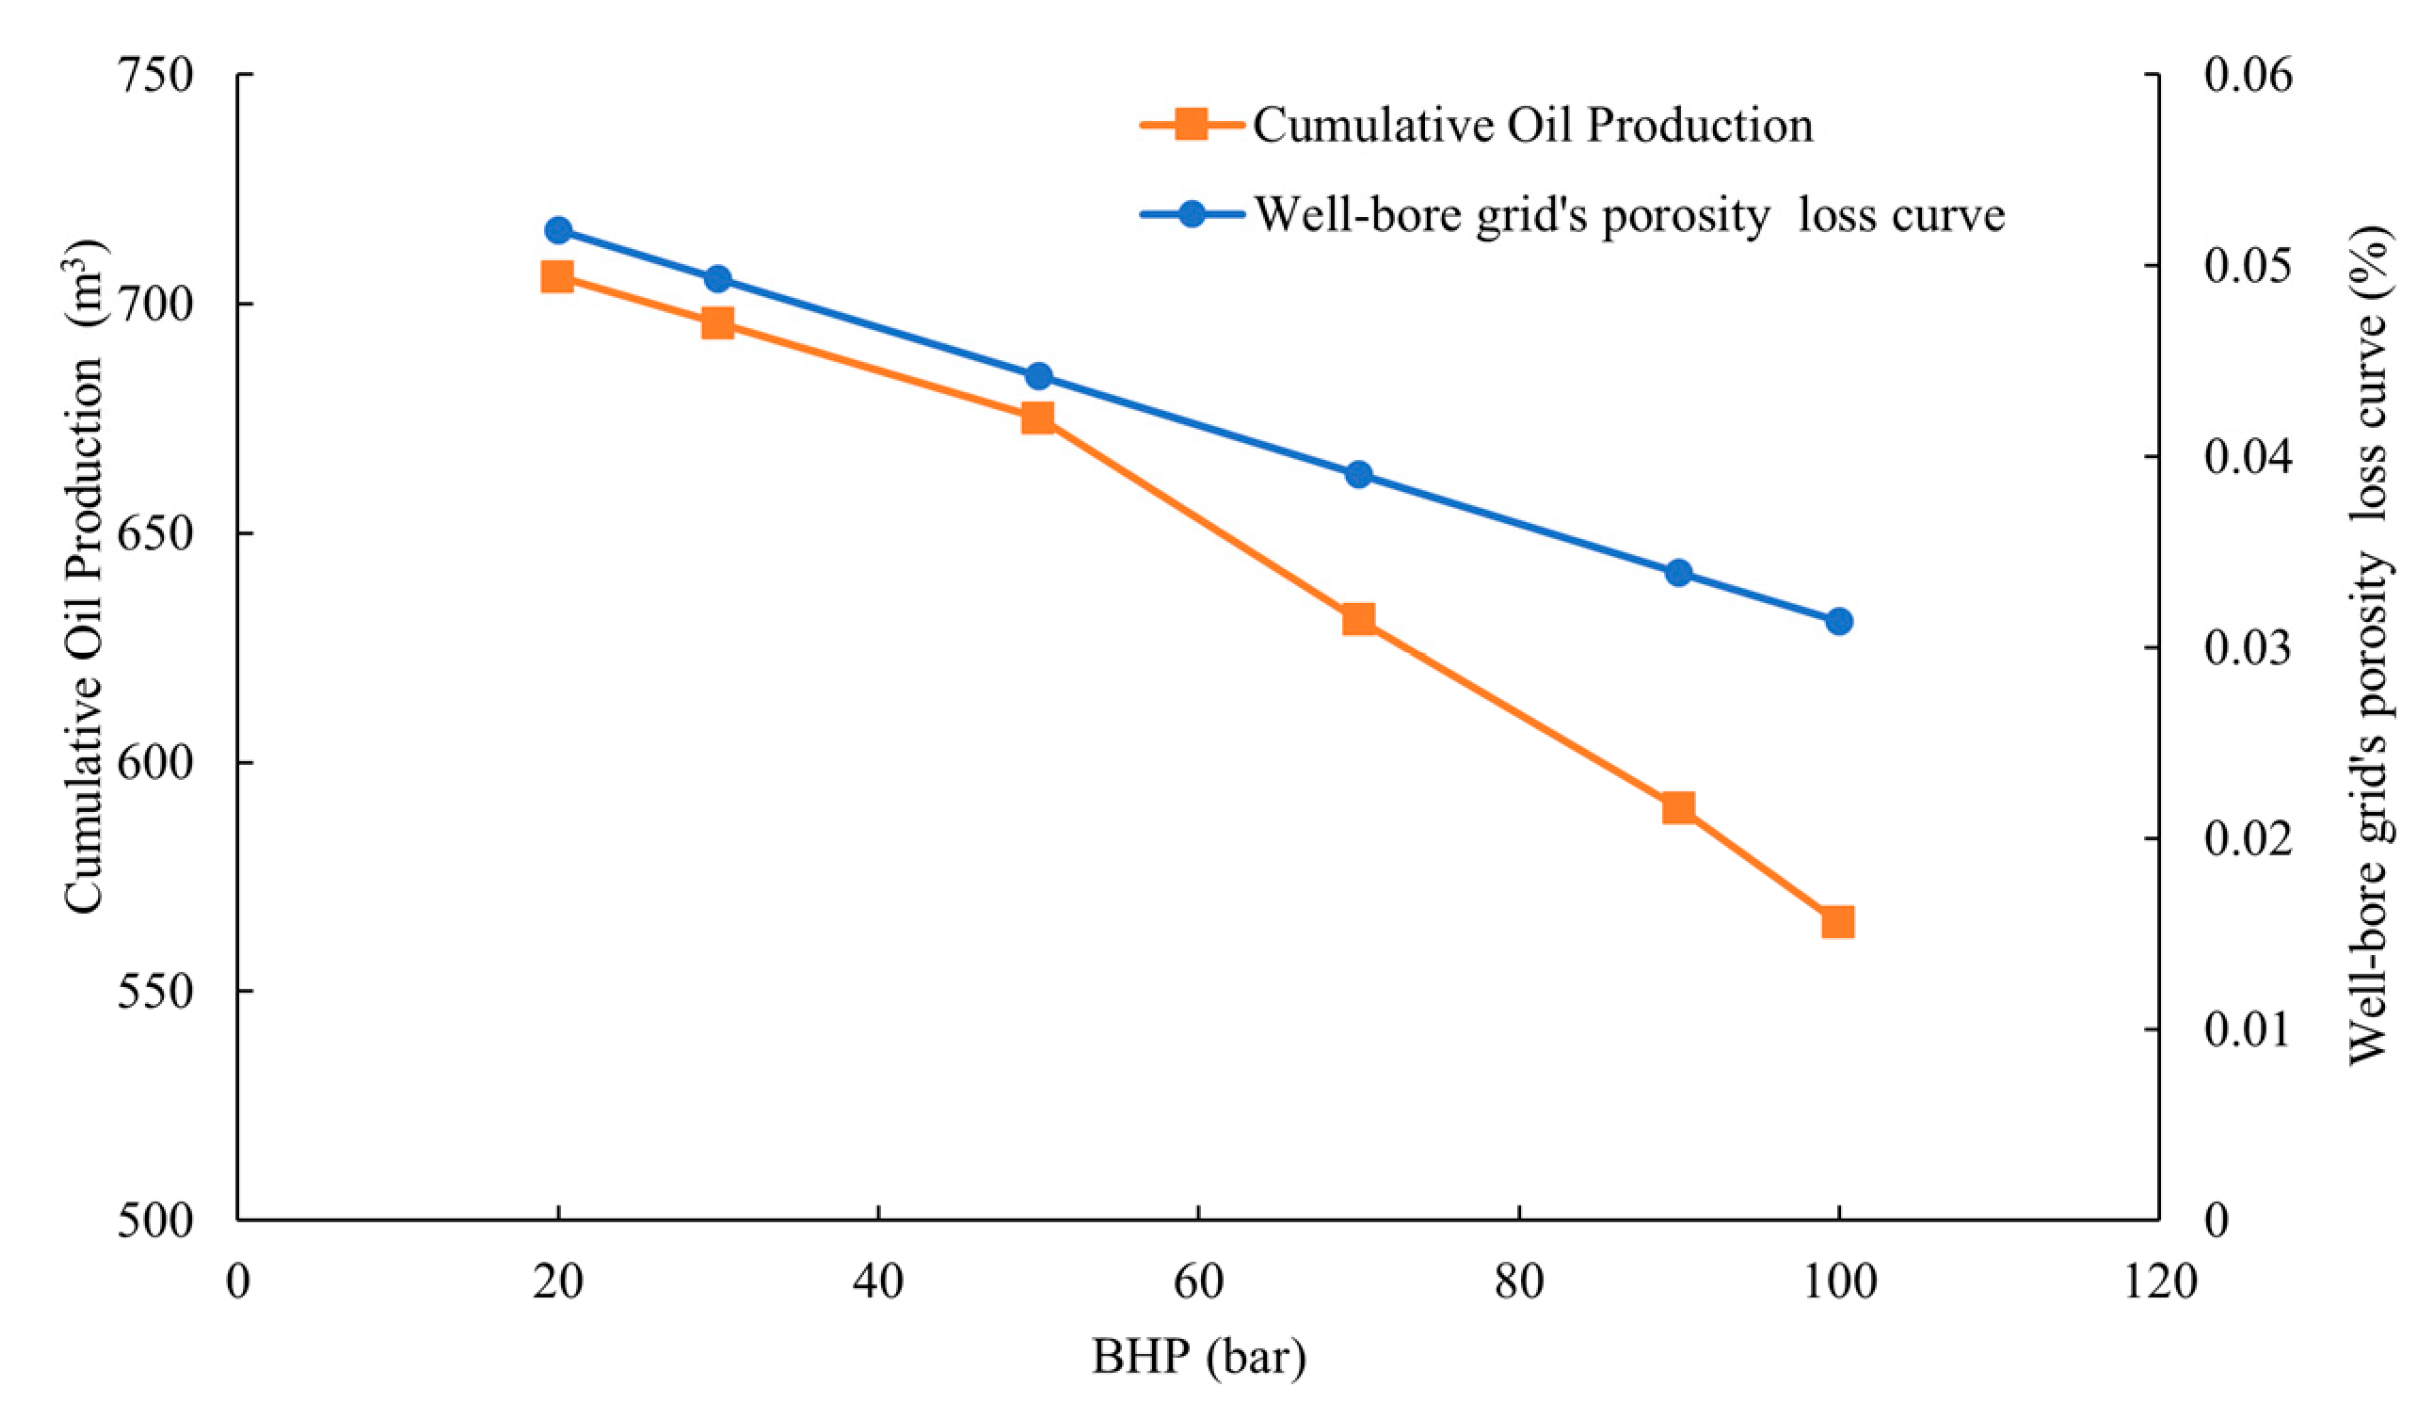
3.3.1. Impact and Analysis of the Bottomhole Pressure

The simulation results of the impact of bottomhole pressure (BHP) on COP and oil replacement ratio are shown in Figure 10. The figure indicates that lower bottomhole pressures correspond to higher cumulative oil yields. This correlation arises because a reduced BHP amplifies the pressure gradient between the wellbore and the formation, enhancing the displacement energy within the formation and consequently boosting the well’s COP. However, when the BHP is reduced, due to geomechanical effects, the porosity and permeability of the rock decrease, and the blue curve climbs higher, making it difficult for oil to flow from the formation into the wellbore, resulting in a slowdown in the rate of oil production. When the BHP limit is reduced from 100 bar to 50 bar, an average increase of 2.21 m3 of oil per 1 bar reduction is observed, but when the BHP limit is further reduced from 50 bar to 20 bar, an average increase of only 1.02 m3 of oil per 1 bar reduction is observed. Since the increase in the COP is already minimal when the BHP reaches 50 bar, and the rate of increase in the COP basically remains unchanged, therefore, a bottomhole pressure limit of 50 bar is the optimal value. This avoids excessive development of the reservoir due to overly low BHP while obtaining the best COP.

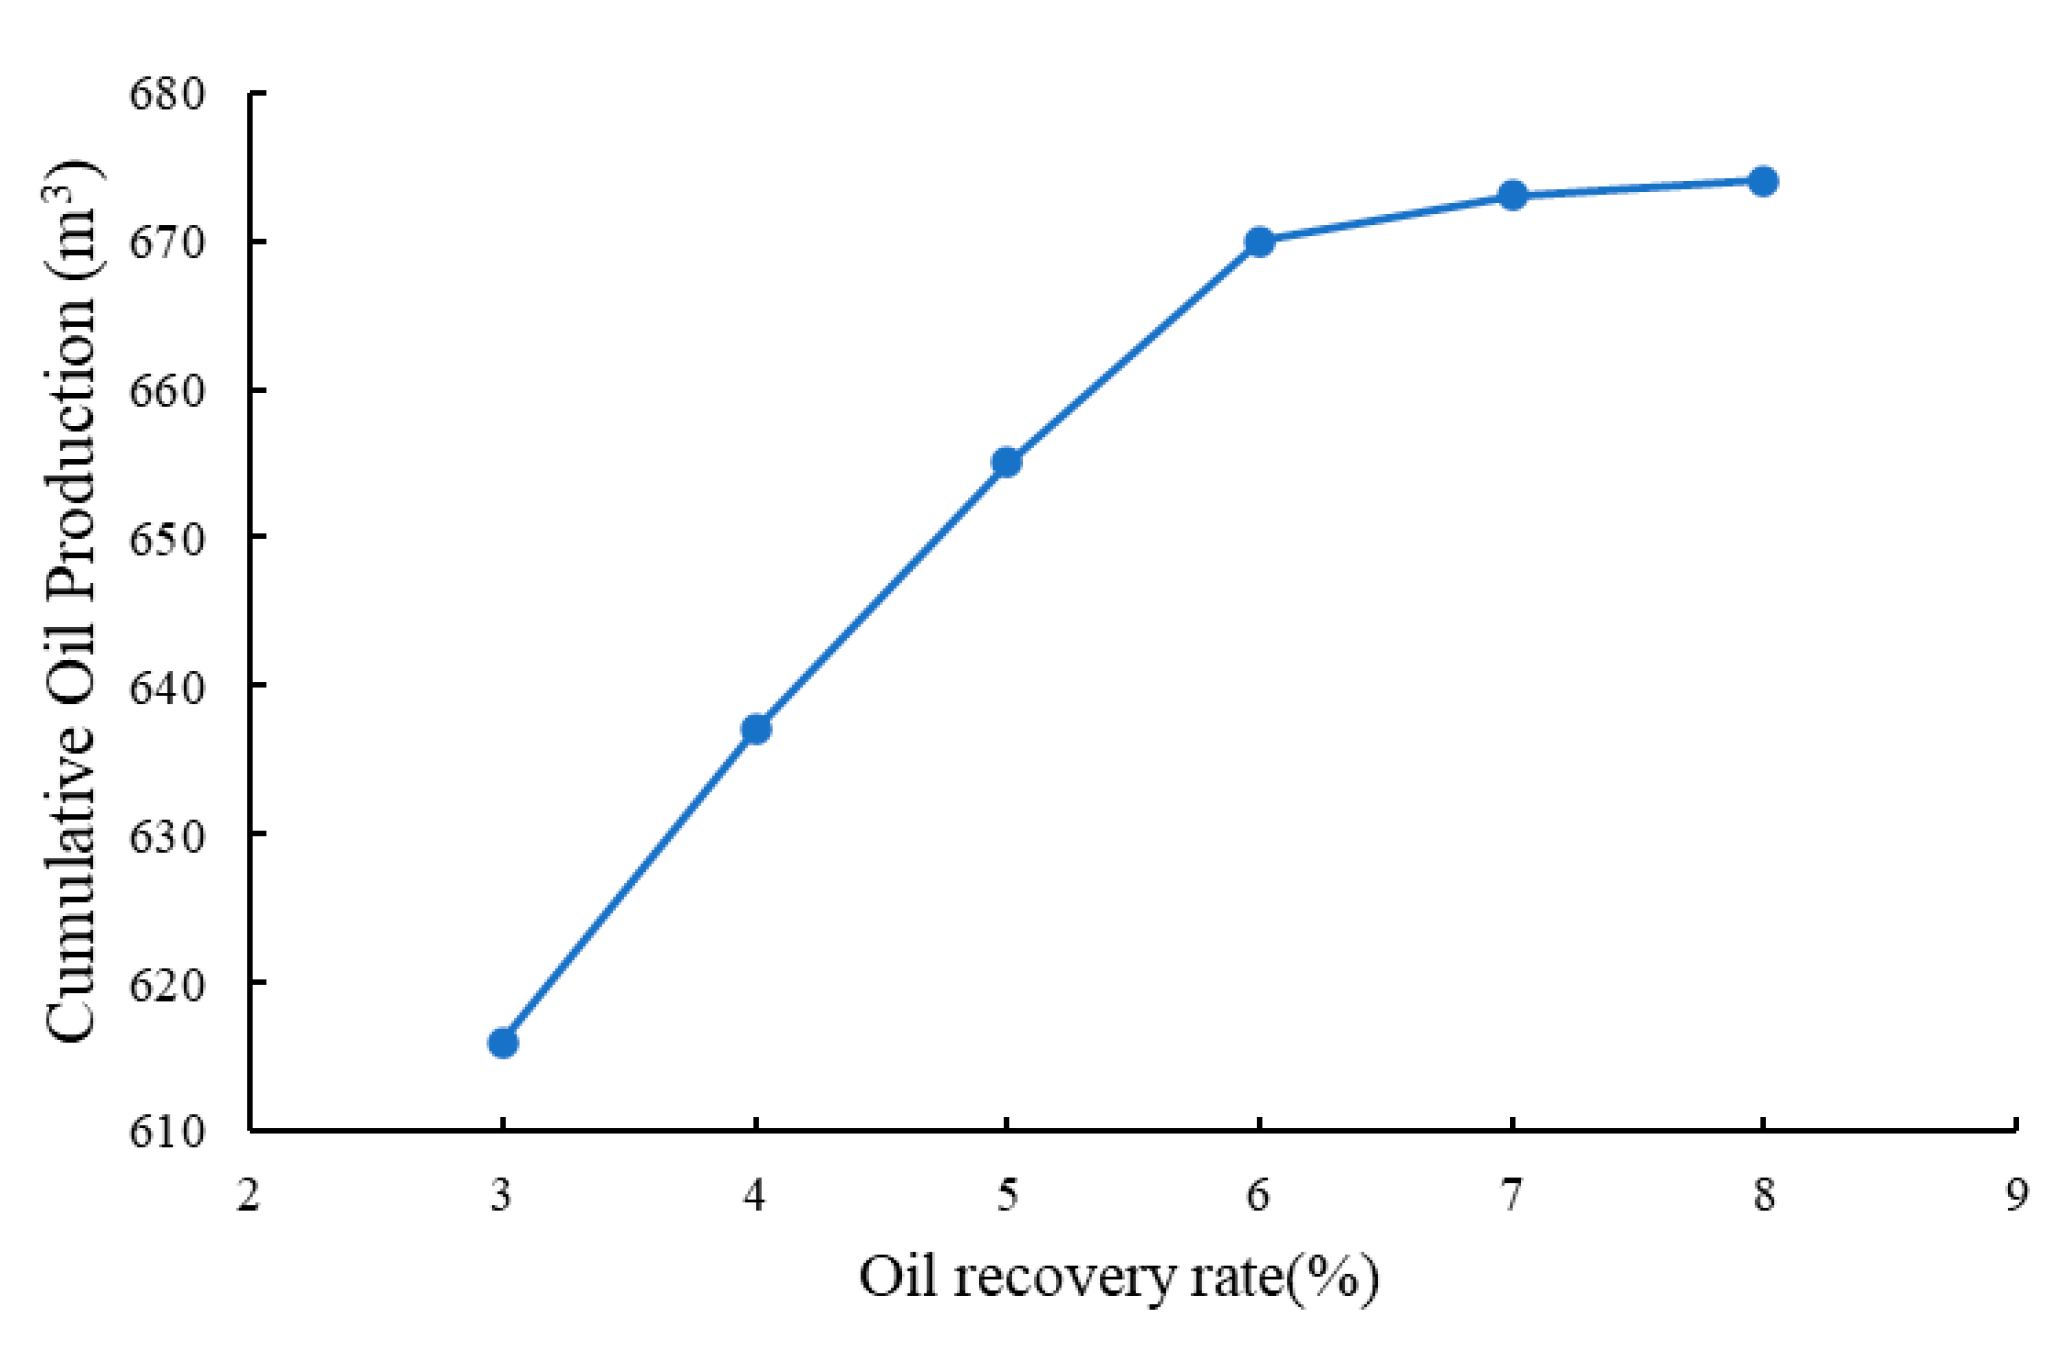
3.3.2. Impact and Analysis of the Oil Recovery Rate

Under the BHP limit of 50 bar, numerical simulation calculations were performed for six oil recovery rate values of 3%, 4%, 5%, 6%, 7%, and 8%. The simulation results of the impact of oil production rate on COP are shown in Figure 11. As the oil recovery rate increases, the COP gradually increases, and a higher oil recovery rate helps to improve the COP. However, an increase in the oil recovery rate will more quickly consume the formation pressure, reducing the pressure gradient between the well bottom and the formation, which may not reach the setting oil production volume. At this point, production will be carried out according to the BHP limit, resulting in a gradual decrease in the incremental oil production. When the oil recovery rate is increased up to 6%, the average incremental oil production is 18 m3. When the oil recovery rate is increased beyond 6%, the average incremental oil production is 2 m3. Therefore, an oil production rate of 6% is the optimal value.

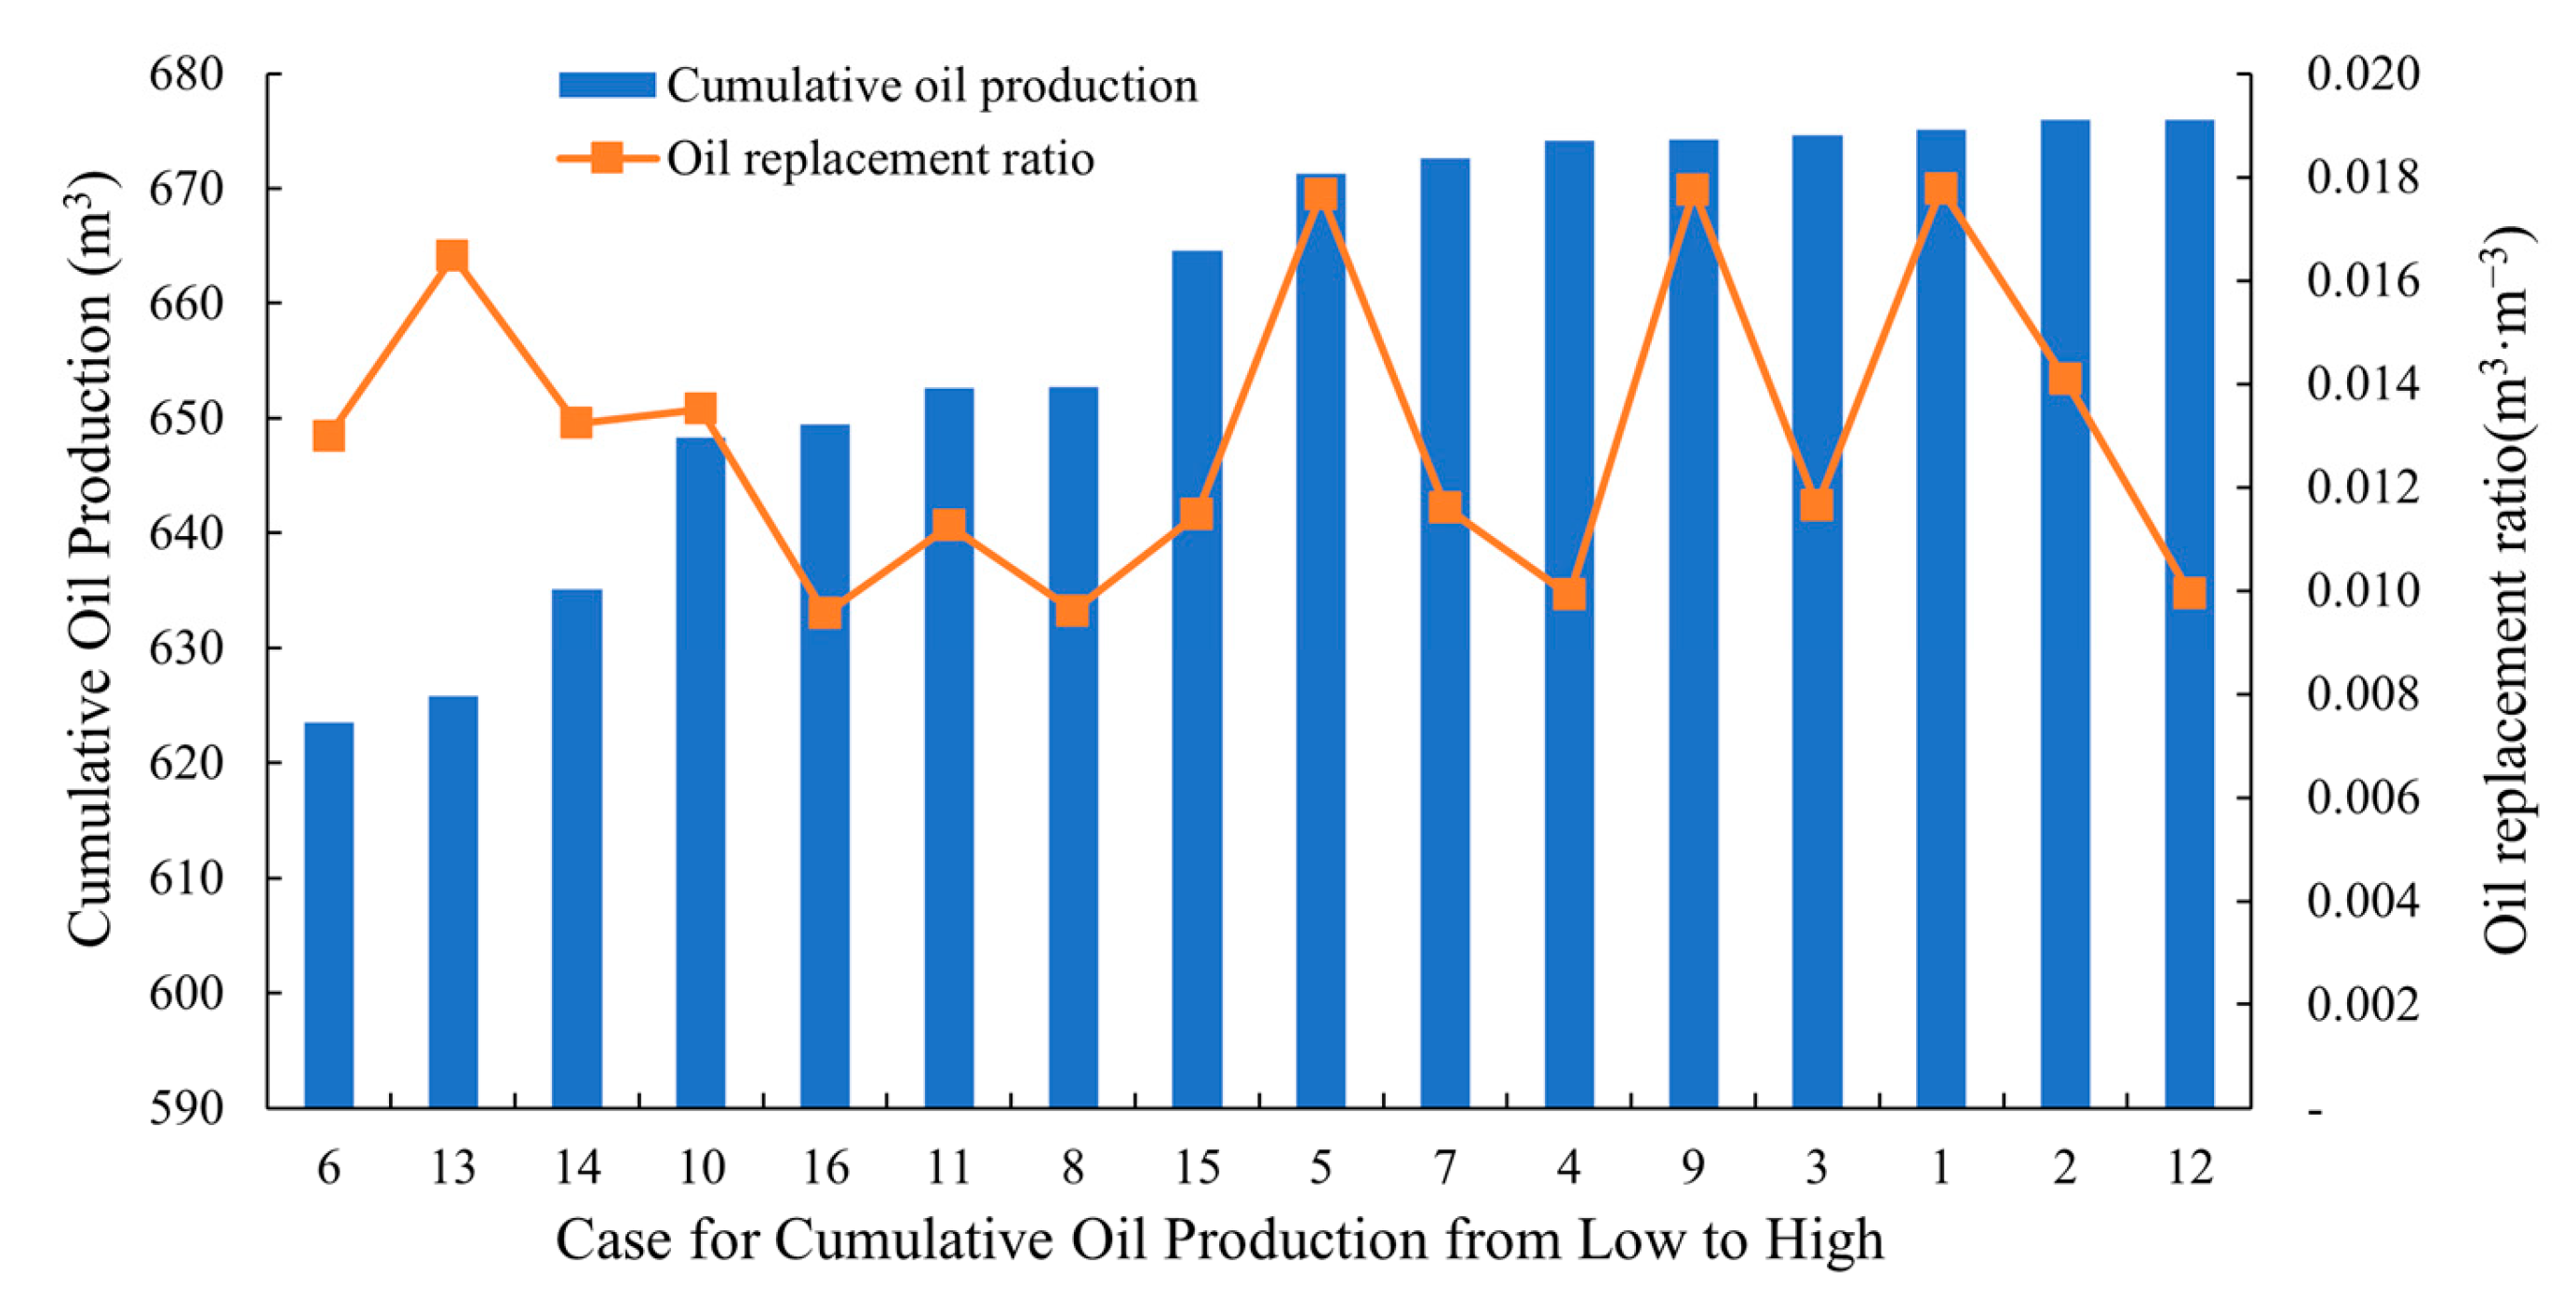
3.3.3. Orthogonal Experimental Results

Under the BHP limit of 50 bar and an oil recovery rate of 6%, the simulation results from the orthogonal experiment scheme in Section 2.4 are sorted by COP from low to high to obtain Table 5 and Figure 12. It can be seen from Figure 12 that the increase in COP is not significant in the last three schemes, but as the injection amount increases, the oil replacement ratio begins to decrease. Therefore, scheme 1 is selected, which involves a total CO2 injection amount of 38,000 m3, three cycles, injection transfer starting in the 3rd month, with CO2 involving 11 months of production, 4 months of injection, and a 5-month soaking period, with an injection rate of 105.56 m3/d.
Table 5. The COP of the case simulation results sorted from low to high.
CaseInjection Amount (m3)COP (m3)Oil Replacement Ratio (m3·m−3)
648,000623.530.0130
1338,000625.790.0165
1448,000635.070.0132
1048,000648.310.0135
1668,000649.450.0096
1158,000652.630.0113
868,000652.700.0096
1558,000664.630.0115
538,000671.320.0177
758,000672.660.0116
468,000674.180.0099
938,000674.260.0177
358,000674.690.0116
138,000675.150.0178
248,000675.960.0141
1268,000675.990.0099

3.3.4. Multi-Factor Analysis

Subsequently, each parameter was used as the dependent variable for Random Forest modeling, and the feature weight values in the Random Forest model were obtained, as shown in Table 6.
The feature weight displays the importance of each factor’s contribution to the COP or oil replacement ratio, with a sum of 1. As shown in Table 6, the proportion of timing of production transfer injection is 27.90%, and this factor has the highest weight and plays a key role in COP; the proportion of total CO2 injection amount is 50.61%, which is strongly correlated with the oil replacement ratio.
The Pearson correlation coefficient method is used to obtain Pearson correlation coefficients for COP and oil change rate for each injection production parameter, as shown in Table 7.
Pearson correlation coefficient analysis: The injection volume has a small effect on COP and a significant negative impact on the oil replacement ratio (−0.971), indicating that the larger the injection volume, the lower the oil replacement ratio. Although increasing CO2 injection can help improve the COP, excessive injection may lead to gas channeling, resulting in ineffective displacement and ultimately reducing the overall oil recovery rate. The number of cycles has a moderate negative correlation with COP (−0.537), but has almost no effect on the oil replacement ratio, suggesting that the more cycles there are, the lower the COP. Frequent cycling may cause a more dispersed gas distribution in the reservoir and lead to greater pressure fluctuations, making extraction more difficult, thus further reducing the COP. The timing of injection transfer has a significant impact on both COP and oil replacement ratio, with a moderate positive correlation with COP (0.410) and a strong negative correlation with oil replacement ratio (−0.711), indicating that timely switching of injection methods can avoid over-reliance on a single injection approach, thereby improving the COP. But premature transfer will reduce the oil replacement ratio. Production time has a small impact on both. Injection time has a slight positive correlation with COP (0.164) and a negative correlation with oil replacement ratio (−0.532), indicating that an increase in injection time, with the same total injection volume, may slightly increase COP but reduce the oil replacement ratio. The injection rate has a small impact on both. Soaking has a slight negative correlation with COP (−0.279) and a moderate positive correlation with oil replacement ratio (0.514), indicating that optimizing the soaking time can help increase the oil replacement ratio but will slightly reduce COP.
Based on the results of the Random Forest and the Pearson correlation coefficients of various injection and production parameters, the following conclusions can be drawn: The multi-factor analysis revealed the positive correlation parameters with COP are arranged in a positive sequence: timing of production transfer injection, production time, injection time, total CO2 injection amount, and the negative correlation parameters: number of huff-n-puff cycles, soaking time, injection rate. The positive correlation parameters with oil replacement ratio are arranged in a positive sequence: soaking time, injection rate, production time, and the negative correlation parameters in the following order: total CO2 injection amount, timing of production transfer injection, injection time, number of huff-n-puff cycles.
Overall, with a constant injection volume, it is crucial to avoid an excessive number of cycles that reduce COP. On the basis of this parameter optimization, the oil replacement ratio can be enhanced by advancing the production transfer injection, shortening the injection time, and extending the soaking time. In the actual development of fractured tight oil reservoirs, the model proposed in this paper can be established to adjust the timing of production transfer injection according to oil field production and CO2 injection capacity. By fully considering the interaction between TPG and geomechanical effects, the best parameter combination can be optimized to achieve higher COP and oil replacement ratio. The findings can help optimize CO2-HnP strategies to improve oil recovery and economic benefits from the reservoir.

4. Conclusions

This paper established a numerical model of a volume-fractured horizontal well oil reservoir in a fractured tight oil reservoir to simulate the CO2-HnP process. The model considered the impact of TPG, geomechanical stress, and other factors on COP and oil replacement ratio. Using EDFM technology to establish a fracture model, the complex fracture network was coupled with the flow field. A series of correlation analyses were then conducted to weigh the main controlling factors affecting COP and oil replacement ratio, such as total CO2 injection amount, number of huff-n-puff cycles, timing of production transfer injection, production time, injection time, CO2 injection rate, and soaking time. The following conclusions can be drawn:
(1)
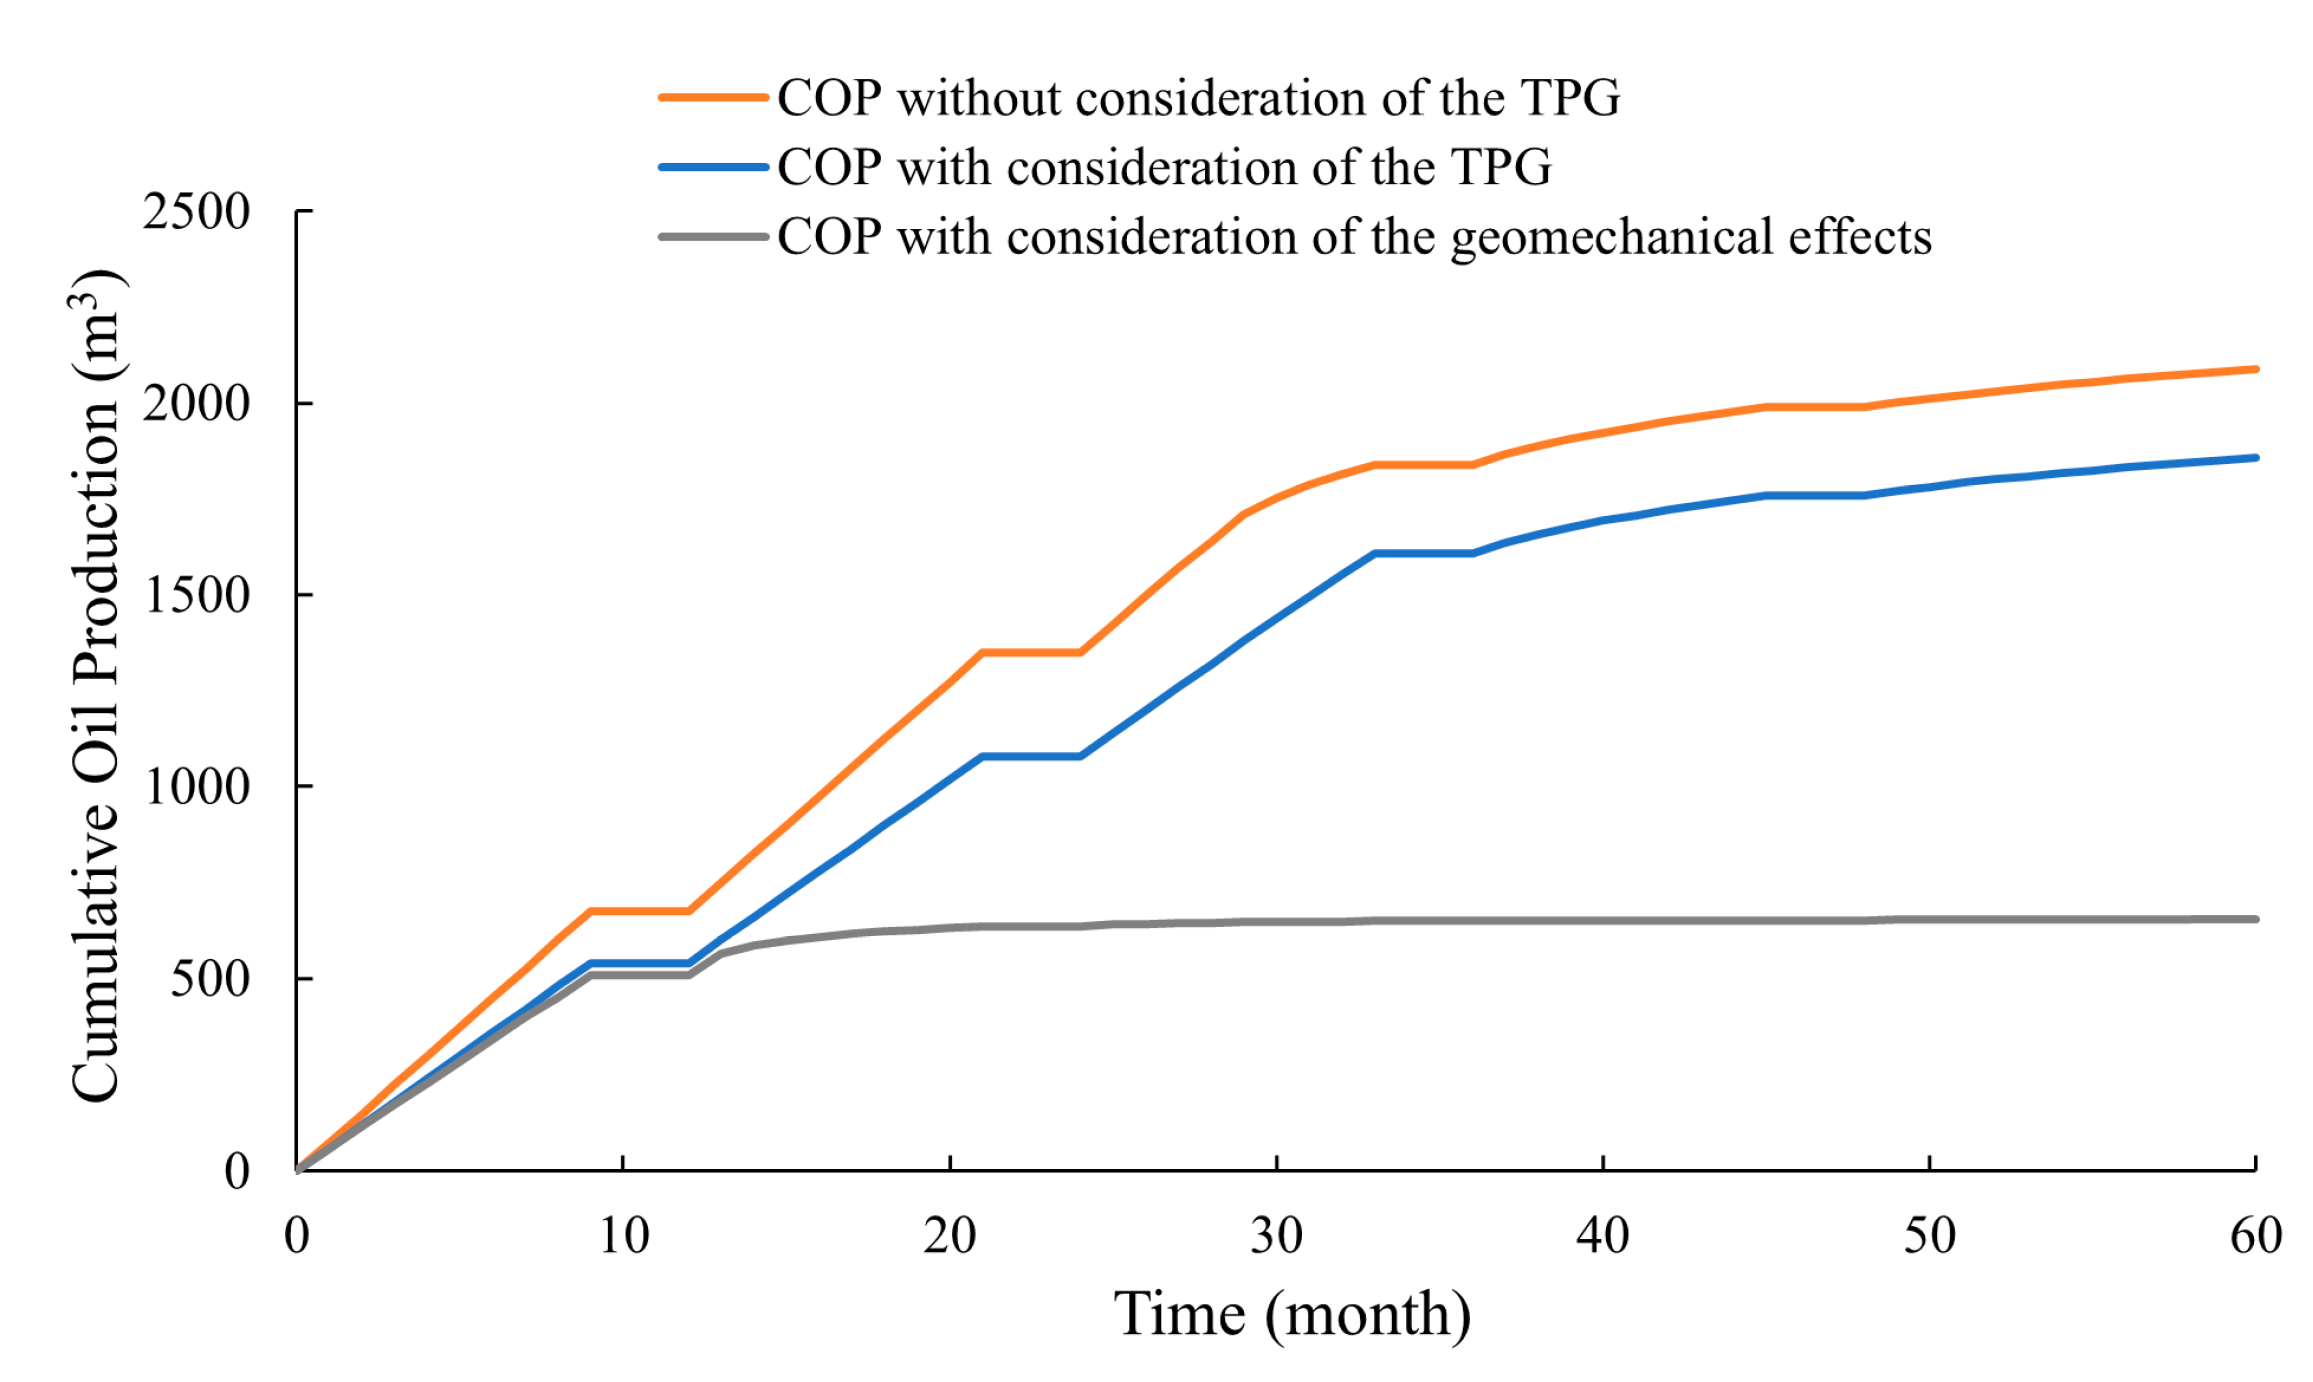
Compared with previous studies, it has been found that the influence of TPG and geomechanical effects cannot be ignored in numerical simulations of fractured tight reservoirs. The porous medium of the reservoir undergoes deformation under the coupling of flow and geomechanical effects, leading to decreases in porosity and permeability. The original development strategy under normal pressure drawdown may cause a sudden and significant change in the BHP gradient due to geomechanical effects; the COP decreased by 64.88% compared to the case where it is not considered, reducing the ultimate recovery rate of the oil field.
(2)
In the CO2-HnP simulation, injection time and number of cycles were found to notably affect COP and oil replacement ratio. A positive correlation with COP was found for parameters such as timing of production transfer injection and production time, while negative correlations were found for cycles, soaking time, and injection rate. For oil replacement ratio, soaking time and injection rate were positively correlated, while CO2 injection amount and number of cycles showed negative correlation.
(3)
With a constant injection volume, it is crucial to avoid an excessive number of cycles that reduce COP. On the basis of this parameter optimization, the oil replacement ratio can be enhanced by advancing the production transfer injection, shortening the injection time, and extending the soaking time period. These findings can help optimize CO2-HnP strategies to improve oil recovery and economic benefits from the reservoir.
This paper combines the TPG and geomechanical stress with EDFM technology, providing a universal and efficient numerical simulation method for multi-stage fractured horizontal wells in complex fractured tight oil reservoirs undergoing CO2-HnP, which has certain reference value.

Author Contributions

Writing—original draft preparation, Y.X.; writing—review and editing, X.X. and L.Z.; methodology, Y.X. and X.X.; conceptualization, G.Y.; software, Y.X.; visualization, Y.W. and Z.L. All authors have read and agreed to the published version of the manuscript.

Funding

This research was funded by the National Natural Science Foundation of China, grant number 52104020, and the 14th Five-Year Plan Major Science and Technology Project of CNOOC, project number KJGG2021-0506.

Data Availability Statement

The original contributions presented in this study are included in the article. Further inquiries can be directed to the corresponding author.

Conflicts of Interest

The authors declare no conflicts of interest.

References

  1. Zheng, M.; Li, J.Z.; Wu, X.Z.; Wang, S.; Guo, Q.; Chen, X.; Yu, J. Potential of oil and natural gas resources of main hydrocarbon-bearing basins and key exploration fields in China. Earth Sci.-J. China Univ. Geosci. 2019, 44, 833–847. [Google Scholar]
  2. Zou, C.N.; Yang, Z.; Dong, D.Z.; Zhao, Q.; Chen, Z.; Feng, Y.; Li, J.; Wang, X. Formation, distribution and prospect of unconventional hydrocarbons in source rock strata in China. Earth Sci. 2022, 47, 1517–1533. [Google Scholar]
  3. Zhou, J.; Cao, R.; Pu, B.; Wang, J.; Lv, B.; Yi, Q. Study on dynamie in-situ stress and fracture propagation of multi-cycle waterhuff-and-puff in tight oil reservoirs. Chin. J. Rock Mech. Eng. 2024, 1–13. [Google Scholar] [CrossRef]
  4. Song, Y.L.; Song, Z.J.; Zhang, Y.F.; Xie, Z.H.; Zhang, L.C.; Wang, D.G.; Hui, G. Pore scale performance evaluation and impact factors in nitrogen huff-n-puff EOR for tight oil. Pet. Sci. 2022, 19, 2932–2940. [Google Scholar] [CrossRef]
  5. Zhao, J.; Peng, M.; Qi, X.; Wen, Q.; Yang, J. Low-carbon and high-efficiency nanosheet-enhanced CO2 huff-n-puff (HnP) for heavy oil recovery. Chem. Eng. J. 2024, 500, 156875. [Google Scholar] [CrossRef]
  6. Wang, Z.; Li, S.; Li, M.; Husein, M.M. Enhanced oil recovery and carbon sequestration in low-permeability reservoirs: Comparative analysis of CO2 and oil-based CO2 foam. Fuel 2025, 381, 133319. [Google Scholar] [CrossRef]
  7. Yu, W.; Lashgari, H.R.; Wu, K.; Sepehrnoori, K. CO2 injection for enhanced oil recovery in Bakken tight oil reservoirs. Fuel 2015, 159, 354–363. [Google Scholar] [CrossRef]
  8. Zhang, K. Experimental and Numerical Investigation of Oil Recovery from Bakken Formation by Miscible CO2 Injection. In Proceedings of the SPE Annual Technical Conference and Exhibition, Dubai, United Arab Emirates, 26–28 September 2016; Society of Petroleum Engineers: Calgary, AB, Canada, 2016. [Google Scholar]
  9. Yang, Z.; Liu, X.; Zhang, Z.; Zhou, T.; Zhao, S. Physical simulation of CO2 injection in fracturing horizontal wells in tight oil reservoirs. Acta Pet. Sin. 2015, 36, 724–729. [Google Scholar]
  10. Zhang, Y.; Yu, W.; Li, Z.; Sepehrnoori, K. Simulation study of factors affecting CO2 Huff-n-Puff process in tight oil reservoirs. J. Pet. Sci. Eng. 2018, 163, 264–269. [Google Scholar] [CrossRef]
  11. Sun, R.; Zhang, Y.; Zhang, X. Productivity prediction model and parameter analysis for fractured horizontal wells in double medium tight oil reservoirs. Sci. Technol. Eng. 2019, 19, 89–96. [Google Scholar]
  12. Zhang, L.H.; Liu, S.; Yong, R.; Li, B.; Zhao, Y.L. EDFM-based numerical simulation of horizontal wells with multi-stage hydraulic fracturing in tight reservoirs. J. Southwest Pet. Univ. Sci. Technol. Ed. 2019, 41, 1–11. [Google Scholar]
  13. Mahmood, S.; Saraujo, C.; Kamy, S. Using embedded discrete fracture model (EDFM) in numerical simulation of complex hydraulic fracture networks calibrated by microseismic monitoring data. J. Nat. Gas Sci. Eng. 2018, 55, 495–507. [Google Scholar]
  14. Xiao, Z.; Zhao, Y.; Zhang, L.; Ge, F.; Yang, Z.; Liu, X.; Zhang, D.; Tian, Y. Capacity of Compact Reservoir Based on Dual Medium Embedded Discrete Crack Model. Sci. Technol. Eng. 2023, 23, 10780–10790. [Google Scholar]
  15. Moinfar, A.; Varavei, A.; Sepehrnoori, K.; Johns, R.T. Development of a novel and computationally-efficient discrete-fracture model to study ior processes in naturally fractured reservoirs. In Proceedings of the SPE Improved Oil Recovery Symposium, Tulsa, OK, USA, 14–18 April 2012; Society of Petroleum Engineers: Calgary, AB, Canada, 2012. [Google Scholar]
  16. Niu, J.; Su, J.; Yan, X.; Wang, Y.; Sun, H. Hydro-mechanical coupling model of fractured shale oil reservoir based on embedded discrete fracture model and extended finite element method. Sci. Technol. Engneering 2020, 20, 2643–2651. [Google Scholar]
  17. Liu, C.; Gupta, A.; Ates, H.; Yu, W.; Li, N.; Sepehrnoori, K. Automatic calibration of complex 3D discrete fracture networks using EDFM-Al. In Proceedings of the International Petroleum Technology Conference, Riyadh, Saudi Arabia, 21–23 February 2022; SPE: Calgary, AB, Canada, 2022. 185996-MS. [Google Scholar]
  18. Moinfar, A.; Narr, W.; Hui, M.H.; Mallison, B.; Lee, S.H. Comparison of discrete-fracture and dual-permeability models for multiphase flow in naturally fractured reservoirs. In Proceedings of the SPE Reservoir Simulation Conference, Woodlands, TX, USA, 21–23 February 2011; Society of Petroleum Engineers: Abu Dhabi, United Arab Emirates, 2011. [Google Scholar]
  19. Zhang, D.; Dai, C.; Chen, S.; Xue, L.; Liu, Y. Intelligent history matching of CO2 huff-n-puff in tight oil reservoirs considering multi-scale fracture characterization. Pet. Geol. Recovery Effic. 2022, 29, 160–167. [Google Scholar]
  20. Xiang, J.; Wei, T.; Lu, F.; Shen, J.; Liu, H.; Gao, C.C. Adaptability evaluation of DFM and EDFM discrete crack characterization methods. China Offshore Oil Gas 2023, 35, 83–90. [Google Scholar]
  21. Jiang, R.; Ni, Q.; Zhang, C.; Zhang, F.; Gao, Y.; Lin, J. Research on seepage model and numerical simulation of variable threshold pressure gradient in heavy oil reservoirs based on stress sensitivity. Oil Gas Geol. Recovery 2021, 28, 54–62. [Google Scholar]
  22. Wang, J.; Liu, H.; Liu, R.; Xu, J. Numerical simulation of low-permeability and ultra-low-permeability reservoirs con- sidering threshold pressure and stress-sensitive effects. Chin. J. Rock Mech. Eng. 2013, 32, 3317–3327. [Google Scholar]
  23. Zhu, Z.; Jia, Z.; Liu, B.; Liang, W. Numerical simulation of ultra- low permeability reservoirs considering start-up pressure gradient and fracture time-varying. China Offshore Oil Gas 2021, 33, 78–84. [Google Scholar]
  24. Zhu, M.; Wang, N.; Zhang, H. Influence of start-up pressure gradient and stress sensitivity effect on reservoir productivity. Daqing Pet. Geol. Dev. 2018, 37, 59–63. [Google Scholar]
  25. Cao, M.; Wu, X.; An, Y.; Zuo, Y.; Wang, R.; Li, P. Numerical simulation and performance evaluation of CO2 huff-n-puff processes in unconventional oil reservoirs. In Proceedings of the Carbon Management Technology Conference, Houston, TX, USA, 17 July 2017. [Google Scholar]
  26. Li, X.; Zhang, D.; Li, S. A multi-continuum multiple flow mechanism simulator for unconventional oil and gas recovery. J. Nat. Gas Sci. Eng. 2015, 26, 652–669. [Google Scholar] [CrossRef]
  27. Zhao, X.; Chen, Z.; Wang, B.; Liao, X.; Li, D.; Zhou, B. A Multi-medium and Multi-mechanism model for CO2 injection and storage in fractured shale gas reservoirs. Fuel 2023, 345, 128167. [Google Scholar] [CrossRef]
  28. Garagash, I.A.; Dubovskaya, A.V.; Korneva, D.A.; Ghasemi, M.F. Coupled Geomechanical and Fluid Flow Simulation of the Oil Field Evolution Induced by Reservoir Production. Presented at the SPE Russian Oil and Gas Exploration & Production Technical Conference and Exhibition. Moscow, Russia, 14–16 October 2014. [Google Scholar] [CrossRef]
  29. Wang, R.; Duan, Y.; Lü, X.; Guo, D.; Huang, X.; Su, D. Stress sensitivity ex- periment of deep-bed, high-pressure and low-permeability sand- stone reservoirs. Geol. Sci. Technol. Inf. 2014, 33, 90–94. [Google Scholar]
  30. Zhang, P.; Liu, C. Reservoir stress sensitivity of low permeability reservoirs and its effect on single well production. Inn. Mong. Petrochem. Ind. 2010, 36, 154–156. [Google Scholar]
Figure 1. Reservoir numerical simulation model.
Processes 12 02777 g001
Figure 2. Relative permeability curves: (a) Oil-water relative permeability curve. (b) Oil-gas relative permeability curve. (c) Capillary force curve.
Processes 12 02777 g002
Figure 3. The fitting curve of TPG and fluidity.
Processes 12 02777 g003
Figure 4. The impact of the TPG on COP.
Processes 12 02777 g004
Figure 5. Field diagram with/without consideration of the TPG. (a) Pressure field distribution without consideration of the TPG; (b) oil saturation field distribution without consideration of the TPG; (c) pressure field distribution with consideration of the TPG; (d) oil saturation field distribution with consideration of the TPG.
Processes 12 02777 g005
Figure 6. The impact of the geomechanical effects on COP.
Processes 12 02777 g006
Figure 7. Field diagram with/without consideration of the geomechanical effects. (a) Pressure field distribution without consideration of the geomechanical effects; (b) oil saturation field distribution without consideration of the geomechanical effects; (c) pressure field distribution with consideration of the geomechanical effects; (d) oil saturation field distribution with consideration of the geomechanical effects; (e) porosity field distribution without consideration of the geomechanical effects; (f) porosity field distribution with consideration of the geomechanical effects.
Processes 12 02777 g007aProcesses 12 02777 g007b
Figure 8. Well-bore grid’s porosity loss curve.
Processes 12 02777 g008
Figure 9. The impact of the geomechanical effects on average pressure.
Processes 12 02777 g009
Figure 10. The impact of BHP effects on CO2-HnP.
Processes 12 02777 g010
Figure 11. The impact of the oil recovery rate effects on COP.
Processes 12 02777 g011
Figure 12. COP and oil replacement ratio for each case.
Processes 12 02777 g012
Table 1. Basic parameters of the reservoir and fractures.
ParameterValueUnit
Model size (x × y × z)120 × 60 × 6m
Number of grid blocks (x × y × z)30 × 15 × 15-
Reservoir permeability0.1mD
Reservoir porosity17.51%
Rock compressibility8.70 × 10−5bar−1
Reservoir thickness6m
Horizontal interval length116m
Artificial fracture half-length15m
Artificial fracture height4m
Artificial fracture permeability2000mD
Average length of natural fracture 15m
Average height of natural fracture 3m
Table 3. Basic parameters of geomechanical simulation.
ParameterValueUnit
The rock cohesion value2bar
Poisson’s ratio0.2-
The angle of internal friction30-
Young’s modulus200,000bar
Table 4. Basic parameters of the CO2-HnP.
CaseTotal Time (Month)Injection Amount (m3)Number
of HnP Cycles
Timing
of Transfer (Month)
Production (Month)Injection Time (Month)Injection Rate (m3/d)Soaking (Months)
16038,00033114105.565
26048,00035115106.674
36058,00037113214.826
46068,00039116125.933
56038,000419479.172
66048,0004393133.333
76058,0004592241.674
86068,0004793188.893
96038,0005271253.334
106048,0005372160.003
116058,0005473128.892
126068,0005574113.331
136038,0006151211.114
146048,0006252133.333
156058,0006353107.412
166068,000645494.441
Table 6. Feature weights in the Random Forest model.
FactorCOPOil Replacement Ratio
Total CO2 injection amount0.1010.506
Number of huff-n-puff cycles0.1300.013
Timing of production transfer injection0.2790.272
Production time0.1090.012
Injection time0.0960.036
CO2 injection rate0.1460.059
Soaking time0.1380.101
Table 7. The Pearson correlation coefficients of each factor.
FactorCOPOil Replacement Ratio
Total CO2 injection amount0.155−0.971 **
Number of huff-n-puff cycles−0.537 *−0.073
Timing of production transfer injection0.410−0.711 **
Production time0.2510.039
Injection time0.164−0.532 *
CO2 injection rate−0.0280.100
Soaking time−0.2790.514 *
* p < 0.05 ** p < 0.01.
Disclaimer/Publisher’s Note: The statements, opinions and data contained in all publications are solely those of the individual author(s) and contributor(s) and not of MDPI and/or the editor(s). MDPI and/or the editor(s) disclaim responsibility for any injury to people or property resulting from any ideas, methods, instructions or products referred to in the content.

