Article

Molecular Dynamics of CO₂ Stripping Oil on Quartz Surfaces

State Key Laboratory of Petroleum Resources and Prospecting, China University of Petroleum (Beijing), Beijing 102249, China
*
Author to whom correspondence should be addressed.
Processes 2024, 12(12), 2776; https://doi.org/10.3390/pr12122776
Submission received: 6 November 2024 / Revised: 23 November 2024 / Accepted: 2 December 2024 / Published: 6 December 2024

Abstract

:
The CO2-enhanced oil recovery (EOR) technology has the dual significance of enhancing oil recovery and realizing carbon storage in onshore and offshore oil and gas exploitation. This study investigates the adsorption of crude oil components on quartz surfaces and the microscopic mechanisms of CO2 stripping from crude oil using molecular dynamics simulations. A four-component model representing C6H14, benzene, resins, and asphaltenes was constructed to simulate the oil phase, while the quartz surface model was created using Materials Studio. Simulations were conducted under different temperature conditions to understand the distribution and adsorption behavior of crude oil components, as well as the impact of CO2 on the oil film at pressures up to 10 MPa. The results indicate that the resin–asphaltene interactions are significantly weakened at elevated temperatures, affecting the adsorption capacity. Furthermore, CO2 stripping primarily extracts light components such as C6H14 and aromatic hydrocarbons, while heavy components remain in the oil phase. The highest extraction efficiency and expansion effect of CO2 were observed at 35 °C, demonstrating optimal conditions for enhanced oil recovery through CO2 flooding. These findings provide insights into the effective use of CO2 for crude oil extraction and its interactions with oil components on a quartz substrate, which is crucial for optimizing CO2-enhanced oil recovery operations.

1. Introduction

According to statistics from the International Energy Agency (IEA), relying on CCUS technology has the potential to reduce CO2 emissions by 76 × 108 tons [1]. Among numerous CCUS technologies, CO2-enhanced oil recovery (CO2-EOR) has garnered significant attention. By improving the physical properties of crude oil and replenishing reservoir energy, CO2-EOR can substantially enhance the oil recovery factors. In addition, it allows for the sequestration of greenhouse gases underground, facilitating the efficient utilization of CO2. According to statistics, there are over 200 gas injection projects worldwide, and 70% of them are CO2-EOR projects. In 2014, the annual EOR oil production using CO2 in the United States was 1.371 × 10⁴ tons [2], accounting for approximately 93% of the annual total global CO2-EOR oil production. Moreover, this technology has been widely used in China, especially in low-permeability reservoirs, where it generally increases the oil recovery rate by around 6% to 20% [3], showing significant oil displacement effectiveness.
During the process of CO2-EOR, the changes in crude oil properties mainly stem from the interactions between CO2 and crude oil components. Research has shown that the main mechanisms of CO2-EOR are swelling, extraction, viscosity reduction, and improvement in the oil–gas interfacial tension on crude oil components [4,5]. After injection of CO2 into the reservoir, it undergoes dissolution and diffusion, which leads to a reduction in the viscosity of the crude oil [6] and causes its volume to expand to approximately 1.1 to 2.0 times its original volume. CO2 exhibits strong dissolution selectivity for light components from crude oil [7,8] and achieves high recovery factors of up to 90% [9]; conventional water flooding experiments typically yield recovery rates of 35% to 50% [10], conventional steam flooding experiments yield recovery rates of 50% to 60% [11,12], and conventional chemical flooding experiments generally yield recovery rates around 55% to 65% [13]. Especially in tight reservoirs and shale reservoirs, the flow of crude oil is poor [14,15,16], water is difficult to inject, and CO2 is often used as a displacement fluid. Further research on the mechanisms of interaction between CO2 and crude oil components on the surfaces of rocks is highly necessary. Molecular dynamics simulation methods have been widely applied in this field of research [17,18]. This method allows the analysis of the distribution characteristics of various component molecules and the changes in their interactions at a microscopic scale. It is possible to investigate the adsorption mechanism of crude oil on rock surfaces and the stripping effect of CO2 on the quartz surface of crude oil components.
The interaction between CO2 and crude oil must account for rock surface effects [19,20]. The dissolution and stripping behavior of CO2 on rock surfaces involves competitive adsorption between CO2 and crude oil components [21]. The adsorption strength directly affects crude oil fluidity. Hong et al. [22] used molecular dynamics simulations to study the competitive adsorption of asphaltene and n-heptane on quartz, finding that asphaltene adsorption is significantly stronger. During CO2-EOR, CO2 selectively dissolves light alkanes, while heavy components like asphaltene may accumulate over time, potentially causing reservoir plugging and reducing crude oil fluidity [23]. Higher temperatures reduce alkane adsorption on rock surfaces, while pressure has a minimal effect [24]. Zhang et al. [25] simulated octane adsorption on various mineral surfaces and found it adsorbs most strongly on organic surfaces, with weaker adsorption on quartz. Li et al. [26] confirmed similar behavior experimentally. These findings suggest that rock surfaces exhibit strong adsorption of crude oil components, impeding their natural desorption. However, CO2-EOR effectively overcomes this challenge, facilitating the release of these components. Wang et al. [27] used molecular dynamics simulations to examine different gases (CO2, N2, CH4, and C3H8) and found that CO2 has superior stripping effects on crude oil components compared to other gases. Zhang’s study [28] of CO2 stripping in octane systems at different temperatures showed CO2–octane interactions as the main cause of crude oil system swelling. Santos et al. [29] simulated CO2 and normal alkane adsorption on calcite surfaces, showing CO2 displaces adsorbed hydrocarbons, with calcium sites controlling adsorption capacity. They suggested that CO2 injection into tight oil and gas reservoirs could enhance recovery. Most studies use single-component crude oil models, which may not represent the actual crude oil complexity. Thus, it is important to use multi-component models to better reflect the crude oil diversity.
To address the limitations of single-component crude oil models, a two-component model (n-hexane, n-decane) was developed to study the minimum miscibility pressure (MMP) during CO2 flooding, revealing that MMP increases with temperature [30]. A four-component model (C6, C10, C19, and C30) showed that CO2 has a greater effect on crude oil swelling compared to methane and ethane [19]. Another four-component model (n-decane, n-octane, n-hexane, and cyclohexane) indicated that increased pressure, lower temperature, and straight-chain alkanes enhance CO2-induced swelling [31]. The effectiveness of CO2 in stripping crude oil components and enhancing recovery was demonstrated using a CO2/multi-component oil film model [32]. Multi-component models thus provide a more realistic representation of crude oil behavior.
Therefore, considering the limitations that single-component crude oil systems cannot fully represent real crude oil and taking into account previous research [19,31,32], this study has established a four-component crude oil model (C6H14, benzene, resins, and asphaltenes) using Materials Studio software (https://www.3ds.com/products/biovia/materials-studio, accessed on 5 November 2024). Additionally, surface models of quartz and a CO2 model were established for the study. By analyzing the movement of CO2 molecules and the four components of crude oil at different temperature conditions, as well as studying the interactions between the components and saturated hydrocarbon in the systems, and the interactions between the components and the quartz surface, this study investigated the adsorption of crude oil components on the quartz surface and the stripping effect of CO2 on the surface.

2. Molecular Dynamics Simulation of Crude Oil Adsorption on the Quartz Surface

2.1. Model Establishment

The initial model for CO2 stripping from the quartz surface and crude oil system in this study comprises three independent phases: the oil phase, composed of alkane molecules; the solid phase, composed of SiO2 molecules; and the gas phase, composed of CO2 molecules. Many related studies have used single crude oil components, such as n-hexane, n-decane, and n-dodecane, for molecular dynamics simulations [31]. While these single-component simulations reduce the computational complexity and facilitate pattern analysis, they may lack representativeness for crude oil. To address this limitation and better simulate crude oil, this study follows previous research [32,33] and establishes a four-component crude oil model represented by C6H14, benzene, resins, and asphaltenes. Among them, the alkane single-molecule models of crude oil components are shown in Figure 1.
For the simulation of the crude oil adsorption on the quartz surface, this study utilized the Materials Studio software to construct the quartz surface model and the oil phase system model. The quartz molecular model was imported from the Materials Studio database and was further processed to obtain a slab of quartz with the dimensions of 54.04 Å × 54.04 Å × 12.76 Å by cutting and supercell operations. Considering the wetting properties of the quartz surface, the exposed quartz crystal surfaces were hydroxylated.
The parameters for the crude oil component molecules were set based on the crude oil properties data in Table 1.
In the oil phase system model, the dimensions in the X- and Y-directions are the same as those of the quartz model, while the length in the Z-direction is based on the density of the crude oil sample. The model is illustrated in Figure 2.
The molecular dynamics simulations were conducted using the NVT (constant number of particles, volume, and temperature) ensemble. The initial temperature of the model was set to 25 °C, with a time step of 1 fs and a total simulation duration of 500 ps. Trajectories and data were saved every 1 ps during the simulation. The Andersen thermostat was used to control the temperature. The COMPASS force field was employed for the interactions, with the Coulombic interactions calculated using the Ewald summation method and van der Waals interactions using the atom-based summation method. To further investigate the impact of the temperature on the distribution of crude oil on the quartz surface, after the system reached equilibrium, three additional molecular dynamics simulations were performed, each with a duration of 200 ps, while keeping the ensemble constant. The temperatures were set to 35 °C, 45 °C, and 55 °C, respectively.

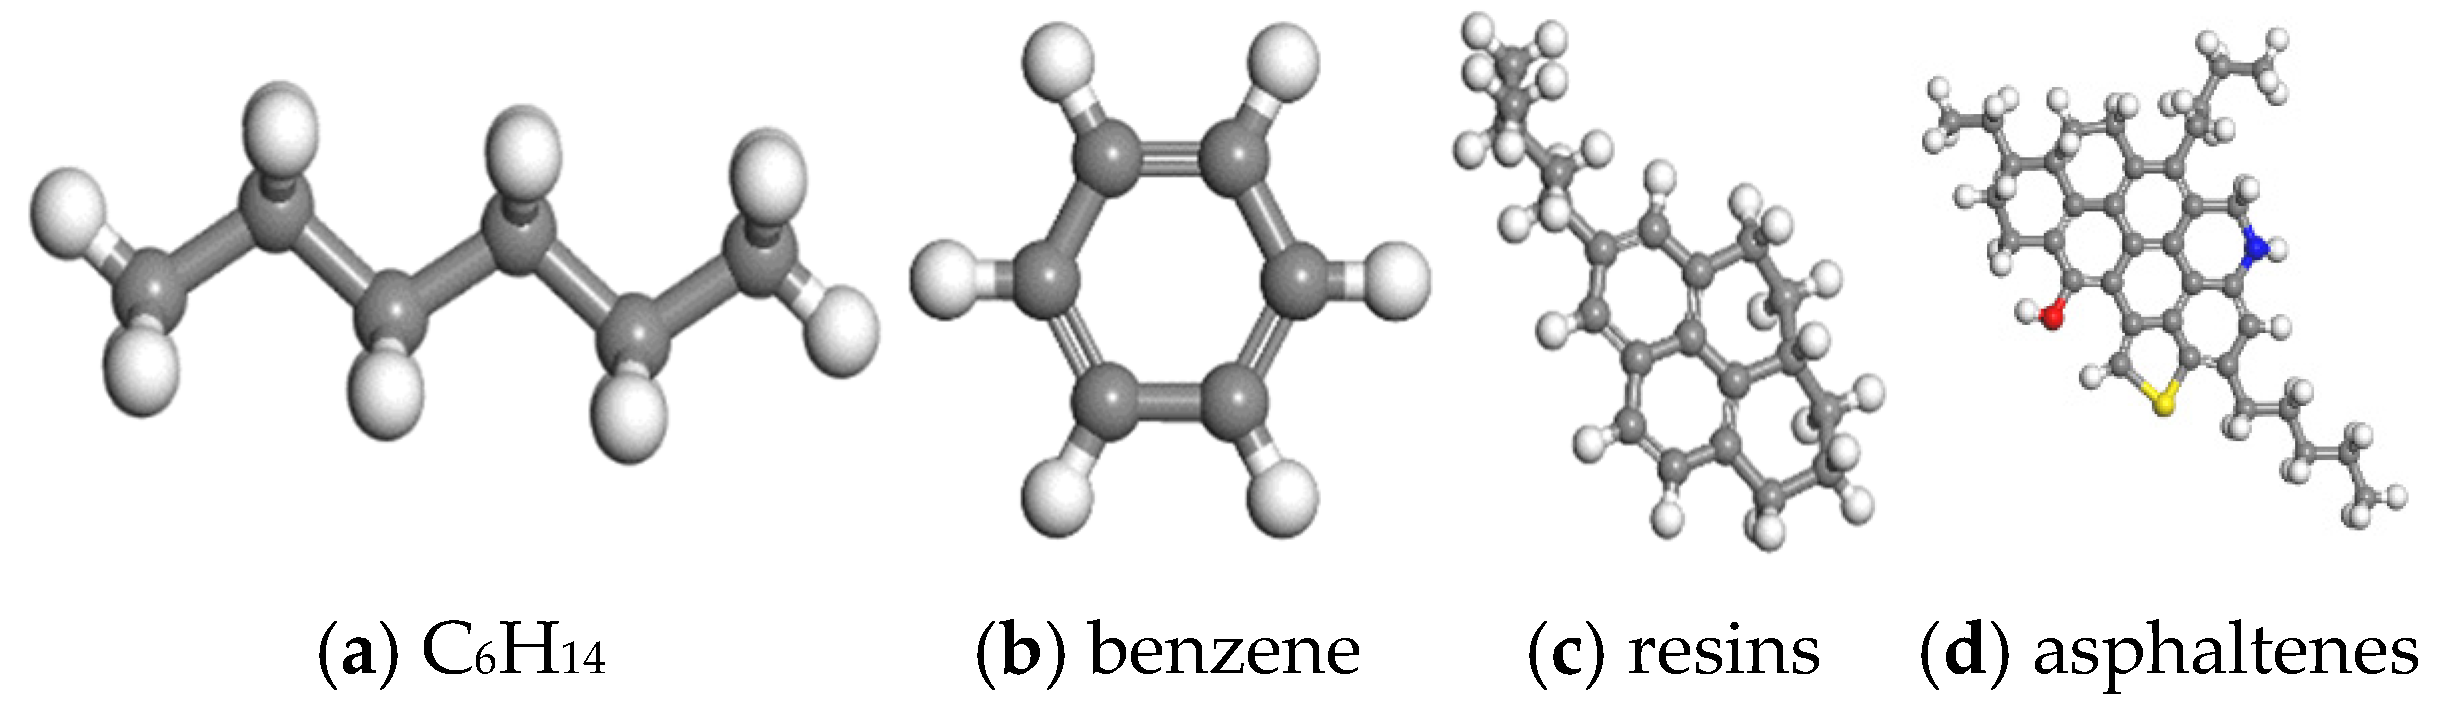
2.2. Simulation of Crude Oil Component Adsorption on Quartz Surface

The distribution of asphaltene and resin in crude oil on the quartz surface at different temperatures is shown in Figure 3. Figure 3(a0–d0) represent the top view along the Z-axis, illustrating the distribution of asphaltene and resin in the X- and Y-directions. Figure 3(a1–d1) and Figure 3(a2–d2) are side views, providing detailed information about the distribution of asphaltene.
The presence of resin significantly influences the distribution of asphaltene. As shown in Figure 3(a1), asphaltene molecules are adsorbed alongside resin molecules, with one resin molecule adsorbing one asphaltene molecule above and below to form an aggregate. As the temperature increases from 25 °C to 55 °C, the interaction between the resin and asphaltene weakens, leading to a reduced adsorption capacity of resin for asphaltene. Consequently, the asphaltene molecules above the resin gradually dissociate from the aggregate. Resin also plays a critical role in the dispersion and adsorption of asphaltene. From Figure 3(a0–d0), it can be observed that resin molecules surround many asphaltene molecules, separating them and interacting with them to prevent asphaltene aggregation.
The distribution of the aromatic hydrocarbons and C6H14 on the quartz surface at different temperatures is shown in Figure 4 and Figure 5. From Figure 4, it can be observed that some aromatic hydrocarbons are adsorbed on the quartz surface, while others are dispersed in the oil phase, either as individual molecules or in small clusters. As the temperature increases, the number of aromatic hydrocarbons adsorbed on the quartz surface decreases while the number dispersed in the oil phase increases. Figure 5 shows that at 25 °C, a small amount of C6H14 is adsorbed on the quartz surface, with the majority of C6H14 entangled and distributed in the oil phase. As the temperature increases, the movement of saturated hydrocarbon molecules in the oil phase intensifies, causing them to gradually separate into individual entities.

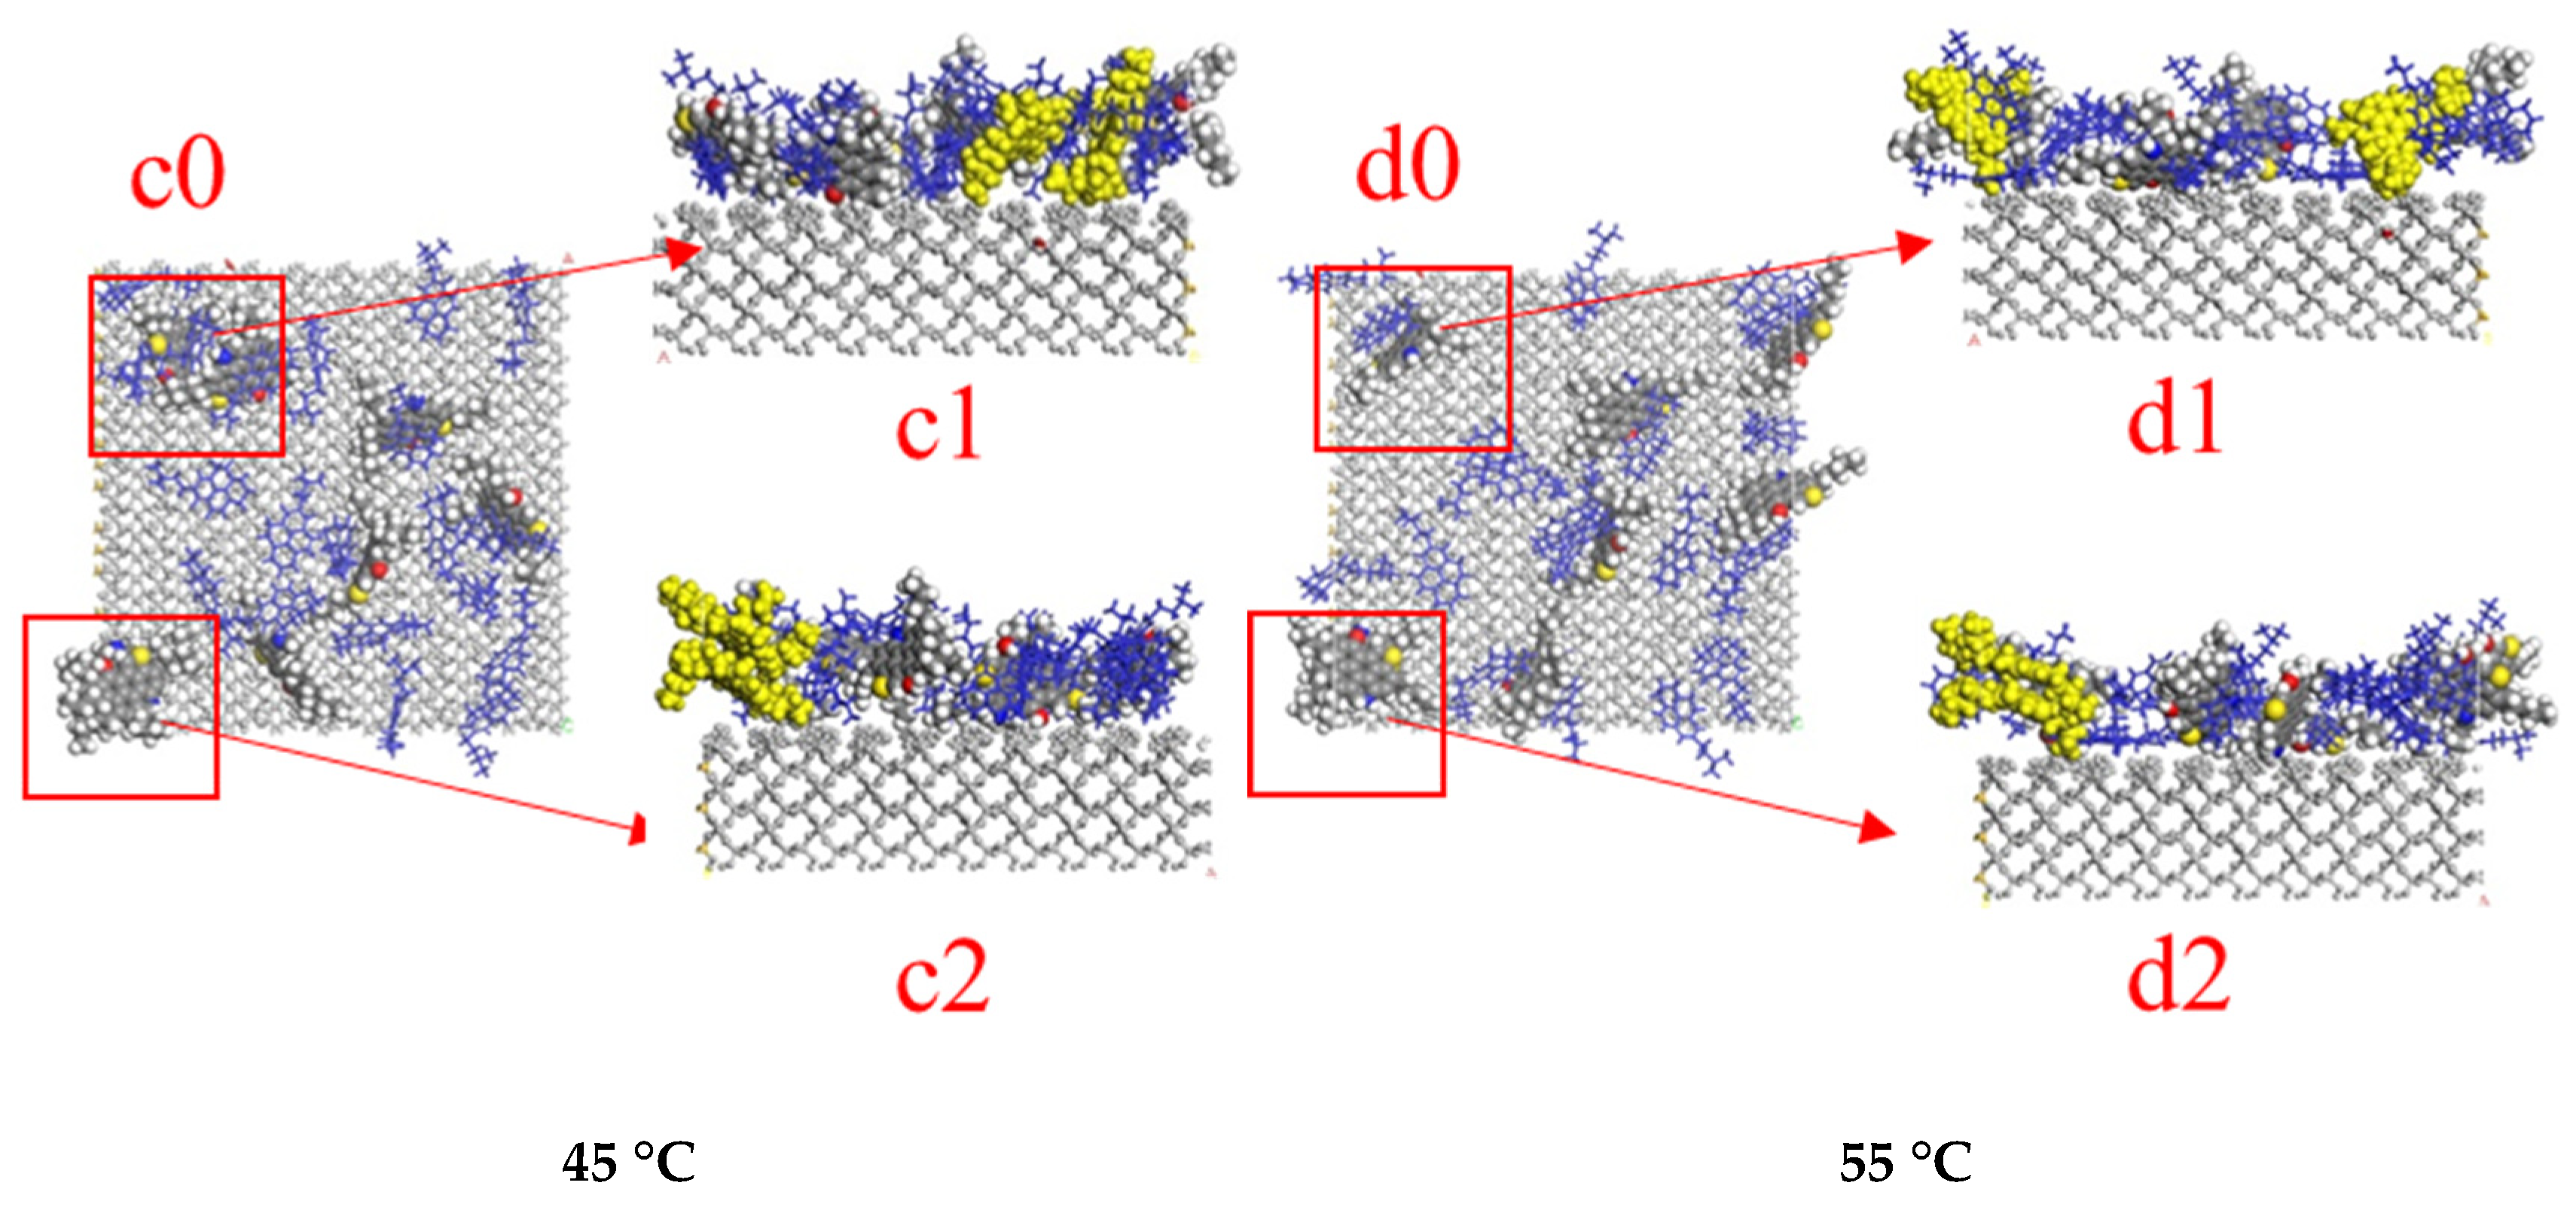
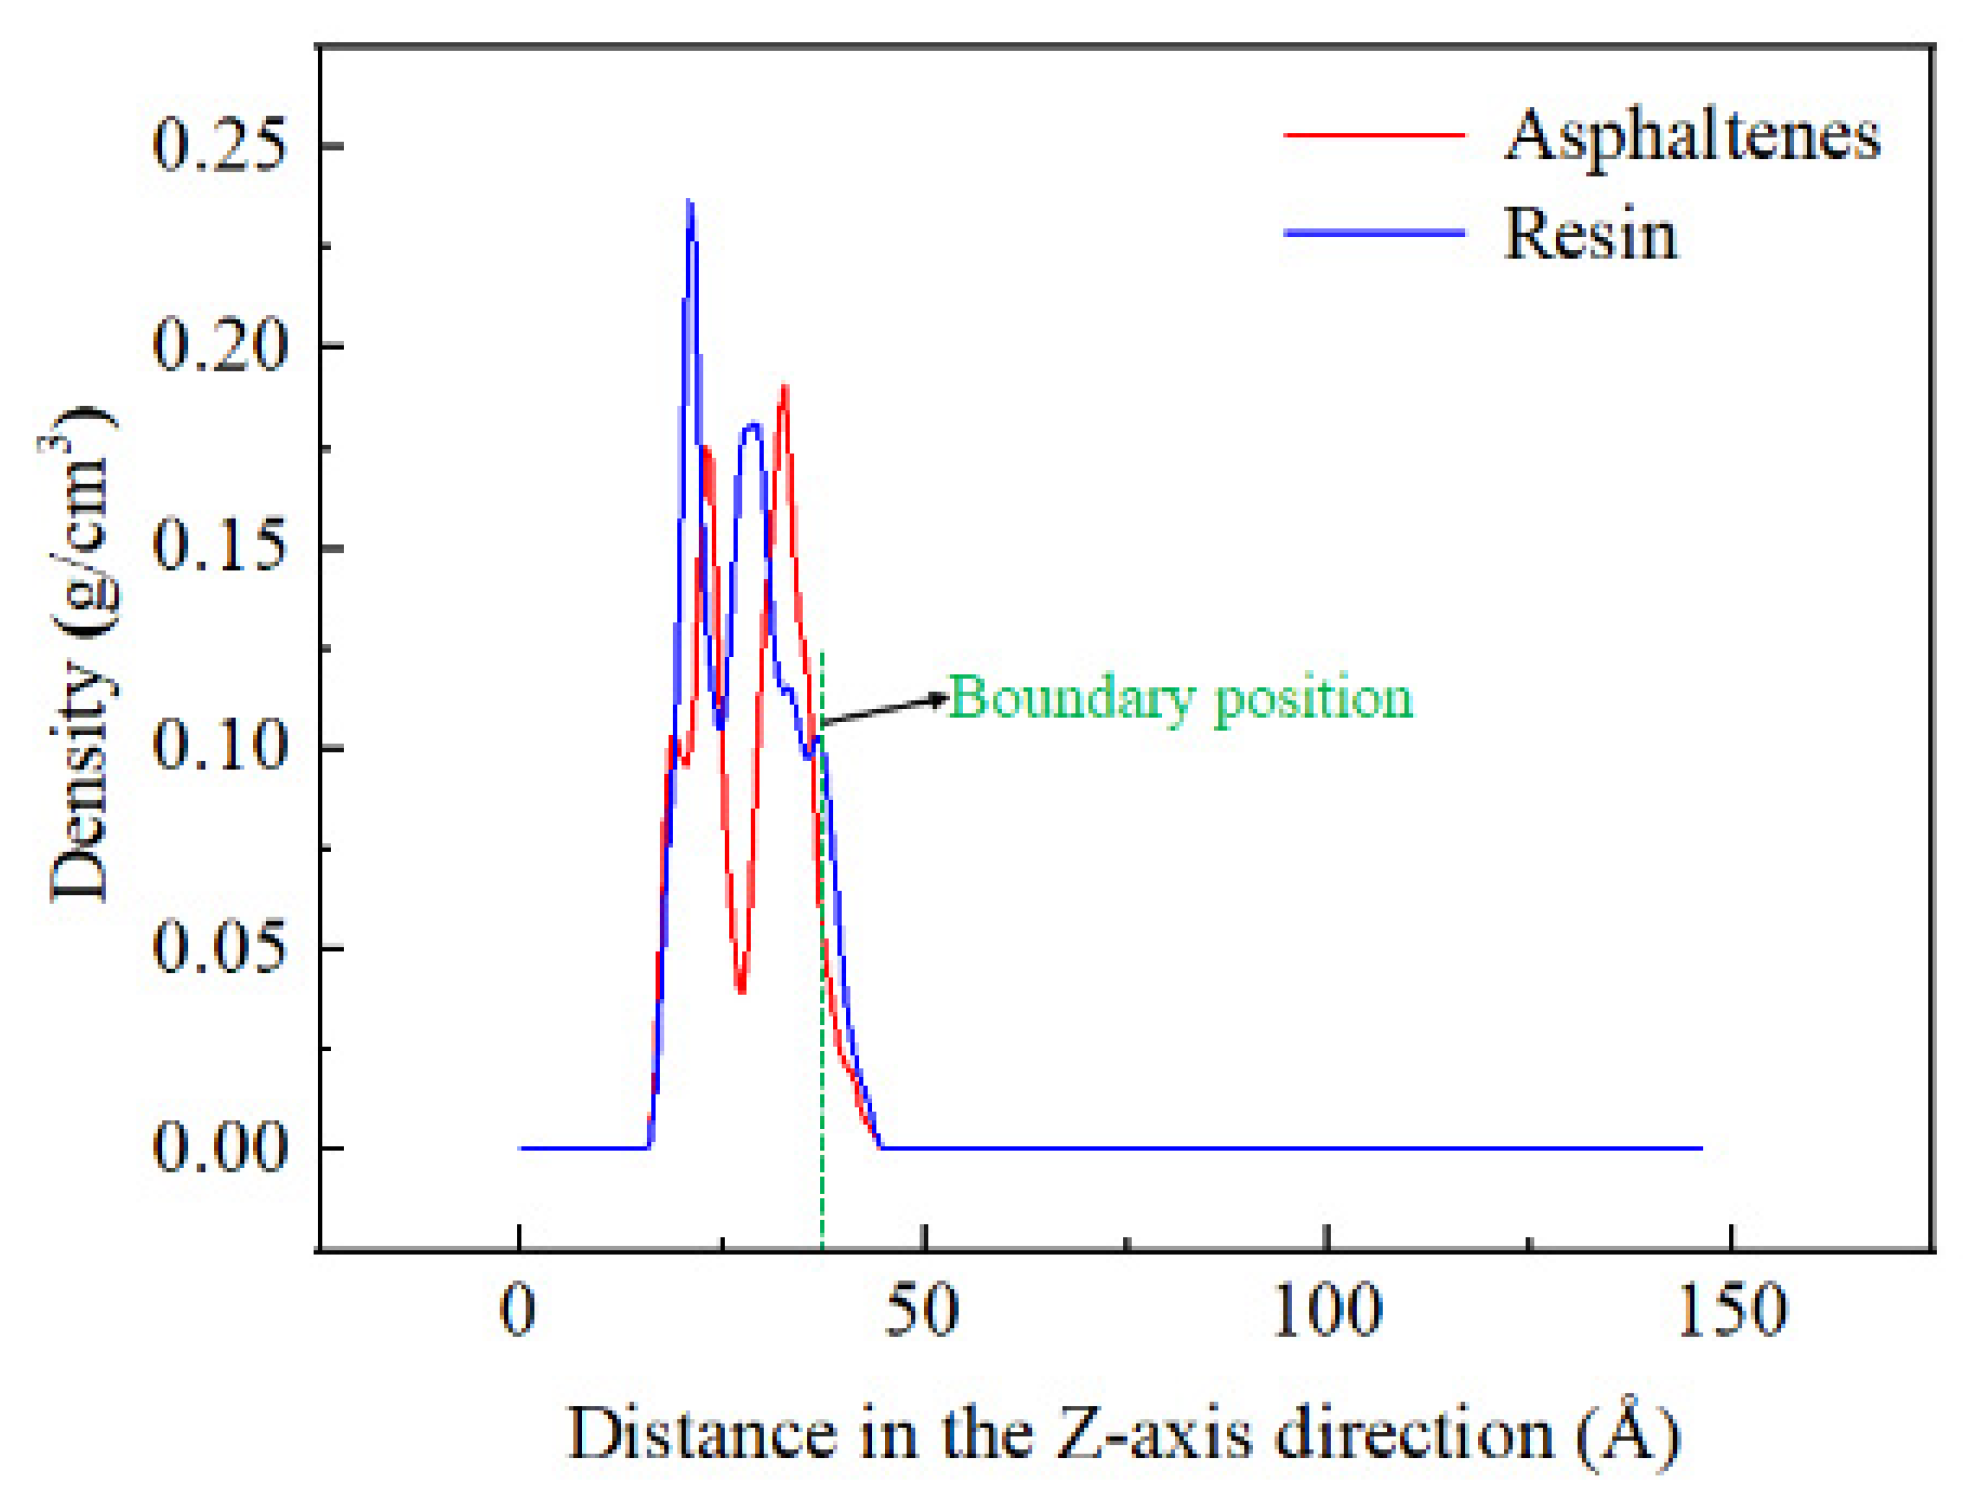
2.3. Analysis of the Distribution Characteristics of Crude Oil Components on Quartz Surface

The distribution characteristics of the crude oil components on the quartz surface were quantitatively analyzed by examining the density distribution of each component along the Z-direction under different temperature conditions, as shown in Figure 6. From Figure 6a, it can be observed that at 25 °C, aromatic hydrocarbons exhibit three peaks with decreasing heights, located at 18.3 Å, 22.8 Å, and 29.3 Å, respectively, indicating a distribution roughly divided into three layers, with the number of molecules decreasing in each layer. C6H14 shows a peak at 18.3 Å and a broad peak in the range of 24.3 Å to 32.8 Å. Both asphaltene and resin exhibit a broad peak between 18.3 Å and 27.8 Å. The distribution curves of each component indicate that a significant amount of aromatic hydrocarbons and some C6H14 occupy the lowest layer of the oil phase, adsorbed on the quartz surface, followed by asphaltene and resin, with some aromatic hydrocarbons and C6H14 interspersed in the middle layer. Finally, a large amount of C6H14 and a small amount of aromatic hydrocarbons are distributed in the upper layer of the oil phase.
By comparing Figure 6a–d, it can be observed that as the temperature increases from 25 °C to 45 °C, the number of aromatic hydrocarbons adsorbed on the quartz surface changes slightly, while those in the middle layer gradually migrate to the upper layer of the oil phase. Meanwhile, the amount of C6H14 adsorbed on the quartz surface decreases, with a tendency to migrate to the middle and upper layers of the oil phase. At 55 °C, the increased molecular kinetic energy leads to a significant reduction in the number of aromatic hydrocarbons adsorbed on the quartz surface. Some C6H14 and resin molecules become adsorbed on the quartz surface, resulting in an increase in the number of saturated hydrocarbon molecules leaving the oil phase. Additionally, Figure 6 shows that the distribution curves of asphaltene and resin are very similar in terms of the peak positions and shapes, indicating a close association between the two. Within the temperature range of 25 °C to 55 °C, the distribution curve of asphaltene undergoes only minor changes, suggesting that the temperature has a limited impact on the distribution and migration of asphaltene at lower temperatures.
As the temperature increases, the molecular kinetic energy rises, enhancing molecular mobility. To analyze the change in mobility, mean square displacement (MSD) was introduced, as shown in Figure 7. By examining the position distribution of the four components with temperature variations, it can be observed that the mobility of C6H14 and aromatic hydrocarbons is higher than that of the resin and asphaltene. This conclusion is clearly confirmed by comparing the mean square displacements.
Figure 7 shows that under all temperature conditions, the mean square displacement (MSD) of C6H14 is the highest, followed by the aromatic hydrocarbons and resins, while the asphaltenes have the lowest MSD. As the temperature increases, the rise in MSD is particularly pronounced for C6H14, followed by aromatic hydrocarbons, while the changes in MSD for other components are relatively minor. This indicates that the temperature has a significant impact on the mobility of the lighter components.
The adsorption and distribution of the crude oil components (asphaltene, resin, aromatic hydrocarbons, and C6H14) on quartz surfaces were studied at different temperatures. An increasing temperature weakens the resin–asphaltene interaction, reducing adsorption. Aromatic hydrocarbons and C6H14 showed a decreased adsorption on quartz and an increased dispersion in the oil phase, while the asphaltene distribution remained mostly unaffected. The mean square displacement analysis indicated higher mobility for the C6H14 and aromatic hydrocarbons compared to the resin and asphaltene, with the temperature having a significant impact on the lighter components.

3. Microscopic Mechanism of CO2 Stripping from Crude Oil

3.1. Model Establishment

To study the microscopic process of CO2 flooding in oil reservoirs, the CO2 phase was added to the adsorption model established in Section 2.1. The simulations were conducted at initial pressures of 10 MPa and temperatures of 25 °C, 35 °C, 45 °C, and 55 °C, respectively. Based on the temperature and pressure conditions, the initial density of CO2 was set to 0.818 g/cm3, 0.713 g/cm3, 0.498 g/cm3, and 0.325 g/cm3, respectively, by referring to data from the National Institute of Standards and Technology (NIST) database. A layer of CO2 molecules with a density of 1.5 g/cm3 was added at the top of the CO2 phase and fixed to prevent CO2 molecules from overflowing [34]. A vacuum layer of 10 Å was added above the CO2 molecule layer to eliminate the influence of longitudinal periodicity. The model is depicted in Figure 8. The simulation parameters were set similarly to the adsorption model, and the simulation time was set to 4 ns.

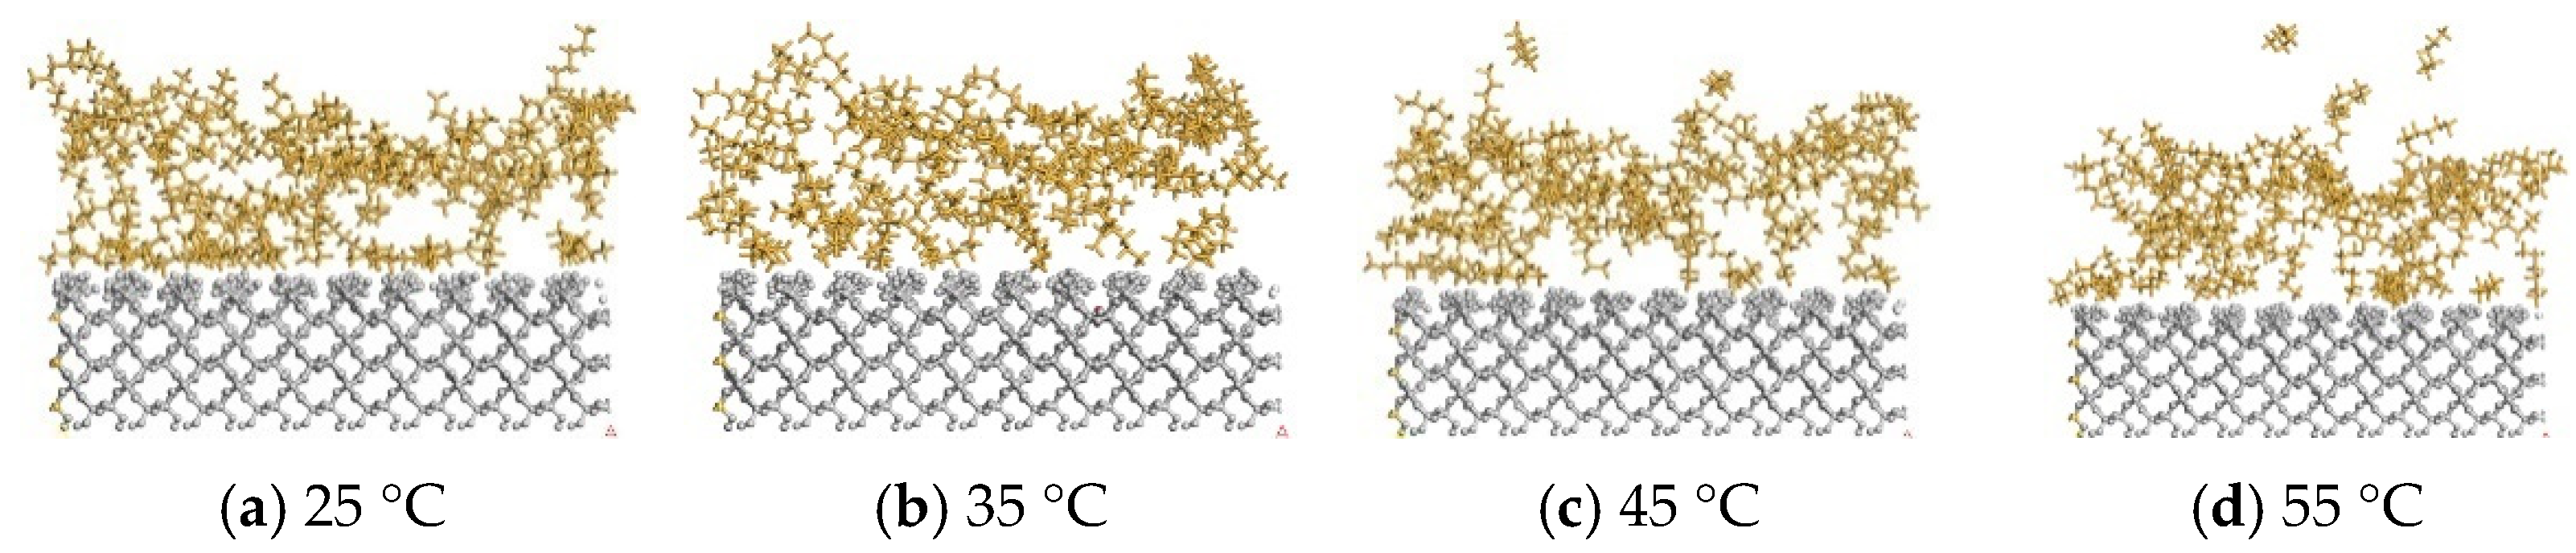
3.2. The Impact of Temperature on Oil Stripping

The final configurations of the CO2 stripping of oil models under different temperature conditions are shown in Figure 9. It can be observed that within the temperature range of 25 °C to 55 °C, CO2 has significant swelling and extraction effects on the oil film. CO2 molecules diffuse into the oil film, altering the interactions between oil molecules and causing the film to expand. The CO2 phase can effectively extract oil components, causing them to transition from the oil phase to the gas phase. The swelling and extraction effects of CO2 on the oil film vary with temperature.
Figure 10 shows the density distribution of the four oil components along the Z-axis in the final configurations under different temperature conditions. The dashed lines represent the initial distribution of the components, while the solid lines represent the final distribution. By comparing these graphs, the characteristics and differences in each system configuration can be observed. From Figure 10a,b, it can be seen that the distribution curves of the asphaltene and resin molecules have changed compared to the initial state. The peak heights have decreased, and the distribution range of the peaks has slightly expanded. This indicates that CO2 has dissolved into the oil phase, causing some asphaltene and resin molecules to migrate outward along the Z-axis. However, these molecules remain within the oil phase and do not enter the CO2 phase. As the temperature increases, the extent of the migration of asphaltene and resin molecules decreases, with this trend being more pronounced for the asphaltene molecules.
Figure 10c illustrates the distribution changes in the aromatic hydrocarbons. Initially, there is a peak near 18.3 Å for all temperatures. In the final state, this peak remains but with a significantly reduced height, and there is a noticeable increase in the distribution range of small oscillations along the Z-axis. As the temperature increases, the number of small oscillations decreases, indicating that, initially, a large number of aromatic hydrocarbon molecules are adsorbed on the quartz surface. With the dissolution of CO2, most of the aromatic hydrocarbon molecules desorb and disperse into the oil phase, while some molecules leave the oil phase and enter the CO2 phase. As the temperature increases, the number of aromatic hydrocarbon molecules entering the CO2 phase decreases.
Figure 10d shows the distribution of the saturated hydrocarbon molecules. Initially, the distribution curves at all temperatures consist of a peak and a broader, higher peak, indicating that saturated hydrocarbon molecules are partly adsorbed on the quartz surface and partly evenly distributed in the oil phase. In the final state, both the peak and the broader peak exhibit significantly reduced heights, and the primary peak becomes less pronounced. The range of the broader peak has approximately doubled, and there are more small peaks extending further along the Z-axis. This indicates that CO2 dissolution significantly reduces the number of saturated hydrocarbon molecules adsorbed on the quartz surface, increases their dispersion within the oil phase, and allows some molecules to enter the CO2 phase.

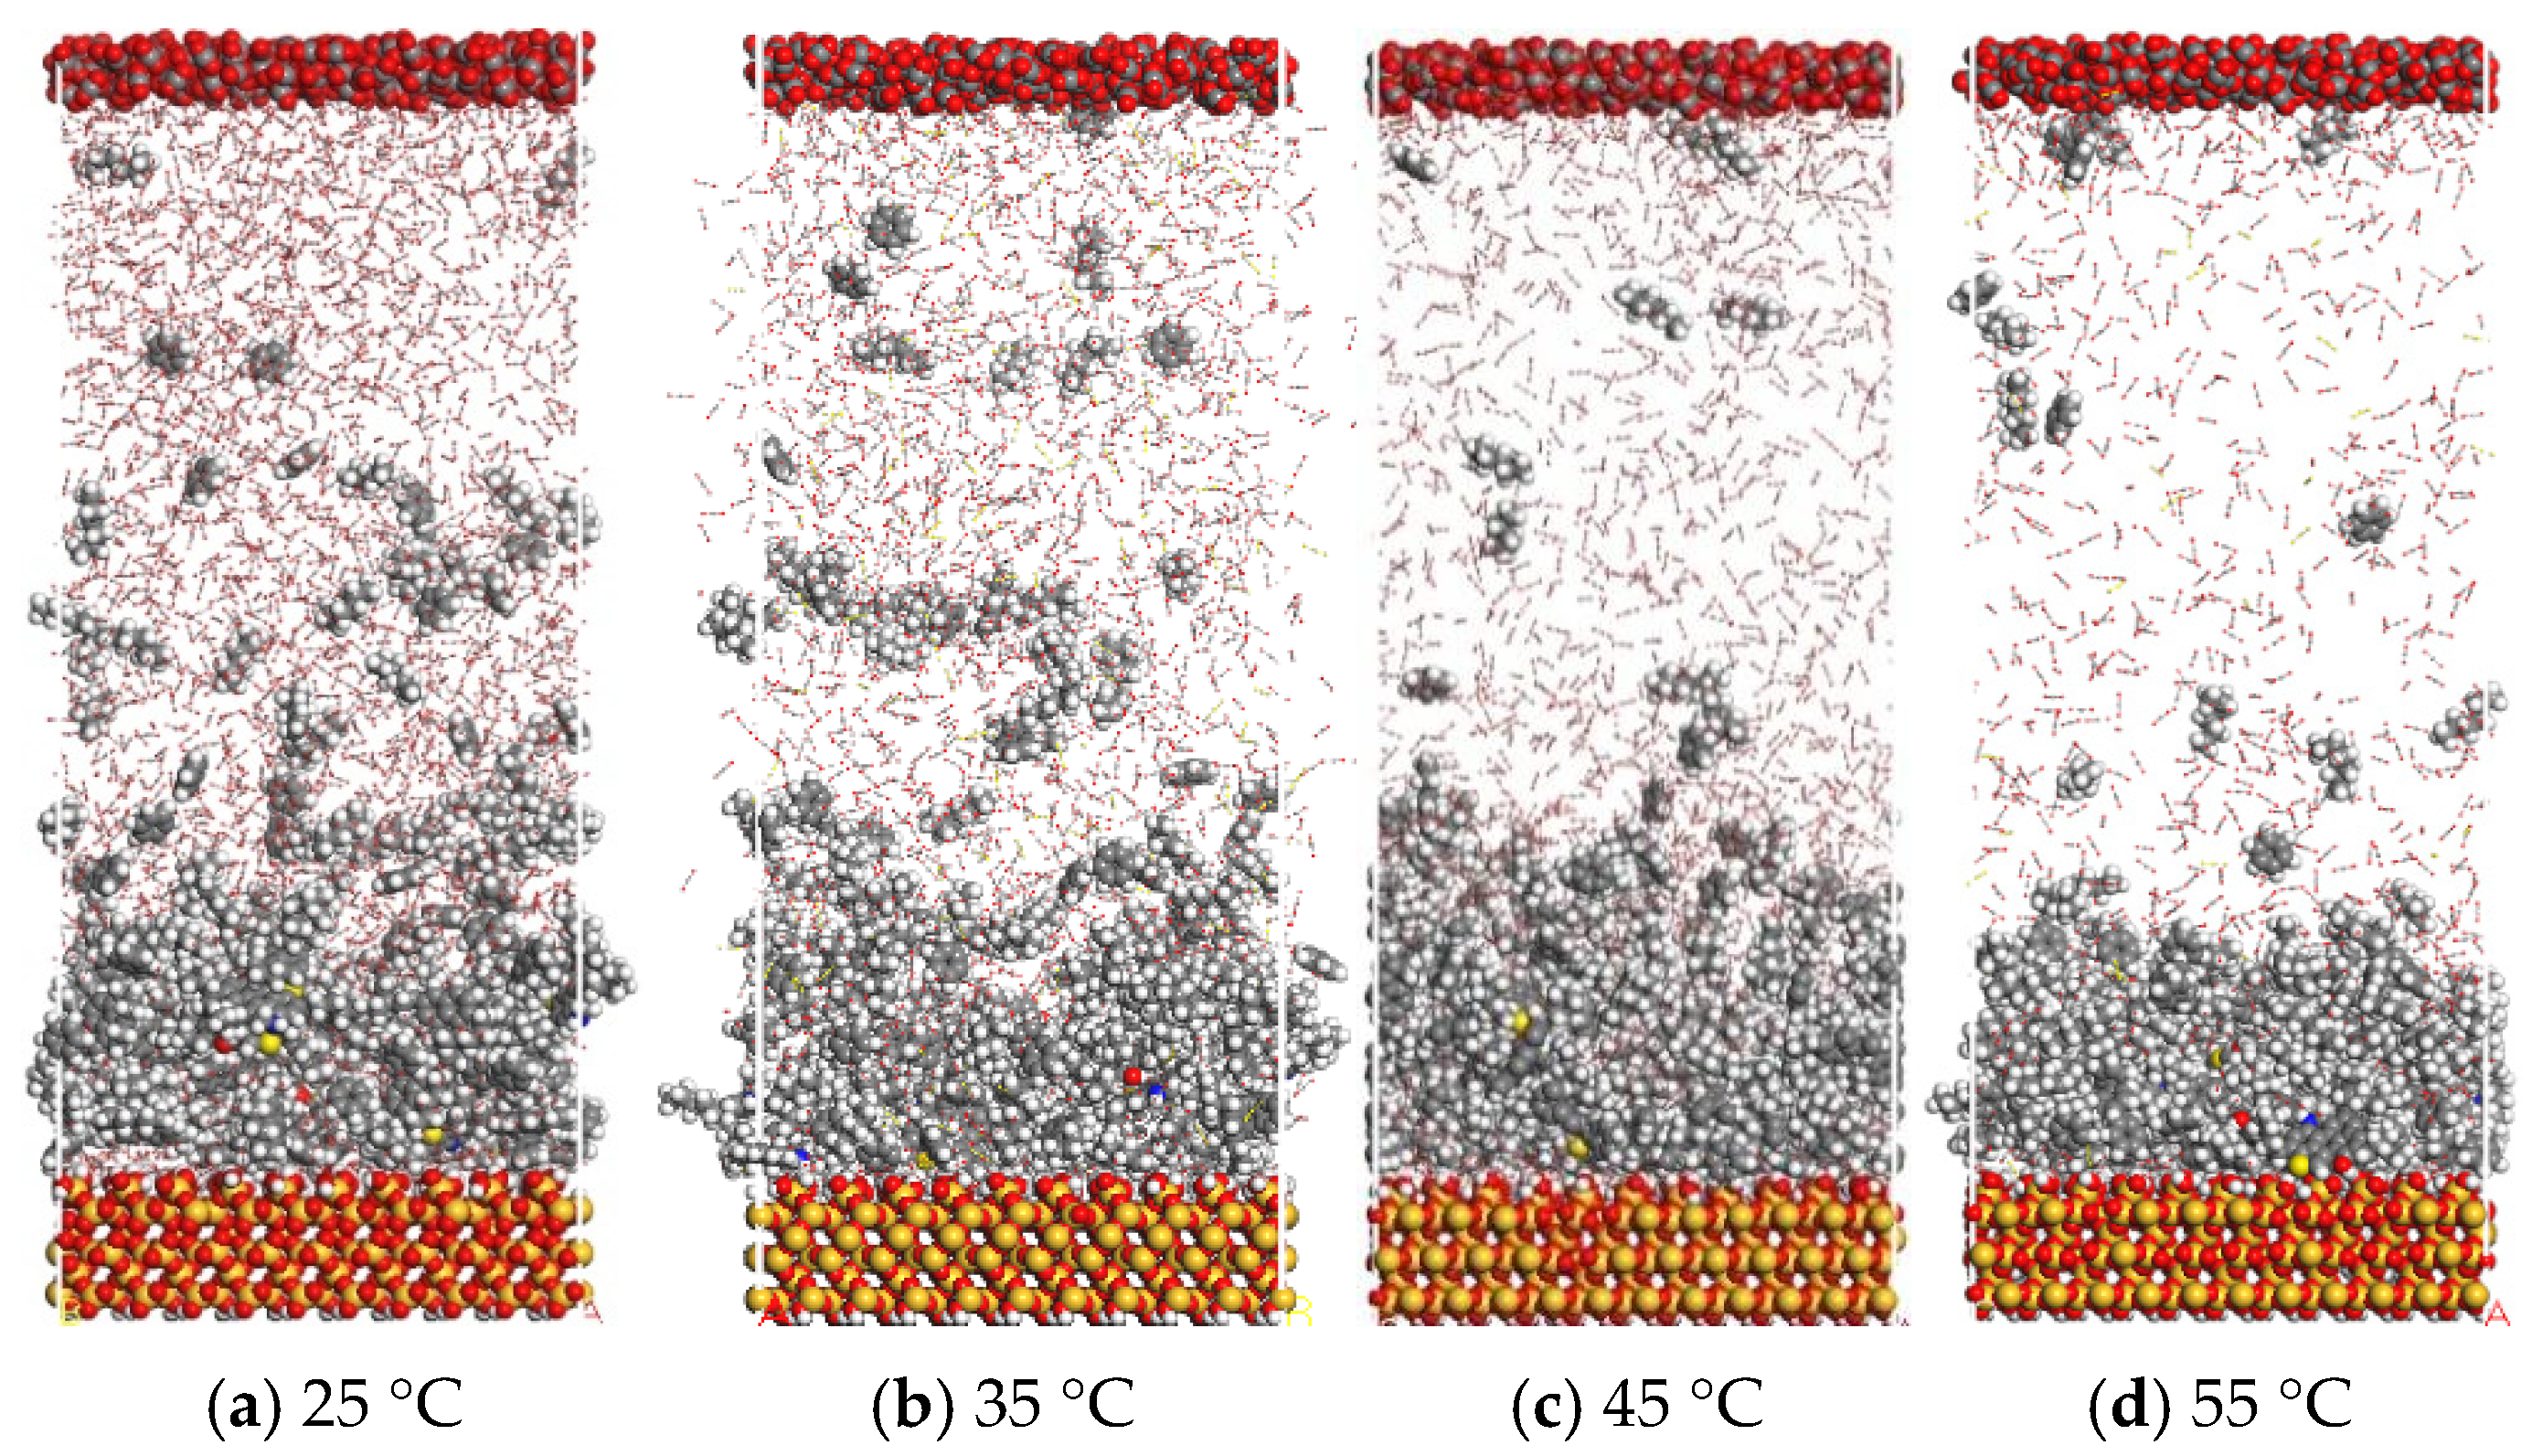
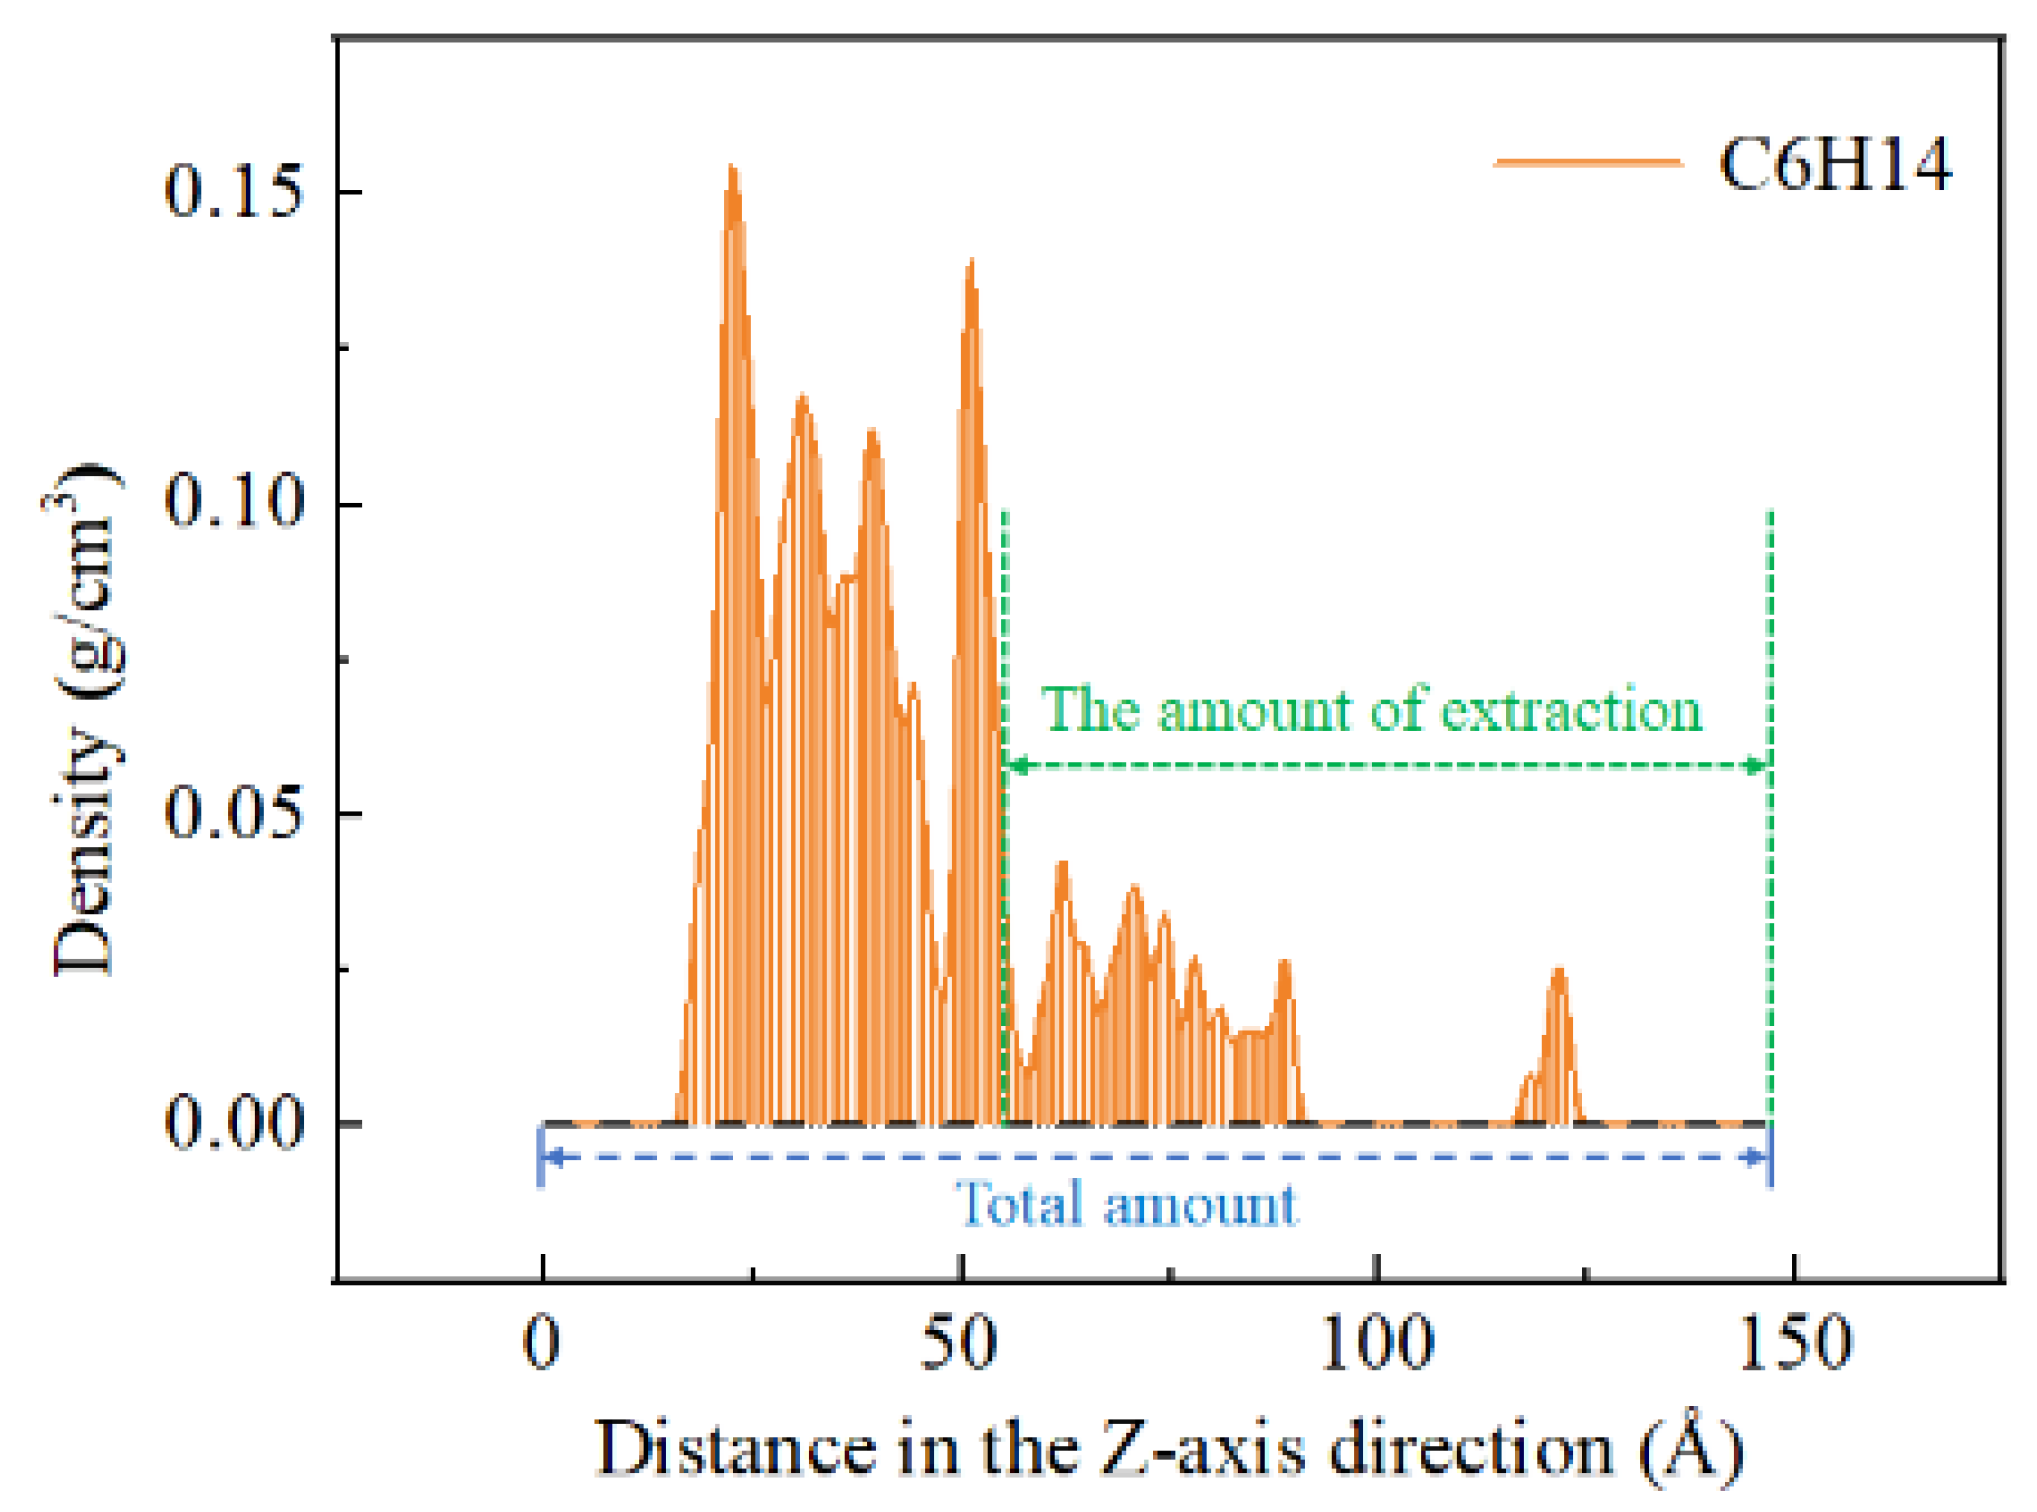
3.3. CO2 Displacement Evaluation in Crude Oil

Based on the changes in the distribution curves of the four components of crude oil, it can be observed that CO2 mainly extracts light components such as C6H14 and aromatic hydrocarbons, while heavy components like asphaltene and resin remain in the oil phase. To quantitatively analyze the swelling of the oil film caused by CO2 and the extraction of light components under different temperature conditions, the maximum distribution range of the asphaltene and resin is defined as the boundary of the oil film, as shown in Figure 11. The expansion of the oil film is measured by monitoring the changes in the boundary position. The C6H14 and aromatic hydrocarbons that exceed the boundary are considered as the extracted portion. The integral of the distribution curve beyond the boundary is calculated, as shown in Figure 12, and the ratio of this integral value to the total integral value of the distribution curve is used to quantitatively analyze the extraction of light components from the oil film of CO2.
Table 2 shows the boundary positions and expansion factors of the oil film at the initial and final times under different temperature conditions. The expansion coefficient is defined as the ratio of the final position to the initial position. From Table 2, it can be observed that within the temperature range of 25 °C to 45 °C, the expansion factor of the oil film increases with the temperature. The minimum value is 1.17, and the maximum value is 1.46. However, as the temperature continues to increase, the expansion factor suddenly decreases to 1.12.
Table 3 presents the extraction efficiencies of CO2 on C6H14 and aromatic hydrocarbons under different temperature conditions. It can be observed that the overall extraction efficiency of CO2 on C6H14 is higher than that on aromatic hydrocarbons. This is mainly related to the distribution of C6H14 and aromatic hydrocarbons. According to the adsorption simulation, a large amount of aromatic hydrocarbons is adsorbed on the quartz surface, and only a portion of the aromatic hydrocarbons are free in the oil phase. On the other hand, C6H14 has fewer molecules adsorbed on the quartz surface, and most of them are free in the oil phase, distributed in the upper layer of the oil phase. Additionally, CO2 exhibits more significant extraction effects on the C6H14 and aromatic hydrocarbons at 25 °C and 35 °C compared to 45 °C and 55 °C.
To analyze the dispersion patterns of the C6H14 and aromatic hydrocarbons under different temperature conditions, the radial distribution functions between carbon atoms were compared, as shown in Figure 13 and Figure 14. It can be observed that the positions of the peaks and valleys in the radial distribution functions of the C6H14 and aromatic hydrocarbons are generally the same at all temperature conditions. At 55 °C, the first peak in the radial distribution function is significantly higher than at other temperatures, indicating the highest degree of aggregation for both C6H14 and aromatic hydrocarbons under this condition, with the smallest average intermolecular spacing. At 25 °C and 35 °C, the first peak in the radial distribution function for both C6H14 and aromatic hydrocarbons is smaller, indicating a lower degree of aggregation and a smaller coordination number between molecules, resulting in larger average intermolecular spacing.
By comparing the expansion coefficient, extraction efficiency, and molecular dispersion under different temperature conditions, it is concluded that a higher expansion coefficient, higher extraction efficiency, and greater molecular dispersion lead to more effective CO2 stripping of the crude oil. When CO2 molecules dissolve into the oil film, the film undergoes expansion. Within a certain range, lower temperatures result in higher CO2 density and greater solubility of CO2 molecules, leading to a better expansion effect and higher expansion coefficient. A better expansion effect means the oil film becomes more porous, making it easier for CO2 to extract crude oil molecules. Additionally, the extraction capacity of CO2 is related to its density; a higher CO2 density enhances its ability to extract light hydrocarbon components [35], resulting in higher extraction efficiency. Higher extraction efficiency leads to larger extraction volumes and smaller oil film volumes, resulting in a smaller expansion coefficient.
Considering both the expansion coefficient and extraction efficiency, the best performance for CO2 stripping of crude oil is observed at 25 °C and 35 °C. Comparing the radial distribution functions of the C6H14 and aromatic hydrocarbons, it can be noticed that as the temperature increases and the CO2 density decreases, the aggregation degree and coordination number of C6H14 and aromatic hydrocarbons tend to increase. However, contrary to this trend, the aggregation degree of the C6H14 and aromatic hydrocarbons at 35 °C is lower than those at 25 °C. This analysis is due to the fact that even though the density of CO2 at 35 °C is slightly lower than that at 25 °C. CO2 undergoes a phase transition and becomes supercritical at 35 °C. Supercritical CO2 has higher diffusivity and better ability to penetrate the gaps between molecules, resulting in lower aggregation of C6H14 and aromatic hydrocarbons. By comparing the expansion and extraction efficiency of CO2 at 25 °C and 35 °C, it is evident that the expansion coefficient and extraction efficiency are higher at 35 °C. This analysis is also related to the fact that when the density difference between CO2 at 25 °C and 35 °C is small, supercritical CO2 exhibits better solubility and dispersion effects. Taking all these factors into consideration, it can be concluded that the best CO2 stripping performance for crude oil occurs at 35 °C.

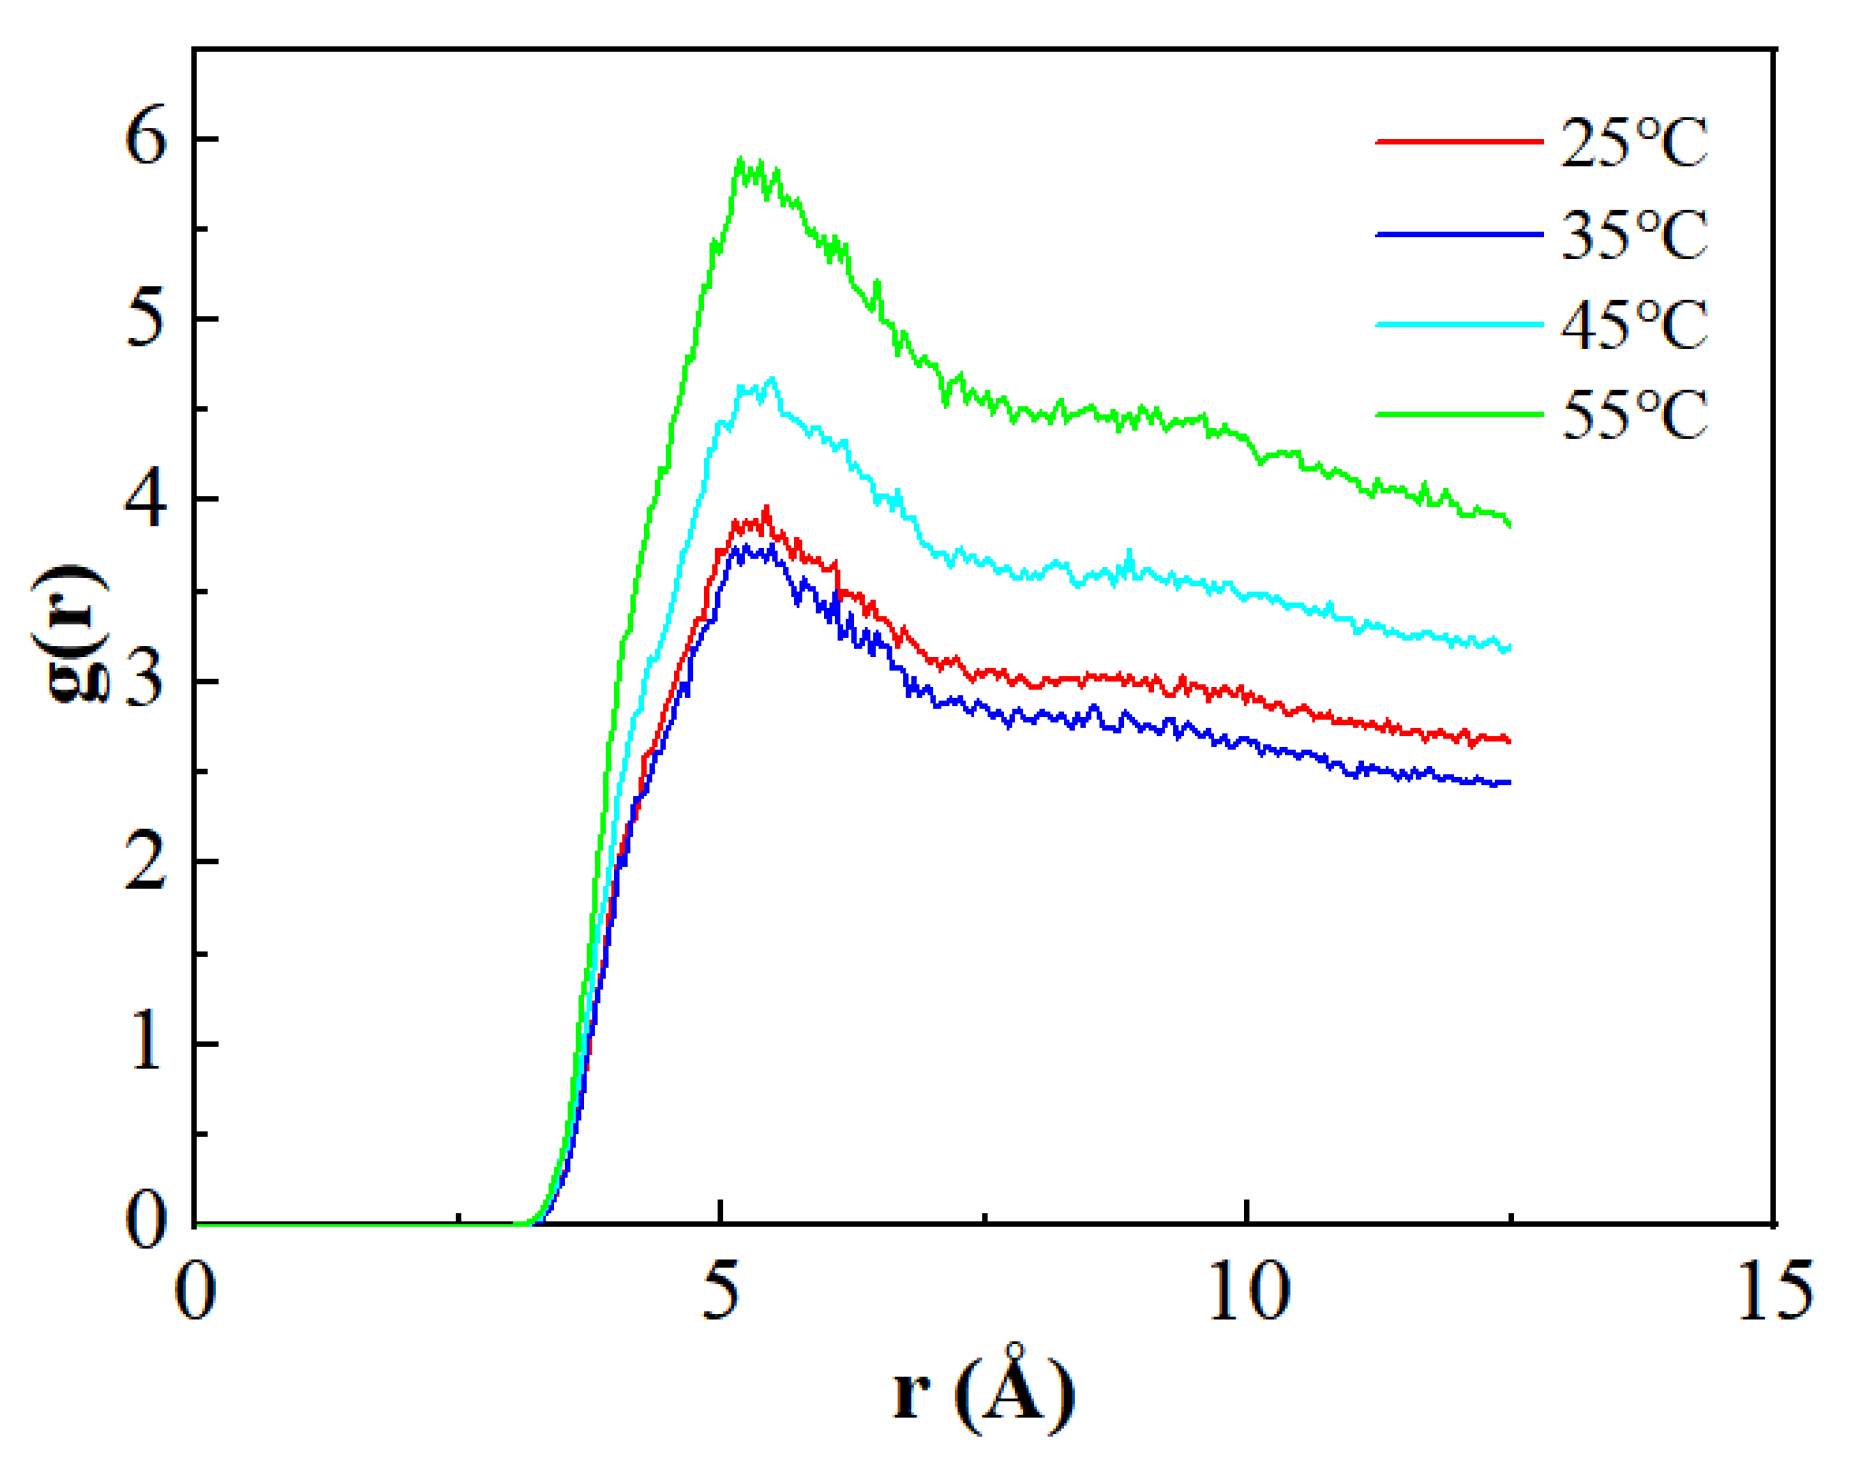
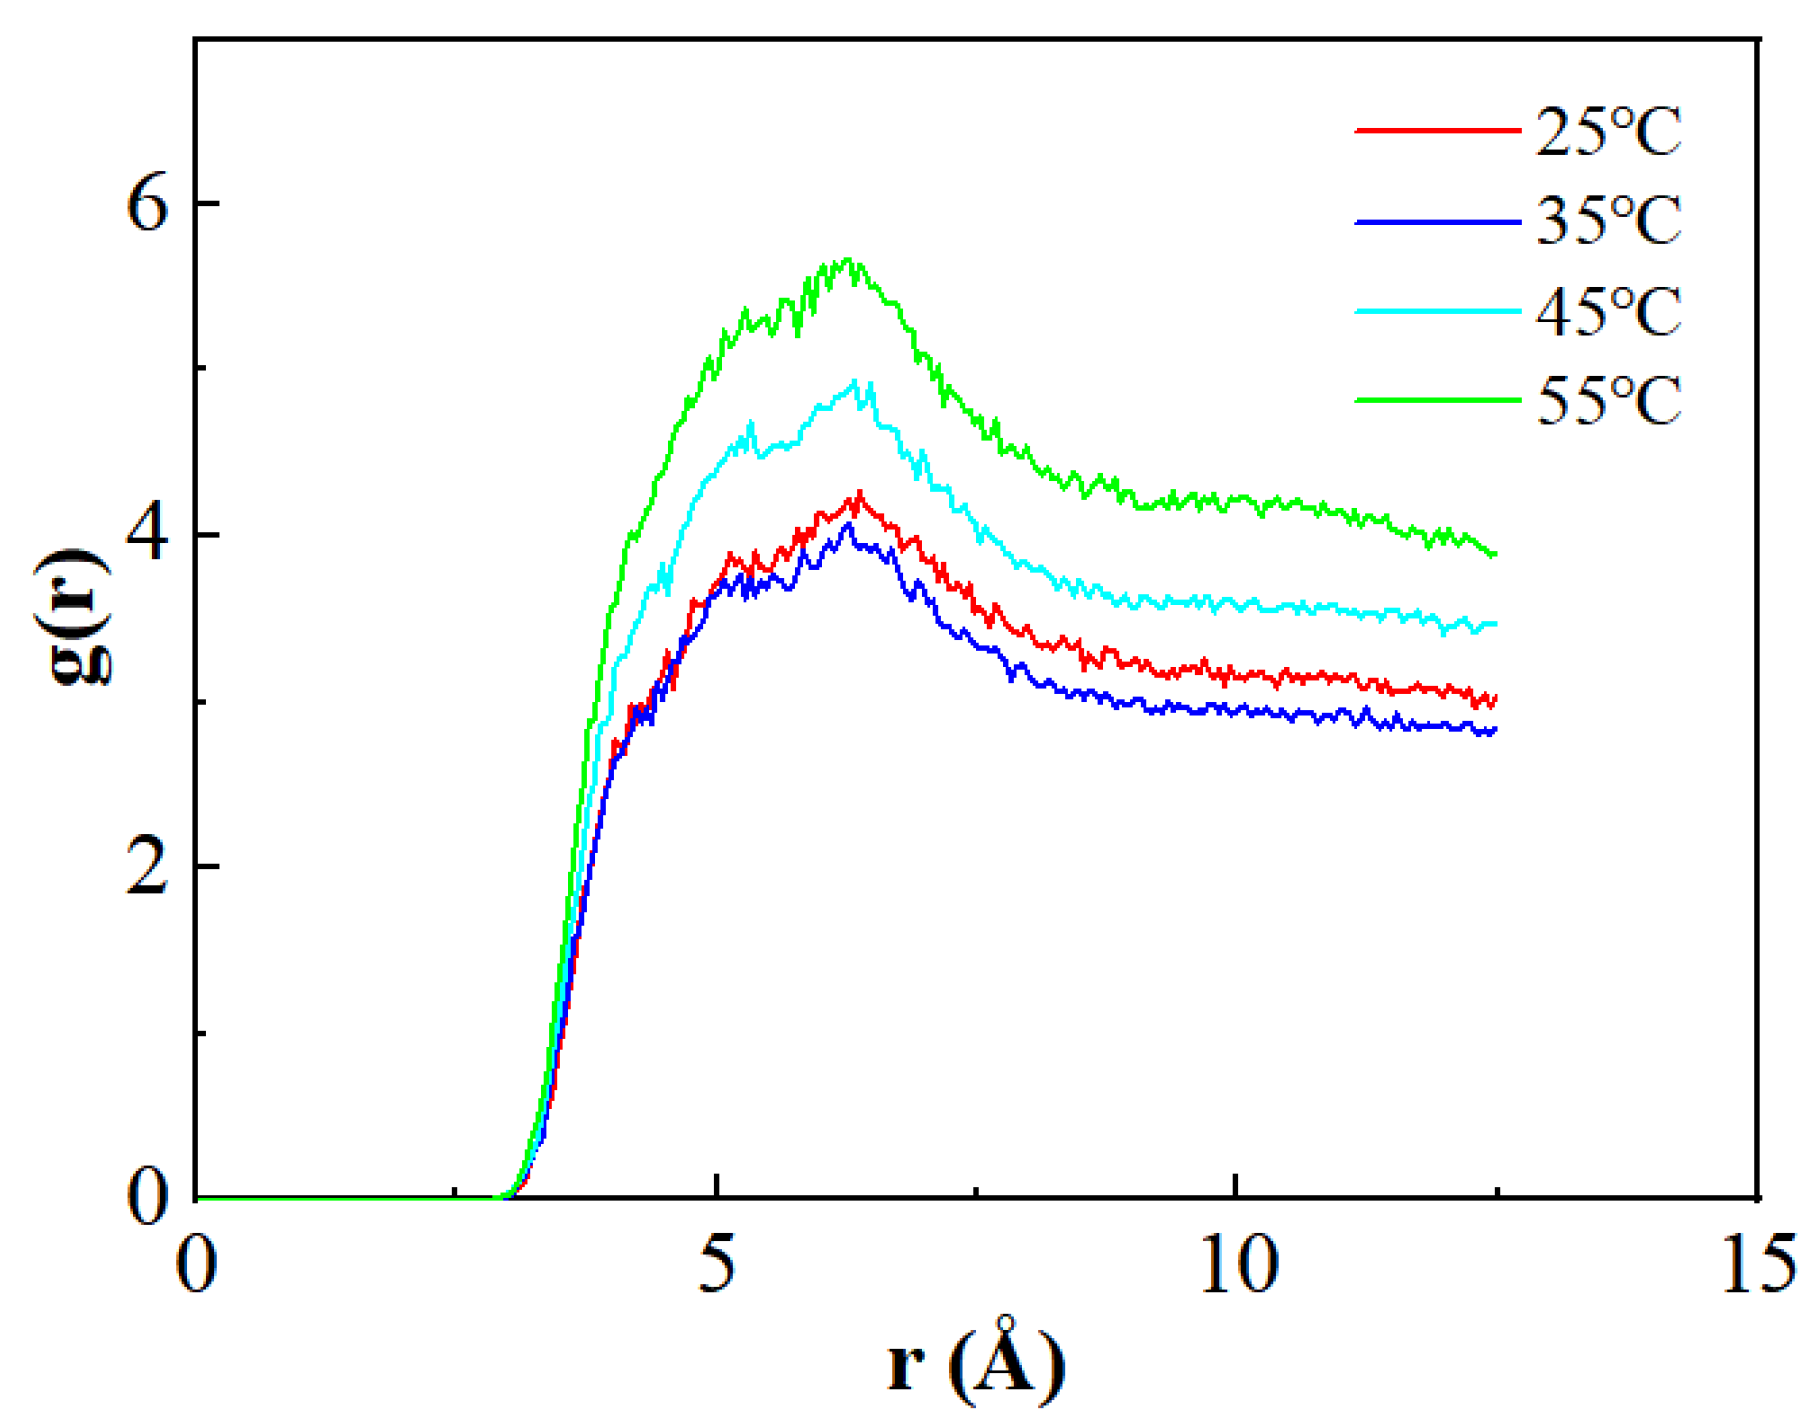
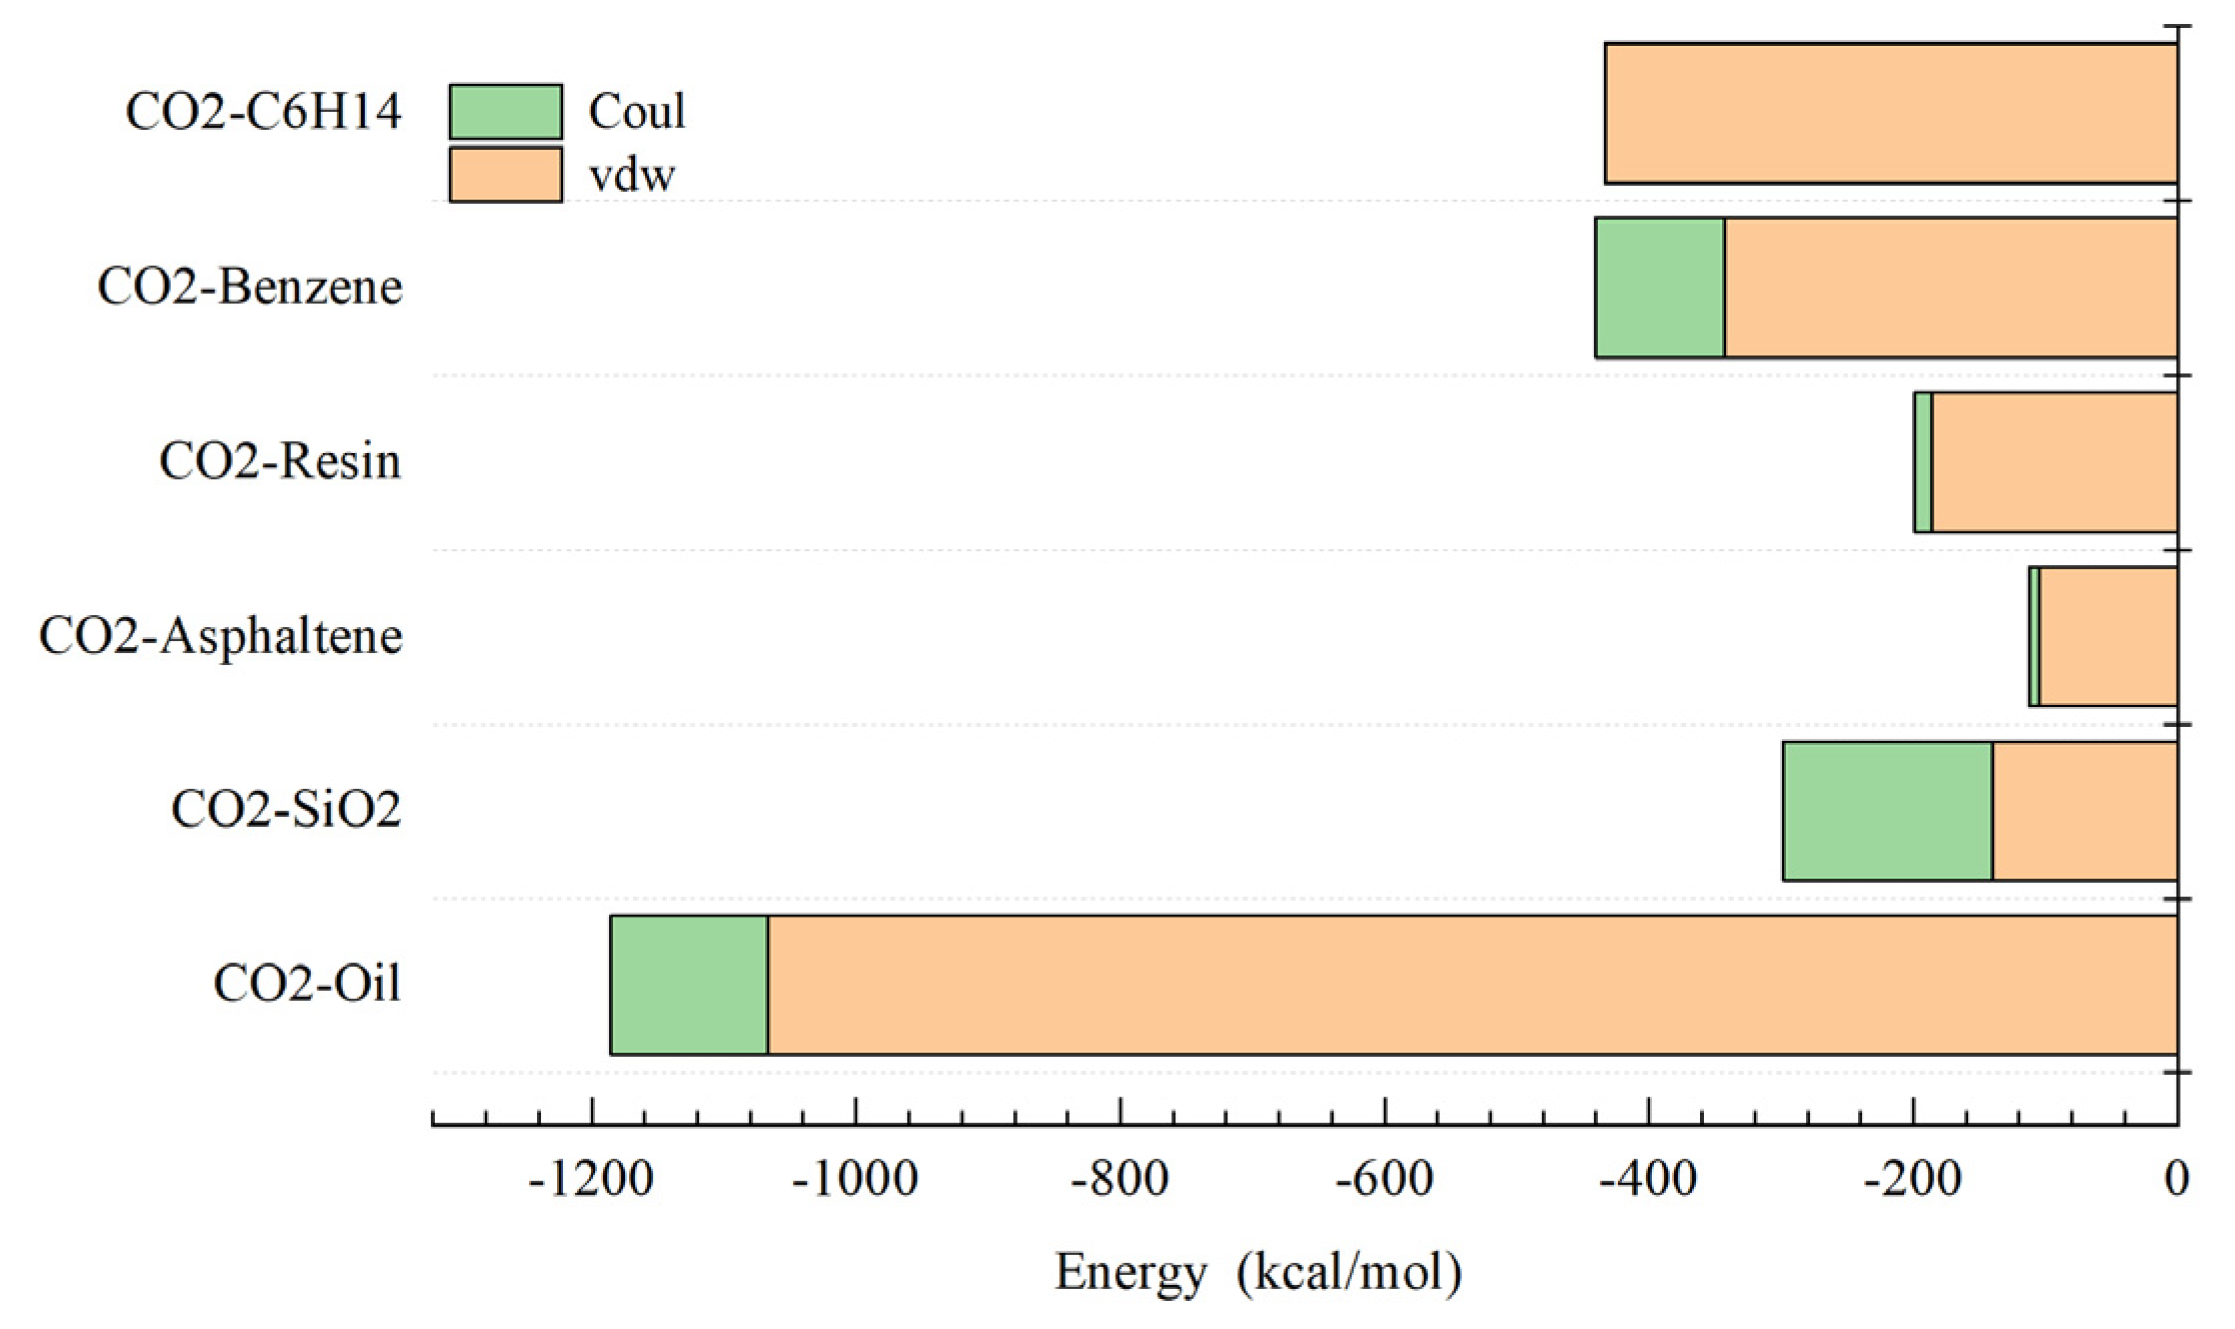
3.4. CO2 Analysis of Interactions Between Different Components

The interaction energies between different components are shown in Figure 15 and Figure 16. Figure 15 illustrates the changes in interaction energies between the various components of crude oil and the quartz surface before and after the CO2 interaction. Initially, the main interactions between crude oil and the quartz surface are van der Waals forces, with a smaller contribution from the Coulombic forces, accounting for about one-quarter of the total, primarily attributed to the interaction between the quartz surface and aromatic hydrocarbons. Among the four components, aromatic hydrocarbons exhibit the strongest interaction with the quartz surface, followed by saturates, resins, and asphaltenes. As time progresses, the interaction energies between crude oil and the quartz surface noticeably weaken, with the largest decrease observed for aromatic hydrocarbons, followed by the saturates and resins, while the asphaltenes exhibit the smallest decrease in interaction energy.
Figure 16 shows the interactions between CO2 and other components in the final configuration. The interactions between CO2 and crude oil are primarily van der Waals forces, while in the interactions with the quartz surface, Coulombic forces account for more than half of the total. During the CO2 stripping process from the quartz surface with crude oil, CO2 exhibits the best stripping effect on saturates and aromatic hydrocarbons, followed by the resins, with the weakest effect on asphaltenes.

4. Conclusions

The findings of this study provide significant contributions to the understanding and enhancement of CO2-enhanced oil recovery (CO2-EOR) processes. By elucidating the interactions between CO2 and crude oil components under various temperature conditions, this research offers valuable insights into the mechanisms of CO2 stripping, particularly emphasizing the conditions that maximize efficiency. The identification of optimal temperature conditions for CO2 extraction, especially the superior performance observed at 35 °C, suggests that controlled thermal conditions could substantially enhance the effectiveness of CO2-EOR applications.
These results also underline the importance of considering both the chemical composition of crude oil and the interaction dynamics between CO2 and oil components. Such knowledge can be applied to develop more efficient CO2-EOR protocols, potentially leading to more economical oil extraction processes, reduced environmental impact, and improved recovery of light hydrocarbons. Future research should focus on extending these molecular dynamics simulations to more complex reservoir conditions, such as varying pressure, porosity, and heterogeneous rock compositions, to further enhance the applicability of the findings in real-world oilfields. Moreover, investigating the use of CO2 in combination with other injection gases or chemical agents could open new pathways for increasing oil recovery efficiency. Ultimately, this study lays the foundation for more targeted, efficient, and environmentally friendly approaches to oil recovery, aligning with broader energy sustainability goals.

Author Contributions

Conceptualization, S.T. and Y.Z.; methodology, H.X.; investigation, Y.T.; writing—original draft preparation, Y.T.; writing—review and editing, F.W. All authors have read and agreed to the published version of the manuscript.

Funding

This work was supported by the National Natural Science Foundation of China (52341401) and State Energy Center for Shale Oil Research and Development (33550000-22-ZC0613-0372).

Data Availability Statement

The datasets used and/or analyzed during the current study are available from the corresponding author upon reasonable request.

Conflicts of Interest

The authors declare no conflicts of interest.

References

  1. Zou, C.; Wu, S.; Yang, Z.; Pan, S.; Wang, G.; Jiang, X.; Guan, M.; Yu, C.; Yu, Z.; Shen, Y. Progress, challenge and significance of building a carbon industry system in the context of carbon neutrality strategy. Pet. Explor. Dev. 2023, 50, 210–228. [Google Scholar] [CrossRef]
  2. Qin, J.; Han, H.; Liu, X. Application and enlightenment of carbon dioxide flooding in the United States of America. Pet. Explor. Dev. 2015, 42, 232–240. [Google Scholar] [CrossRef]
  3. Li, Y.; Huang, W.H.; Jin, Y.; He, Y.F.; Chen, Z.H.; Tang, Y.; Wu, G.Y. Different reservoir types of CO2 flooding in Sinopec EOR technology development and application under “dual carbon” vision. Reserv. Eval. Dev. 2021, 11, 793–804. [Google Scholar]
  4. Gozalpour, F.; Ren, S.R.; Tohidi, B. CO2 EOR and storage in oil reservoir. Oil Gas Sci. Technol. 2005, 60, 537–546. [Google Scholar] [CrossRef]
  5. Farajzadeh, R.; Eftekhari, A.A.; Dafnomilis, G.; Lake, L.W.; Bruining, J. On the sustainability of CO2 storage through CO2–Enhanced oil recovery. Appl. Energy 2020, 261, 114467. [Google Scholar] [CrossRef]
  6. Li, L.; Wang, C.; Li, D.; Fu, J.; Su, Y.; Lv, Y. Experimental investigation of shale oil recovery from Qianjiang core samples by the CO2 huff-n-puff EOR method. RSC Adv. 2019, 9, 28857–28869. [Google Scholar] [CrossRef]
  7. Zanganeh, P.; Ayatollahi, S.; Alamdari, A.; Zolghadr, A.; Dashti, H.; Kord, S. Asphaltene deposition during CO2 injection and pressure depletion: A visual study. Energy Fuels 2012, 26, 1412–1419. [Google Scholar] [CrossRef]
  8. Lu, J.; Steven, H.; James, S.; Lawrence, P.; Bethany, K.; Steven, S.; Loreal, H.; Volker, H.; Nicholas, B.; José, T. Advancing CO2 enhanced oil recovery and storage in unconventional oil play—Experimental studies on Bakken shales. Appl. Energy 2017, 208, 171–183. [Google Scholar]
  9. Wei, J.; Zhou, X.; Zhou, J.; Li, J.; Wang, A. Experimental and simulation investigations of carbon storage associated with CO2 EOR in low-permeability reservoir. Int. J. Greenh. Gas Control 2021, 104, 103203. [Google Scholar] [CrossRef]
  10. Snosy, M.F.; Abu El Ela, M.; El-Banbi, A.; Sayyouh, H. Comprehensive investigation of low-salinity waterflooding in sandstone reservoirs. J. Pet. Explor. Prod. Technol. 2020, 10, 2019–2034. [Google Scholar] [CrossRef]
  11. Zhao, Y. Laboratory experiment and field application of high pressure and high quality steam flooding. J. Pet. Sci. Eng. 2020, 189, 107016. [Google Scholar] [CrossRef]
  12. Kusumastuti, I.; Erfando, T.; Hidayat, F. Effects of Various Steam Flooding Injection Patterns and Steam Quality to Recovery Factor. J. Earth Energy Eng. 2019, 8, 33–39. [Google Scholar] [CrossRef]
  13. Park, S.W.; Lee, J.; Yoon, H.; Shin, S. Microfluidic investigation of salinity-induced oil recovery in porous media during chemical flooding. Energy Fuels 2021, 35, 4885–4892. [Google Scholar] [CrossRef]
  14. Meng, M.; Ge, H.; Shen, Y.; Ji, W.; Li, Z. Insight into water occurrence and pore size distribution by nuclear magnetic resonance in marine shale reservoirs, southern China. Energy Fuels 2023, 37, 319–327. [Google Scholar] [CrossRef]
  15. Meng, M.; Ge, H.; Shen, Y.; Ji, W.; Wang, Q. Rock fabric of tight sandstone and its influence on irreducible water saturation in Eastern Ordos Basin. Energy Fuels 2023, 37, 3685–3696. [Google Scholar] [CrossRef]
  16. Meng, M.; Zhang, Y.; Yuan, B.; Li, Z.; Zhang, Y. Imbibition behavior of oil-saturated rock: Implications for enhanced oil recovery in unconventional reservoirs. Energy Fuels 2023, 37, 13759–13768. [Google Scholar] [CrossRef]
  17. Luo, Y.; Liu, X.; Xiao, H.; Zheng, T. Microscopic production characteristics of tight oil in the nanopores of different CO2-affected areas from molecular dynamics simulations. Sep. Purif. Technol. 2023, 306, 122607. [Google Scholar] [CrossRef]
  18. Liu, B.; Liu, W.; Pan, Z.; Yu, L.; Xie, Z.; Lv, G.; Zhao, P.; Chen, D.; Fang, W. Supercritical CO2 Breaking Through a Water Bridge and Enhancing Shale Oil Recovery: A Molecular Dynamics Simulation Study. Energy Fuels 2022, 36, 7558–7568. [Google Scholar] [CrossRef]
  19. Li, C.; Pu, H.; Zhong, X.; Li, Y.; Zhao, J.X. Interfacial interactions between Bakken crude oil and injected gases at reservoir temperature: A molecular dynamics simulation study. Fuel 2020, 276, 118058. [Google Scholar] [CrossRef]
  20. Fang, T.; Zhang, Y.; Ma, R.; Yan, Y.; Dai, C.; Zhang, J. Oil extraction mechanism in CO2 flooding from rough surface: Molecular dynamics simulation. Appl. Surf. Sci. 2019, 494, 80–86. [Google Scholar] [CrossRef]
  21. Yu, T.; Li, Q.; Tan, Y.; Xu, L. Molecular dynamics simulation of CO2-N2 dissolution and stripping of oil films on pore walls based on intermolecular interaction energy. Chem. Eng. Sci. 2022, 262, 118044. [Google Scholar] [CrossRef]
  22. Hong, X.; Yu, H.; Xu, H.; Wang, X.; Jin, X.; Wu, H.; Wang, F. Competitive adsorption of asphaltene and n-heptane on quartz surfaces and its effect on crude oil transport through nanopores. J. Mol. Liq. 2022, 359, 119312. [Google Scholar] [CrossRef]
  23. Liu, B.; Li, J.; Qi, C.; Li, X.; Mai, T.; Zhang, J. Mechanism of asphaltene aggregation induced by supercritical CO2: Insights from molecular dynamics simulation. RSC Adv. 2017, 7, 50786–50793. [Google Scholar] [CrossRef]
  24. Sui, H.; Zhang, F.; Wang, Z.; Wang, D.; Wang, Y. Molecular simulations of oil adsorption and transport behavior in inorganic shale. J. Mol. Liq. 2020, 305, 112745. [Google Scholar] [CrossRef]
  25. Zhang, W.; Feng, Q.; Wang, S.; Xing, X. Oil diffusion in shale nanopores: Insight of molecular dynamics simulation. J. Mol. Liq. 2019, 290, 111183. [Google Scholar] [CrossRef]
  26. Li, X.; Bai, Y.; Sui, H.; He, L. Understanding desorption of oil fractions from mineral surfaces. Fuel 2018, 232, 257–266. [Google Scholar] [CrossRef]
  27. Wang, P.; Li, X.; Tao, Z.; Wang, S.; Fan, J.; Feng, Q.; Xue, Q. The miscible behaviors and mechanism of CO2/CH4/C3H8/N2 and crude oil in nanoslits: A molecular dynamics simulation study. Fuel 2021, 304, 121461. [Google Scholar] [CrossRef]
  28. Zhang, J.; Pan, Z.; Liu, K.; Burke, N. Molecular Simulation of CO2 Solubility and Its Effect on Octane Swelling. Energy Fuels 2013, 27, 2741–2747. [Google Scholar] [CrossRef]
  29. Santos, M.S.; Franco, L.F.M.; Castier, M.; Economou, I.G. Molecular dynamics simulation of n-alkanes and CO2 confined by calcite nanopores. Energy Fuels 2018, 32, 1934–1941. [Google Scholar] [CrossRef]
  30. Peng, F.; Wang, R.; Guo, Z.; Feng, G. Molecular dynamics simulation to estimate minimum miscibility pressure for oil with pure and impure CO2. J. Phys. Commun. 2018, 2, 115028. [Google Scholar] [CrossRef]
  31. Liu, B.; Shi, J.; Sun, B.; Shen, Y.; Zhang, J.; Chen, X.; Wang, M. Molecular dynamics simulation on volume swelling of CO2–alkane system. Fuel 2015, 143, 194–201. [Google Scholar] [CrossRef]
  32. Fang, T.; Wang, M.; Gao, Y.; Zhang, Y.; Yan, Y.; Zhang, J. Enhanced oil recovery with CO2/N2 slug in low permeability reservoir: Molecular dynamics simulation. Chem. Eng. Sci. 2018, 197, 204–211. [Google Scholar] [CrossRef]
  33. Yu, T.; Li, Q.; Hu, H.; Tan, Y.; Xu, L. Residual oil retention and stripping mechanism of hydrophilic pore surfaces during CO2 and N2 combined gas flooding. J. Pet. Sci. Eng. 2022, 218, 110989. [Google Scholar] [CrossRef]
  34. Osnis, A.; Sukenik, C.N.; Major, D.T. Structure of carboxyl-acid-terminated self-assembled monolayers from molecular dynamics simulations and hybrid quantum mechanics–molecular mechanics vibrational normal-mode analysis. J. Phys. Chem. C 2012, 116, 770–782. [Google Scholar] [CrossRef]
  35. Holm, L.W.; Josendal, V.A. Effect of oil composition on miscible-type displacement by carbon dioxide. Soc. Pet. Eng. J. 1982, 22, 87–98. [Google Scholar] [CrossRef]
Figure 1. Molecular model of crude oil components.
Processes 12 02776 g001
Figure 2. Schematic diagram of crude oil adsorption model.
Processes 12 02776 g002
Figure 3. Effect of temperature on resin–asphaltene interaction: increasing temperature weakens resin–asphaltene interaction, reducing adsorption capacity (0 for top view, 1 and 2 for side views).
Processes 12 02776 g003aProcesses 12 02776 g003b
Figure 4. Effect of temperature on aromatic hydrocarbon distribution: increasing temperature reduces adsorption on the quartz surface and increases dispersion in the oil phase.
Processes 12 02776 g004
Figure 5. Effect of temperature on C6H14 distribution: increasing temperature reduces adsorption on quartz and enhances the separation of C6H14 into individual molecules in the oil phase.
Processes 12 02776 g005
Figure 6. Temperature effect on the Z-direction density distribution of crude oil components: increasing temperature reduces the adsorption of aromatic hydrocarbons and C6H14 on quartz, with migration to upper layers, while the asphaltene distribution remains largely unchanged.
Processes 12 02776 g006
Figure 7. Temperature effect on mean square displacement (MSD): C6H14 has the highest mobility, followed by aromatic hydrocarbons, resins, and asphaltenes.
Processes 12 02776 g007
Figure 8. Schematic diagram of CO2 stripping crude oil model.
Processes 12 02776 g008
Figure 9. Temperature effect on CO2-induced swelling and extraction of oil film.
Processes 12 02776 g009
Figure 10. Z-axis density distribution of oil components before and after CO2 dissolution: CO2 causes redistribution of asphaltene, resin, aromatic hydrocarbons, and saturated hydrocarbons, reducing surface adsorption and enhancing dispersion.
Processes 12 02776 g010
Figure 11. The oil film boundary defined by the maximum distribution of asphaltene and resin.
Processes 12 02776 g011
Figure 12. The total amount and extraction of C6H14 (the ratio of extraction value to the total used to calculate the extraction of light components from the oil film).
Processes 12 02776 g012
Figure 13. RDF between carbon atoms of saturated hydrocarbon.
Processes 12 02776 g013
Figure 14. RDF between carbon atoms of aromatic hydrocarbon.
Processes 12 02776 g014
Figure 15. Interaction energy between components with quartz surface: over time, the interaction energies between crude oil and the quartz surface weaken, with the largest decrease for aromatic hydrocarbons, followed by saturates, resin, and the smallest for asphaltene.
Processes 12 02776 g015
Figure 16. Interaction energy between components with CO2: CO2 has the strongest stripping effect on saturate (C6H14) and aromatic hydrocarbon, followed by resin, and the weakest on asphaltene.
Processes 12 02776 g016
Table 1. Molecular number of components in crude oil system model.
ComponentsSaturated HydrocarbonAromatic HydrocarbonResinsAsphaltenes
%8978208
Table 2. Oil film expansion coefficient (defined as the ratio of the final position to the initial position).
VariableParameter
Temperature (°C)25354555
Initial time position (Å)38.7736.7733.7734.77
Final time position (Å)45.2345.1749.3439.04
Expansion coefficient1.171.231.461.12
Table 3. Extraction efficiency of C6H14 and benzene at different temperatures.
Temperature (°C)25354555
Extraction rate of C6H14 (%)36.1737.8715.6916.16
Extraction rate of Benzene (%)23.8823.4310.9113.20
Disclaimer/Publisher’s Note: The statements, opinions and data contained in all publications are solely those of the individual author(s) and contributor(s) and not of MDPI and/or the editor(s). MDPI and/or the editor(s) disclaim responsibility for any injury to people or property resulting from any ideas, methods, instructions or products referred to in the content.

