

The Palaeocene Lista Shale: A Planned Carbon Capture and Storage Top Seal for the East Mey CO2 Storage Site


Abstract
1. Introduction
- What are the characteristic pore sizes?
- What are the genetic origins of the pore types present?
- What is the best way to determine a specific surface area?
- What controls reactive surface area?
- Are there compositional controls on pore structure and surface area?
- Is the Lista Shale likely to be a good seal for the injected CO2?
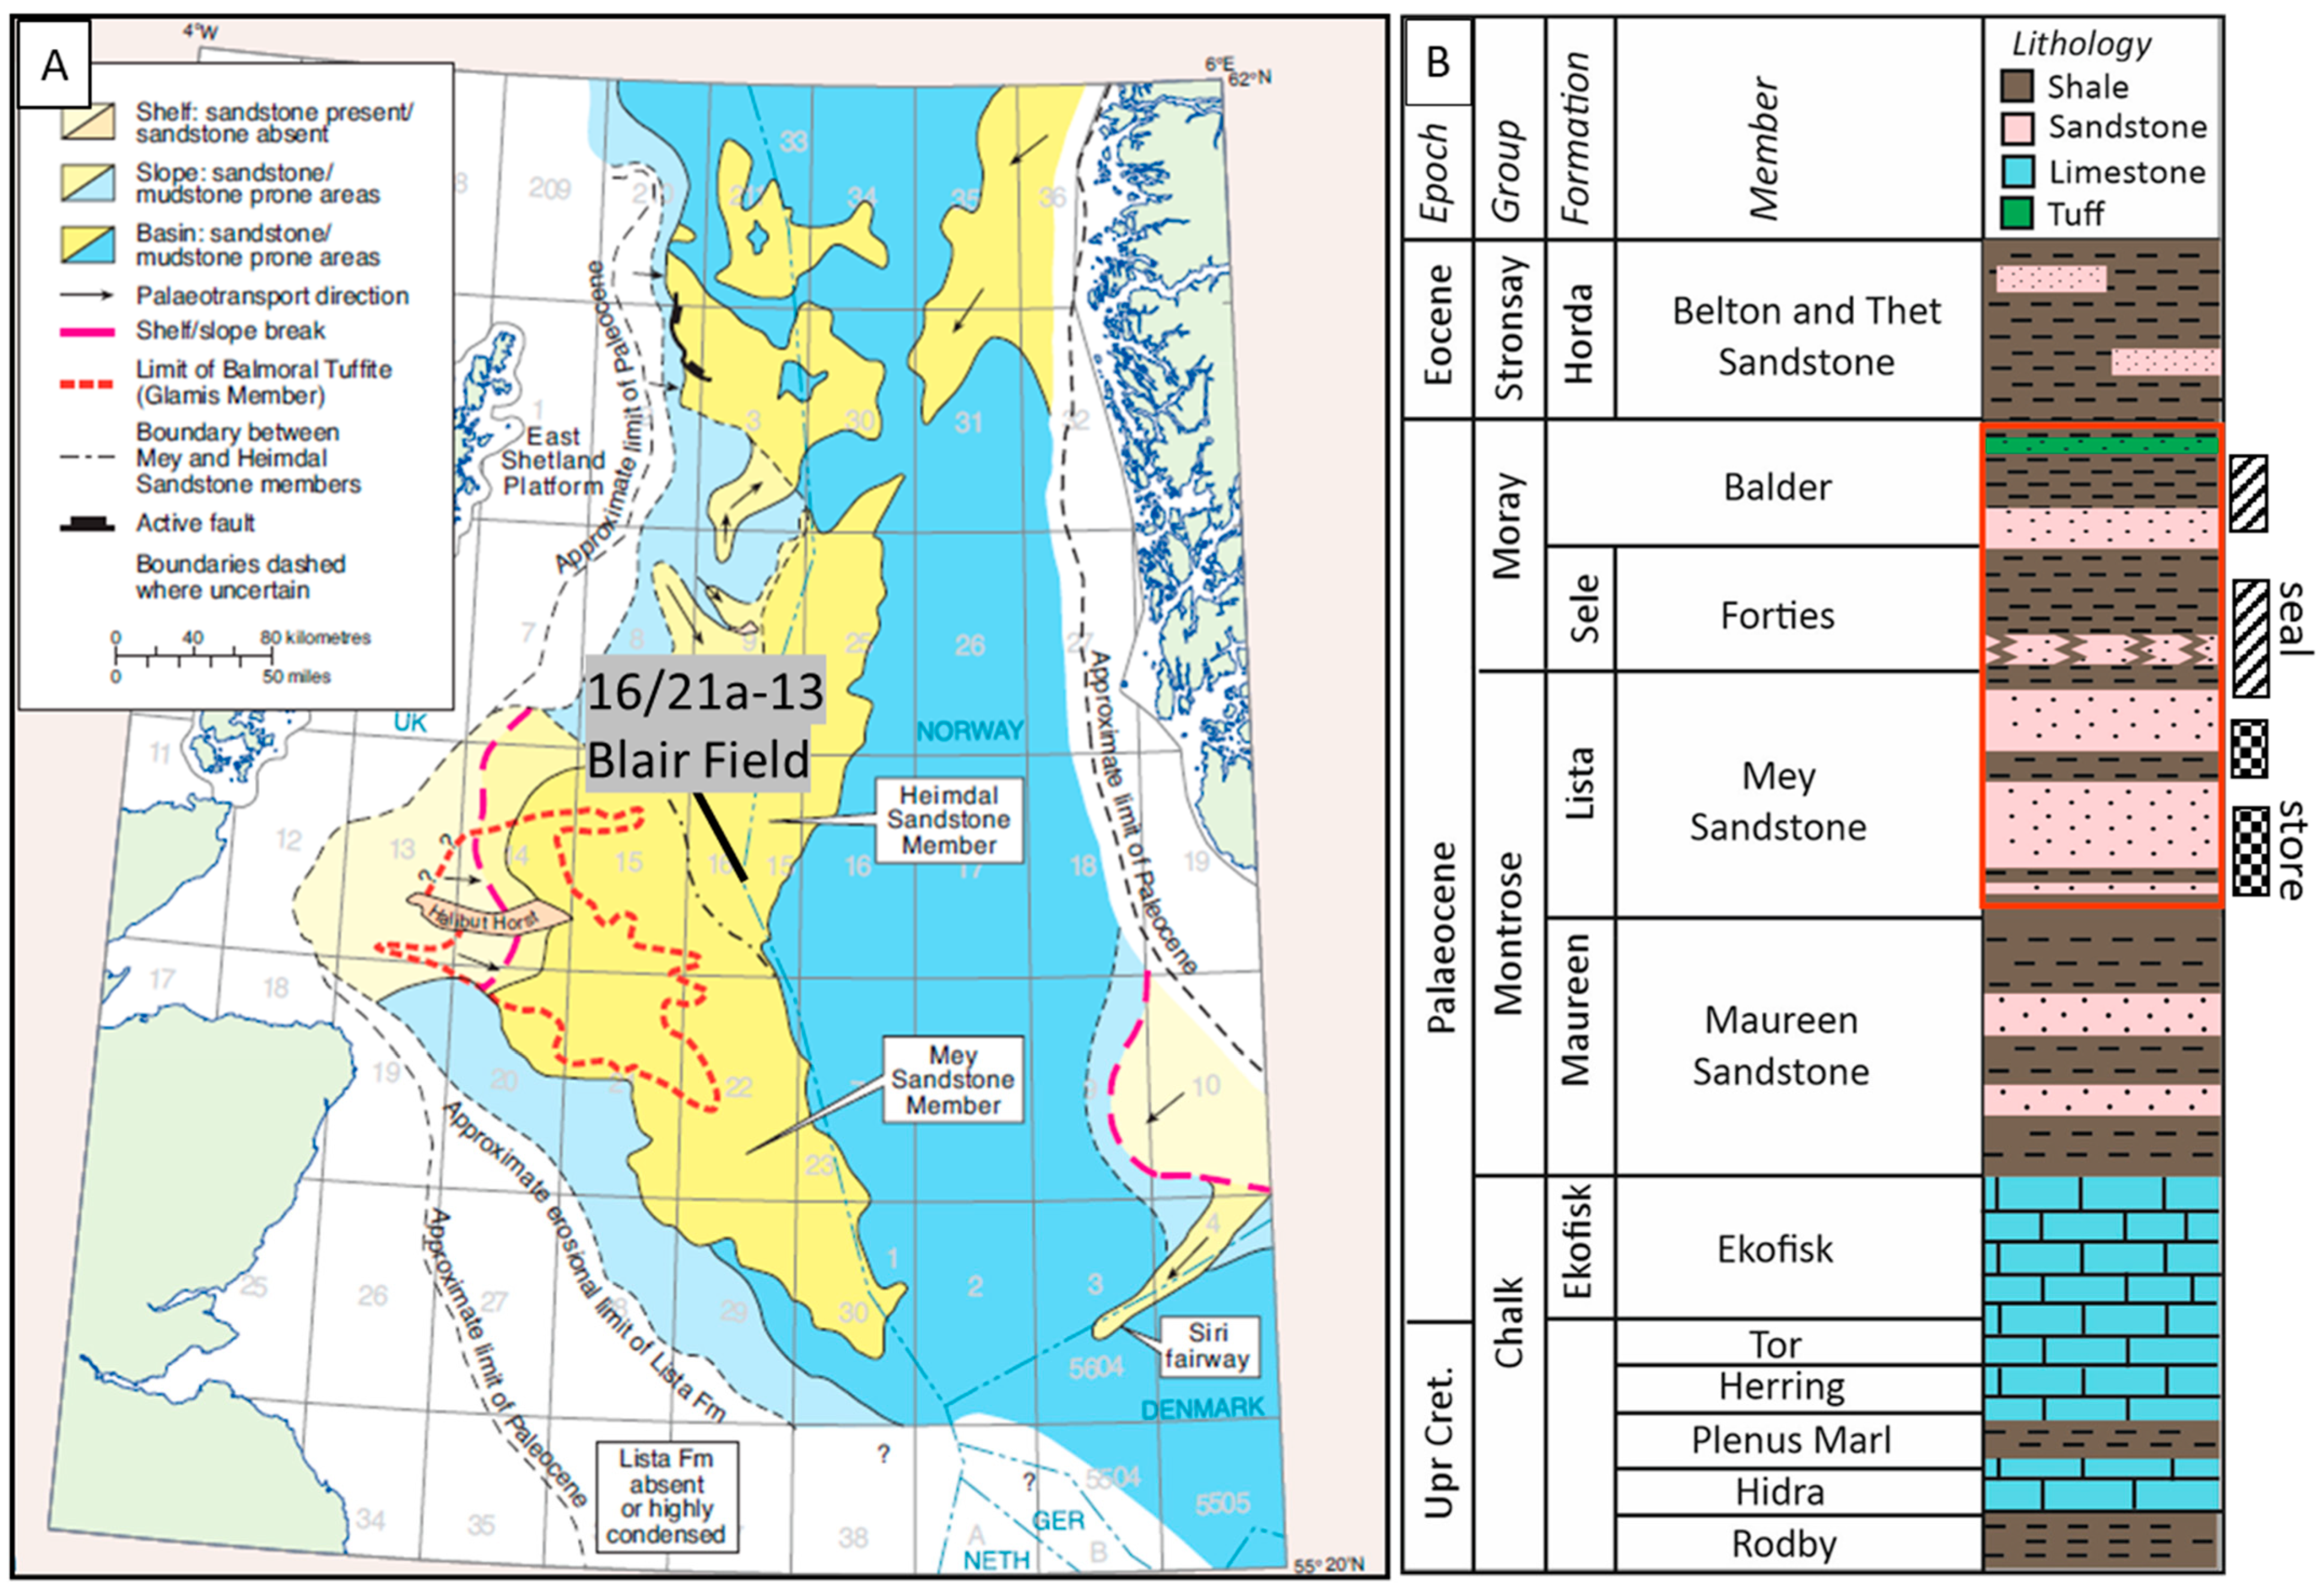
2. Geological Background
3. Methodology
3.1. Characterisation Workflow
3.2. Samples and Data
3.3. Lista Formation Core Logging
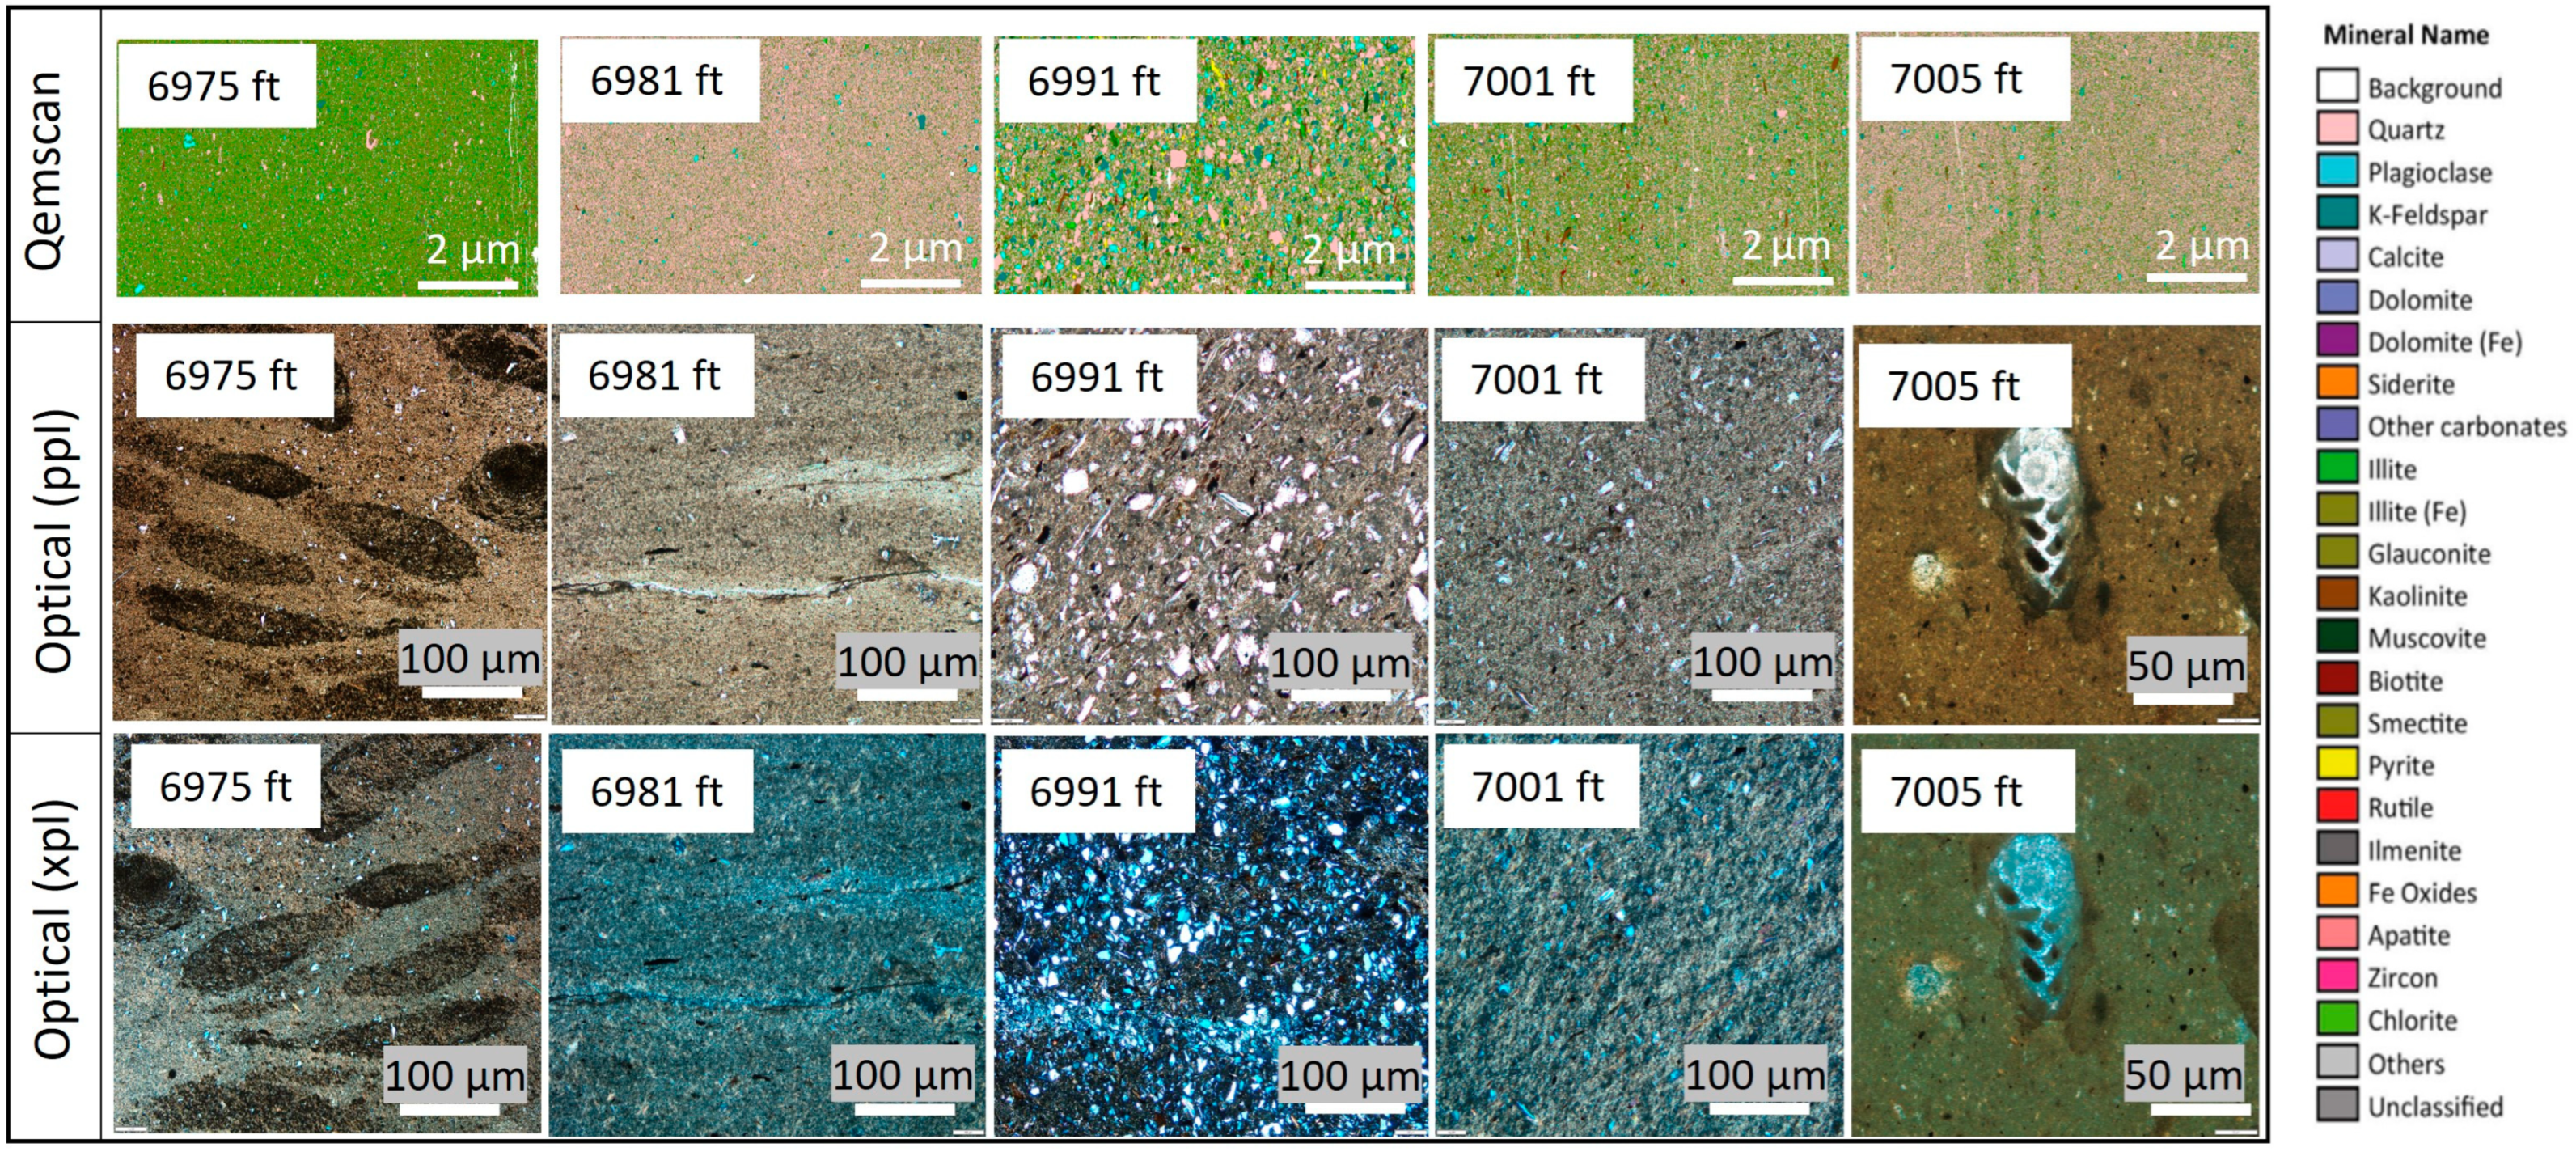
3.4. Microscopy
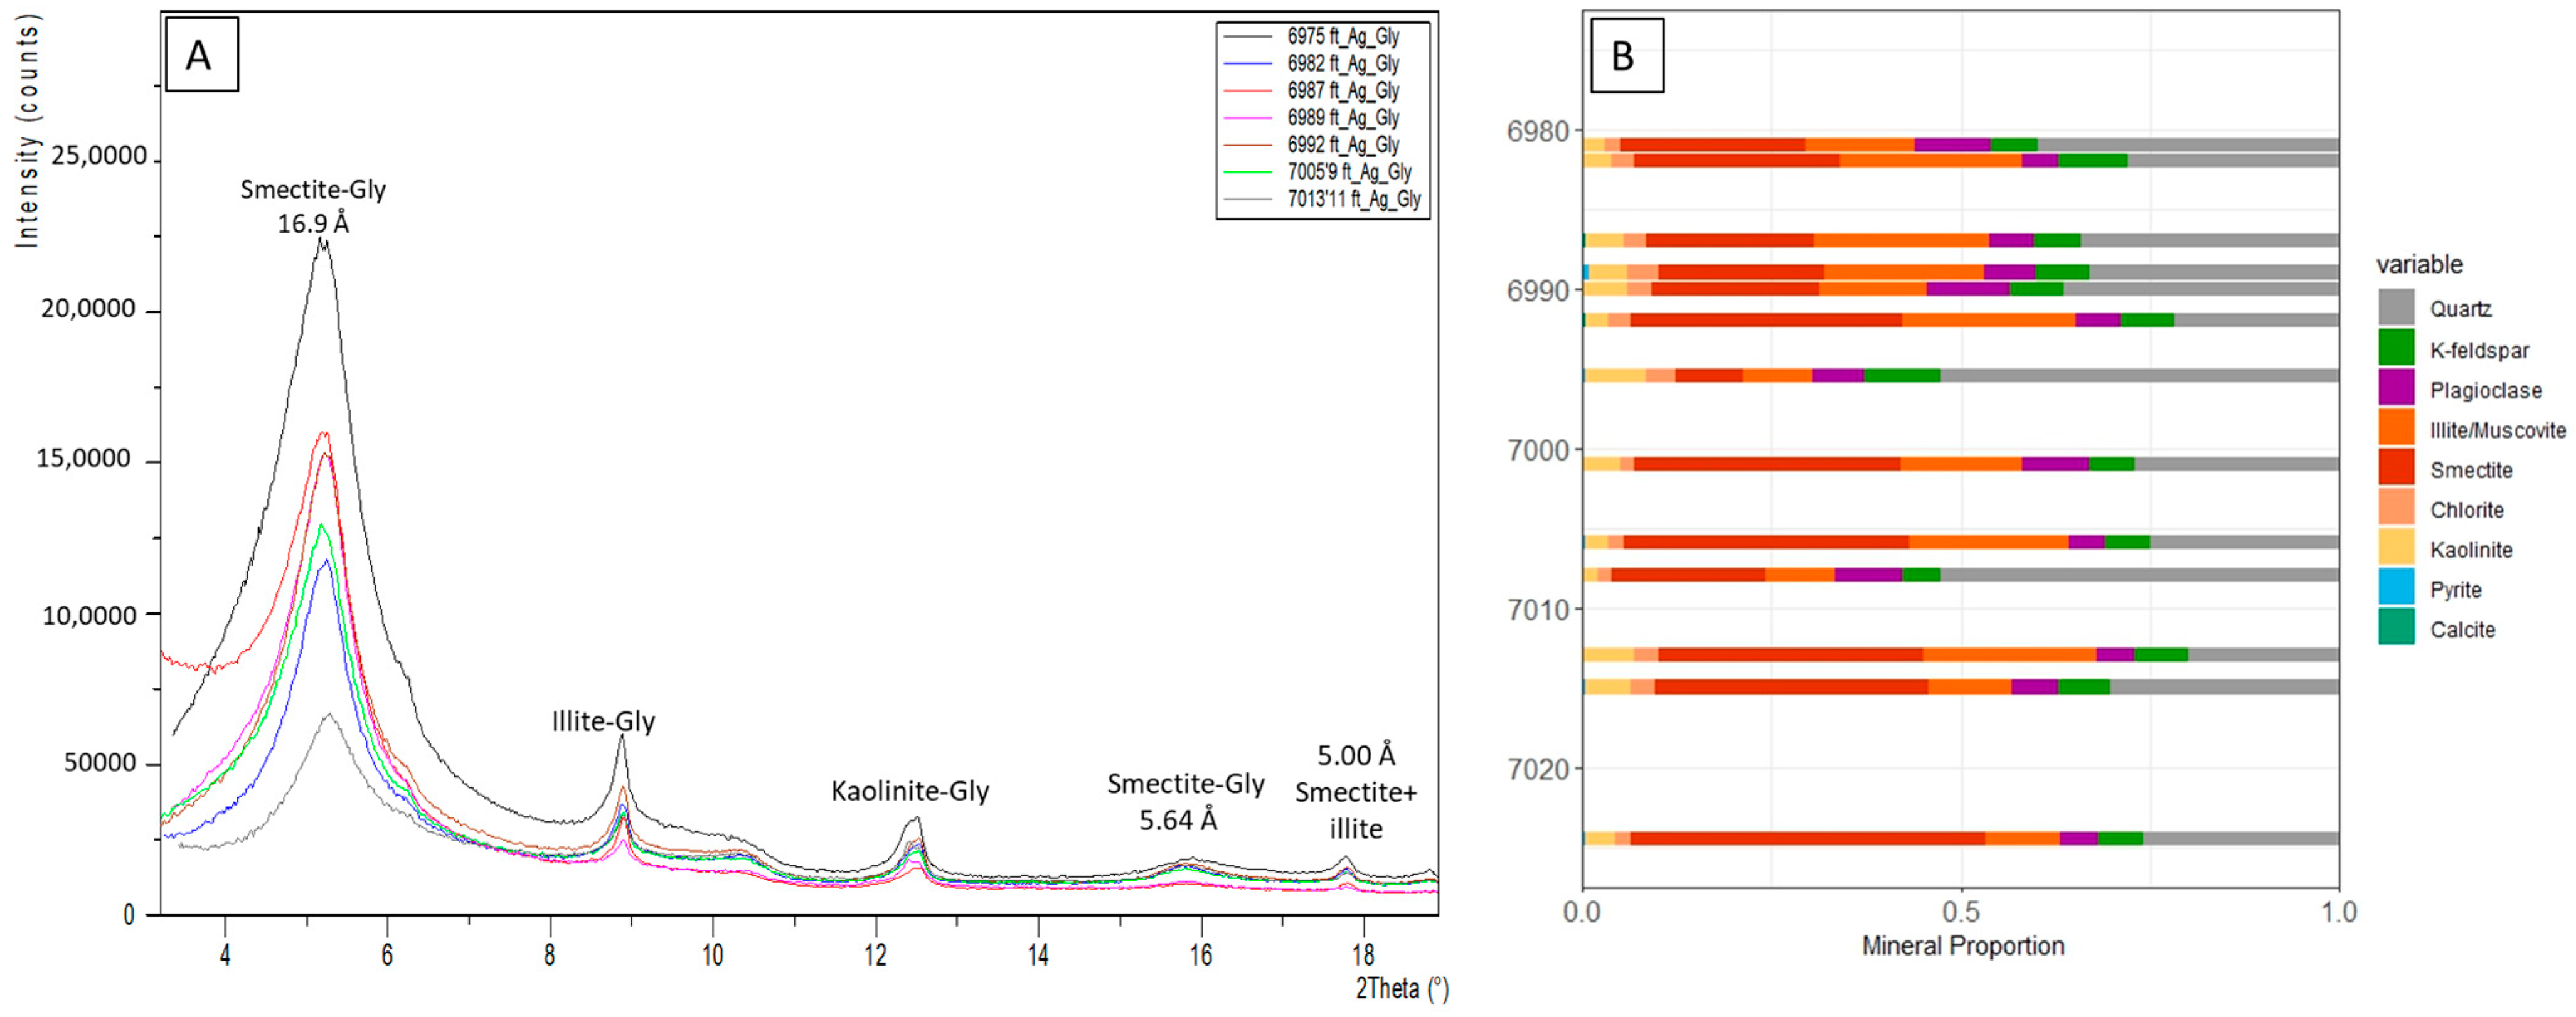
3.5. Mineralogy via X-Ray Diffraction (XRD)
3.6. Laser Particle Size Analysis (LPSA)
3.7. Mercury Intrusion Capillary Pressure (MICP)
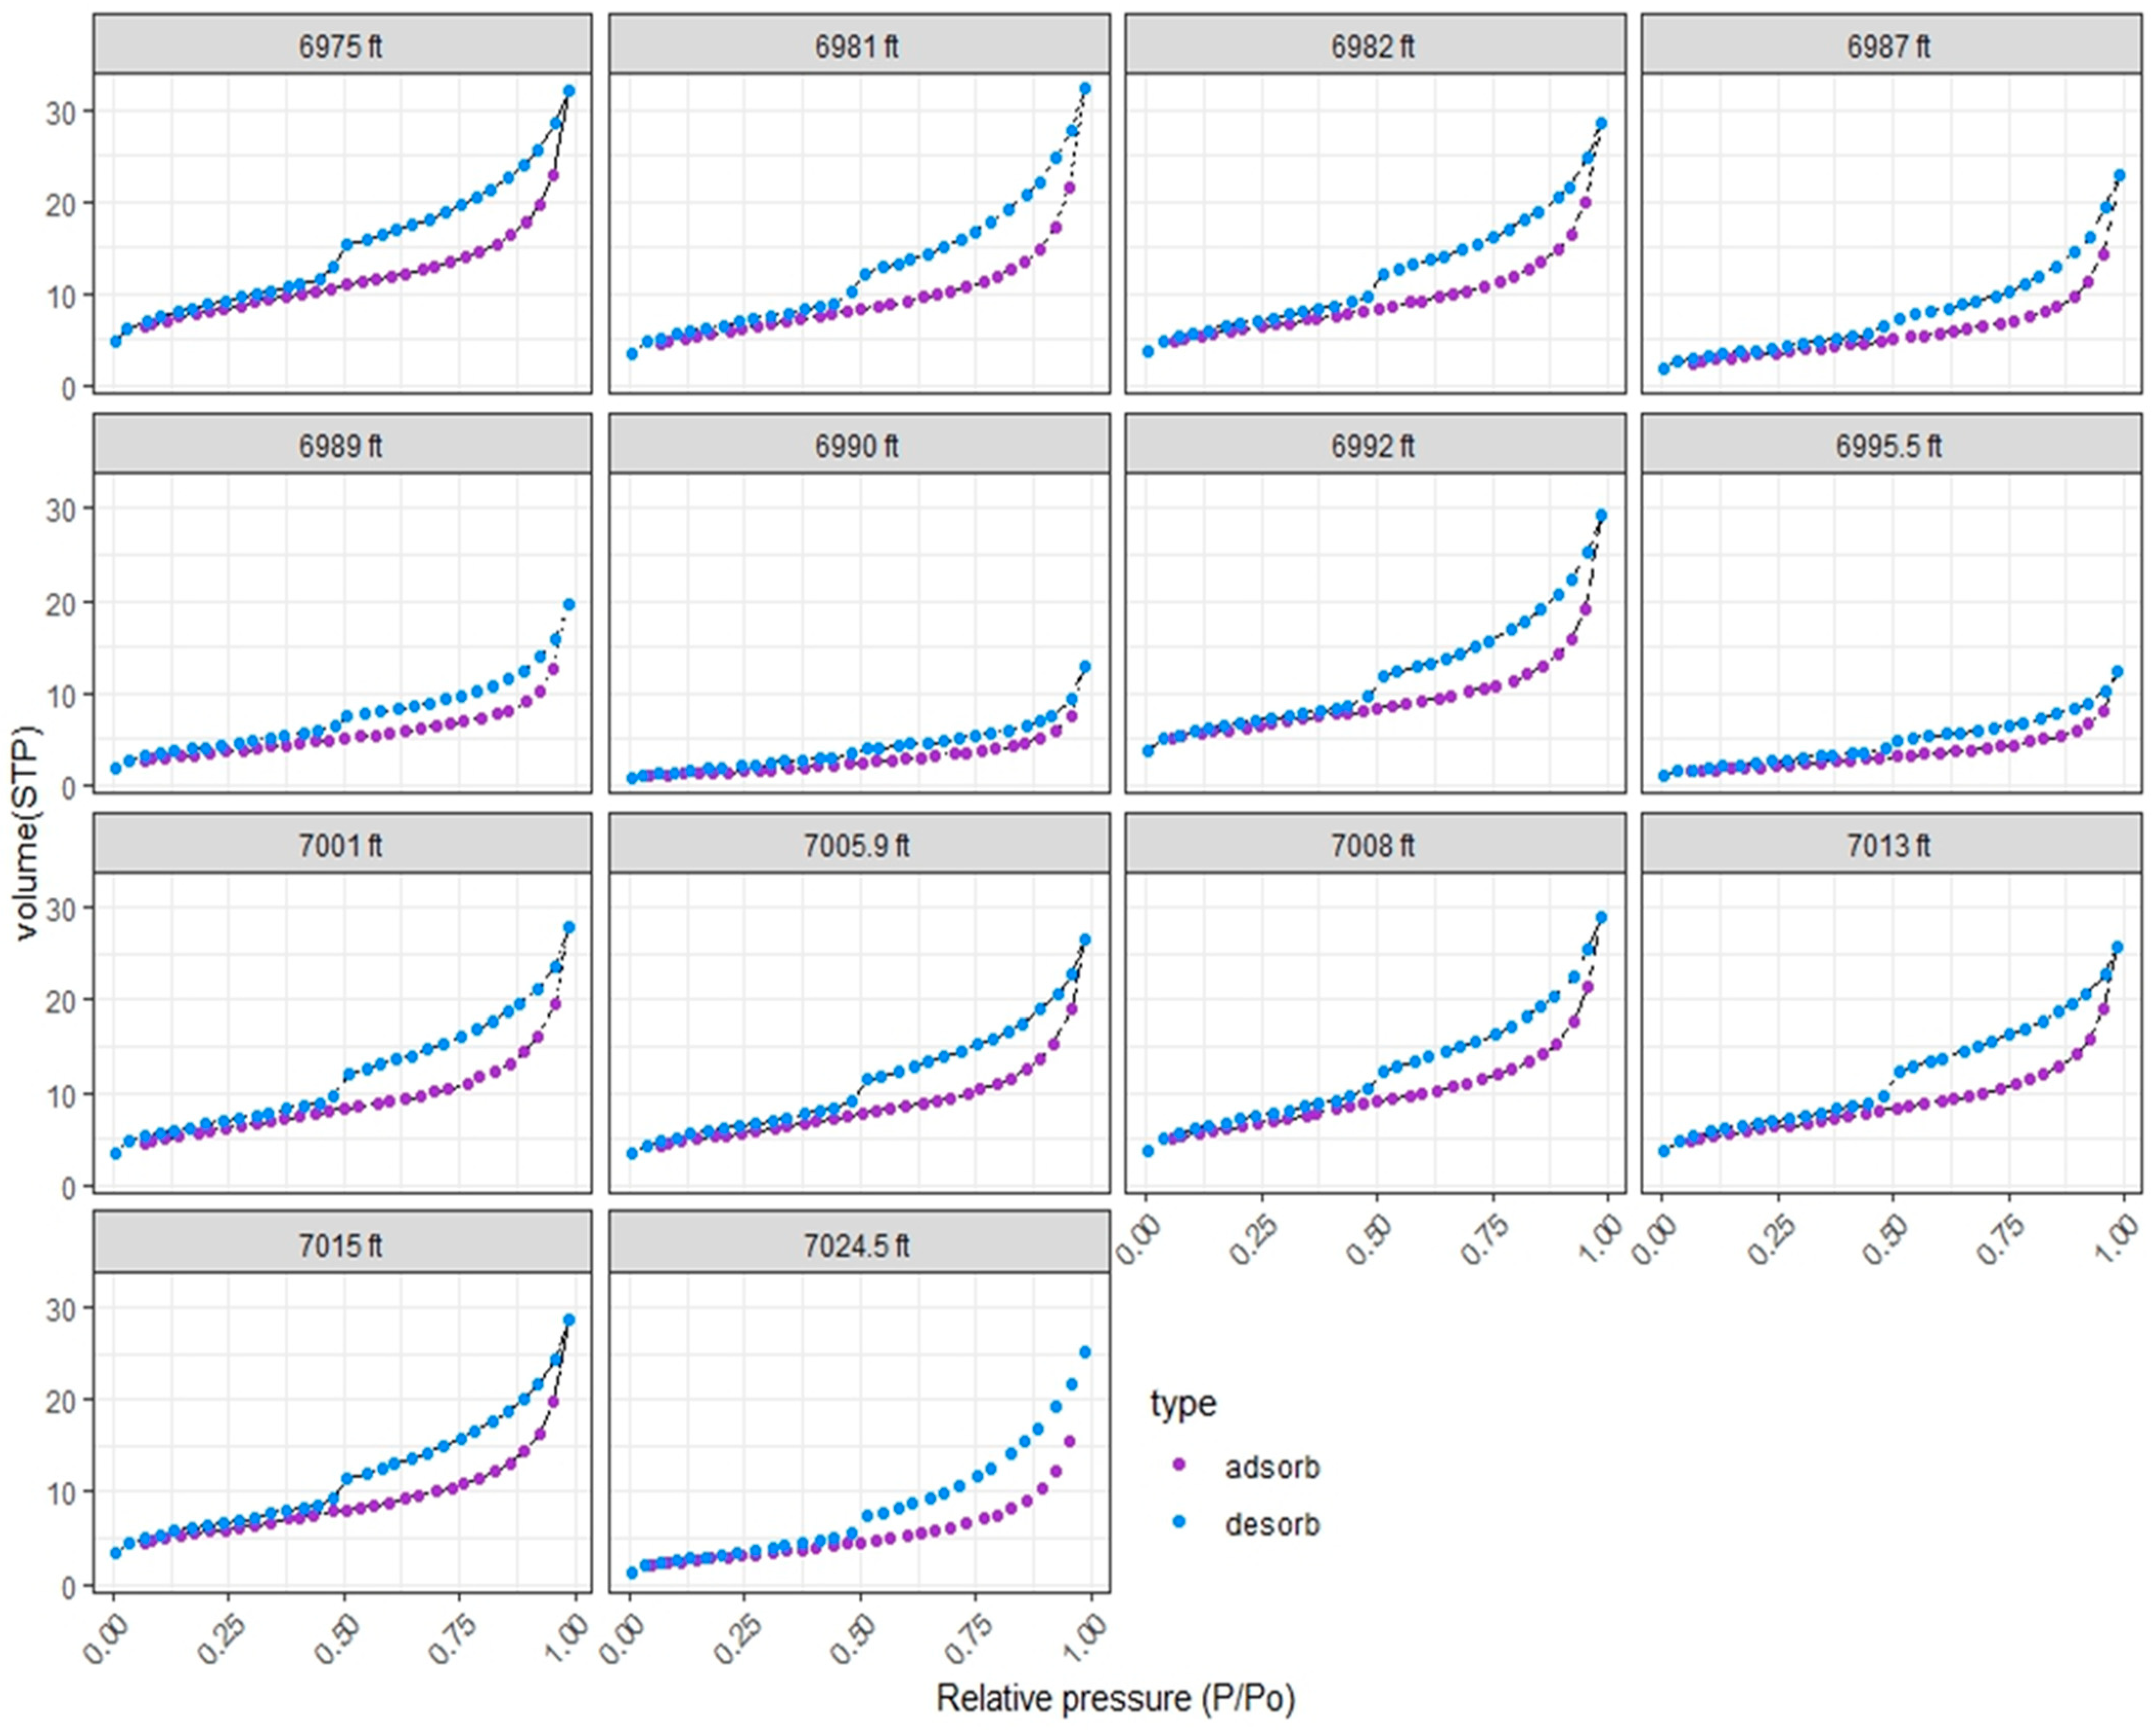
3.8. N2 Gas Adsorption via BET Analysis
3.9. Fractal Dimension Analysis for Complex Pore Structure and Surface
4. Results
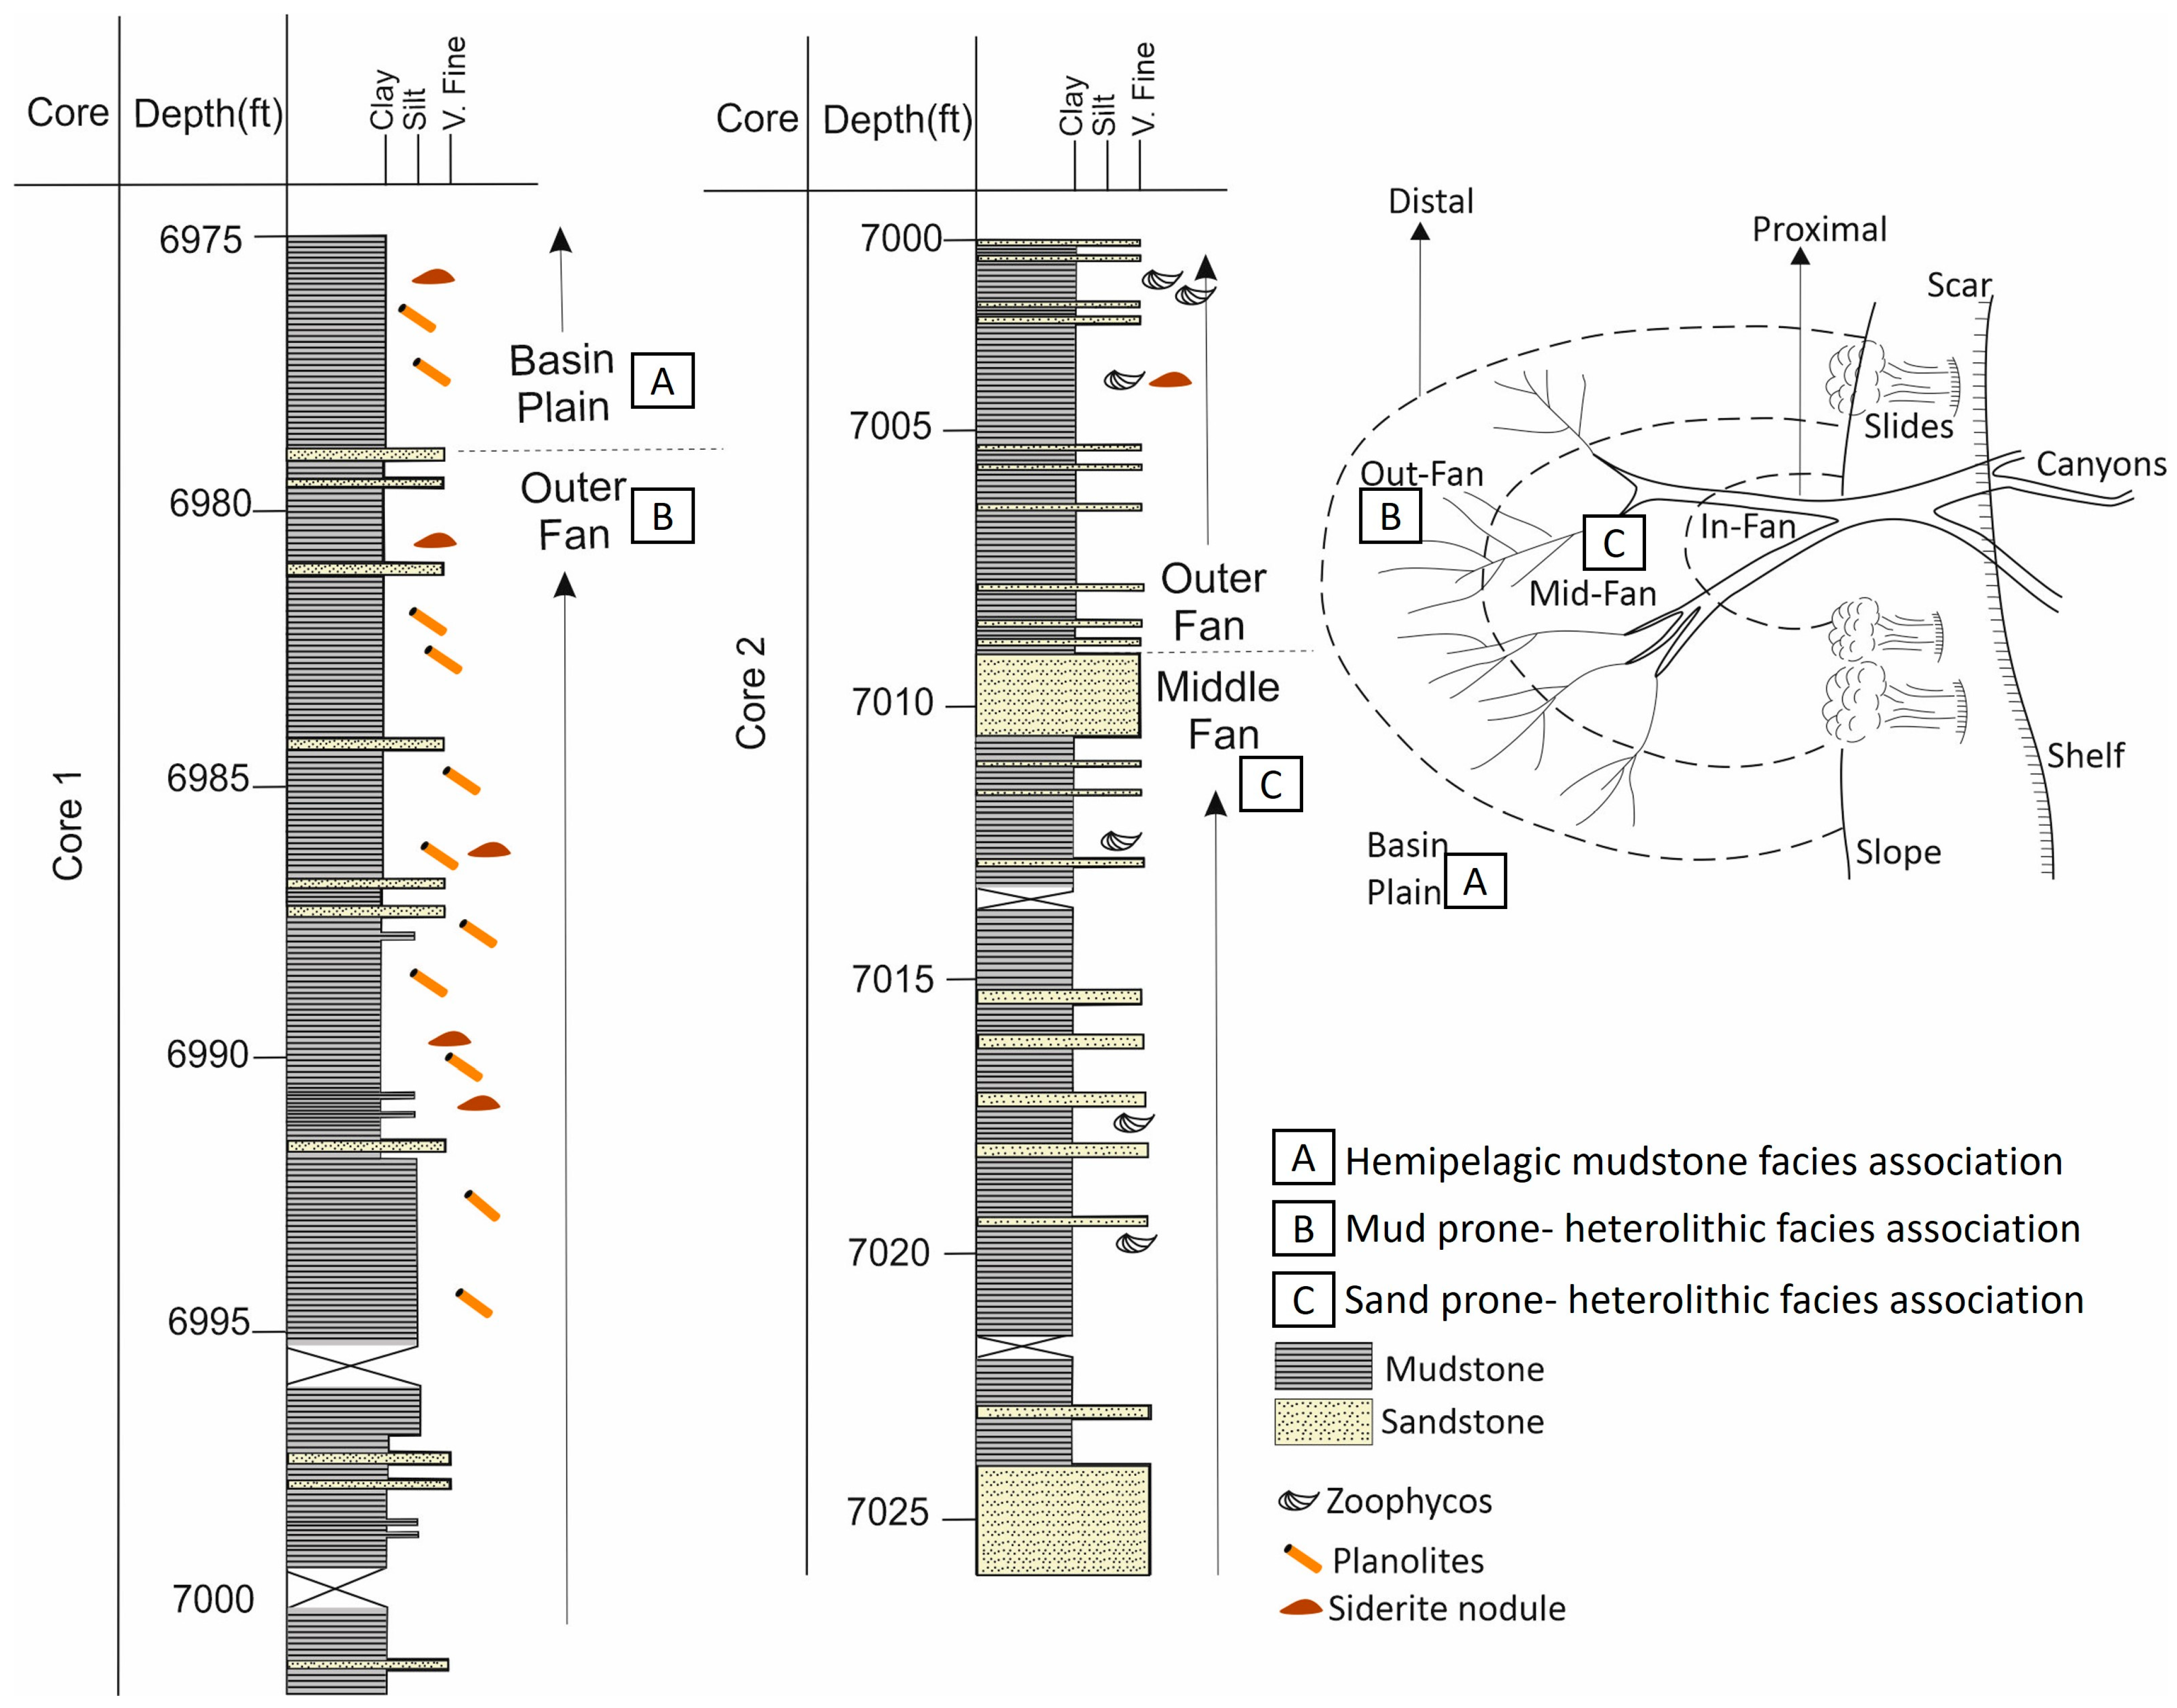
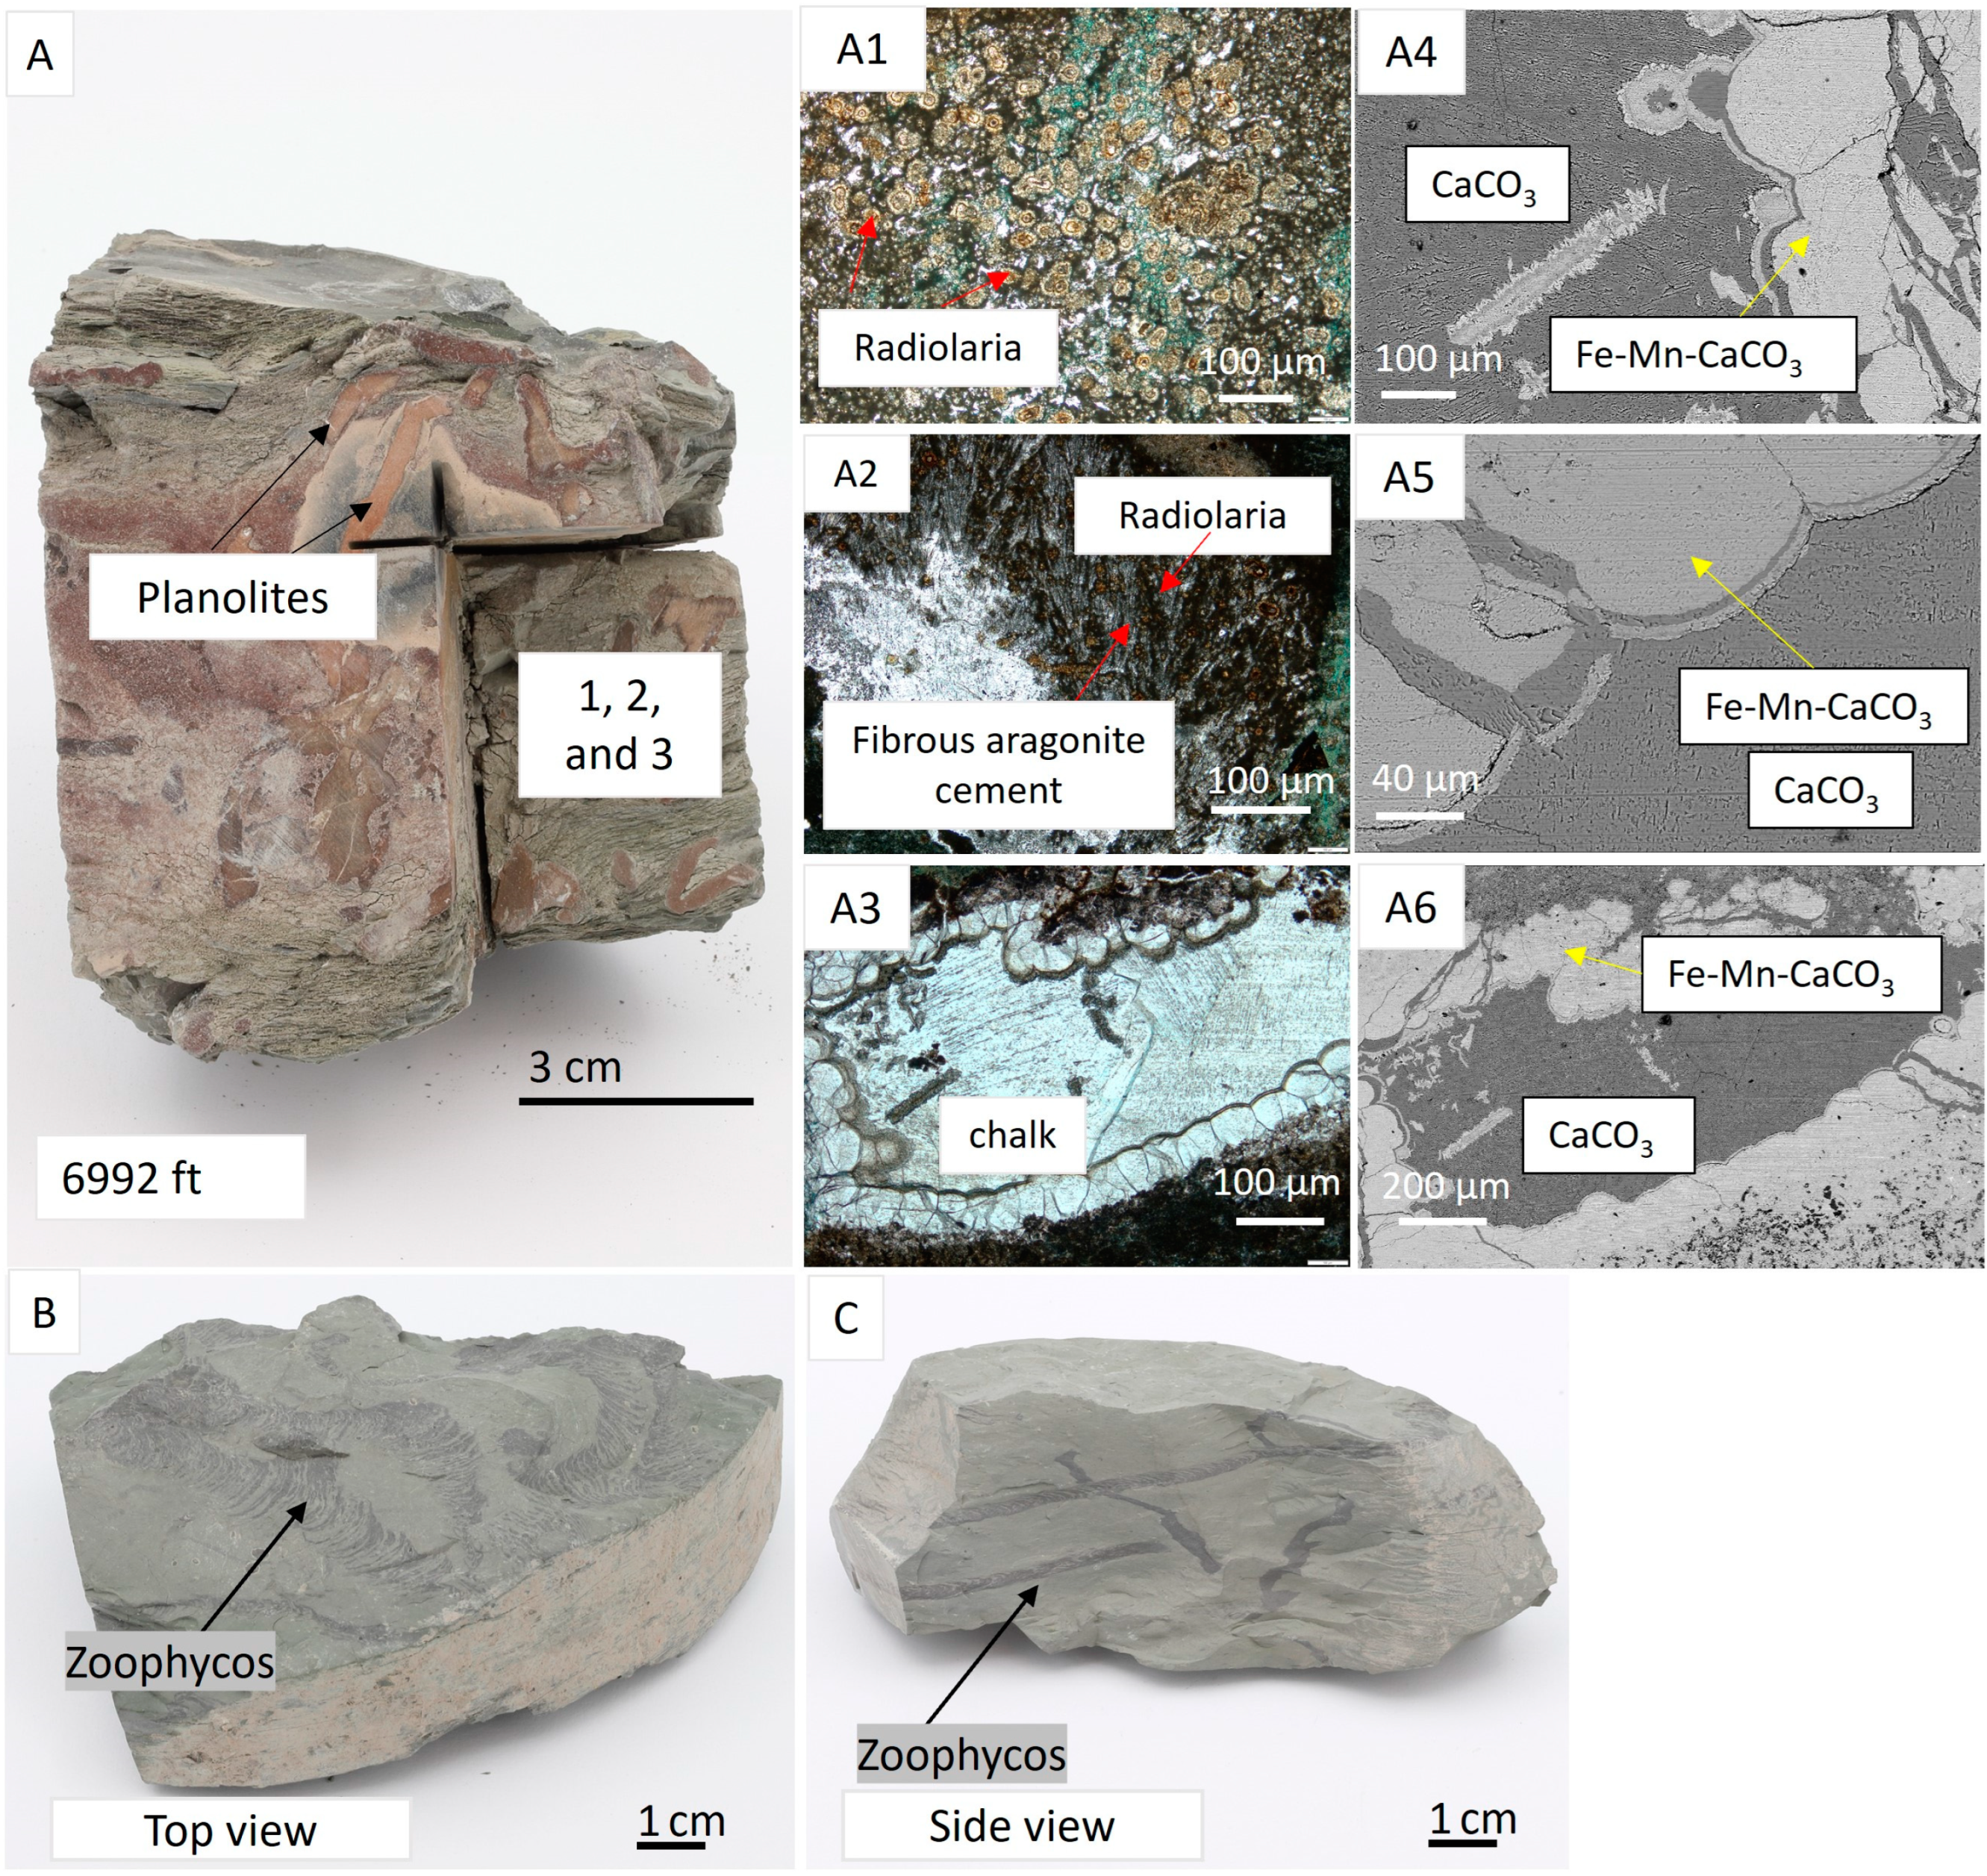
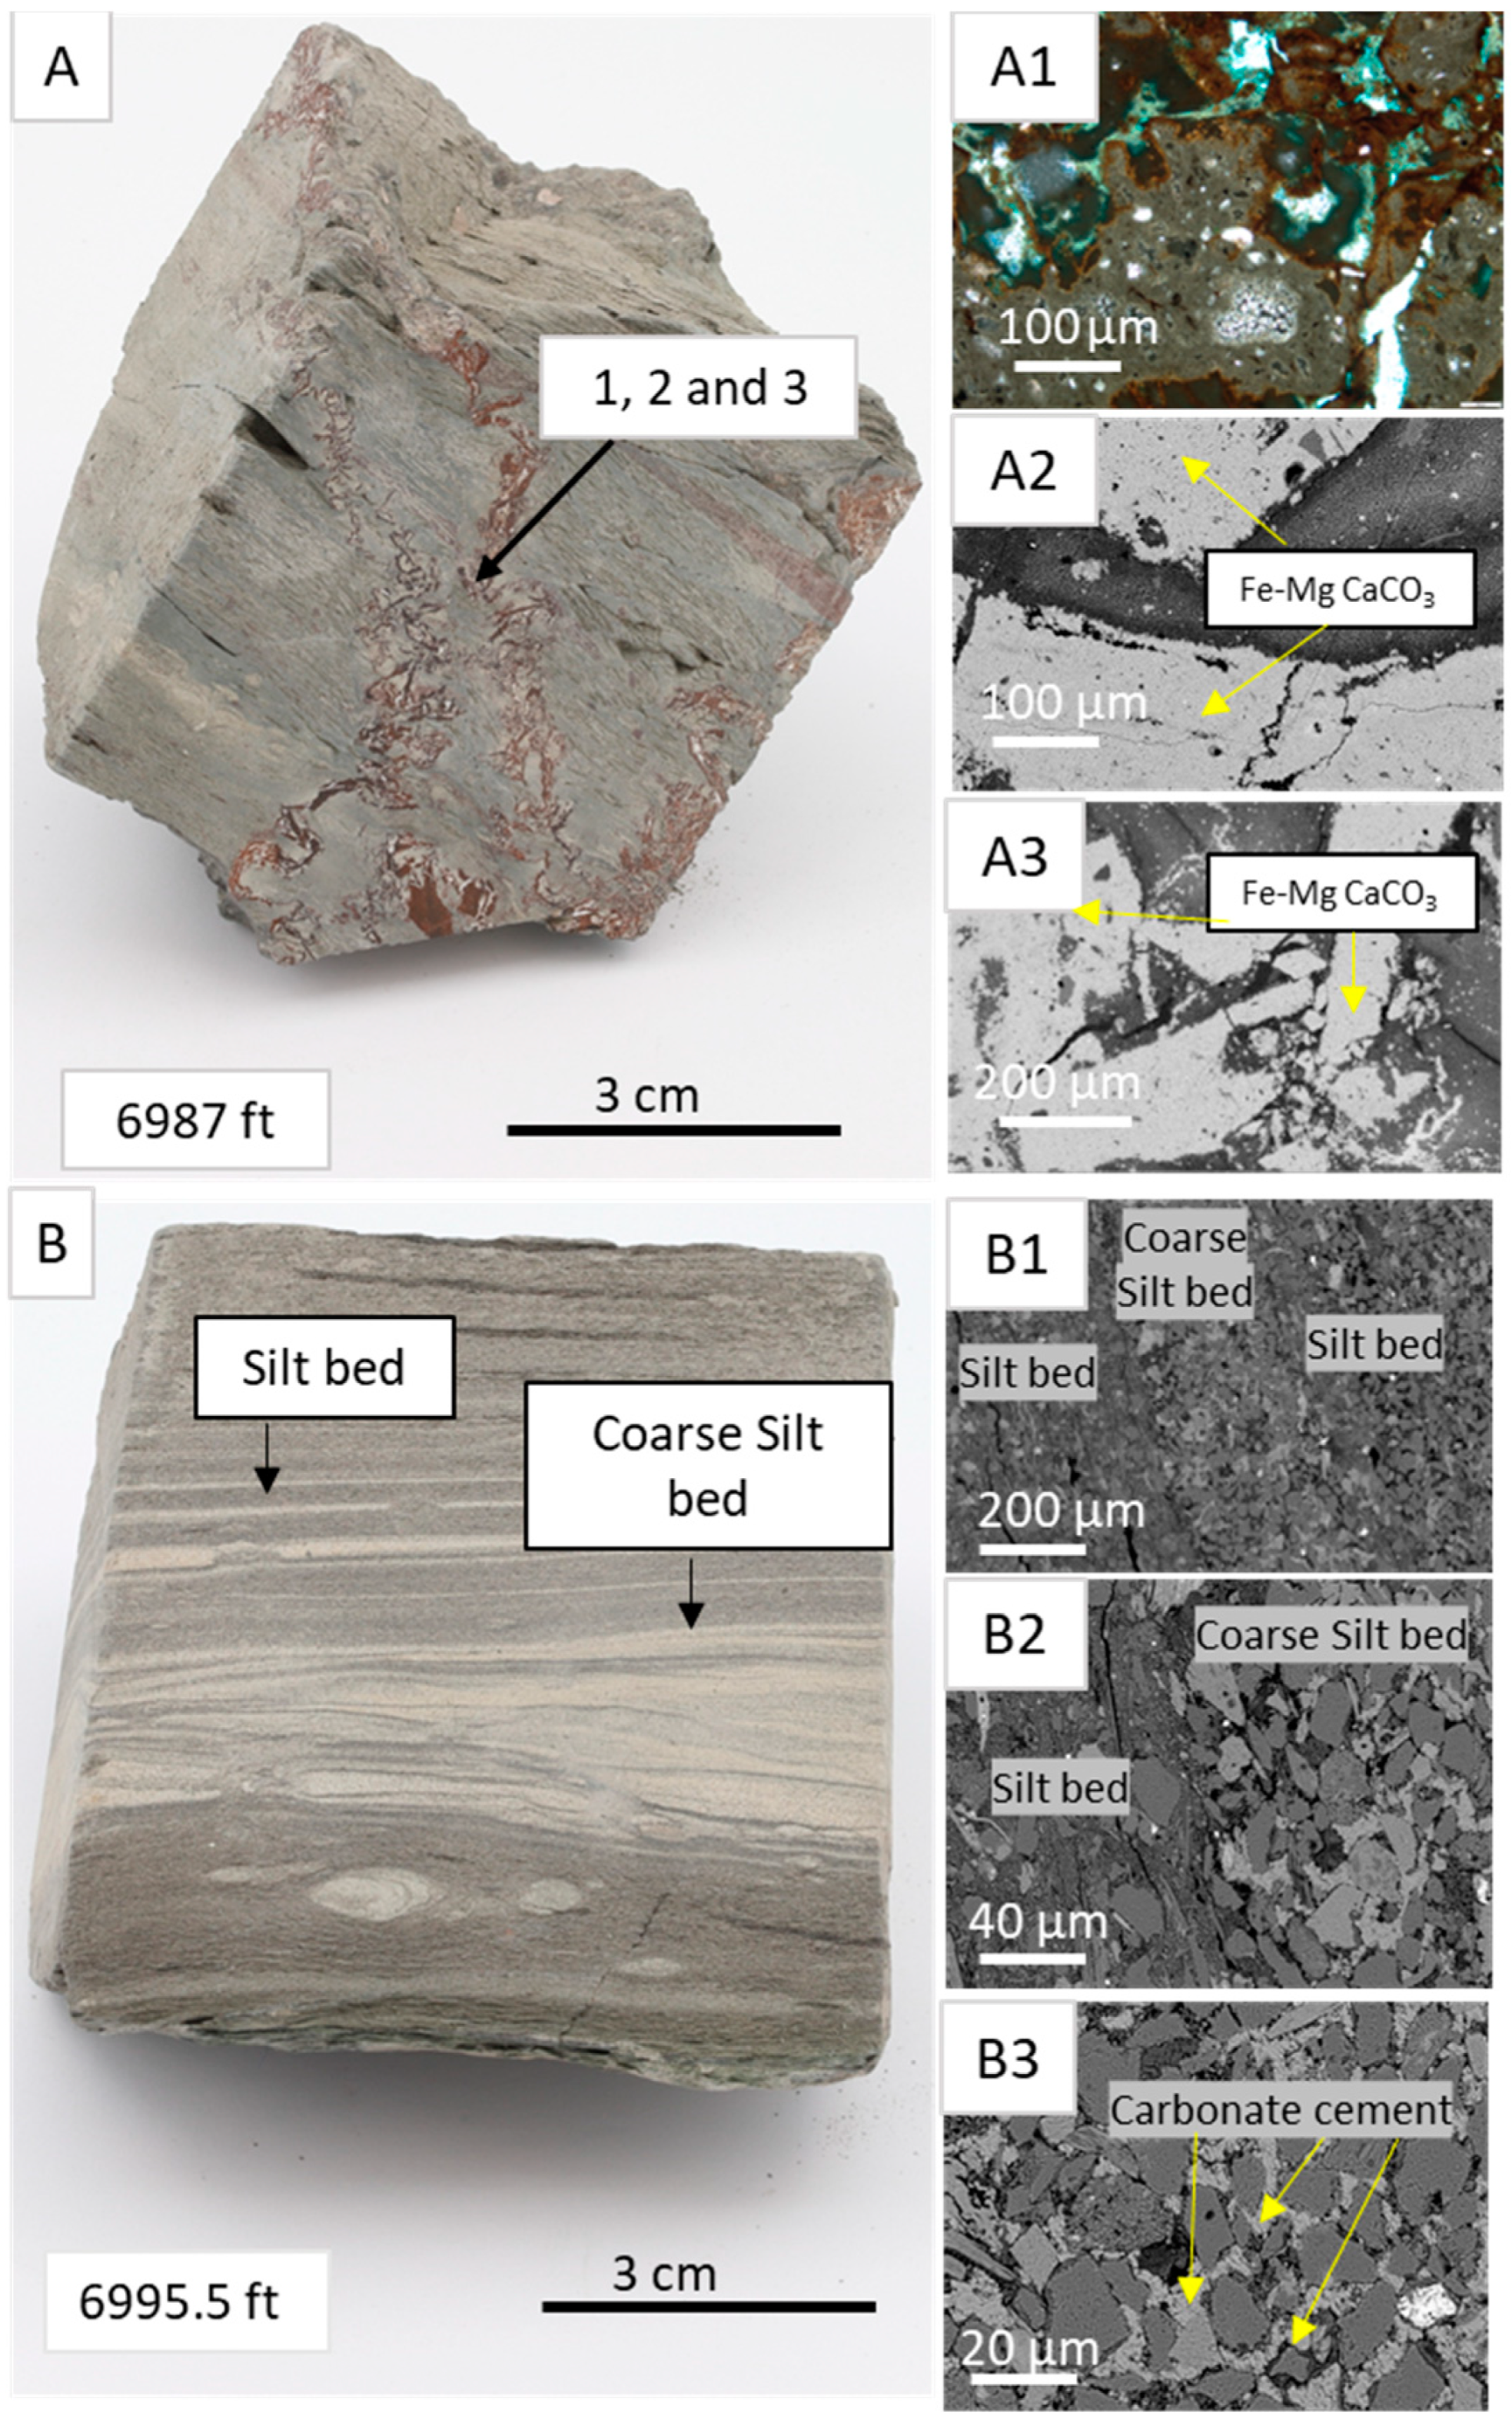
4.1. Core Logging
4.2. Facies Associations
4.3. Mineralogy and Petrography
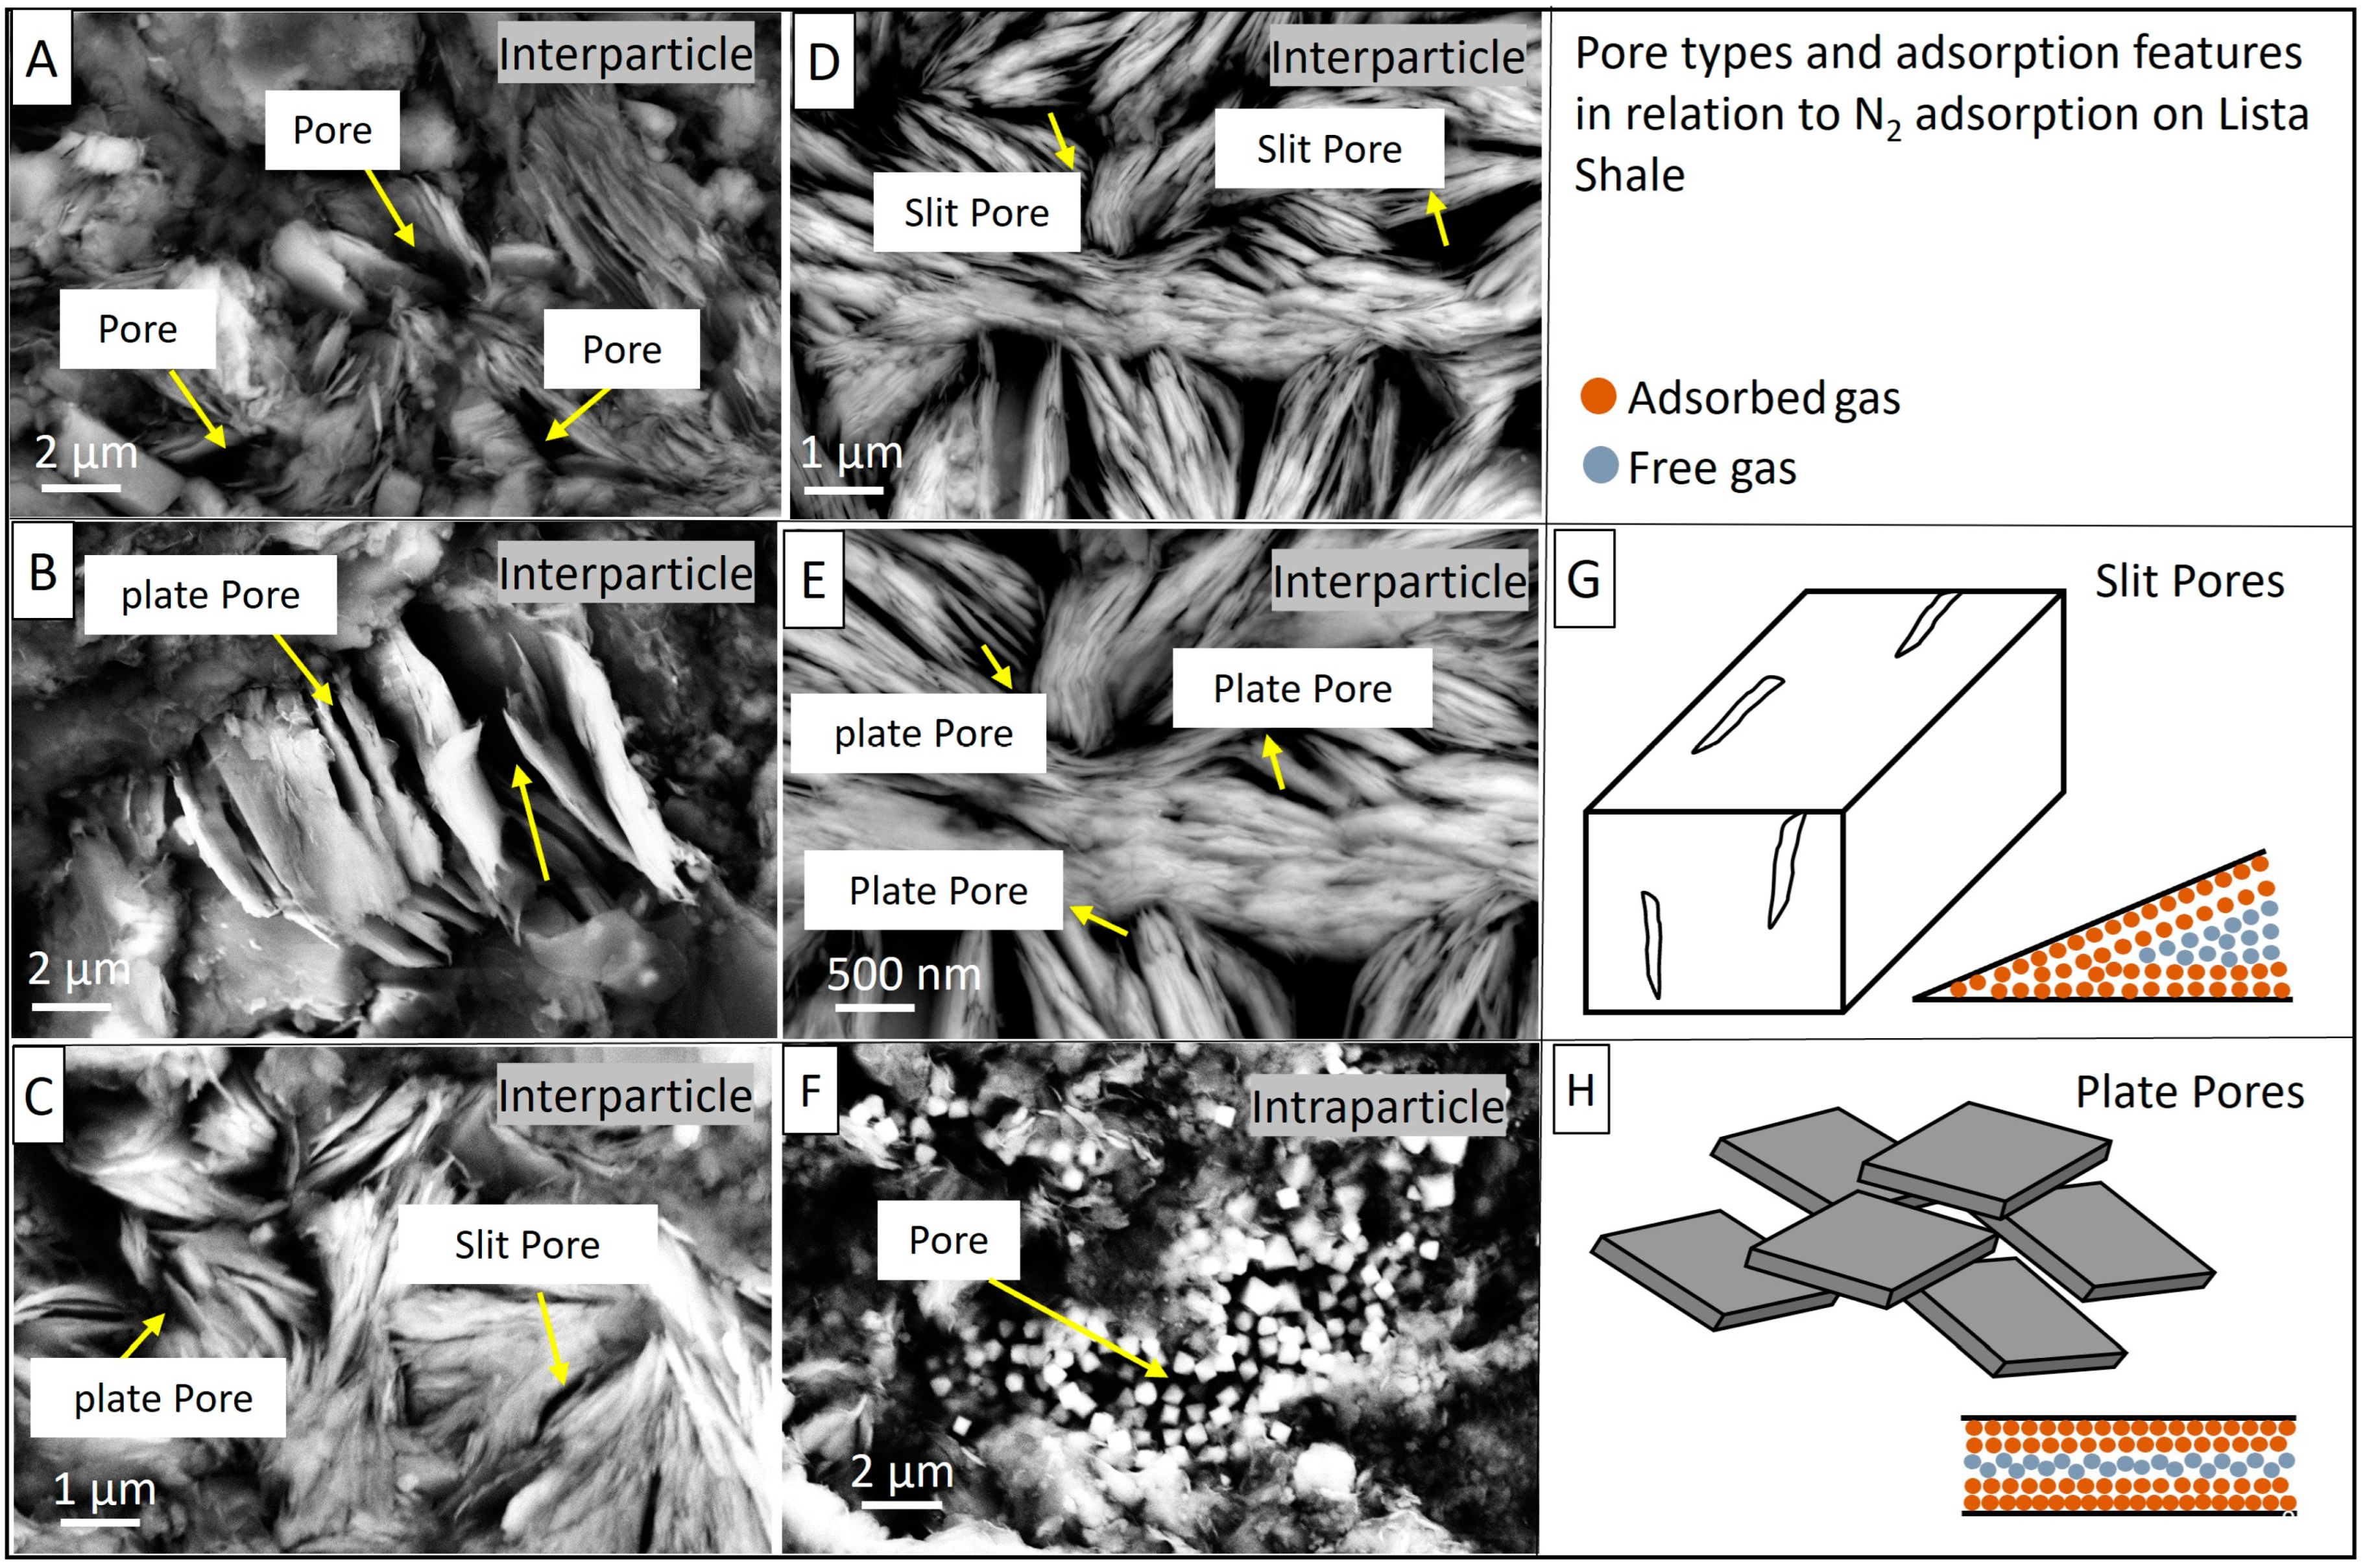
4.4. Pore Types
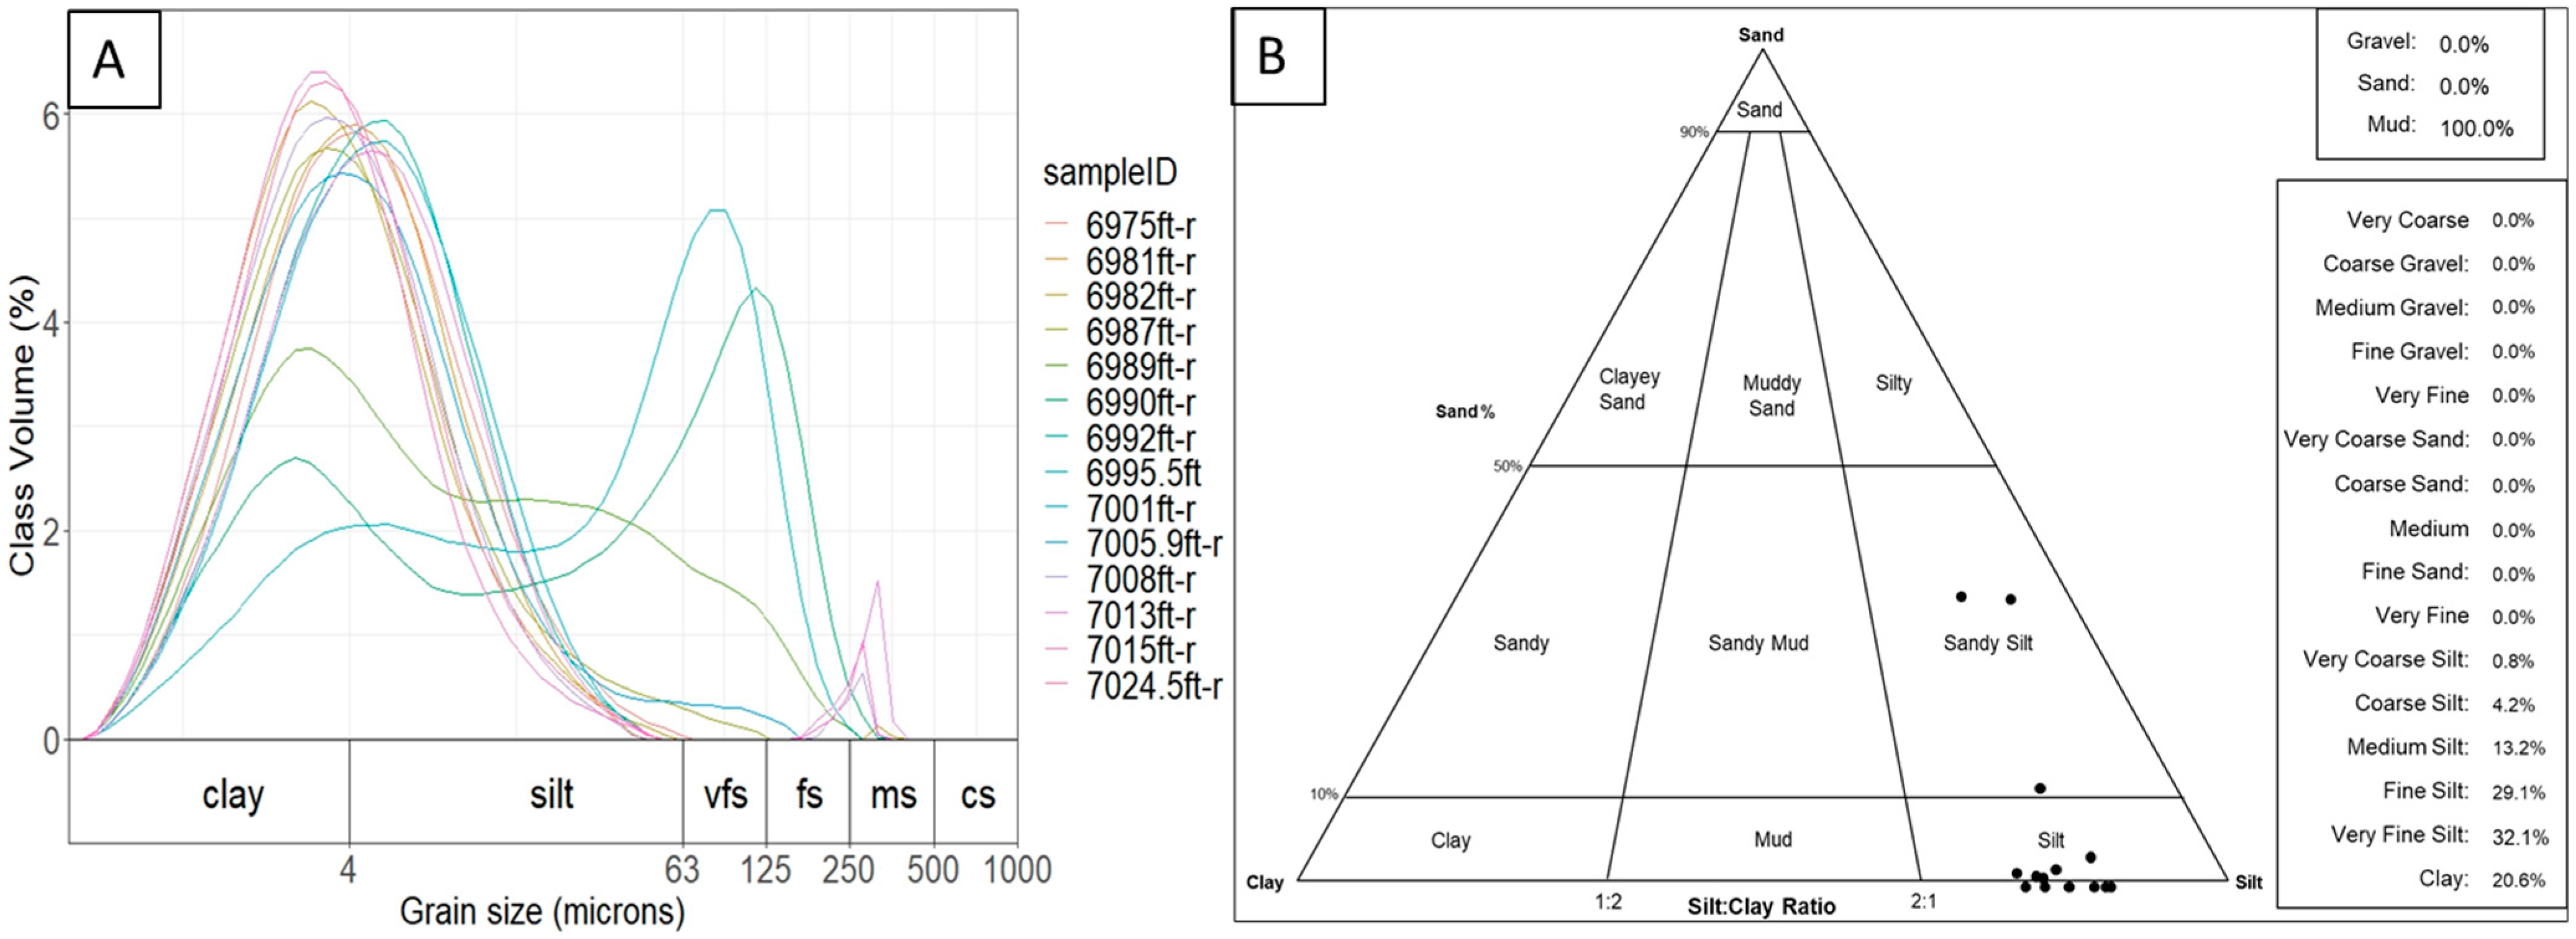
4.5. Particle Size Analysis (LPSA)
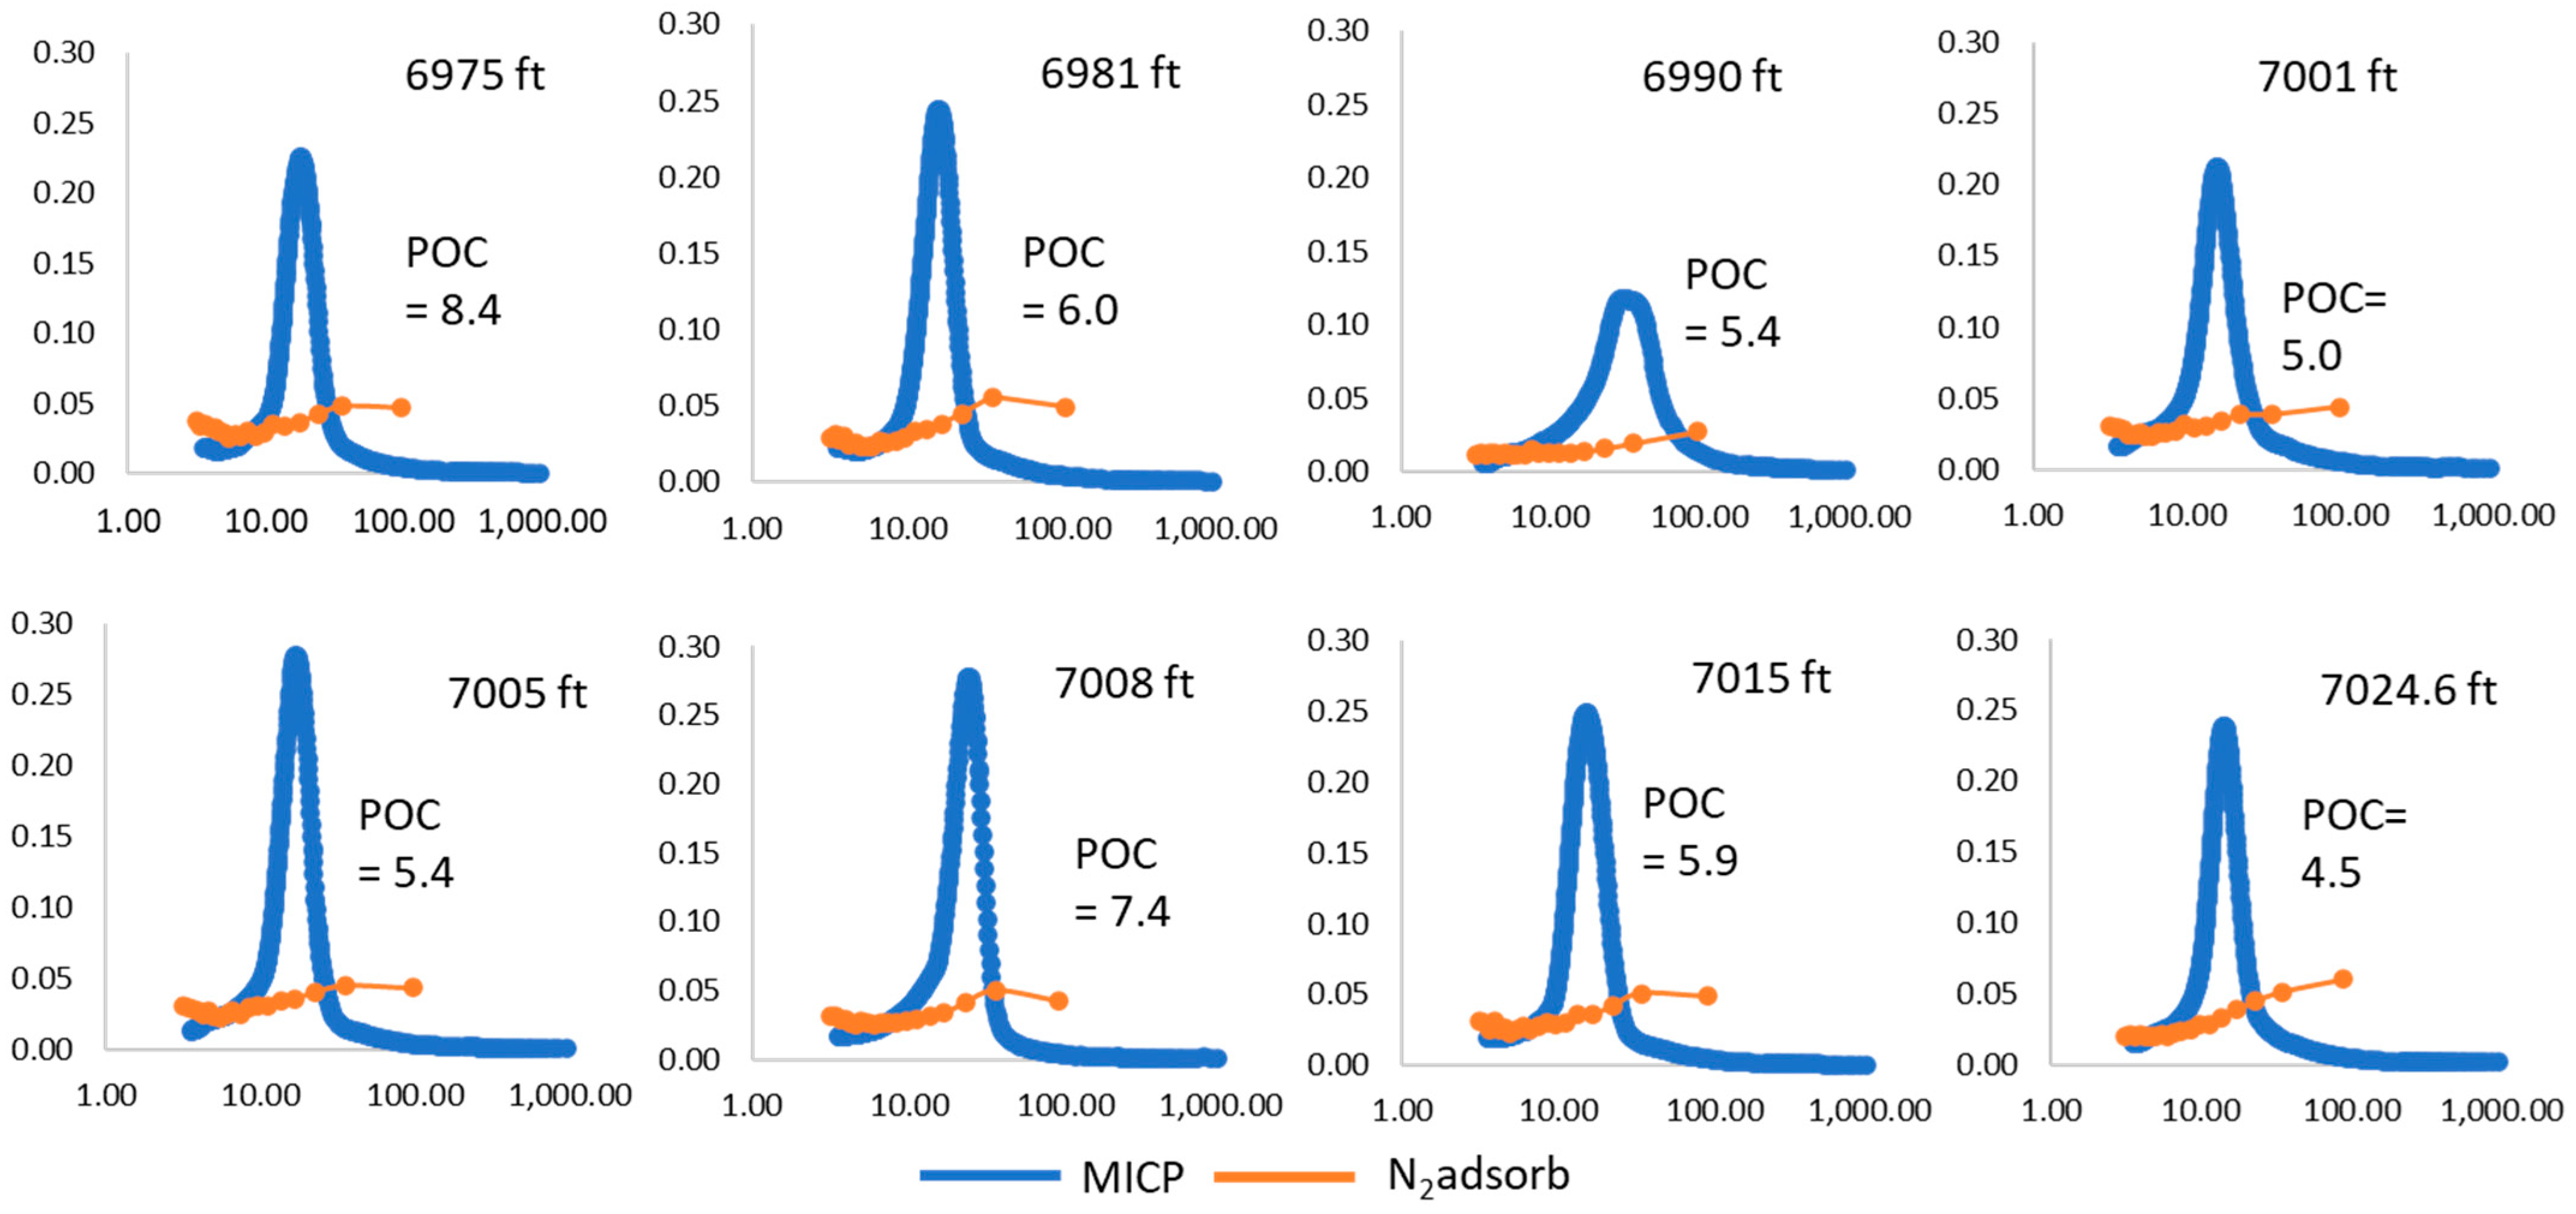
4.6. Mercury Intrusion Porosimetry (MICP)
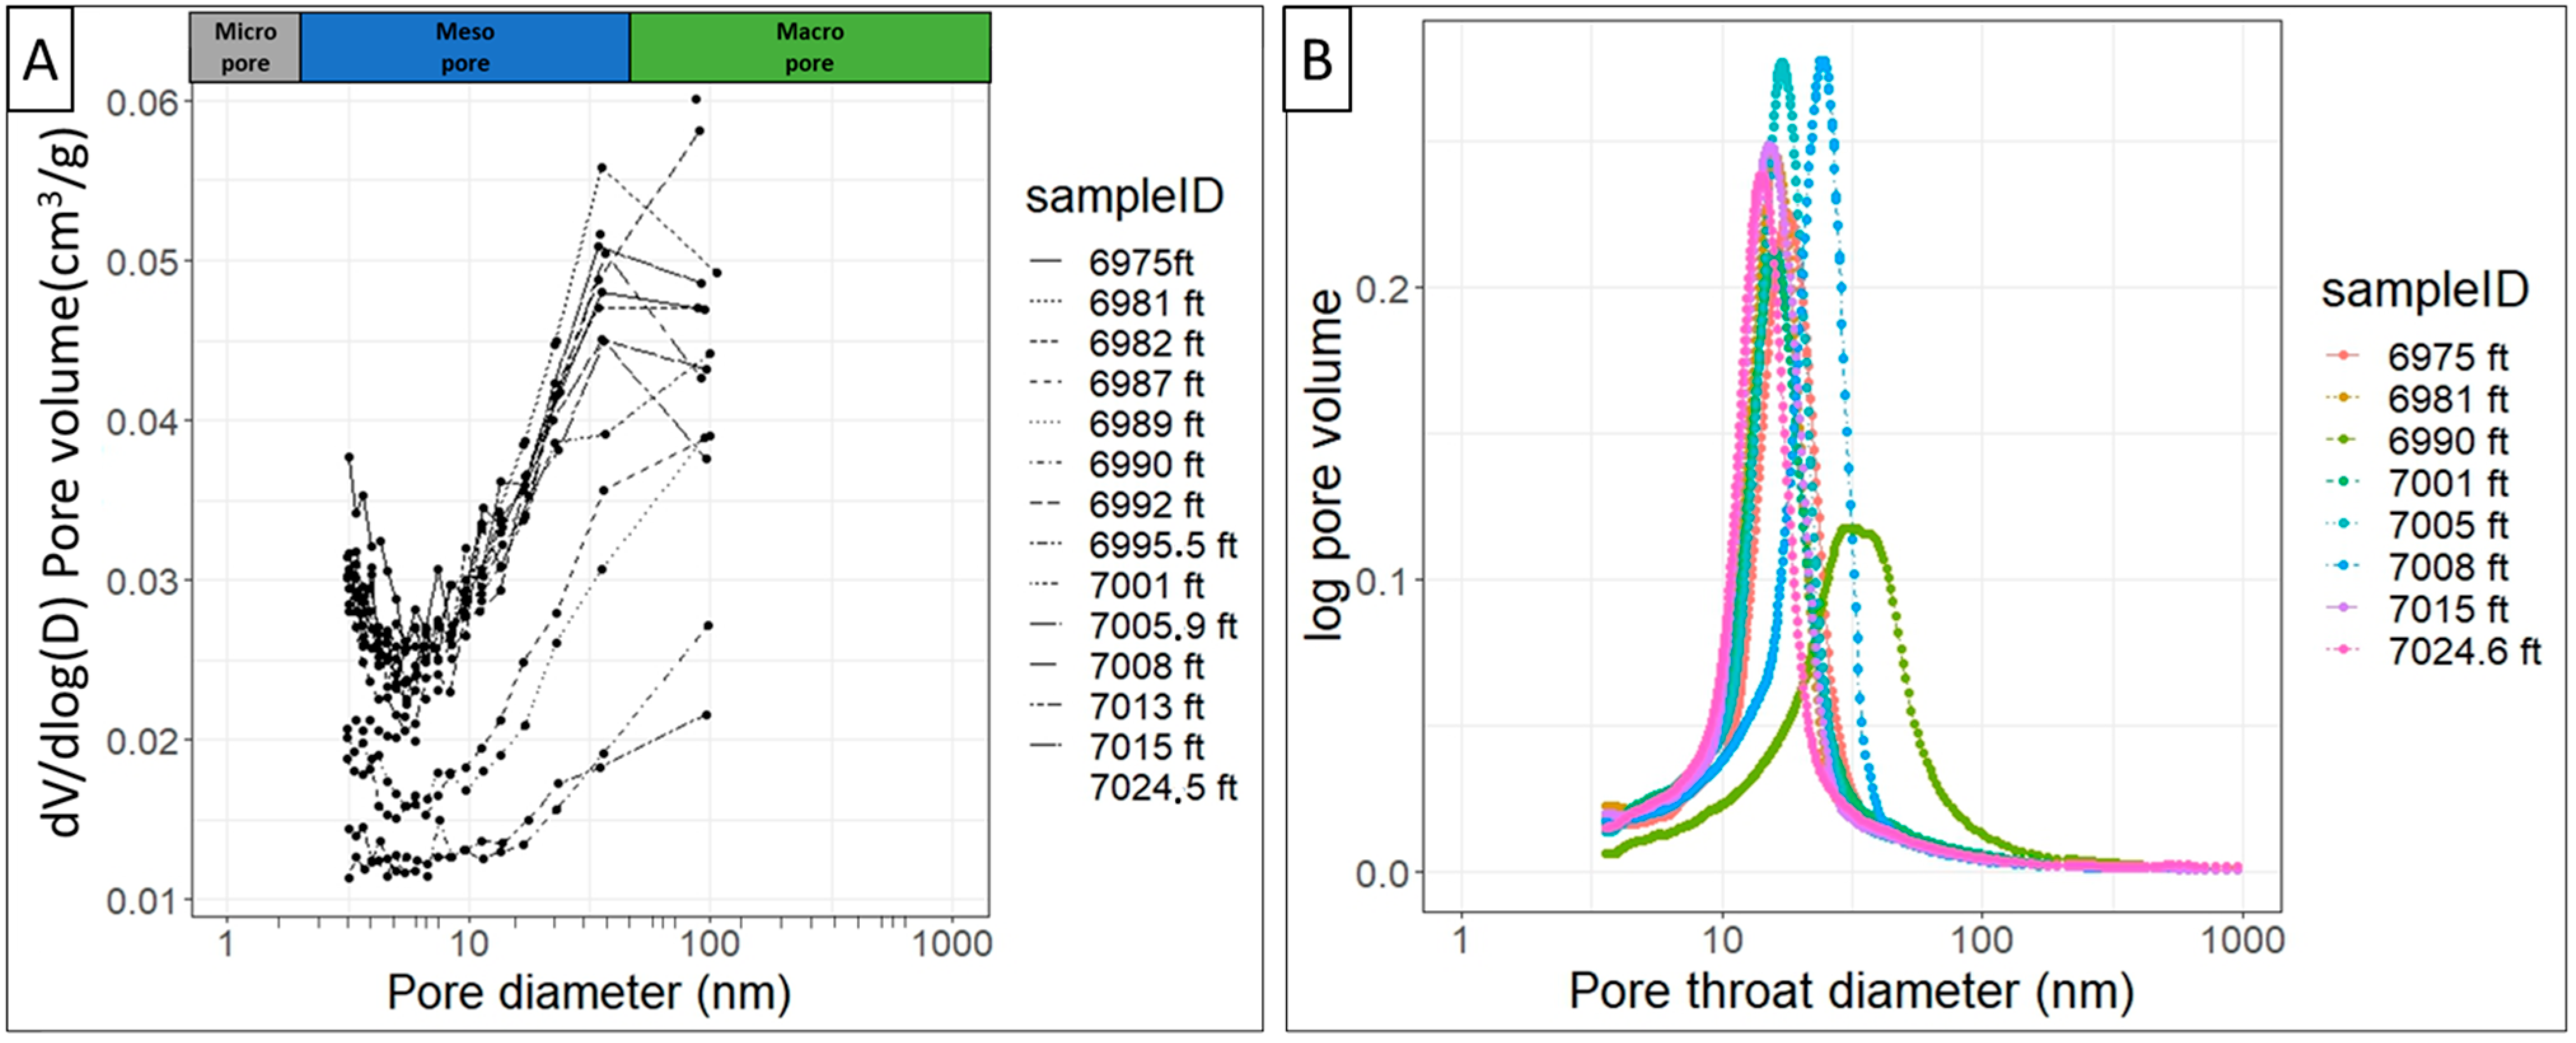
4.7. Pore Structure
4.8. Fractal Dimension Analysis Using Gas Adsorption Data
5. Discussion
5.1. Mineralogy and Depositional Environment of the Lista Shale CCS Top Seal
5.2. The Genesis and Evolution of Pore Types in the Lista Shale CCS Caprock
5.3. Pore Size Distribution in the Lista Shale CCS Caprock
5.4. Compositional Influences on the Pore Structure, Surface Area and Fractal Dimensions of the Lista Shale
5.5. The Impact of Reactive Surface Area on the Lista Shale Top Seal
6. Risk Assessment of the Lista Shale Top Seal
6.1. Seal Capacity and Its Relation to Depositional Environment
6.2. Lista Shale Seal Evaluation-Caprock Integrity and Risk of CO2 Leaks
6.3. Seal Capacity
6.4. Mechanical Stability of the Top Seal
7. Conclusions
- The Palaeocene Lista Shale is smectite-rich and quartz silt-bearing. It was deposited on top of the Mey Sandstone as part of a linked turbidite fan-abyssal plain system in a deep marine environment.
- The pores have been affected by both depositional and diagenetic processes; pore types include interparticle pores such as slit-shaped and plate-like pores, as well as intraparticle pores found within pyrite framboids.
- The pore bodies are primarily mesopores, with small proportions of micropores and macropores also present. The prevalence of mesopores aligns with the observed pattern in which free gas predominantly occupies macropore bodies, while adsorbed gas is mainly found within micropore bodies.
- The mean pore throat diameter measured by mercury intrusion is 17.00 nm, with a minimum of 3.56 nm and a maximum of 10,000 nm. For pore body diameters, BJH N2 adsorption detected a minimum of 3.10 nm and a maximum of 106.5 nm. By combining two fluid invasion techniques, mercury intrusion and gas adsorption, the entire spectrum of pore body and pore throat sizes can be accurately represented. The connection at the inflection point, where mesopores begin to fill, marks the junction at which mercury intrusion pore throat measurements align with gas adsorption measurements.
- The close similarity between the N2 adsorption pore body diameter (average 17.84 nm) and the mercury intrusion pore throat diameter (average 17.0 nm) indicates that the pores in the Lista Shale are likely to be slit-shaped.
- The complex heterogeneity of Lista Shale pore structure and mineral composition has strongly influenced the surface area. Greater quantities of smectite lead to higher surface area and pore volume, possibly due to a greater contribution of interparticle pores in the platy clay minerals that dominate in smectite-rich, silt-poor samples.
- If smectite or other aluminosilicate minerals such as chlorite or plagioclase reacted with CO2, newly exposed minerals would potentially lead to increased reactive surface area, possibly feeding back to increased reaction rates.
- According to assessments of the diffusive flux, advection rate if capillary entry pressure is exceeded, and its overall stability and sealing characteristics, the Lista Shale shows strong potential to serve as an effective barrier against CO2 leakage.

| Attribute | Helpful for a Good Top Seal | Detrimental to Being a Good Top Seal | Example | References |
|---|---|---|---|---|
| Pore body size | Preferably in the micro-pore range | When in meso- to macro-pore range | Lista Shale, Rodby Shale, Sichuan Basin | AlNajdi et al. [21], Chen et al. [51] |
| Pore throat size | Preferably in the micro-pore range | When in meso- to macro-pore range | Lista Shale, Rodby Shale, Mercia Mudstone | AlNajdi et al. [21], Armitage et al. [26] |
| Pore type | Slit pores preferred | Round pores | Lista Shale, Rodby Shale, Sichuan Basin | AlNajdi et al. [21], Chen et al. [51] |
| Pore volume | Low | High | Lista Shale, Rodby Shale, Sichuan Basin | AlNajdi et al. [21], Chen et al. [51] |
| Specific surface area | Low (to minimise reactivity) | High | Lista Shale, Rodby Shale, Sichuan Basin | AlNajdi et al. [21], Chen et al. [51] |
| Particle size | Low | High | Lista Shale, Rodby Shale | AlNajdi et al. [21], Pandey et al. [28] |
| Sorting | Poorly sorted sediment preferred | Well sorted sediment preferred | Lista Shale, Rodby Shale | AlNajdi et al. [21] |
| Mineralogy—clay | Inert clay minerals (e.g., illite, kaolinite) | Reactive clay minerals (e.g., chlorite, some smectites) | Lista Shale, Rodby Shale, Mercia Mudstone | Worden et al. [14], AlNajdi et al. [21], Armitage et al. [26] |
| Mineralogy—carbonate | Zero carbonate preferred | Calcite-rich (most reactive carbonate) | Lista Shale, Rodby Shale | Worden et al. [14], AlNajdi et al. [21] |
| Mineralogy—silt minerals | Quartz preferred (least reactive) | Reactive feldspar (Ca-rich are worst of all) | Lista Shale, Rodby Shale, Mercia Mudstone | Worden et al. [14], AlNajdi et al. [21], AlNajdi and Worden [23], Armitage et al. [26] |
| Mineralogy—silt proportions | Low (minimum brittleness) | High (increasing brittleness) | Lista Shale, Rodby Shale, Mercia Mudstone | Worden et al. [14], AlNajdi et al. [21], AlNajdi and Worden [23], Armitage et al. [26] |
| Mineralogy—Ca-sulphates | Low (minimum risk of volume change) | High (elevated risk of fractures and veins) | Mercia Mudstone | Worden et al. [14], AlNajdi and Worden [23], Armitage et al. [26] |
| Brittleness | Low | High | Lista Shale, Rodby Shale | Worden et al. [14], Ingram and Urai [110] |
| Unconfined compressive strength | Low | High | Lista Shale, Rodby Shale | Worden et al. [14], Ingram and Urai [110] |
| Thickness of top seal | Thicker seals better to minimise transport out of the storage site and risk of fault leakage | Thin seals potentially poor as they would lead to risk of leakage | Lista Shale, Rodby Shale, Sleipner, Rousse, In Salah, Ketzin, Frio, SACROC | AlNajdi et al. [21], Espinoza and Santamarina [96] |
| Lateral extent of top seal | Wide lateral extent preferred to minimise spillage and upward CO2 migration | Limited lateral extent would lead to risk of upwards leakage | Otway Basin | Kaldi et al. [4] |
| Fluid pressure relative to hydrostatic | Low fluid pressures preferred to minimise risk of capillary entry pressure being exceeded | High fluid pressures may lead to capillary entry pressure being exceeded | Lista Shale, Rodby Shale | Kaldi et al. [4], AlNajdi and Worden [23], Espinoza and Santamarina [96], Ingram and Urai [110] |
| Effective stress history (maximum palaeo-depth) | Sufficient to compact the mudstone, but low enough to prevent elevated brittleness | Negligible compaction is not helpful; excess compaction may not be helpful either | Lista Shale, Rodby Shale, Rousse, Mercia Mudstone, In Salah, Nordland Shale | AlNajdi and Worden [23], Ingram and Urai [110] |
| Thermal history (maximum palaeo-temperature) | Maximum palaeotemperature < 80 °C preferred to minimise mineral diagenesis and increasing brittleness | Maximum palaeotemperature > 120 °C as chemical compaction and mineral diagenesis lead to elevated brittleness | Lista Shale, Rodby Shale, Rousse, Mercia Mudstone, In Salah, Nordland Shale | AlNajdi and Worden [23] |
| Geological age of top seal | Younger rocks (e.g., Cenozoic) preferred to minimise diagenesis, but not too young to prevent sufficient compactional porosity-loss | Old rocks (e.g., Palaeozoic) have greatest chance of becoming brittle and strong (but will have lowest porosity and permeability) | Lista Shale, Rodby Shale, Rousse, Mercia Mudstone, In Salah, Nordland Shale | AlNajdi and Worden [23] |
Author Contributions
Funding
Data Availability Statement
Acknowledgments
Conflicts of Interest
References
- Aplin, A.C.; Fleet, J.A.; Macquaker, J.H.S. Muds and Mudstones: Physical and Fluid Flow Properties; The Geological Society of London: London, UK, 1999; p. 158. [Google Scholar]
- Aplin, A.C.; Macquaker, J.H.S. Mudstone diversity: Origin and implications for source, seal, and reservoir properties in petroleum systems. Am. Assoc. Pet. Geol. Bull. 2011, 95, 2031–2059. [Google Scholar] [CrossRef]
- Williams, G.A.; Chadwick, R.A. Influence of reservoir-scale heterogeneities on the growth, evolution and migration of a CO2 plume at the Sleipner Field, Norwegian North Sea. Int. J. Greenh. Gas Control 2021, 106, 103260. [Google Scholar] [CrossRef]
- Kaldi, J.; Daniel, R.; Tenthorey, E.; Michael, K.; Schacht, U.; Nicol, A.; Underschultz, J.; Backe, G. Containment of CO2 in CCS: Role of caprocks and faults. Energy Procedia 2013, 37, 5403–5410. [Google Scholar] [CrossRef]
- Fatah, A.; Bennour, Z.; Ben Mahmud, H.; Gholami, R.; Hossain, M. A Review on the Influence of CO2/Shale interaction on shale properties: Implications of CCS in shales. Energies 2020, 13, 3200. [Google Scholar] [CrossRef]
- Fatah, A.; Ben Mahmud, H.; Bennour, Z.; Gholami, R.; Hossain, M. The impact of supercritical CO2 on the pore structure and storage capacity of shales. J. Nat. Gas Sci. Eng. 2022, 98, 104394. [Google Scholar] [CrossRef]
- Pan, Y.; Hui, D.; Luo, P.; Zhang, Y.; Sun, L.; Wang, K. Experimental investigation of the geochemical interactions between supercritical CO2 and shale: Implications for CO2 storage in gas-bearing shale formations. Energy Fuels 2018, 32, 1963–1978. [Google Scholar] [CrossRef]
- Cheng, Y.; Zeng, M.; Lu, Z.; Du, X.; Yin, H.; Yang, L. Effects of supercritical CO2 treatment temperatures on mineral composition, pore structure and functional groups of shale: Implications for CO2 sequestration. Sustainability 2020, 12, 3927. [Google Scholar] [CrossRef]
- Qin, C.; Jiang, Y.; Luo, Y.; Xian, X.; Liu, H.; Li, Y. Effect of supercritical carbon dioxide treatment time, pressure, and temperature on shale water wettability. Energy Fuels 2016, 31, 493–503. [Google Scholar] [CrossRef]
- Rochelle, C.A.; Czernichowski-Lauriol, I.; Milodowski, A.E. The impact of chemical reactions on CO2 storage in geological formations: A brief review. Geol. Soc. Lond. 2004, 233, 87–106. [Google Scholar] [CrossRef]
- Macht, F.; Eusterhues, K.; Pronk, G.J.; Totsche, K.U. Specific surface area of clay minerals: Comparison between atomic force microscopy measurements and bulk-gas (N2) and -liquid (EGME) adsorption methods. Appl. Clay Sci. 2011, 53, 20–26. [Google Scholar] [CrossRef]
- Jones, F. UK Government to Fund Acorn CCS in Second Phase of CCUS Development. Available online: https://www.power-technology.com/news/ccus-acorn-uk-government/#catfish (accessed on 14 September 2024).
- Alcalde, J.; Heinemann, N.; Mabon, L.; Worden, R.H.; de Coninck, H.; Robertson, H.; Maver, M.; Ghanbari, S.; Swennenhuis, F.; Mann, I.; et al. Acorn: Developing full-chain industrial carbon capture and storage in a resource- and infrastructure-rich hydrocarbon province. J. Clean. Prod. 2019, 233, 963–971. [Google Scholar] [CrossRef]
- Worden, R.H.; Allen, M.J.; Faulkner, D.R.; Utley, J.E.P.; Bond, C.E.; Alcalde, J.; Heinemann, N.; Haszeldine, R.S.; Mackay, E.; Ghanbari, S. Lower Cretaceous Rodby and Palaeocene Lista Shales: Characterisation and comparison of top-seal mudstones at two planned CCS sites, Offshore UK. Minerals 2020, 10, 691. [Google Scholar] [CrossRef]
- Kilhams, B.; Hartley, A.; Huuse, M.; Davis, C. Characterizing the Paleocene turbidites of the North Sea: The Mey Sandstone Member, Lista Formation, UK Central Graben. Pet. Geosci. 2012, 18, 337–354. [Google Scholar] [CrossRef]
- Evans, D.; Graham, C.; Armour, A.; Bathurst, P. The Millennium Atlas: Petroleum Geology of the Central and Northern North Sea; The Geological Society of London: London, UK, 2003. [Google Scholar]
- Mudge, D.; Copestake, P. Lower Palaeogene stratigraphy of the northern North Sea. Mar. Pet. Geol. 1992, 9, 287–301. [Google Scholar] [CrossRef]
- Allen, M.J.; Faulkner, D.R.; Worden, R.H.; Rice-Birchall, E.; Katirtsidis, N.; Utley, J.E.P. Geomechanical and petrographic assessment of a CO2 storage site: Application to the Acorn CO2 Storage Site, offshore United Kingdom. Int. J. Greenh. Gas Control 2020, 94, 102923. [Google Scholar] [CrossRef]
- Ahmadi, Z.M.; Sawyers, M.; Kenyon-Roberts, S.; Stanworth, C.W.; Kugler, K.A.; Kristensen, J.; Bathurst, P. The Millenium Atlas: Petroleum Geology of the Central and Northern North Sea. Geol. Soc. Lond. 2003, 548–597. [Google Scholar]
- Gier, S.; Worden, R.H.; Krois, P.; Armitage, P.J.; Butcher, A.R.; Churchill, J.M.; Csoma, A.E.; Hollis, C.; Lander, R.H.; Omma, J.E.; et al. Comparing clay mineral diagenesis in interbedded sandstones and mudstones, Vienna Basin, Austria. In Reservoir Quality of Clastic and Carbonate Rocks: Analysis, Modelling and Prediction; Geological Society of London: London, UK, 2018; Volume 435. [Google Scholar]
- AlNajdi, N.A.; Worden, R.H.; Utley, J.E.P. Compositional controls on the Lower Cretaceous Rodby Shale pore structure and surface area: A planned CCS top seal caprock for the Acorn storage site. Int. J. Greenh. Gas Control 2024, 137, 104219. [Google Scholar] [CrossRef]
- Taylor, A.M.; Goldring, R. Description and analysis of bioturbation and ichnofabric. J. Geol. Soc. 1993, 150, 141–148. [Google Scholar] [CrossRef]
- AlNajdi, N.; Worden, R.H. Porosity in mudstones and its effectiveness for sealing carbon capture and storage sites. In Enabling Secure Subsurface Storage in Future Energy Systems; Geological Society of London: London, UK, 2023; Volume 528, SP528-2022-2084. [Google Scholar] [CrossRef]
- Worden, R.H.; Griffiths, J.; Wooldridge, L.J.; Utley, J.E.P.; Lawan, A.Y.; Muhammed, D.D.; Simon, N.; Armitage, P.J. Chlorite in sandstones. Earth-Sci. Rev. 2020, 204, 103105. [Google Scholar] [CrossRef]
- Worden, R.H.; Charpentier, D.; Fischer, Q.; Aplin, A.C. Fabric development and the smectite to illite transition in Upper Cretaceous mudstones from the North Sea: An image analysis approach. Geol. Soc. Lond. Spec. Publ. 2005, 249, 103–114. [Google Scholar] [CrossRef]
- Armitage, P.J.; Worden, R.H.; Faulkner, D.R.; Aplin, A.C.; Butcher, A.R.; Espie, A.A. Mercia Mudstone Formation caprock to carbon capture and storage sites: Petrology and petrophysical characteristics. J. Geol. Soc. 2013, 170, 119–132. [Google Scholar] [CrossRef]
- Hillier, S. Accurate quantitative analysis of clay and other minerals in sandstones by XRD: Comparison of a Rietveld and a reference intensity ratio (RIR) method and the importance of sample preparation. Clay Miner. 2000, 35, 291–302. [Google Scholar] [CrossRef]
- Pandey, J.S.; Daas, Y.J.; Karcz, A.P.; von Solms, N. Enhanced hydrate-Based geological CO2 Capture and sequestration as a mitigation Strategy to address climate change. Energies 2020, 13, 5661. [Google Scholar] [CrossRef]
- Blott, S.J.; Pye, K. GRADISTAT: A grain size distribution and statistics package for the analysis of unconsolidated sediments. Earth Surf. Process. Landf. 2001, 26, 1237–1248. [Google Scholar] [CrossRef]
- Houghton, J.E.; Nichols, T.E.; Griffiths, J.; Simon, N.; Utley, J.E.P.; Duller, R.A.; Worden, R.H. Automated classification of estuarine sub-depositional environment using sediment texture. J. Geophys. Res. Earth Surf. 2023, 128. [Google Scholar] [CrossRef]
- Peng, S.; Zhang, T.; Loucks, R.G.; Shultz, J. Application of mercury injection capillary pressure to mudrocks: Conformance and compression corrections. Mar. Pet. Geol. 2017, 88, 30–40. [Google Scholar] [CrossRef]
- Washburn, E.W. The dynamics of capillary flow. Phys. Rev. 1921, 17, 273–283. [Google Scholar] [CrossRef]
- Dewhurst, D.; Jones, R.; Raven, M. Microstructural and petrophysical characterization of Muderong Shale: Application to top seal risking. Pet. Geosci. 2002, 8, 371–383. [Google Scholar] [CrossRef]
- Diamond, S. Pore size distributions in clays. Clays Clay Miner. 1970, 18, 7–23. [Google Scholar] [CrossRef]
- Luffel, D.L.; Guidry, F.K. New core anlaysis methods for measuring reservoir rock properties of Devonian Shale. J. Pet. Technol. 1992, 44, 1184–1190. [Google Scholar] [CrossRef]
- ISO9277; Determination of the Specific Surface Area of Solids by Gas Adsorption–BET Method. ISO: Geneva, Switzerland, 2010.
- Barrett, E.P.; Joyner, L.G.; Halenda, P.P. The determination of pore volume and area distribution in porous substances. I. Computations from nitrogen isotherms. J. Am. Chem. Soc. 1951, 73, 373–380. [Google Scholar] [CrossRef]
- Schmitt, M.; Fernandes, C.P.; da Cunha Neto, J.A.B.; Wolf, F.G.; dos Santos, V.S.S. Characterization of pore systems in seal rocks using nitrogen gas adsorption combined with mercury injection capillary pressure techniques. Mar. Pet. Geol. 2013, 39, 138–149. [Google Scholar] [CrossRef]
- Thommes, M.; Kaneko, K.; Neimark, A.V.; Olivier, J.P.; Rodriguez-Reinoso, F.; Rouquerol, J.; Sing, K.S.W. Physisorption of gases, with special reference to the evaluation of surface area and pore size distribution (IUPAC Technical Report). Pure Appl. Chem. 2015, 87, 1051–1069. [Google Scholar] [CrossRef]
- Ge, X.; Fan, Y.; Deng, S.; Han, Y.; Liu, J. An improvement of the fractal theory and its application in pore structure evaluation and permeability estimation. J. Geophys. Res. Solid Earth 2016, 121, 6333–6345. [Google Scholar] [CrossRef]
- Wang, F.; Yang, K.; You, J.; Lei, X. Analysis of pore size distribution and fractal dimension in tight sandstone with mercury intrusion porosimetry. Results Phys. 2019, 13, 102283. [Google Scholar] [CrossRef]
- Wang, X.; Jiang, Z.; Jiang, S.; Chang, J.; Zhu, L.; Li, X.; Li, J. Full-scale pore structure and fractal dimension of the Longmaxi Shale from the Southern Sichuan Basin: Investigations using FE-SEM, gas adsorption and mercury intrusion porosimetry. Minerals 2019, 9, 543. [Google Scholar] [CrossRef]
- Huang, Y.; Zhang, P.; Zhang, J.; Tang, X.; Liu, C.; Yang, J.; Chen, Z. Fractal characteristics of pores in the Longtan Shales of Guizhou, Southwest China. Geofluids 2020, 2020, 8834758. [Google Scholar] [CrossRef]
- Peng, J.; Han, H.; Xia, Q.; Li, B. Fractal characteristic of microscopic pore structure of tight sandstone reservoirs in Kalpintag Formation in Shuntuoguole area, Tarim Basin. Pet. Res. 2020, 5, 1–17. [Google Scholar] [CrossRef]
- Tyler, S.W.; Wheatcraft, S.W. Fractal processes in soil retension. Water Resour. Res. 1990, 26, 1047–1054. [Google Scholar] [CrossRef]
- Sahouli, B.; Blacher, S.; Pirard, R.; Brouers, F. Fractal analysis of mercury porosimetry data in the framework of the thermodynamic method. J. Colloid Interface Sci. 1999, 214, 450–454. [Google Scholar] [CrossRef]
- Hunt, A.G.; Gee, G.W. Application of critical path analysis to fractal porous media: Comparison with examples from the Hanford site. Adv. Water Resour. 2002, 25, 129–146. [Google Scholar] [CrossRef]
- Cai, J.; Yu, B. A discussion of the effect of tortuosity on the capillary imbibition in porous media. Transp. Porous Media 2011, 89, 251–263. [Google Scholar] [CrossRef]
- Ghanbarian, B.; Hunt, A.G.; Ewing, R.P.; Skinner, T.E. Universal scaling of the formation factor in porous media derived by combining percolation and effective medium theories. Geophys. Res. Lett. 2014, 41, 3884–3890. [Google Scholar] [CrossRef]
- Daigle, H.; Johnson, A.; Thomas, B. Determining fractal dimension from nuclear magnetic resonance data in rocks with internal magnetic field gradients. Geophysics 2014, 79, D425–D431. [Google Scholar] [CrossRef]
- Chen, Y.; Tang, H.; Zheng, M.; Li, C.; Zhao, S.; Zhao, N.; Leng, Y. Fractal characteristics and significance of different pore types of the Wufeng-Longmaxi Formation, Southern Sichuan Basin, China, based on N(2) adsorption and image analysis. ACS Omega 2021, 6, 30889–30900. [Google Scholar] [CrossRef]
- Anvir, D.; Jaroniec, M. An Isotherm equation for adsorption on fractal surfaces of heterogenous porous materials. Langmuir 1989, 5, 1431–1433. [Google Scholar]
- Brunauer, S.; Emmett, P.H.; Teller, E. Adsorption of gases in multimolecular layers. J. Am. Chem. Soc. 1938, 60, 309–319. [Google Scholar] [CrossRef]
- Sing, K.S.W. Reporting physisorption data for gas/solid systems with special reference to the determination of surface area and porosity (Recommendations 1984). Pure Appl. Chem. 1985, 57, 603–619. [Google Scholar] [CrossRef]
- Ding, C.; He, J.; Wu, H.; Zhang, X. Nanometer pore structure Characterization of Taiyuan Formation Shale in the Lin-Xing Area based on nitrogen adsorption experiments. Minerals 2021, 11, 298. [Google Scholar] [CrossRef]
- Wang, Y.; Liu, L.; Cheng, H. Gas adsorption characterization of pore structure of organic-rich shale: Insights into contribution of organic matter to shale pore network. Nat. Resour. Res. 2021, 30, 2377–2395. [Google Scholar] [CrossRef]
- Gehrels, W.R. Sea Level Studies|Microfossil-based reconstructions of Holocene relative sea-level change. In Encyclopedia of Quaternary Science; Elsevier: Amsterdam, The Netherlands, 2013; pp. 419–428. [Google Scholar] [CrossRef]
- Bradley, J. Zoophycos and Umbrella (Pennatulcacea): Their synthesis and identity. Palaeogeography 1973, 13, 103–128. [Google Scholar] [CrossRef]
- Wetzel, A.; Werner, F. Morphology and ecological significance of Zoophycos in deep sea sediment off NW Africa. Palaeogeography 1980, 32, 185–212. [Google Scholar] [CrossRef]
- Mudge, D.C.; Bujak, J.P. An integrated stratigraphy for the Paleocene and Eocene of the North Sea. Geol. Soc. Lond. Spec. Publ. 1996, 101, 91–113. [Google Scholar] [CrossRef]
- O’Connor, S.J.; Walker, D. Paleocene reservoirs of the Everest trend. In Proceedings of the Petroleum Geology of Northwest Europe: Proceedings of the 4th Conference, London, UK, 2008; pp. 145–160. [Google Scholar]
- Gupta, R.; Johnson, D.H. Characterization of heterolithic deposits using electrofacies analysis in the tide dominated lower. Pet. Geosci. 2001, 7, 321–330. [Google Scholar] [CrossRef]
- Houben, M.E.; van Eeden, J.C.M.; Barnhoorn, A.; Hangx, S.J.T. Fracture-induced permeability in Whitby mudstone. Environ. Sci. Technol. 2020, 54, 9564–9572. [Google Scholar] [CrossRef]
- Loucks, R.G.; Reed, R.M.; Ruppel, S.C.; Hammes, U. Spectrum of pore types and networks in mudrocks and a descriptive classification for matrix-related mudrock pores. Am. Assoc. Pet. Geol. Bull. 2012, 96, 1071–1098. [Google Scholar] [CrossRef]
- Day-Stirrat, R.J.; McDonnell, A.; Wood, L.J. Diagenetic and seismic concernsassociated with interpretation of deeply buried ‘mobile shales’. In Shale Tectonics; American Association of Petroleum Geologists Memoir: Tulsa, OK, USA, 2010; Volume 93, pp. 5–27. [Google Scholar]
- Magara, K. Compaction and migration of fluids in Miocene Mudstone Nagaoka Plain, Japan. Am. Assoc. Pet. Geol. Bull. 1968, 52, 2466–2501. [Google Scholar]
- Loucks, R.G.; Reed, R.M.; Ruppel, S.C.; Jarvie, D.M. Morphology, genesis, and distribution of nanometer-scale pores in siliceous mudstones of the Mississippian Barnett Shale. J. Sediment. Res. 2009, 79, 848–861. [Google Scholar] [CrossRef]
- Kuila, U.; Prasad, M. Specific surface area and pore-size distribution in clays and shales. Geophys. Prospect. 2013, 61, 341–362. [Google Scholar] [CrossRef]
- Zhang, J.; Liu, G.; Torsaeter, O.; Tao, S.; Jiang, M.; Li, G.; Zhang, S. Pore-throat structure characteristics and its effect on flow behavior in Gaotaizi tight siltstone reservoir, northern Songliao Basin. Mar. Pet. Geol. 2020, 122, 104651. [Google Scholar] [CrossRef]
- Gao, Z.; Yang, X.; Hu, C.; Wei, L.; Jiang, Z.; Yang, S.; Fan, Y.; Xue, Z.; Yu, H. Characterizing the pore structure of low permeability Eocene Liushagang Formation reservoir rocks from Beibuwan Basin in northern South China Sea. Mar. Pet. Geol. 2019, 99, 107–121. [Google Scholar] [CrossRef]
- Rouquerol, J.; Avnir, D.; Fairbridge, C.W.; Everett, D.H.; Haynes, J.H.; Pernicone, N.; Ramsay, J.D.F.; Sing, K.S.W.; Unger, K.K. Reccomendation for the characterisation of porous solids. Pure Appl. Chem. 1994, 66, 1739–1758. [Google Scholar] [CrossRef]
- Cao, Z.; Liu, G.; Zhan, H.; Li, C.; You, Y.; Yang, C.; Jiang, H. Pore structure characterization of Chang-7 tight sandstone using MICP combined with N(2)GA techniques and its geological control factors. Sci Rep 2016, 6, 36919. [Google Scholar] [CrossRef] [PubMed]
- Chen, L.; Jiang, Z.; Jiang, S.; Liu, K.; Yang, W.; Tan, J.; Gao, F. Nanopore structure and fractal characteristics of Lacustrine Shale: Implications for shale gas storage and production potential. Nanomaterials 2019, 9, 390. [Google Scholar] [CrossRef] [PubMed]
- Zhang, N.; Zhao, F.; Guo, P.; Li, J.; Gong, W.; Guo, Z.; Sun, X. Nanoscale pore structure characterization and permeability of mudrocks and fine-grained sandstones in coal reservoirs by scanning electron microscopy, mercury intrusion porosimetry, and low-field nuclear magnetic resonance. Geofluids 2018, 2018, 2905141. [Google Scholar] [CrossRef]
- Hodot, B. Outburst of Coal and Coalbed Gas (Chinese Translation); China Coal Industry Press: Beijing, China, 1966; Volume 318. [Google Scholar]
- Harding, F.C.; James, A.T.; Robertson, H.E. The engineering challenges of CO2 storage. Proc. Inst. Mech. Eng. Part A J. Power Energy 2018, 232, 17–26. [Google Scholar] [CrossRef]
- Di Leo, G.; Sardanelli, F. Statistical significance: P value, 0.05 threshold, and applications to radiomics-reasons for a conservative approach. Eur. Radiol. Exp. 2020, 4, 18. [Google Scholar] [CrossRef]
- Xiong, J.; Liu, X.; Liang, L. Experimental study on the pore structure characteristics of the Upper Ordovician Wufeng Formation shale in the southwest portion of the Sichuan Basin, China. J. Nat. Gas Sci. Eng. 2015, 22, 530–539. [Google Scholar] [CrossRef]
- Hu, J.; Tang, S.; Zhang, S. Investigation of pore structure and fractal characteristics of the Lower Silurian Longmaxi shales in western Hunan and Hubei Provinces in China. J. Nat. Gas Sci. Eng. 2016, 28, 522–535. [Google Scholar] [CrossRef]
- Tian, H.; Pan, L.; Xiao, X.; Wilkins, R.W.T.; Meng, Z.; Huang, B. A preliminary study on the pore characterization of Lower Silurian black shales in the Chuandong Thrust Fold Belt, southwestern China using low pressure N2 adsorption and FE-SEM methods. Mar. Pet. Geol. 2013, 48, 8–19. [Google Scholar] [CrossRef]
- Wang, Y.; Zhu, Y.; Chen, S.; Li, W. Characteristics of the nanoscale pore structure in northwestern Hunan Shale gas reservoirs using field emission scanning electron microscopy, high-pressure mercury intrusion, and gas adsorption. Energy Fuels 2014, 28, 945–955. [Google Scholar] [CrossRef]
- Saidian, M.; Godinez, L.J.; Prasad, M. Effect of clay and organic matter on nitrogen adsorption specific surface area and cation exchange capacity in shales (mudrocks). J. Nat. Gas Sci. Eng. 2016, 33, 1095–1106. [Google Scholar] [CrossRef]
- Ji, W.; Song, Y.; Jiang, Z.; Meng, M.; Liu, Q.; Chen, L.; Wang, P.; Gao, F.; Huang, H. Fractal characteristics of nano-pores in the Lower Silurian Longmaxi shales from the Upper Yangtze Platform, south China. Mar. Pet. Geol. 2016, 78, 88–98. [Google Scholar] [CrossRef]
- Bolourinejad, P.; Shoeibi Omrani, P.; Herber, R. Effect of reactive surface area of minerals on mineralization and carbon dioxide trapping in a depleted gas reservoir. Int. J. Greenh. Gas Control 2014, 21, 11–22. [Google Scholar] [CrossRef]
- Jia, W.; Xiao, T.; Wu, Z.; Dai, Z.; McPherson, B. Impact of mineral reactive surface area on forecasting geological carbon sequestration in a CO2-EOR field. Energies 2021, 14, 1608. [Google Scholar] [CrossRef]
- Akono, A.T.; Druhan, J.L.; Dávila, G.; Tsotsis, T.; Jessen, K.; Fuchs, S.; Crandall, D.; Shi, Z.; Dalton, L.; Tkach, M.K.; et al. A review of geochemical–mechanical impacts in geological carbon storage reservoirs. Greenh. Gases Sci. Technol. 2019, 9, 474–504. [Google Scholar] [CrossRef]
- Peters, C.A. Accessibilities of reactive minerals in consolidated sedimentary rock: An imaging study of three sandstones. Chem. Geol. 2009, 265, 198–208. [Google Scholar] [CrossRef]
- Bowen, B.B.; Ochoa, R.I.; Wilkens, N.D.; Brophy, J.; Lovell, T.R.; Fischietto, N.; Medina, C.R.; Rupp, J.A. Depositional and diagenetic variability within the Cambrian Mount Simon Sandstone: Implications for carbon dioxide sequestration. Environ. Geosci. 2011, 18, 69–89. [Google Scholar] [CrossRef]
- Botto, J.; Fuchs, S.J.; Fouke, B.W.; Clarens, A.F.; Freiburg, J.T.; Berger, P.M.; Werth, C.J. Effects of mineral surface properties on supercritical CO2 wettability in a siliciclastic reservoir. Energy Fuels 2017, 31, 5275–5285. [Google Scholar] [CrossRef]
- Espinoza, D.N.; Santamarina, J.C. Clay interaction with liquid and supercritical CO2: The relevance of electrical and capillary forces. Int. J. Greenh. Gas Control 2012, 10, 351–362. [Google Scholar] [CrossRef]
- Smith, M.M.; Sholokhova, Y.; Hao, Y.; Carroll, S.A. Evaporite caprock integrity: An experimental study of reactive mineralogy and pore-scale heterogeneity during brine-CO2 exposure. Environ. Sci. Technol. 2013, 47, 262–268. [Google Scholar] [CrossRef] [PubMed]
- Miller, Q.R.S.; Wang, X.; Kaszuba, J.P.; Mouzakis, K.M.; Navarre-Sitchler, A.K.; Alvarado, V.; McCray, J.E.; Rother, G.; Bañuelos, J.L.; Heath, J.E. Experimental study of porosity changes in shale caprocks exposed to carbon dioxide-saturated brine II: Insights from aqueous geochemistry. Environ. Eng. Sci. 2016, 33, 736–744. [Google Scholar] [CrossRef]
- Giles, M.R.; de Boer, R.B. Origin and significance of redistributional secondary porosity. Mar. Pet. Geol. 1990, 7, 378–397. [Google Scholar] [CrossRef]
- Baines, S.J.; Worden, R.H. The long-term fate of CO2 in the subsurface: Natural analogues for CO2 storage. Geol. Soc. Lond. 2004, 233, 59–85. [Google Scholar] [CrossRef]
- Gibson-Poole, C.M.; Svendsen, L.; Watson, M.N.; Daniel, R.F. Understanding stratigraphic heterogeneity: A methodology to maximize the efficiency of the geological storage of CO2. In Carbon Dioxide Sequestration in Geological Media-State of the Science; Grobe, M., Pashin, J.C., Dodge, R.L., Eds.; AAPG Studies in Geology; 2009; Volume 59, pp. 347–364. [Google Scholar]
- Espinoza, D.N.; Santamarina, J.C. CO2 breakthrough—Caprock sealing efficiency and integrity for carbon geological storage. Int. J. Greenh. Gas Control 2017, 66, 218–229. [Google Scholar] [CrossRef]
- Fleury, M.; Berne, P.; Bachaud, P. Diffusion of dissolved CO2 in caprock. Energy Procedia 2009, 1, 3461–3468. [Google Scholar] [CrossRef]
- Katopodes, N.D. Chapter 3–Diffusive mass transfer. In Free-Surface Flow; Katopodes, N.D., Ed.; Butterworth-Heinemann: Oxford, UK, 2019; pp. 184–270. [Google Scholar] [CrossRef]
- Schloemer, S.; Krooss, B.M. Experimental characterisation of hydrocarbon sealing efficency of caprocks. Mar. Pet. Geol. 1997, 14, 565–580. [Google Scholar] [CrossRef]
- Kirkham, M.B. 7—Water movement in saturated soil. In Principles of Soil and Plant Water Relations; Kirkham, M.B., Ed.; Academic Press: Burlington, MA, USA, 2005; pp. 85–100. [Google Scholar] [CrossRef]
- Salem, A.M.; Shedid, S.A. Variation of petrophysical properties due to carbon dioxide (CO2) storage in carbonate reservoirs. J. Pet. Gas Eng. 2013, 4, 91–102. [Google Scholar] [CrossRef]
- Bachu, S.; Brant, B.D. Dependence of CO2 -brine interfacial tension on aquifer pressure, temperature and water salinity. Energy Procedia 2009, 1, 3157–3164. [Google Scholar] [CrossRef]
- Warren, E.A.; Smalley, P.C. North Sea Formation Waters Atlas; The Geological Society of London: London, UK, 1994. [Google Scholar]
- Chadwick, R.A.; Zweigel, P.; Gregersen, U.; Kirby, G.A.; Holloway, S.; Johannessen, P.N. Geological reservoir characterization of a CO2 storage site: The Utsira Sand, Sleipner, northern North Sea. Energy 2004, 29, 1371–1381. [Google Scholar] [CrossRef]
- Tonnet, N.; Mouronval, G.; Chiquet, P.; Broseta, D. Petrophysical assessment of a carbonate-rich caprock for CO2 geological storage purposes. Energy Procedia 2011, 4, 5422–5429. [Google Scholar] [CrossRef]
- Armitage, P.J.; Worden, R.H.; Faulkner, D.R.; Aplin, A.C.; Butcher, A.R.; Iliffe, J. Diagenetic and sedimentary controls on porosity in Lower Carboniferous fine-grained lithologies, Krechba Field, Algeria: A petrological study of a caprock to a carbon capture site. Mar. Pet. Geol. 2010, 27, 1395–1410. [Google Scholar] [CrossRef]
- Kharaka, Y.K.; Cole, D.R.; Hovorka, S.D.; Gunter, W.D.; Knauss, K.G.; Freifeld, B.M. Gas-water-rock interactions in Frio Formation following CO2 injection: Implications for the storage of greenhouse gases in sedimentary basins. Geology 2006, 34, 577–580. [Google Scholar] [CrossRef]
- Carey, J.W.; Wigand, M.; Chipera, S.J.; WoldeGabriel, G.; Pawar, R.; Lichtner, P.C.; Wehner, S.C.; Raines, M.A.; Guthrie, G.D. Analysis and performance of oil well cement with 30 years of CO2 exposure from the SACROC Unit, West Texas, USA. Int. J. Greenh. Gas Control 2007, 1, 75–85. [Google Scholar] [CrossRef]
- Boulin, P.F.; Bretonnier, P.; Vassil, V.; Samouillet, A.; Fleury, M.; Lombard, J.M. Sealing efficiency of caprocks: Experimental investigation of entry pressure measurement methods. Mar. Pet. Geol. 2013, 48, 20–30. [Google Scholar] [CrossRef]
- Ingram, G.M.; Urai, J.L. Top-seal leakage through faults and fractures: The role of mudrock properties. Geol. Soc. Lond. Spec. Publ. 1999, 158, 125–135. [Google Scholar] [CrossRef]


| Depth (md-ft) | BET | MICP | XRD | Thin-Section | Optical Microscope | SEM | LPSA |
|---|---|---|---|---|---|---|---|
| 6975 | X | X | X | X | X | X | X |
| 6981 | X | X | X | X | X | X | X |
| 6982 | X | X | X | ||||
| 6987 | X | X | X | X | X | X | |
| 6989 | X | X | X | X | X | X | |
| 6990 | X | X | X | X | |||
| 6992 | X | X | X | X | X | X | |
| 6995.5 | X | X | X | X | X | X | |
| 7001 | X | X | X | X | X | X | X |
| 7005 | X | X | X | X | X | X | X |
| 7008 | X | X | X | X | X | X | X |
| 7013 | X | X | X | ||||
| 7015 | X | X | X | X | X | X | X |
| 7024.5 | X | X | X | X | X | X | X |
| Depth (ft) | Quartz | K-Feldspar | Plagioclase | Illite/Muscovite | Smectite | Chlorite | Kaolinite | Pyrite | Calcite |
|---|---|---|---|---|---|---|---|---|---|
| 6975 | 18 | 8 | 6 | 30 | 31 | 3 | 4 | 0.5 | 0 |
| 6981 | 39 | 6 | 10 | 14 | 24 | 2 | 3 | 0 | 0 |
| 6982 | 28 | 9 | 5 | 24 | 27 | 3 | 4 | 0 | 0 |
| 6987 | 34 | 6 | 6 | 23 | 22 | 3 | 5 | 0 | 0.5 |
| 6989 | 33 | 7 | 7 | 21 | 22 | 4 | 5 | 1 | 0 |
| 6990 | 36 | 7 | 11 | 14 | 22 | 3 | 6 | 0 | 0 |
| 6992 | 22 | 7 | 6 | 23 | 36 | 3 | 3 | 0 | 0.5 |
| 6995.5 | 53 | 10 | 7 | 9 | 9 | 4 | 8 | 0.5 | 0 |
| 7001 | 27 | 6 | 9 | 16 | 35 | 2 | 5 | 0 | 0 |
| 7005.9 | 25 | 6 | 5 | 21 | 38 | 2 | 3 | 0.5 | 0 |
| 7008 | 52 | 5 | 9 | 9 | 20 | 2 | 2 | 0 | 0 |
| 7013 | 20 | 7 | 5 | 23 | 35 | 3 | 7 | 0 | 0 |
| 7015 | 30 | 7 | 6 | 11 | 36 | 3 | 6 | 0.5 | 0 |
| 7024.5 | 26 | 6 | 5 | 10 | 47 | 2 | 4 | 0.5 | 0 |
| Depth (ft) | BET Measurements | MICP Measurements | LPSA Measurements | ||||||||
|---|---|---|---|---|---|---|---|---|---|---|---|
| Multi BET Surface Area (m2/g) | BJH Surface Area (m2/g) | BJH Pore Volume (cc/g) | BJH Pore Diameter (nm) | Average Pore Diameter (nm) | MICP Porosity | Median Pore Diameter (MICP) | Average Pore Throat Diameter (nm) | Total Pore Area (m2/g) | Sorting Φ | MGN (µm) | |
| 6975 | 13.32 | 13.35 | 0.066 | 3.16 | 17.55 | 15.00 | 0.014 | 15.1 | 21.24 | 1.22 | 4.64 |
| 6981 | 11.41 | 17.21 | 0.071 | 3.16 | 18.68 | 15.71 | 0.013 | 14.07 | 23.99 | 1.19 | 4.22 |
| 6982 | 11.56 | 16.26 | 0.062 | 3.16 | 17.3 | ND | ND | ND | ND | 1.2 | 3.65 |
| 6987 | 7.06 | 10.93 | 0.048 | 3.14 | 18.49 | ND | ND | ND | ND | 1.33 | 4.12 |
| 6989 | 7.35 | 11.00 | 0.045 | 3.12 | 17.47 | ND | ND | ND | ND | 2.13 | 8.87 |
| 6990 | 4.11 | 7.34 | 0.031 | 3.40 | 17.84 | 14.15 | 0.018 | 23.53 | 12.56 | 2.51 | 19.46 |
| 6992 | 12.10 | 15.71 | 0.067 | 3.16 | 16.89 | ND | ND | ND | ND | 1.19 | 4.86 |
| 6995.5 | 4.56 | 7.66 | 0.029 | 3.16 | 17.68 | ND | ND | ND | ND | 2.17 | 23.63 |
| 7001 | 10.87 | 16.28 | 0.061 | 3.12 | 18.13 | 15.74 | 0.013 | 14.64 | 23.07 | 1.21 | 5.05 |
| 7005.9 | 11.05 | 16.32 | 0.062 | 3.16 | 18.23 | 16.33 | 0.014 | 14.74 | 24.12 | 1.37 | 4.47 |
| 7008 | 11.61 | 17.07 | 0.061 | 3.14 | 18.3 | 17.02 | 0.016 | 17.46 | 21.2 | 1.2 | 3.84 |
| 7013 | 11.22 | 16.17 | 0.058 | 3.12 | 18.19 | ND | ND | ND | ND | 1.31 | 5.06 |
| 7015 | 11.81 | 16.90 | 0.065 | 3.16 | 17.58 | 16.25 | 0.013 | 13.68 | 25.52 | 1.18 | 3.54 |
| 7024.5 | 9.87 | 15.00 | 0.064 | 3.14 | 17.53 | 15.45 | 0.012 | 13.78 | 23.96 | 1.16 | 3.76 |
| Sample | Fractal Dimension of Pore Surfaces (Po/P < 0.45) | Fractal Dimension of Pore Structure (Po/P > 0.45) | ||||
|---|---|---|---|---|---|---|
| D1 | Fitted Equation | R2 (1) | D2 | Fitted Equation | R2 (2) | |
| 6975 ft | 2.60 | y = −0.2723x + 2.7876 | 0.999 | 2.72 | y = −0.3924x + 2.7611 | 0.999 |
| 6981 ft | 2.55 | y = −0.3372x + 2.4631 | 0.998 | 2.66 | y = −0.4469x + 2.4355 | 0.999 |
| 6982 ft | 2.59 | y = −0.3199x + 2.4856 | 0.999 | 2.68 | y = −0.4052x + 2.4646 | 0.999 |
| 6987ft | 2.48 | y = −0.3777x + 1.8578 | 0.999 | 2.62 | y = −0.5120x + 1.823 | 0.999 |
| 6989 ft | 2.52 | y = −0.3389x + 1.9949 | 0.998 | 2.66 | y = −0.4703x + 1.9612 | 0.999 |
| 6990 ft | 2.59 | y = −0.3199x + 2.4856 | 0.999 | 2.68 | y = −0.4052x + 2.4646 | 0.999 |
| 6992 ft | 2.62 | y = −0.3038x + 2.5429 | 0.996 | 2.69 | y = −0.3701x + 2.5377 | 1.000 |
| 6995 ft | 2.45 | y = −0.3531x + 1.495 | 0.998 | 2.64 | y = −0.5482x + 1.4054 | 0.999 |
| 7001 ft | 2.57 | y = −0.3095x + 2.4844 | 0.999 | 2.69 | y = −0.4290x + 2.4449 | 0.999 |
| 7005 ft | 2.56 | y = −0.3221x + 2.4587 | 0.999 | 2.67 | y = −0.4386x + 2.4218 | 0.999 |
| 7008 ft | 2.57 | y = −0.3120x + 2.5444 | 0.998 | 2.68 | y = −0.4294x + 2.5148 | 0.999 |
| 7013 ft | 2.60 | y = −0.2955x + 2.5525 | 0.998 | 2.70 | y = −0.3945x + 2.5204 | 0.999 |
| 7015 ft | 2.57 | y = −0.3285x + 2.4903 | 0.999 | 2.67 | y = −0.4281x + 2.4619 | 0.999 |
| 7024 ft | 2.43 | y = −0.4500x + 1.9379 | 0.999 | 2.55 | y = −0.5688x + 1.8917 | 0.999 |
Disclaimer/Publisher’s Note: The statements, opinions and data contained in all publications are solely those of the individual author(s) and contributor(s) and not of MDPI and/or the editor(s). MDPI and/or the editor(s) disclaim responsibility for any injury to people or property resulting from any ideas, methods, instructions or products referred to in the content. |
© 2024 by the authors. Licensee MDPI, Basel, Switzerland. This article is an open access article distributed under the terms and conditions of the Creative Commons Attribution (CC BY) license (https://creativecommons.org/licenses/by/4.0/).
Share and Cite
AlNajdi, N.; Worden, R.H.; Utley, J.E.P. The Palaeocene Lista Shale: A Planned Carbon Capture and Storage Top Seal for the East Mey CO2 Storage Site. Processes 2024, 12, 2773. https://doi.org/10.3390/pr12122773
AlNajdi N, Worden RH, Utley JEP. The Palaeocene Lista Shale: A Planned Carbon Capture and Storage Top Seal for the East Mey CO2 Storage Site. Processes. 2024; 12(12):2773. https://doi.org/10.3390/pr12122773
Chicago/Turabian StyleAlNajdi, Nourah, Richard H. Worden, and James E. P. Utley. 2024. "The Palaeocene Lista Shale: A Planned Carbon Capture and Storage Top Seal for the East Mey CO2 Storage Site" Processes 12, no. 12: 2773. https://doi.org/10.3390/pr12122773
APA StyleAlNajdi, N., Worden, R. H., & Utley, J. E. P. (2024). The Palaeocene Lista Shale: A Planned Carbon Capture and Storage Top Seal for the East Mey CO2 Storage Site. Processes, 12(12), 2773. https://doi.org/10.3390/pr12122773