Article

Numerical Simulation Study on Reverse Source Tracing for Heating Pipeline Network Leaks Based on Adjoint Equations

1
Chnenergy Hami Coal Power Co., Ltd., Hami 839000, China
2
School of Energy and Power Engineering, Northeast Electric Power University, Jilin 132013, China
*
Author to whom correspondence should be addressed.
Processes 2024, 12(12), 2710; https://doi.org/10.3390/pr12122710
Submission received: 10 October 2024 / Revised: 8 November 2024 / Accepted: 14 November 2024 / Published: 1 December 2024
(This article belongs to the Special Issue Model Predictive Control of Heating and Cooling Systems)

Abstract

:
In order to identify the leak source in complex heating pipeline networks, a timely and effective simulation of the leakage process was conducted. The open-source computational fluid dynamics software OpenFOAM 5.0 was combined with the PISO algorithm to simulate the pressure during the leakage in water supply networks, transforming the reverse source tracing problem into the solution of an adjoint equation. The validation of the transient adjoint equation for single-phase flow was completed through simulation, and the pressure wave change graph at the moment of the network leakage was solved, which was consistent with the experimental results. Using the open-source finite element analysis software OpenFOAM 5.0, the positioning accuracy of pipeline leak points can be controlled within the range from 92% to 96%. Based on the pressure wave change graph, the position of the leak source in the complex network was determined using the reverse source tracing method combined with the second correlation theory. The results show that the calculation speed of the PISO algorithm combined with the adjoint equation is significantly better than that of the individual SIMPLE and PISO algorithms, thereby proving the superiority of the adjoint method.

1. Introduction

Heating pipeline transportation is an equally important mode of transport [1] as rail, road, air, and water transport, capable of conveying media such as natural gas, petroleum, and potable water within its conduits. During the transportation process, significant pressure often builds up within the pipes [2]. When sections of the heating pipeline are exposed to harsh environments, severe leakage incidents can occur. If the location of the leak is not promptly identified, the high pressure can further enlarge the leak, leading to more extensive waste of the medium and a series of secondary disasters [3,4,5].
The impact of leakage on geological and ecological environments is particularly severe. Leakage can cause soil to become loose [6], and over time, this can lead to extremely serious consequences such as landslides, building collapses, and geological fissures and collapses, with losses that are immeasurable. Additionally, water leakage due to heating pipeline corrosion can damage the pipes, and as the damage worsens, it reduces the pressure in the entire supply system. To maintain normal water supply to users, the water pressure must be increased. However, an increase in water pressure can exacerbate leakage and result in significant waste of resources [7,8].
Most of the current advanced and mature leak detection and location methods and technologies are designed for single, long, straight pipelines, such as long-distance oil and gas pipelines [9,10]. However, these methods cannot be directly applied to complex networks with a multi-branch topology, such as heating and water supply networks. Complex water supply networks are prone to damage and leakage, causing substantial economic losses to social production and people’s lives. Therefore, to promptly detect, locate, and repair leaks, and to eliminate the potential dangers caused by water leakage, this paper proposes a reverse source tracing method based on the adjoint equation for the leak detection and location in water supply networks.
There are numerous causes for pipeline leaks, as per the research by Irina Bolotina et al. [11], among all pipeline damage incidents: 33% are due to external factors, 24% are attributed to errors during construction and installation processes, 22% are caused by pipeline corrosion, 14% are due to defects in the pipeline manufacturing process, and 5% are a result of human factors. Pipeline leaks are extremely hazardous incidents, posing not only threats to the environment and biota above the pipeline route but also causing economic losses by damaging the pipeline itself and the instruments used for pipeline detection [12,13]. Once a pipeline leak occurs, it inevitably has significant impacts; hence, the detection of pipeline leaks is crucial in the operation and maintenance process of pipelines. In actual system operations, a considerable number of pipeline leaks can be prevented through appropriate management and monitoring [14]. Numerous scholars have conducted extensive research on developing efficient and reliable leak detection methods [15]. Pipelines are relatively closed environments, and leaks within them can cause changes in the internal environment of the pipeline, which can be detected by monitoring environmental parameters within the pipeline, including changes in noise, vibration, pressure drop, reduction in fluid flow velocity within the pipe, and internal temperature, among other parameters. All leak detection methods can be categorized into two types: hardware-based pipeline leak detection methods and software-based pipeline leak detection methods [16,17,18,19].

2. Literature Review

Siebert and Isermann [20] proposed a cross-correlation analysis method for leak detection after pre-processing pressure and flow signals. Isermann [21] utilized data such as inlet and outlet flow rates and pressures, comparing them with estimated values; the greater the discrepancy, the more evident the leak. However, linearizing the pipeline model is challenging, and this approach is known as the fault-sensitive filter method. Billman and Isermann [22] considered the loss of leak signals due to time variations and established a nonlinear observer method for detecting the occurrence of leaks. Toshio [23] proposed an approach based on autoregressive models, using statistical methods to analyze the time series of pressure gradients for leak detection. Digemes [24] compared experimental data with fault models, where consistency between measured data and models during leaks indicates the fault model detection method. Benkberouf [25] estimated the pipeline process state, and changes after fault occurrence can be tracked; this method is called the Kalman filtering method, but it is difficult to apply and does not always align with actual conditions. Zhang [26,27] continuously monitored flow and pressure at arbitrary pipeline locations to determine if a leak occurred, combining pattern recognition theory and the least squares method to locate the leak, known as the dynamic mass balance method. Liou [28] identified and located leaks based on changes in the pipeline’s internal impact response, a novel method that has yet to be practically applied. Ferrante [29] and others proposed a new method for leak detection and location in long-distance pipelines, where the pressure frequency domain analytical solution is obtained by solving the impulse response of the fluid transient equation. John [30] and others used a genetic algorithm combined with the inverse transient method to detect friction factors and the occurrence of leaks, effectively locating leak points and estimating leak severity, a valid diagnostic method based on the inverse transient method.
Verde and Mpesha [31,32], respectively, proposed the minimum nonlinear observer and frequency response method to determine the location of leak points. Costa [33] applied parameter estimation methods for leak detection and leak point location in pipeline networks. Ferrante [34] addressed the loss of leak information during the transformation from time domain to frequency domain by analyzing the peaks of corresponding signals based on wavelet transform, and the leak location can be completed based on the time difference of leak signals reaching different sensors. Covas [35] proposed a new method for identifying pipeline leaks, by extracting characteristic signals of internal pressure changes in the pipeline and using an improved correlation analysis algorithm, improved the accuracy of leak location, using fewer sensors and saving resources compared to traditional methods. Prashanth [36] proposed a method based on the functional transfer model of pipelines using transient models, which greatly improved computational efficiency.
Taghvaei [37] and colleagues utilized the internal wave reflection phenomenon in pipelines for identifying various types of pipeline failures, including the distinct characteristics of leaks, based on wavelet packet filtering. This method, when applied by water companies, can effectively locate water leaks. Ferraz [38] and team employed a fuzzy system and artificial neural network approach, treating the pipeline as an uncertain system, and achieved commendable results in detection. Majid [39] and colleagues monitored signals using acoustic signals transformed by short-time Fourier transform in the time domain, capturing the signals and then employing frequency-modulated wavelets (mother wavelets), ultimately localizing the leaks based on time and frequency domains. Cabrera [40] and team were the first to propose the application of ground-penetrating radar (GPR) for the detection of faults in buried water pipelines. Experiments have proven that GPR can be used for leak detection in water supply networks, with results that are authentic and reliable. Wachla [41] and colleagues employed a fuzzy system to establish an artificial neural fuzzy model, training the data repeatedly with input and output variables including pressure and flow changes, and fault identification variables (leak alarms, etc.). This method can reduce measurement costs and errors. Gaudenz [42] and colleagues focused on model order reduction performance for leak detection and analyzed the impact of topological performance reduction on the sensitivity of detecting leak intensity. Among all the order reduction strategies, reducing the number of nodes was found to be the most sensitive for leak detection. Table 1 presents a summary of various pipeline leak detection methods.
Bermudez et al. [43]. established a hydraulic network model simulation with four nodes and two branches, forming a two-tiered water distribution system. This system can also be adjusted with valves to form different pipeline network configurations for simulating leaks. Yang Xuan et al. [44]. conducted an in-depth study on the mechanism of pipeline leak-induced vibrations, utilizing numerical simulation methods to model leaks in pipeline networks, thereby overcoming the issue of difficulty in installing vibration sensors due to the small size of the leak orifice. They analyzed the flow field around the leak orifice, and this research significantly enhanced the understanding of the physical processes involved in leak occurrences. Hao Fu et al. [45] employed commercial software FLUENT 2020R1 for 3D computational fluid dynamics (CFD) simulations within the pipeline, validated the simulated pressure distribution of the leaking pipeline using experimental data, and characterized the pipeline leak model using dimensionless pressure drop.
Summarizing the findings from both domestic and international research, existing methods for detecting and assessing pipeline leaks and damages do not meet the needs of routine network leak detection, exhibiting certain shortcomings in terms of accuracy or cost-effectiveness.
Currently, the reverse source tracing technology based on flow field solutions can accurately detect and locate, achieving good results in diagnosing the sources of air and water pollution.
In this study, the research objectives were as follows:
(1)
To investigate the settings of pressure wave monitoring points, time steps, and corresponding boundary conditions for complex pipe networks within OpenFOAM 5.0.
(2)
To examine the construction of the adjoint equation within the PISO algorithm for complex pipe networks, transforming the reverse source tracing problem into a solution of the adjoint equation.
(3)
To explore how to calculate the time difference in pressure signal reception at various monitoring points based on the pressure waveforms obtained, determine the possible locations of leaks, and thereby study how to accurately locate the leak source.
(4)
Therefore, this paper applies the reverse source tracing technology based on the adjoint equation to water supply networks, aiming to more rapidly achieve leak detection and location in complex networks.

3. Methodology

3.1. Reverse Method

Constructing a complete mathematical model typically involves the input of data, the output of results, and the processing tools for intermediate data. Within these components, the input parameters are generally known quantities or quantities to be estimated, such as in pipeline leak detection, boundary conditions represented by temperature, flow velocity, pressure, and leak location are the input quantities. The system’s solution process must conform to natural laws, adhering to the conservation of energy, the conservation of momentum, and other fundamental fluid equations.
The final output section represents the numerical simulation results of the pipeline after the input is determined and the system is established, which are the final simulated pipeline-related parameters. These can include pressure fields, velocity fields, temperature fields, and various pipeline-related indicators that can be used for leak detection evaluation. For inverse problems, the first and third parts are also reversed; the forward problem determines the output based on the input, while the inverse problem deduces the input from the output, a method known as inverse identification.
For pipelines, the computational results are data from certain measurement points, signals detected by sensors in simulations and experiments. Based on these, one can infer input parameters, such as the location of the leak, the pressure parameters at the leak location, and the release intensity.
Applying the adjoint theory, the control equations (forward operator) with pressure and velocity as dependent variables are replaced with the adjoint equations (adjoint operator) where the dependent variables are the adjoint states. In the inverse model, the adjoint equation model is equivalent to the forward model in describing the physical process. The difference lies in the adjoint states propagating backward in time, meaning the flow of information is opposite.
The transient equations of pipe network flow field are established, the parameters coupled with the transient pressure of flow field are found out, and these parameters are retained to simplify the transient equations of flow field.
Without considering the influence of friction, damping and other factors, the transient pressure flow equation in one-dimensional semi-infinite interval is Equation (1).
p t + ρ a 2 v x = 0 v t + 1 ρ p x = 0 t + , 0 x < +
The initial condition is Equation (2).
p x , t = 0 v x , t = 0 t = 0
The boundary condition is Equation (3).
p x , t = p 0 t v x , t = 0 x = 0 p x , t = 0 x +
In the formula, “p” is pressure (Pa), “v” is the liquid flow rate (m3/s), “a” is the pressure wave velocity (m/s), “ρ” is the liquid density (kg/m3).
(1) The appropriate sensitivity function is selected according to the influence of pipe network leakage on pressure wave formed by flow field. The sensitivity function of the pressure wave is as follows:
h α , p = p x , t δ x x * δ t t *
In the formula, ”p (x, t)” is the pressure wave propagation function, “α” is the Dicra function, “p” is pressure.
(2) The transient adjoint equation of pipe network flow field is derived by taking the derivative of sensitivity function to pressure and introducing adjoint operator. The transient adjoint equation of flow field is obtained by using Gaussian divergence theorem and boundary conditions are set. A metric objective function that quantifies the state of a system is Equation (5):
L = h α , p d x d t
The integral interval is a given space–time interval, and the critical sensitivity of the system with respect to the vector parameter αk can be obtained by differentiating the parameter αk.
d L d α k = h α , p α k + φ α , p p d x d t
In the formula, “ φ = p α k ” is the state parameter sensitivity. The transient governing equation about φ is obtained by combining the adjoint theory with the single-phase flow pressure governing equation. It is obtained by substituting φ = p α k , λ = v α k into the Equations, their initial and boundary conditions.
h α , p p φ * t 1 ρ λ * x = 0 λ * t + ρ a 2 φ * x = 0
The initial condition is Equation (8):
φ * x , T = 0 λ * x , T = 0
The boundary condition is Equation (9):
φ * 0 , t = p 0 t λ * 0 , t = 0
Considering the friction resistance in the flow process, the transient adjoint equation of pipe network flow field is obtained.
δ x x * δ t t * λ * t g λ * x = 0 λ * t + a 2 g φ * x f v 2 D λ * = 0

3.2. Experiments and Simulations

3.2.1. Experimental Framework

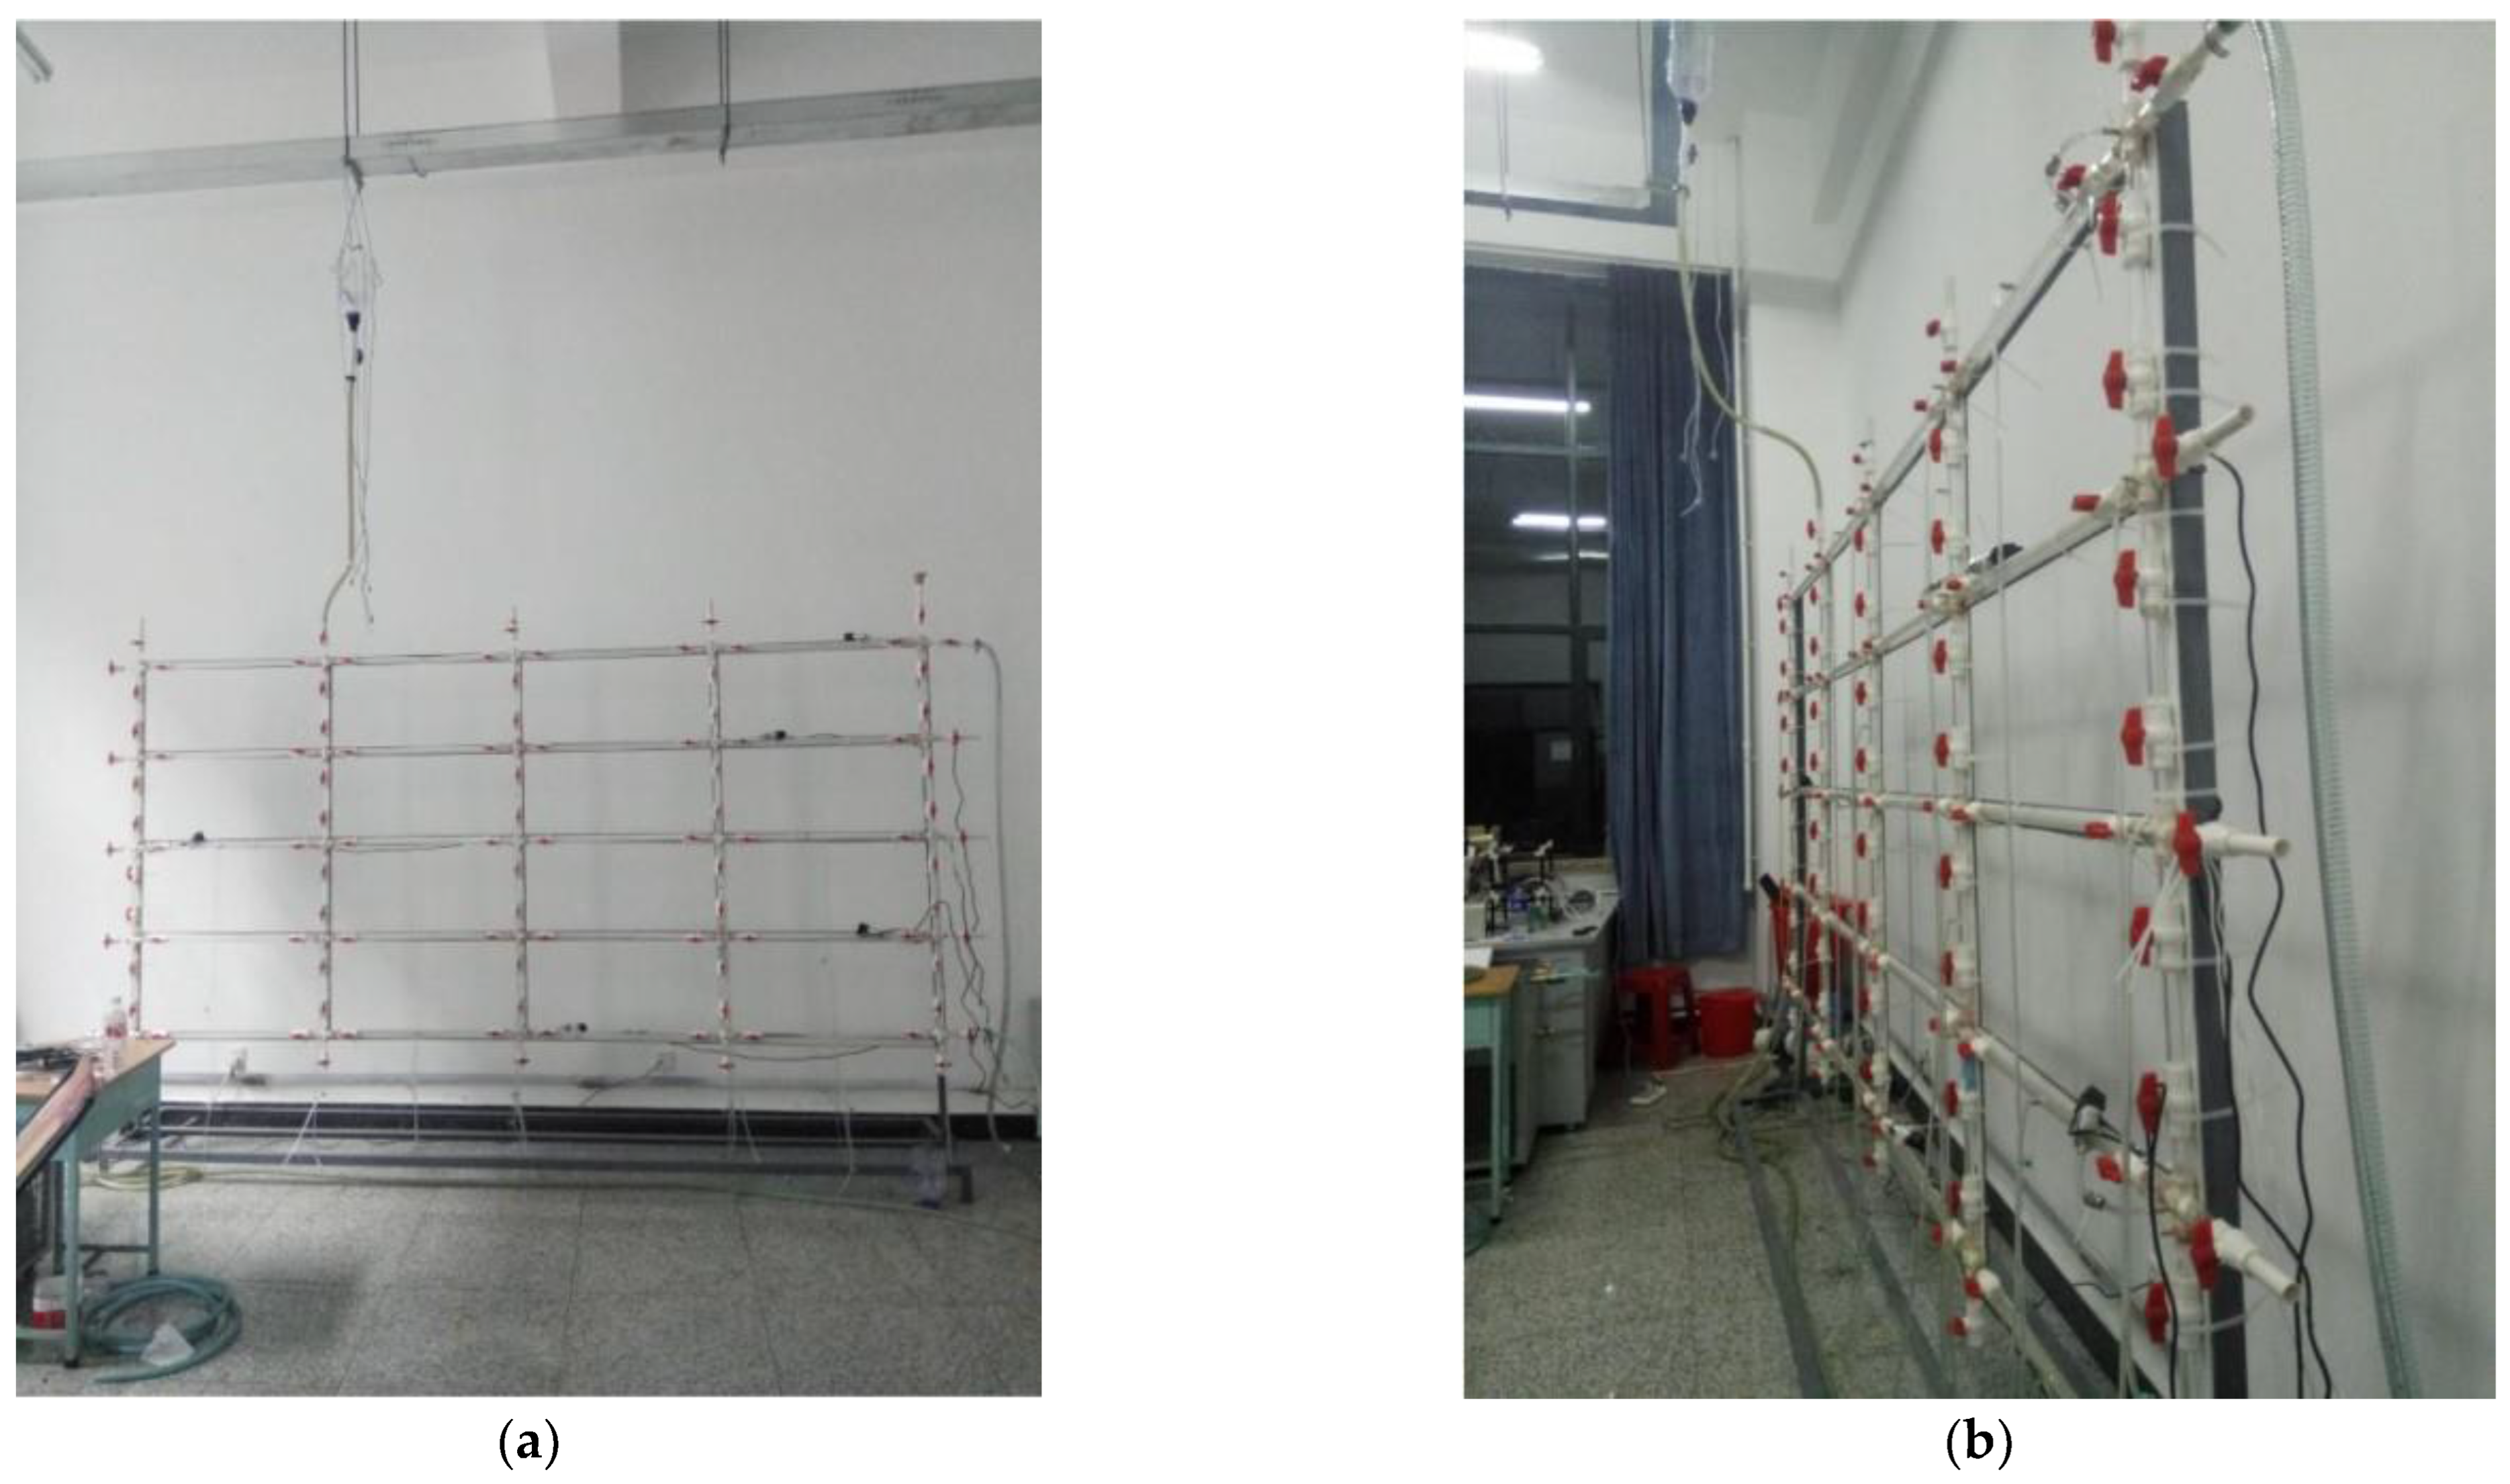
This paper uses experiments as a benchmark to verify the results of numerical simulations conducted using OpenFOAM 5.0. During the experiments, the pressure before, during, and after the pipeline leakage was measured. The experimental system is shown in the figure below and mainly consists of an experimental section, five pressure transmitters, two electromagnetic flowmeters, two filters, a water tank, a water pump, a data acquisition device, and a computer. The system is divided into three basic parts: the complex network miniature experimental system, the signal transmission system, and the data processing system. The elastic thin plate model is illustrated in Figure 1.
Given that the actual water supply network has a Reynolds number (Re) typically ranging from 0.5 × 10⁵ to 4 × 10⁵, and the flow within the pipes is in the resistance square region during stable operation, a model of the water supply network was designed according to the theory of similarity, taking into account the operational parameters and the laboratory space. Water was selected as the medium for the operation of the network. To meet the requirements of visibility, strength, safety, and ease of installation, acrylic was chosen for the main pipeline of the network, with UPVC used for valves and tees.
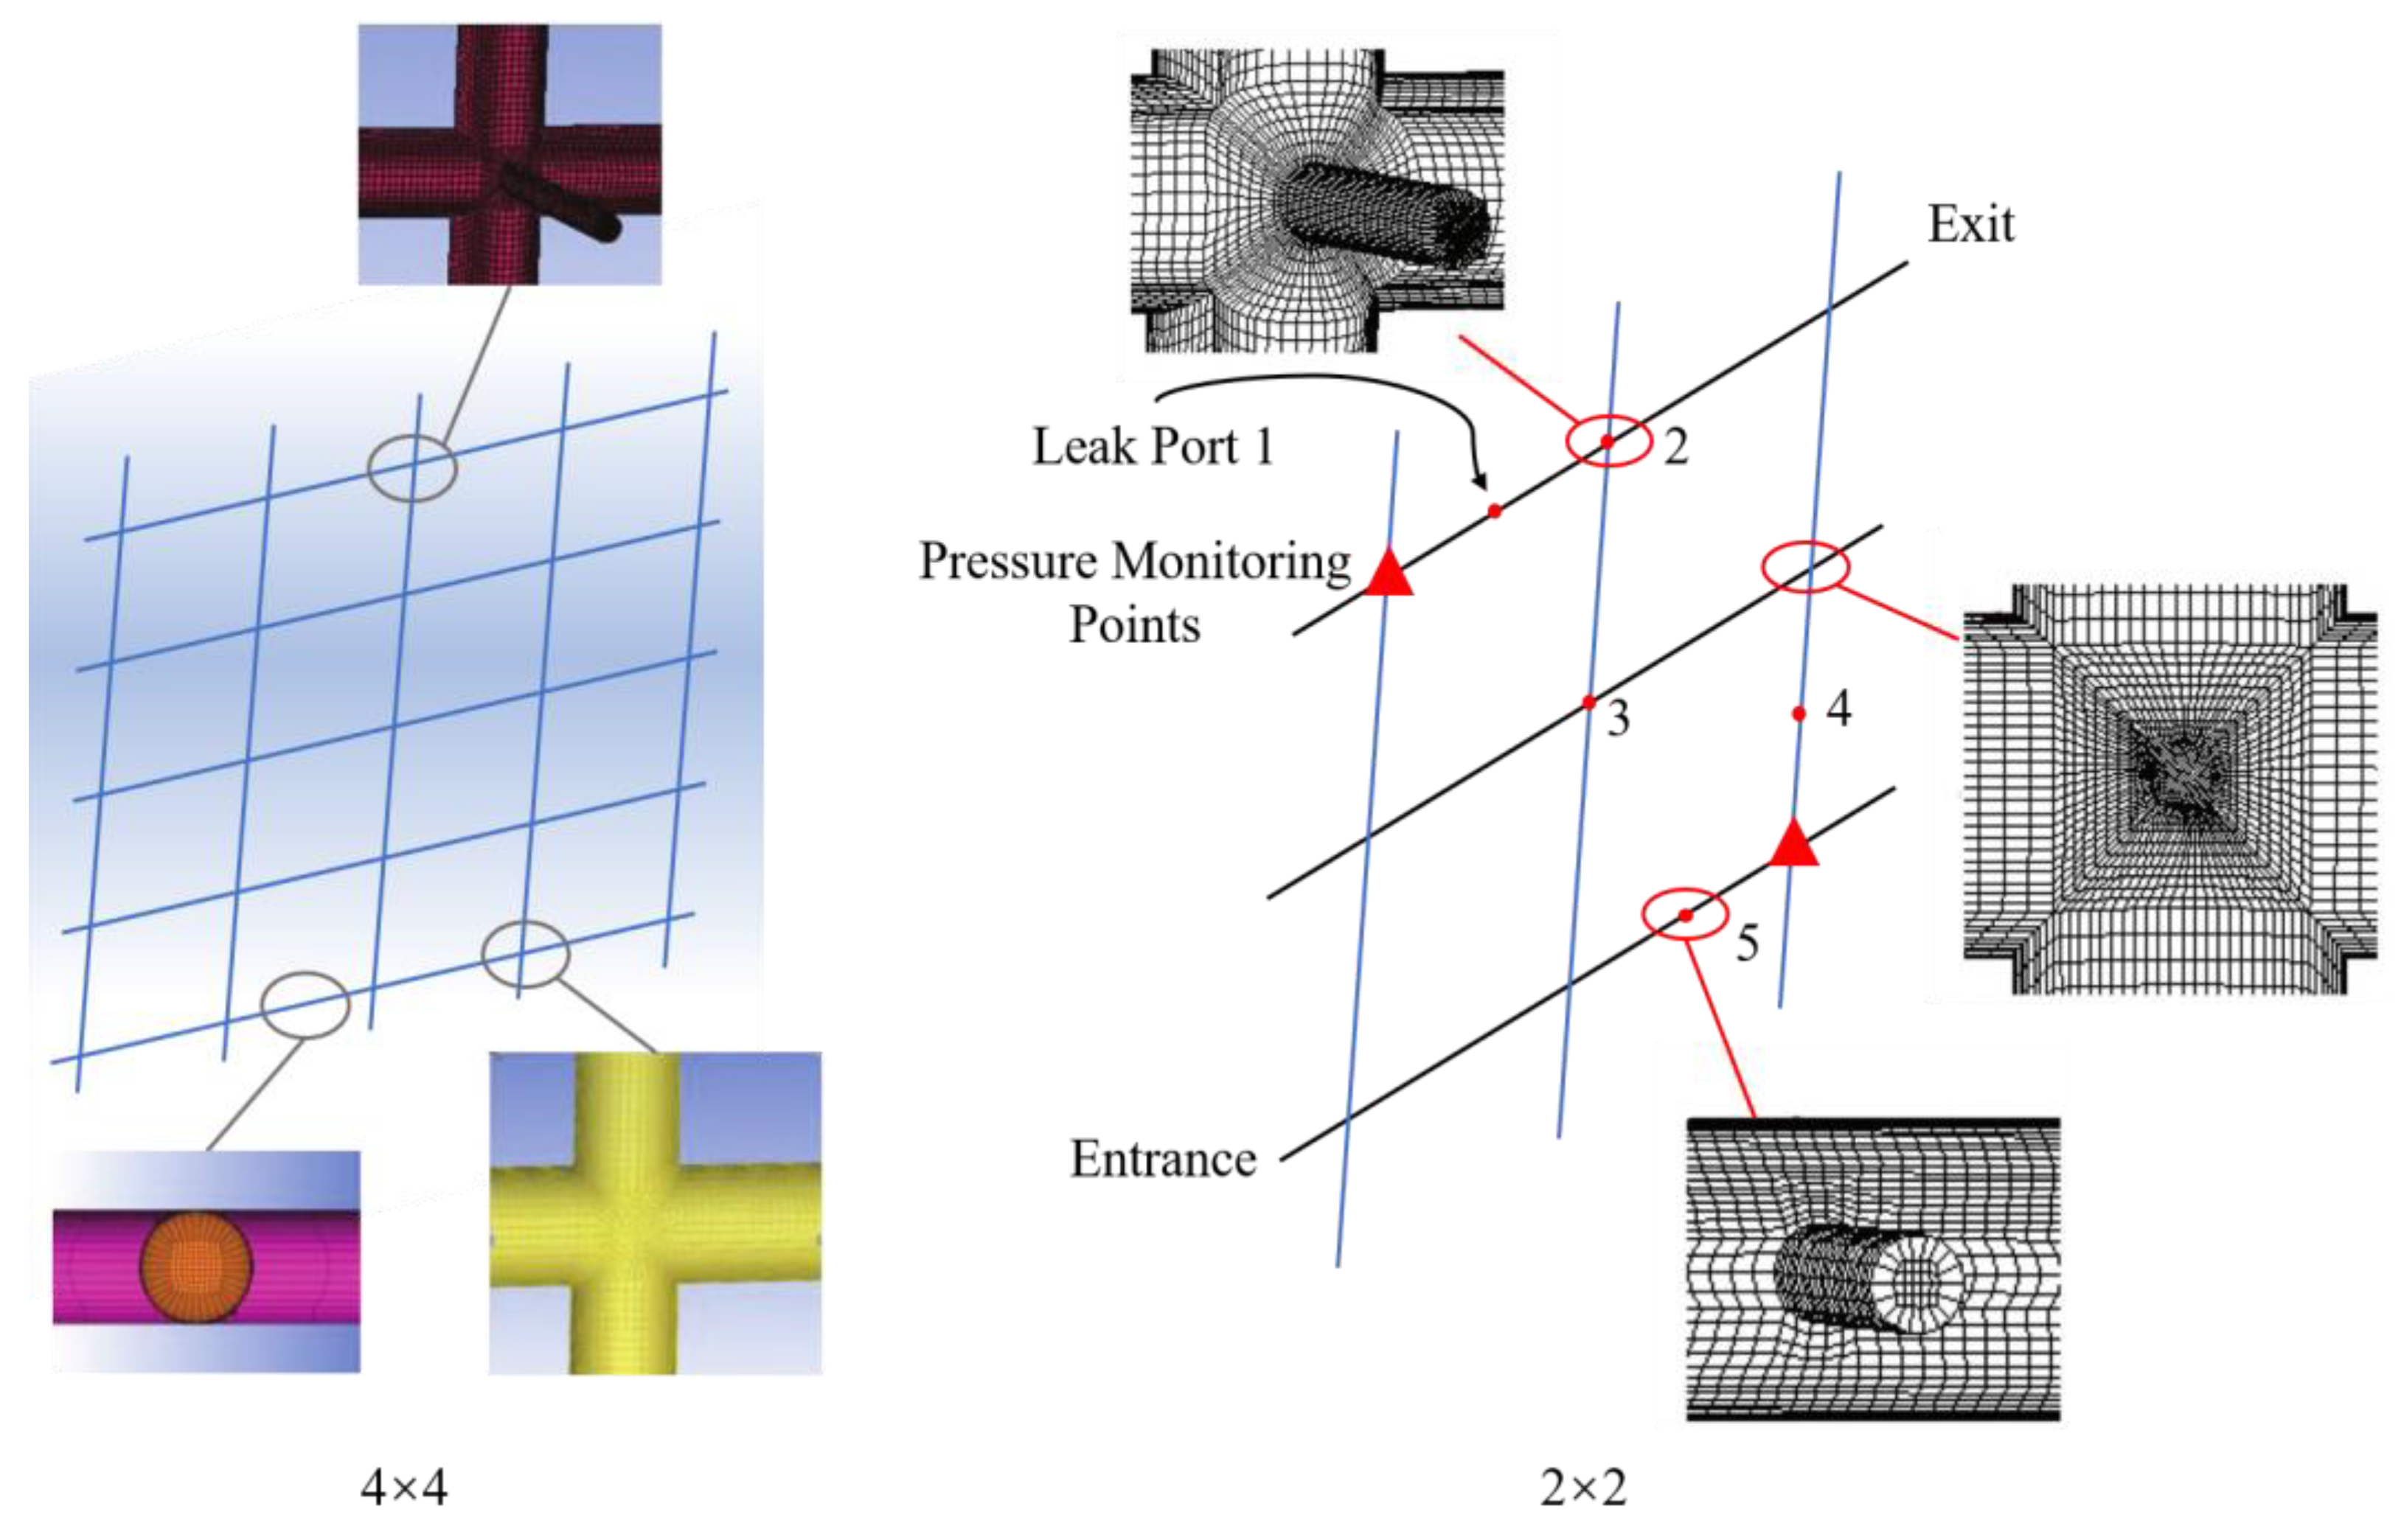
The main body of the network is a 4 × 4 complex ring-shaped network. The pipeline is made of acrylic with an inner diameter of 12 mm and an outer diameter of 20 mm, and the leak has an inner diameter of 4 mm and an outer diameter of 6 mm. All ring sections of the network have the same dimensions, each being 0.85 m long and 0.38 m wide, with a total of 25 nodes in the sections, of which 5 are pressure measurement points. A total of 20 leakage points were set up, with 10 located at the nodes of the sections and the other 10 at the midpoints of the sections, to study leakages at both the nodes and the midpoints of the sections. The distribution of points is illustrated in Figure 2.The front view and side view of the experimental bench are shown in Figure 3.

3.2.2. Simulations

Based on the dimensions of the experimental section, a simulation model was established, neglecting the wall thickness, with a pipe diameter of 12 mm and a leak hole diameter of 4 mm. The overall model utilizes a three-dimensional hexahedral structured mesh. Y-Block and O-Block meshes were applied at the pipe intersections and the leak orifices, respectively. The experimental section consists of a 4 × 4 network grid, with a mesh count reaching 9,061,188. To facilitate computation, it was simplified to a 2 × 2 network grid, reducing the mesh count to 4,420,092, which significantly improved computational efficiency. The grid detail distribution is shown in Figure 4.
In this study, a three-dimensional hexahedral structured mesh was selected for the numerical simulations. The following table presents the results of the mesh independence verification. The grid count utilized for this simulation is 4,420,092.
Table 2 shows the pressure range under different grid number divisions. Taking leak point 1 as an example, when the mesh count reaches 4 million, the pressure drop at the monitoring point remains almost constant. To enhance the accuracy and efficiency of the pipeline leakage simulation, mesh refinement was applied to the pipe intersections, the intersectional leak points, and the pipeline inlets and outlets.

3.2.3. Leak Detection and Correlation Analysis

The pressure wave generated by the same leak source takes different amounts of time to propagate to various sensors; hence, the signals recorded on different sensors will not be identical. However, when one of the signals recorded by two sensors is given a certain time shift, a significant similarity between the two signal sequences can be observed. Based on the time difference of the pressure wave reaching two monitoring points, the wave speed of the pressure wave can be used to determine the location of the leak.
To improve the accuracy of time delay estimation, a new time delay estimation method combining the Hilbert Transform and the second correlation method was adopted. The basic idea is to integrate the two analysis methods, subtracting them from the absolute value of the correlation function, retaining the peak points of the correlation, and reducing the correlation values of the nearby points. This sharpens the main peak, significantly enhancing the accuracy. On the basis of the aforementioned second correlation method, the Hilbert Transform was incorporated, combined with the quadratic correlation method. The principle is illustrated in the Figure 5.
The method sharpens the main peak while using the cross-correlation function to determine the degree of signal similarity. The principle of the cross-correlation method is that the correlation coefficient of two sets of signals is usually near zero before leakage; when a leak occurs, the correlation coefficient of the signals shifts from near zero, and the time corresponding to the signal peak is the time point where the correlation coefficient is maximized.
Assuming s1 (t), s2 (t) are two sets of different random signals, their cross-correlation function is defined as:
R S 1 S 2 τ = E 2 s 1 t s 2 t + τ = lim T + 1 T 0 T s 1 t s 2 t + τ d t
From Rs1s2 (τ), the degree of similarity between signals s1 (τ)and s2 (τ)can be calculated, where τ represents the time shift.
The pressure waves generated from the same leak source are detected at different times by two monitoring points. After applying a certain time shift to the signal from one of the monitoring points, a significant similarity between the two signal sequences can be observed. By calculating the time difference for the pressure waves to reach the two monitoring points using a novel time delay estimation method based on the correlation coefficient method, the location of the leak can be determined based on the known velocity of the pressure waves.
We will utilize the positive pressure relationship to link pressure, density, and compressibility ψ . Since pressure waves propagate through water at the speed of sound, the calculation formula is as follows:
c = 1 ψ = 1 4.54 × 10 7 = 1483.2   m / s
This paper takes leak holes 1, 2, and 3 as examples. The propagation speed of the pressure wave is 1483.2 m/s. A time step of 5 × 10⁻⁷ s is set. Using the PISO algorithm with a custom solver, the fluid flow in the pipeline network stabilizes at 2 s before a leak occurs.
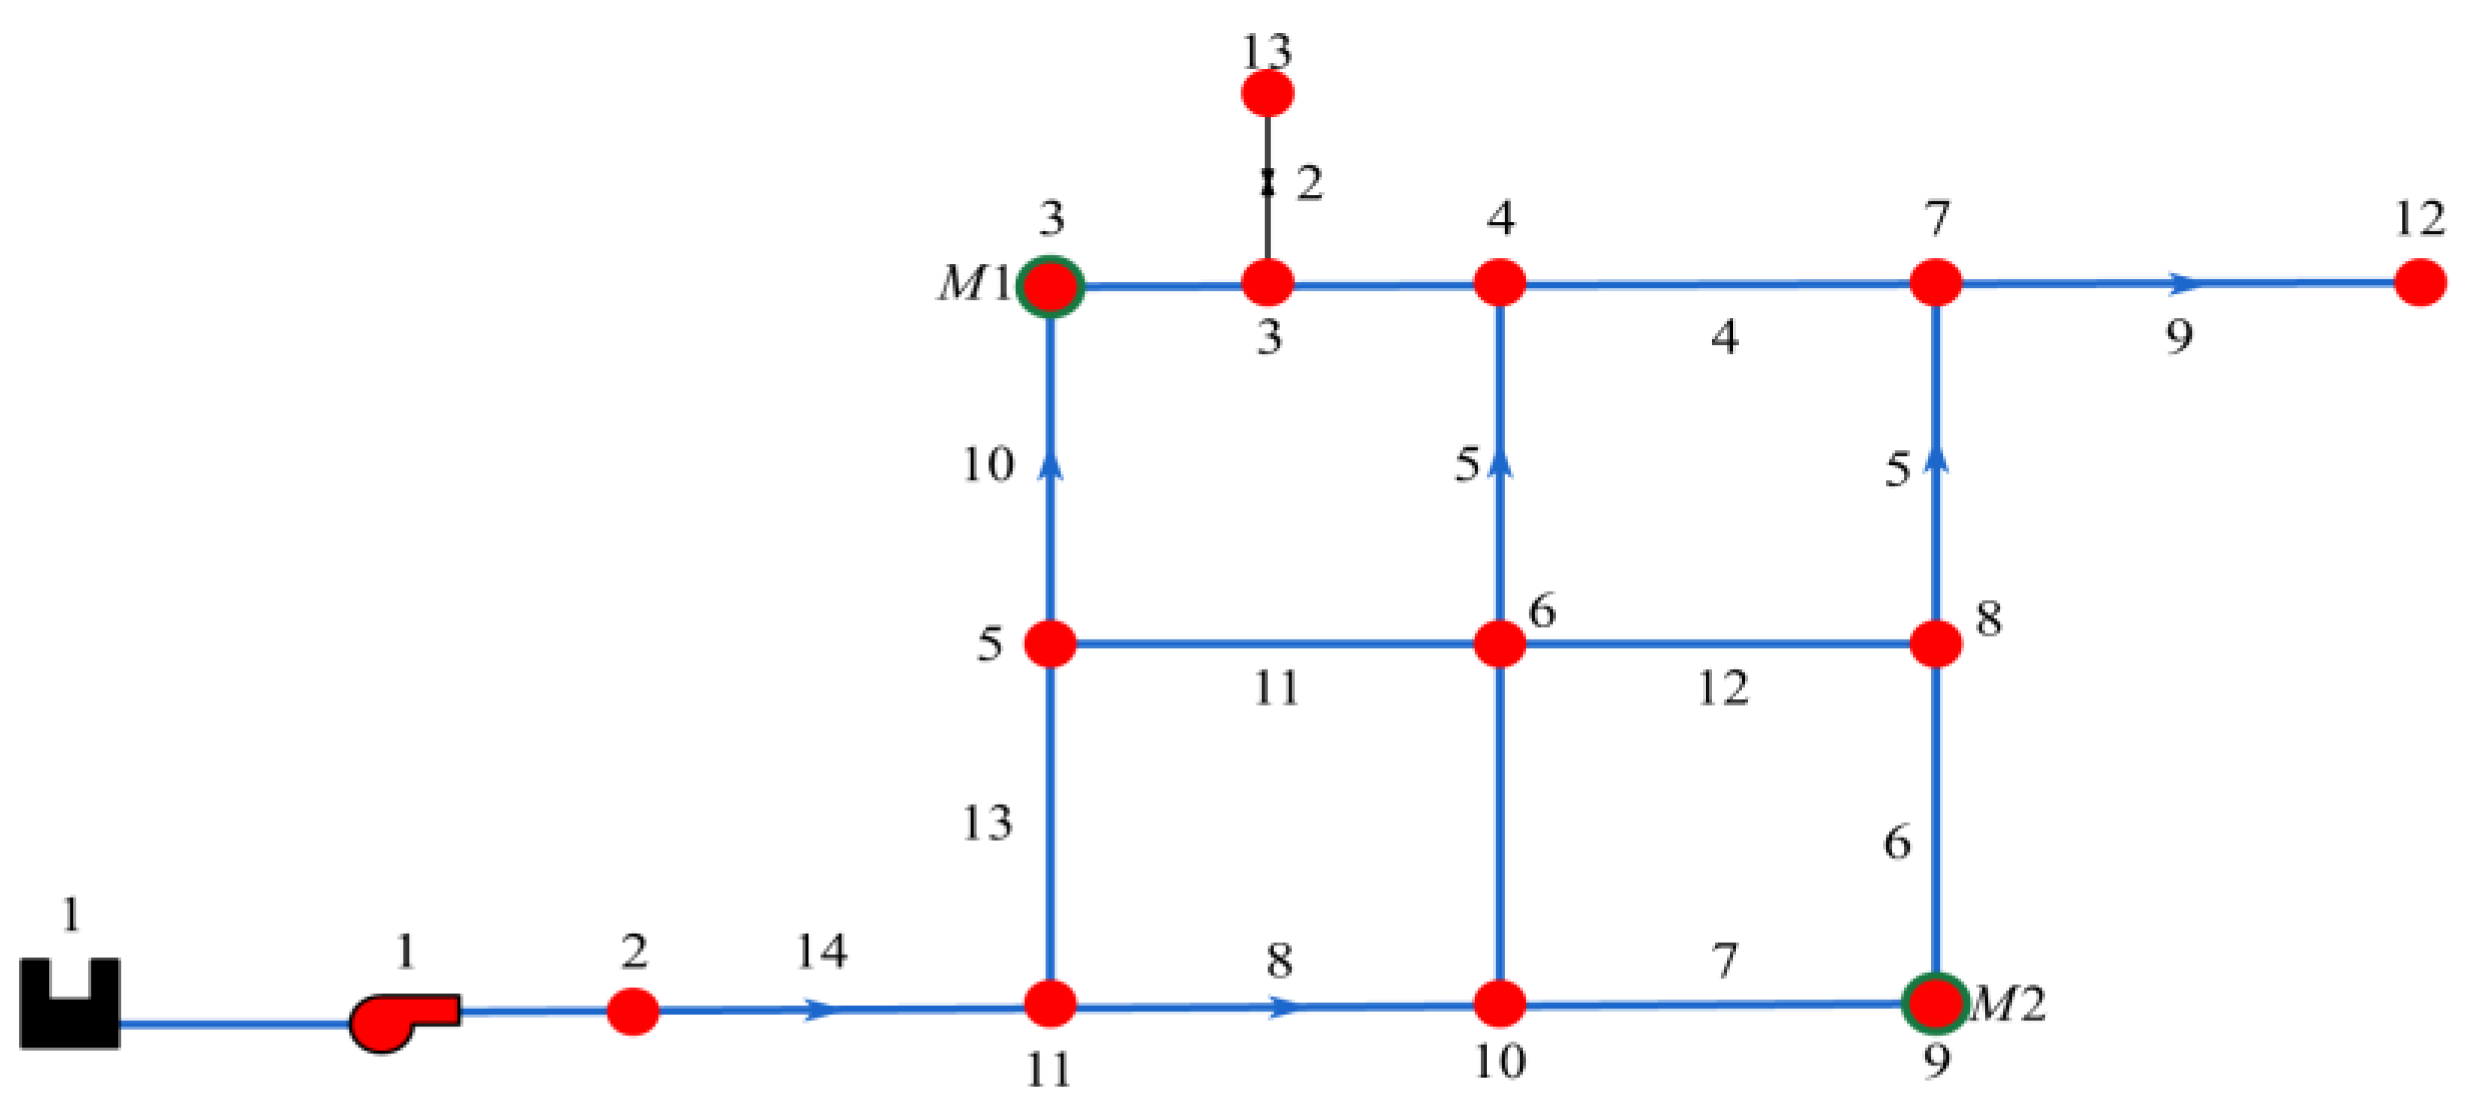
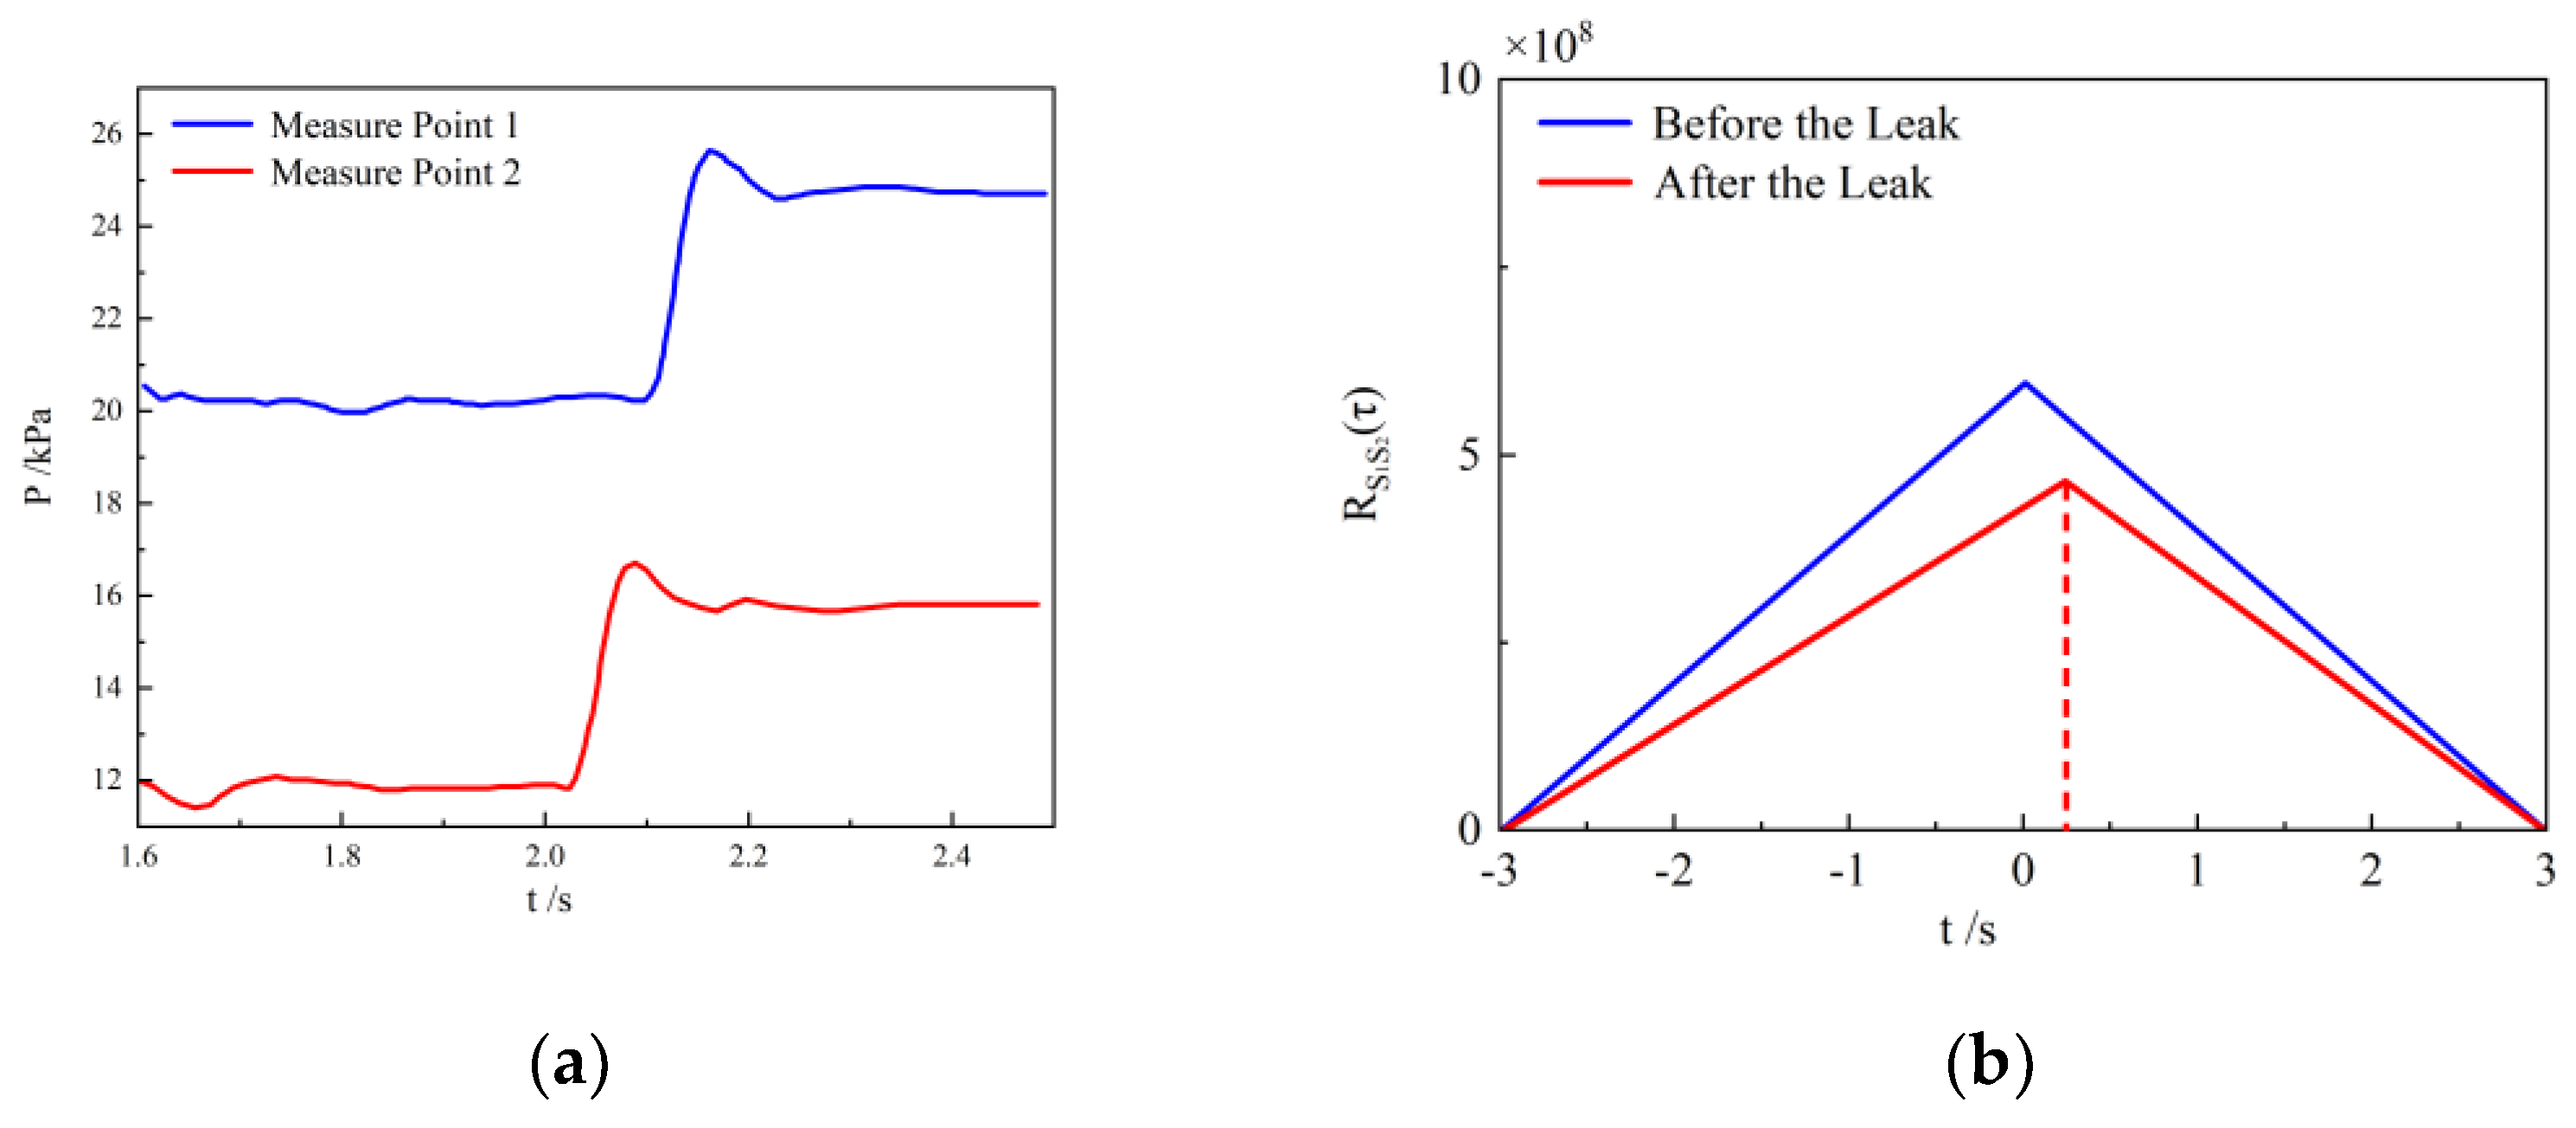
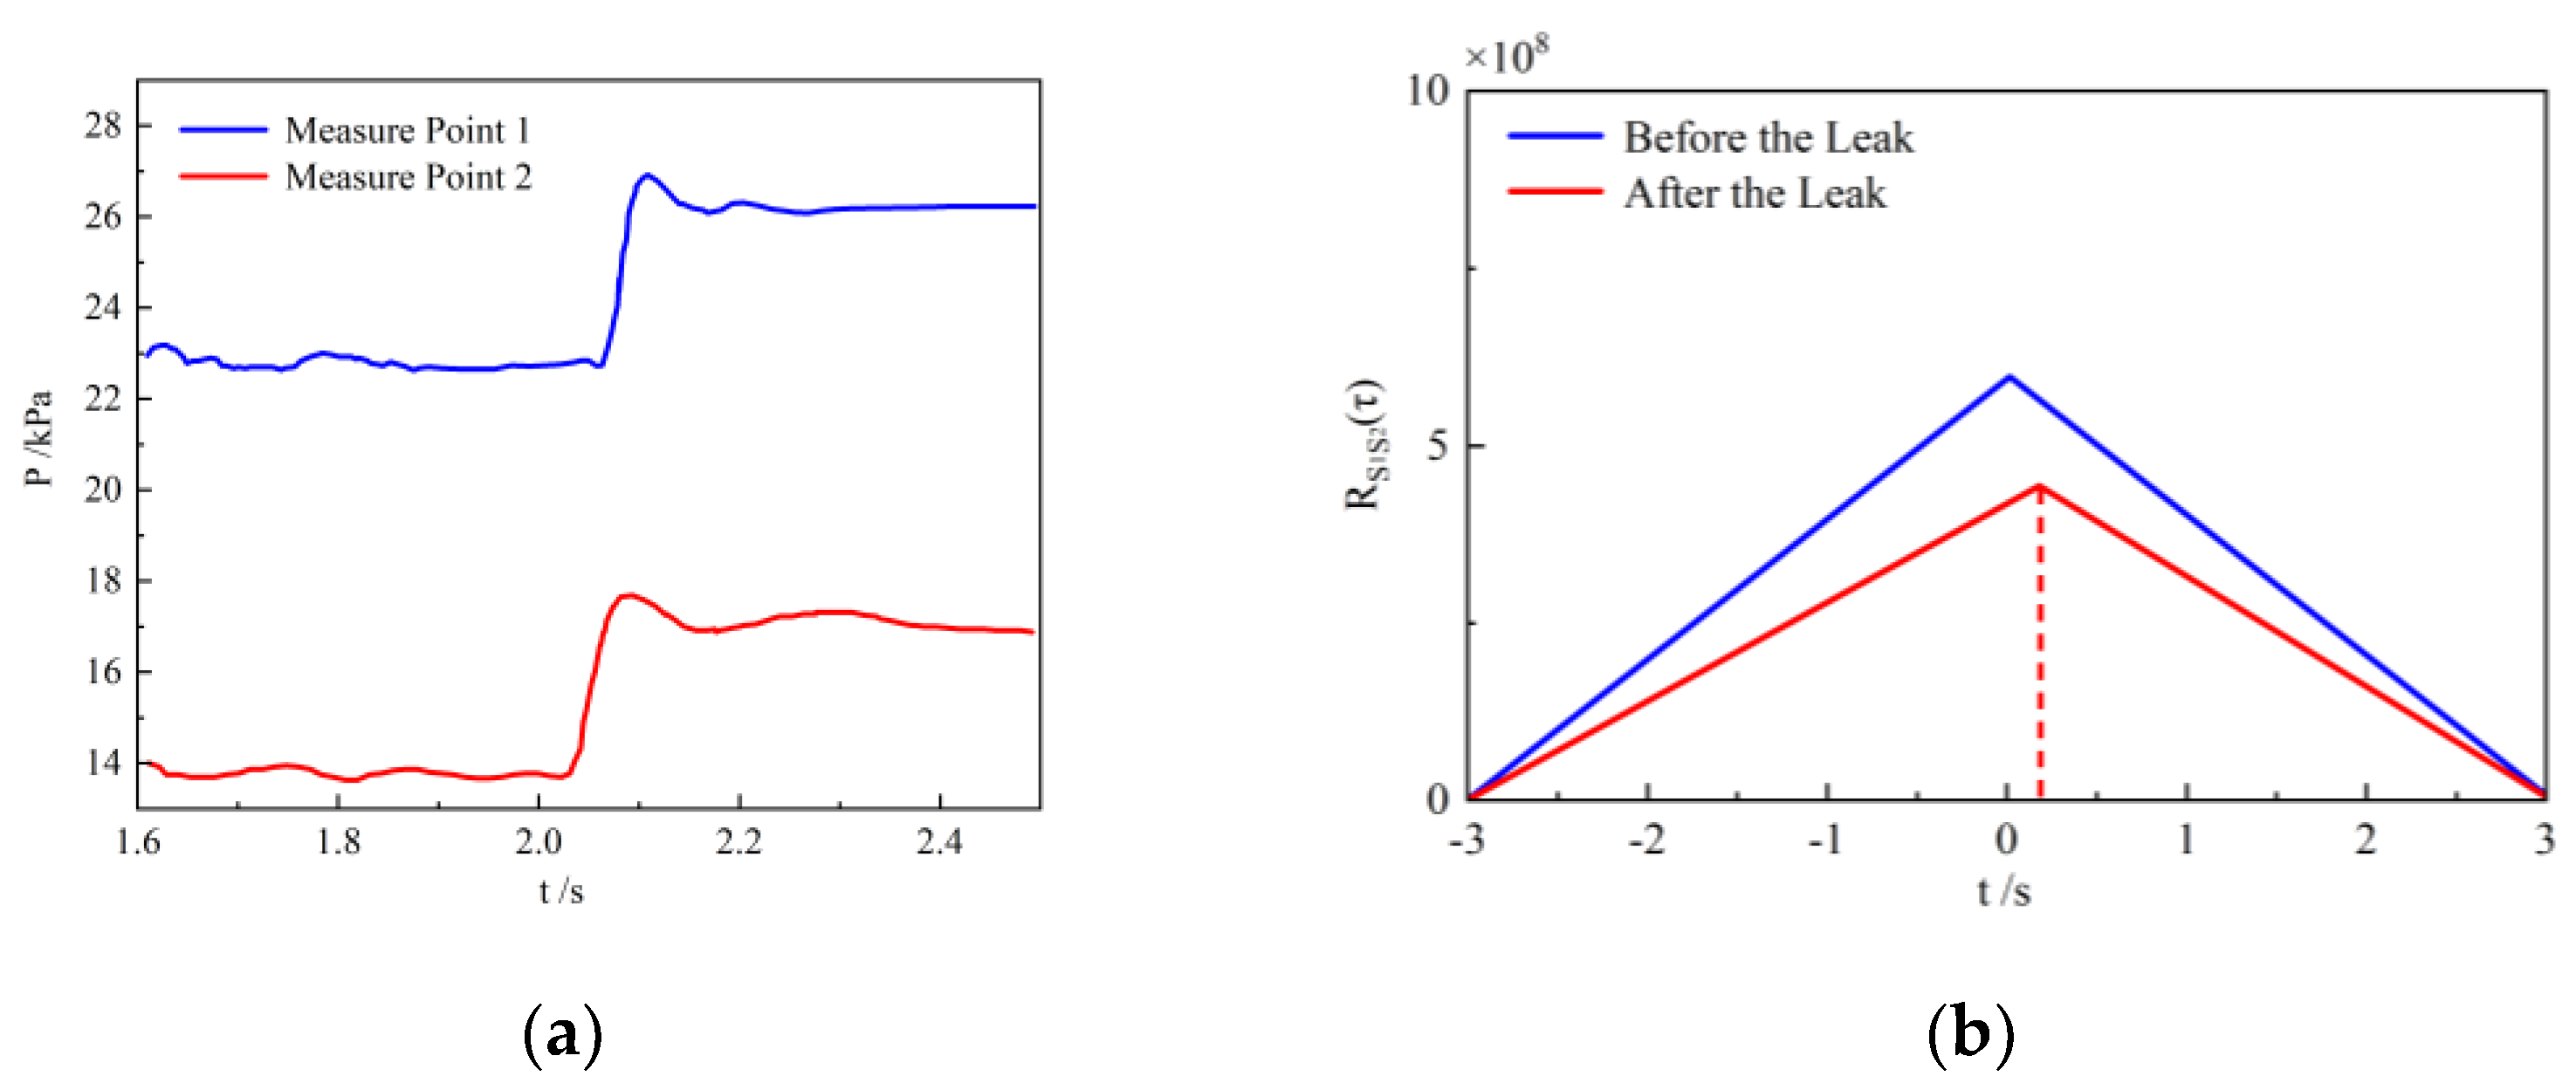
The simplified 4 × 4 pipeline network system diagram is shown in Figure 6. Two pressure measurement points are set, measurement point 1 and measurement point 2, to monitor the pressure wave signals before and after the leak. The signals processed by the novel time delay estimation method and the cross-correlation analysis method at measurement points 1 and 2 before the leak and throughout the entire process are shown in Figure 7, Figure 8 and Figure 9. The maximum value of the correlation coefficient is usually near zero before the leak. After the leak occurred, the maximum value of the signal correlation coefficient shifted from near zero. It can be seen from the correlation comparison diagram that the emergence of a pipeline leak caused the value of the maximum correlation coefficient to decrease. We determined whether a pipeline leak occurred by comparing the threshold values before and after the leak in the pipeline.
From Figure 7, Figure 8 and Figure 9, it can be observed that after the pipeline flow stabilized, a leak occurred at 2 seconds, causing an instantaneous increase in pressure with pressure waves rapidly propagating upstream and downstream along the pipeline. Within 0.2 s after the leak, the pressure change was pronounced, exhibiting an increasing trend. The internal pressure along the pipeline also rose, fluctuated slightly, and then stabilized at a value slightly higher than the normal pipeline pressure. At the pipeline inlet, we used a velocity inlet, where the inlet velocity was constant, implying a constant flow rate. Shortly after the leak, the upstream flow velocity at the leak point decreased and then returned to the stable value before the leak. The measurement point in the upper left was closer to the leak hole, while the one in the lower right was farther away. It received the pressure wave signal later than the upper left measurement point, and the pressure value was higher than that of the upper left measurement point. The overall trend was the same, with the pressure change ranging between 10 kPa~28 kPa. After the leak, the correlation coefficient decreased, and there was a delay in the time corresponding to the maximum correlation coefficient, which was consistent with the correlation verification.

3.2.4. Leak Location Identification

The pipeline leak detection and localization process flowchart is shown in Figure 10. Upon the occurrence of a leak in the pipeline network, we initially conducted leak detection using the aforementioned methods to ascertain the potential sites of leakage and assess the extent of leakage in various sections. Subsequently, we employed a global search approach to ultimately pinpoint the leak location.
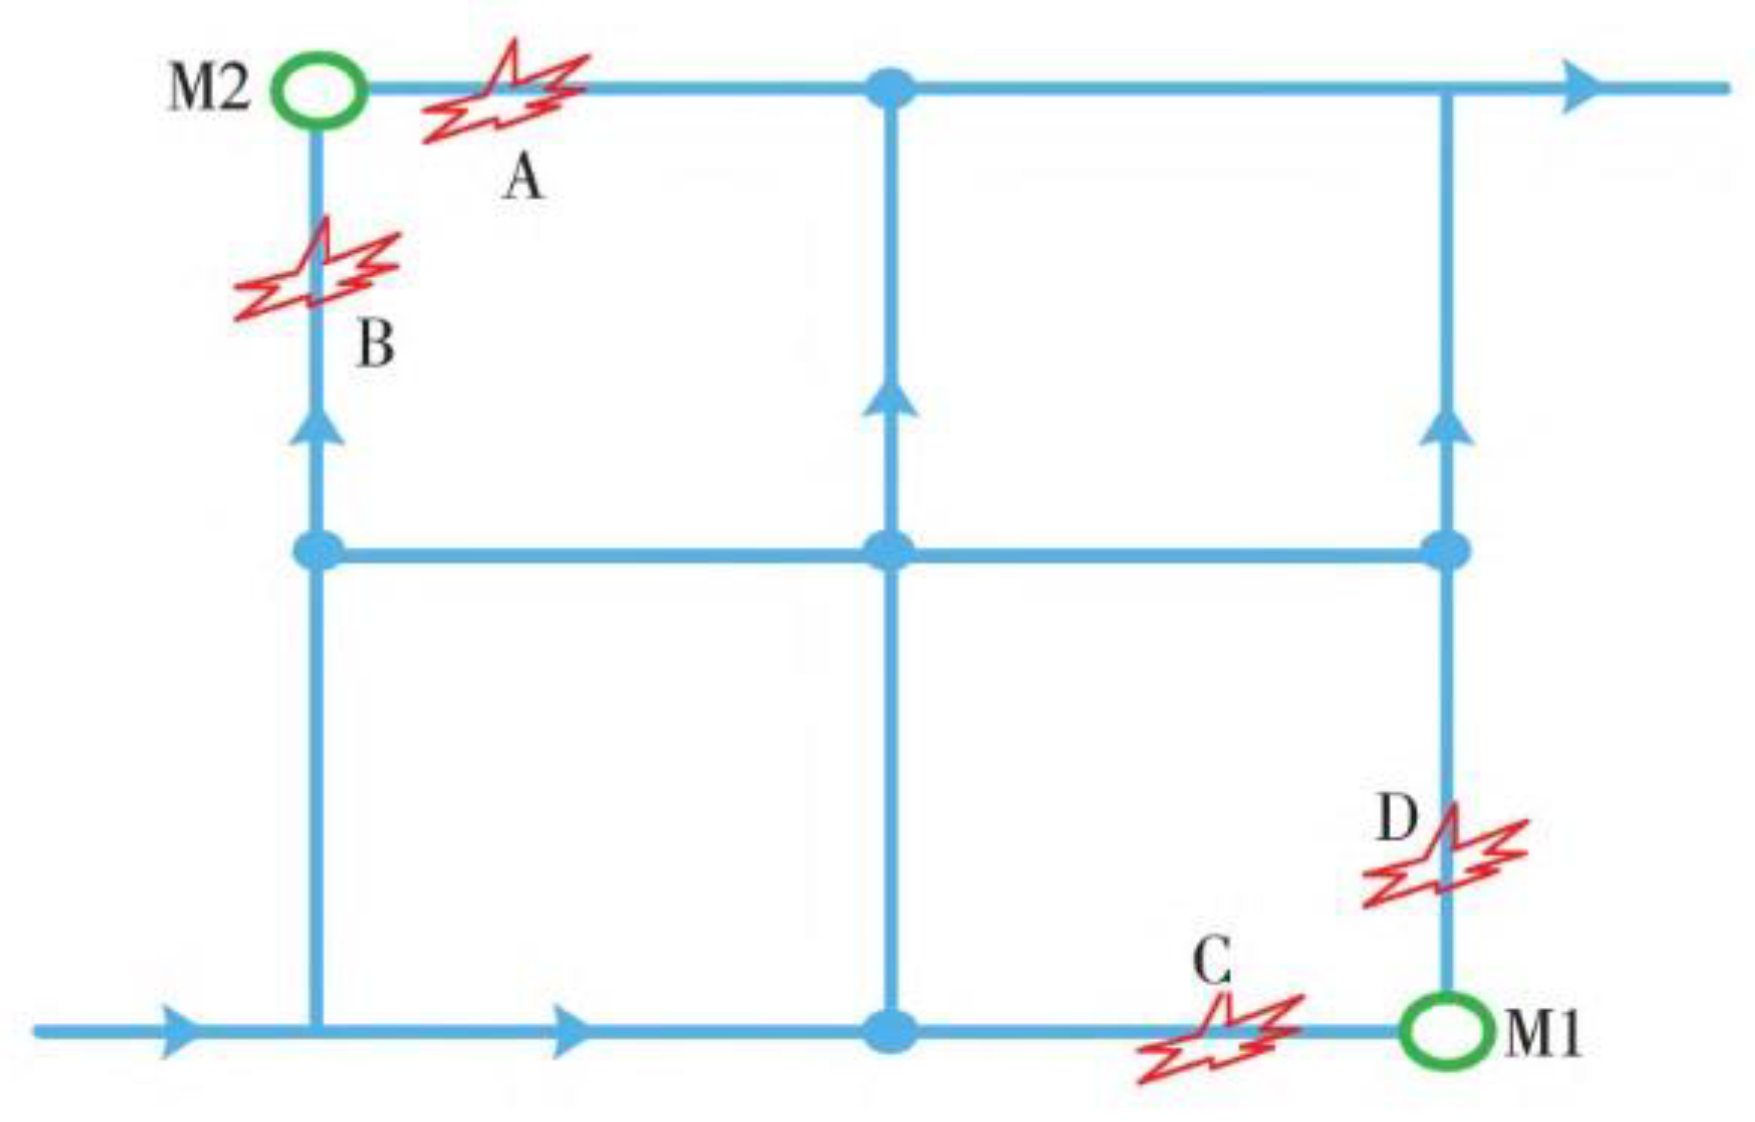
Incorporating simulation outcomes, we analyzed the correlation between two sets of signals, s1 (t) and s2 (t) (taking the data collection from a single leak as an example). Calculations reveal that the time difference for the pressure wave to reach the two monitoring points is Δt = 1.15 × 10⁻³ s. With the known velocity of the pressure wave, we can calculate the distance of the leak point from the two monitoring points. The difference in distances is approximately fivefold. Given that the pipeline network is isochronic, the potential leak locations are indicated as A–D in the diagram below. According to Figure 11, monitoring point 1 records a higher pressure value with a certain delay, suggesting that the leak is near monitoring point 2. The leak location is thus either point A or B.
To identify the leak location, a search algorithm was proposed. To eliminate other potential leak points, we adopted a novel approach that encompasses two features: it includes a ring network; the arrangement of measurement points can meet the requirements of the experiment. The negative pressure wave generated by the pipeline leak can reach the pressure measurement points through various pathways, and we can utilize this characteristic for experimental error analysis.

4. Results and Discussion

4.1. Leak Localization

The following table presents the Ei values for each node calculated according to the method shown in Figure 11. It can be observed from the table that node 3 has the smallest Ei value, followed by node 4. Therefore, the node closest to the leak location is node 3, and the leak is located between nodes 3 and 4, at point A. Based on the time difference Δt = 1.15 × 10⁻³ s and the known wave speed of the pressure wave, we can determine the leak location to be 414 mm; the actual leak point is at 431 mm (leak hole 1), which is within the acceptable margin of error, thus validating the feasibility of this method.
Simulations were conducted for the localization of five leak points under different leak hole sizes and different inlet pressures, with 30 and 20 simulation calculations performed respectively. To facilitate analysis, a set of data with the shortest propagation path starting from measurement point 2 was selected. Taking leak hole 3 as an example, the localization results are shown in Table 3, with errors all within the permissible range. Table 4 demonstrates the impact of the leak hole size on positioning accuracy.

4.2. Algorithm Comparison

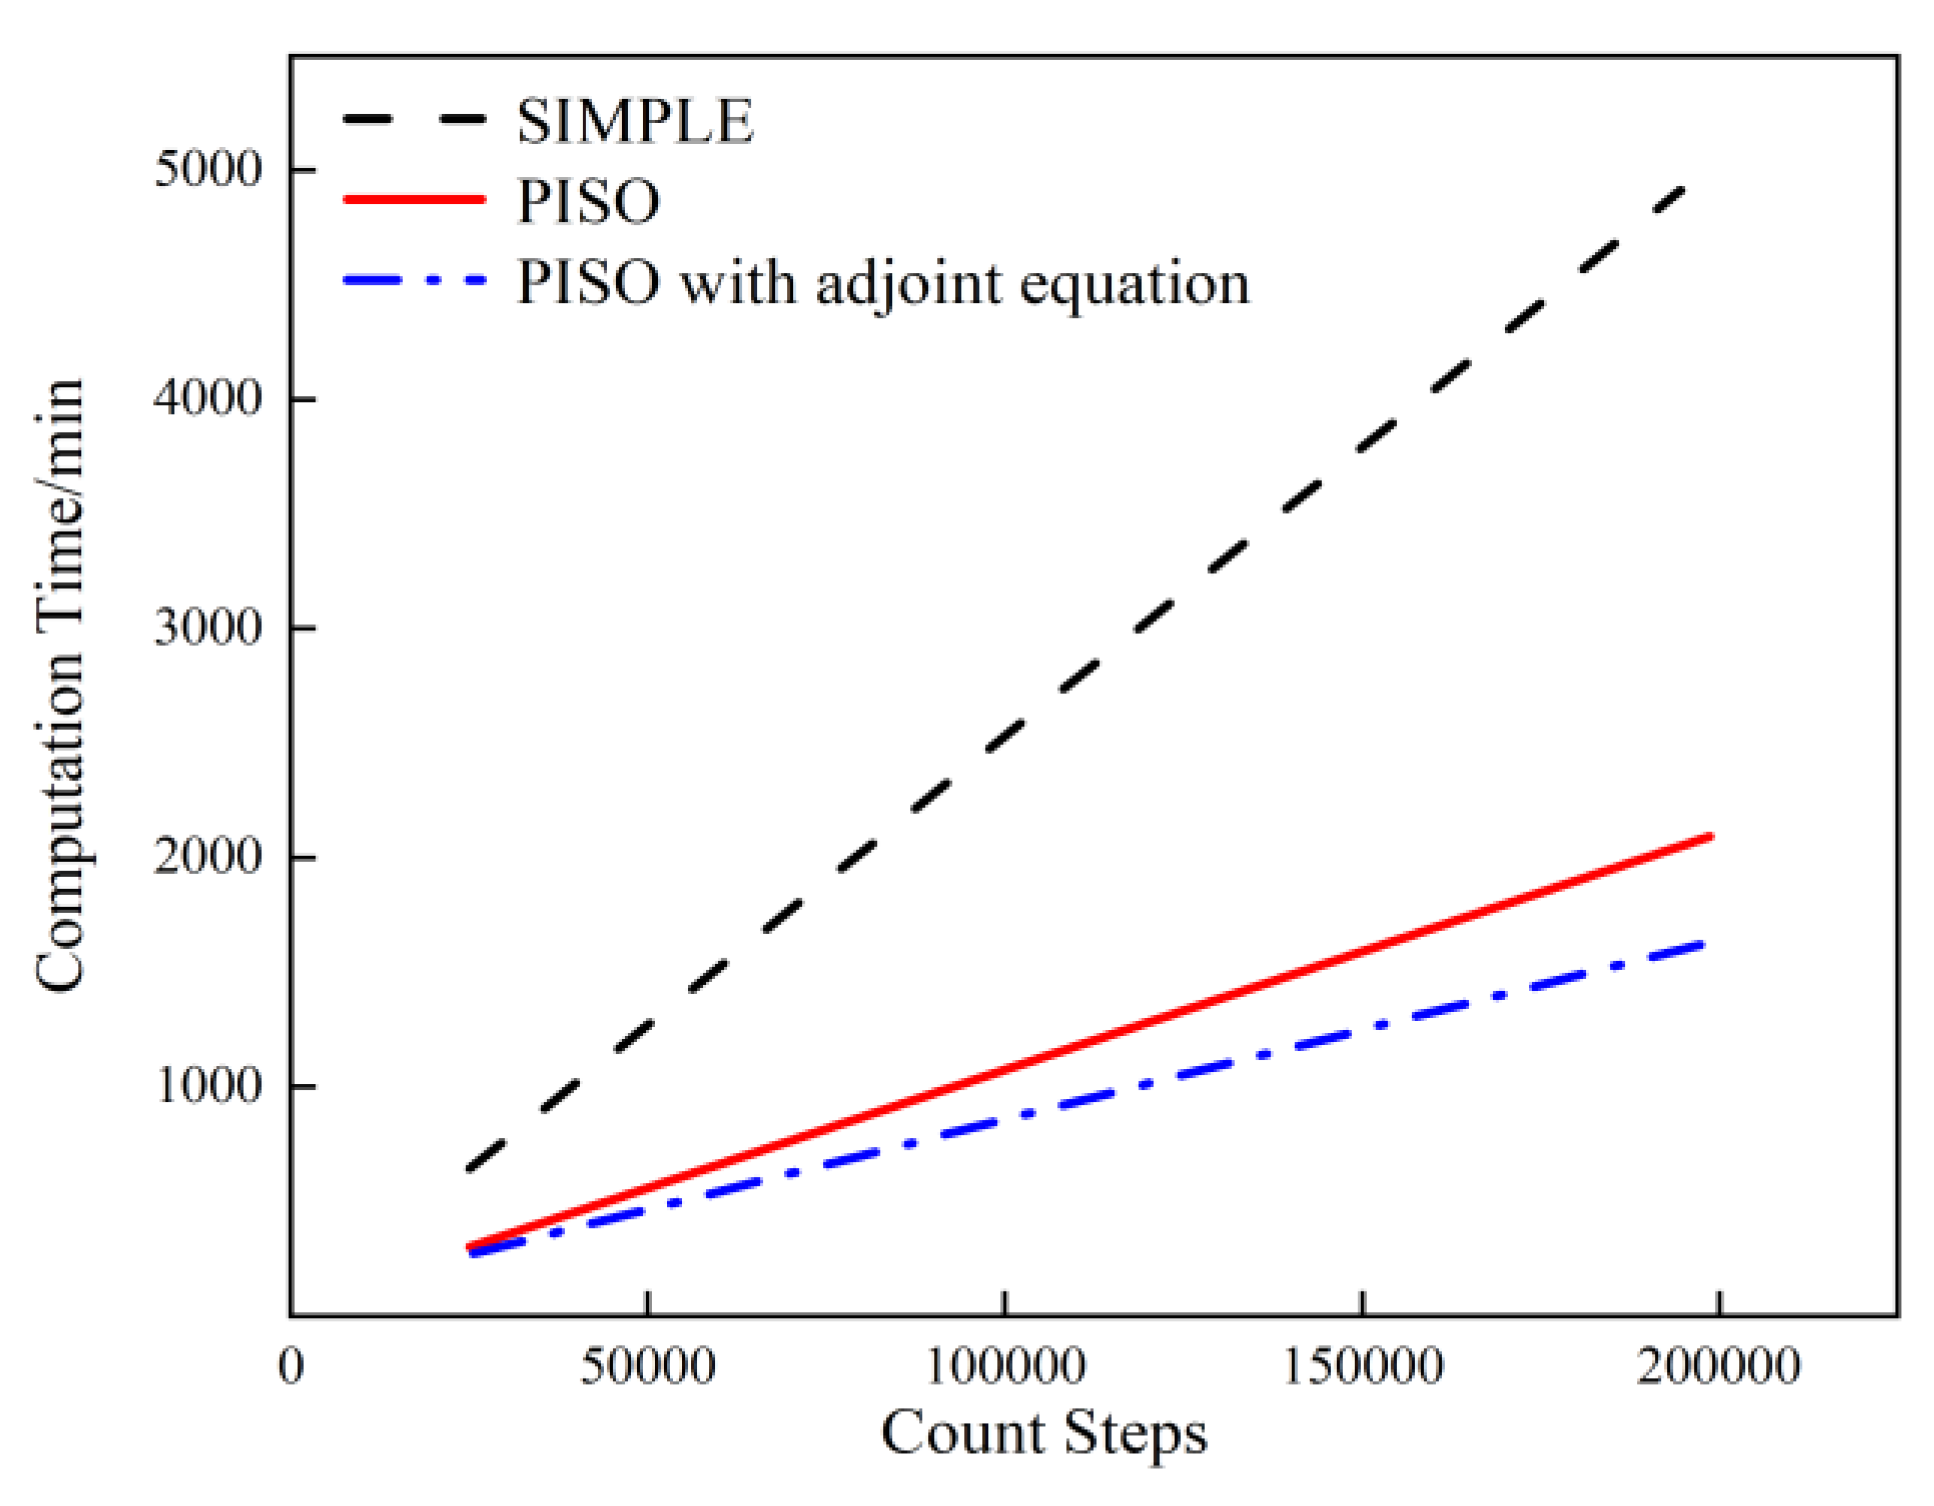
Utilizing a pipeline network model with a mesh count of 442,009, which was verified for grid independence, the iteration time required for the SIMPLE, PISO, and PISO algorithms with the adjoint equation was compared under the same boundary conditions and parameter settings at 50,000, 100,000, 150,000, and 200,000 computational steps. As the number of computational steps increased, the computation time for all three methods increased correspondingly.
The results According to the results shown in Figure 12 indicate that when applied to pipeline leak simulation, the SIMPLE algorithm exhibited the slowest computational speed, while the PISO algorithm with the adjoint equation demonstrated the fastest. Utilizing a pipeline network model that has undergone mesh independence verification, we conducted a period of computation and compared the SIMPLE algorithm, the PISO algorithm, and the PISO algorithm enhanced with the adjoint equation as presented in this paper. Under the same time step size, the computational speed of the method in this study was significantly accelerated.

4.3. Experimental Validation

In this section, experiments were conducted on different leak points to analyze the pressure change patterns in the pipeline network, and the experimental data were compared and analyzed with the simulation results. Taking leak point 1 as an example, the pressure change patterns from both simulation and experiment showed a high degree of conformity with the simulated results.
As shown in Figure 13, the pressure change curve at the leak hole, taking leak hole 1 as an example, is depicted. The blue line represents the overall trend of the pressure change, while the black lines represent the pressure change trends under experimental and simulation conditions, respectively. It can be observed from the pressure change curve that both exhibited the same pattern of change. The experimental data maintained a high pressure level before the leak, experienced a sudden drop at the moment of leakage, and after reaching the lowest point, returned to a lower pressure value and gradually stabilizes. However, the simulation data showed an opposite pattern to the experimental changes, which was due to the incorporation of the inverse model. Comparing the experimental and simulation data, the resistance during the simulation process was less than in the experiment, and there was no noise influence; therefore, the maximum simulated pressure was higher than that of the experiment, while the pressure drop before and after the leak was essentially the same. Overall, by examining the time difference corresponding to the leak moment on the horizontal axis, it was found that the leak is an instantaneous pressure change with an extreme change in time, which is consistent with the simulation results. Additionally, the forward pressure propagation curve matched the pressure change trend presented by the reverse pressure propagation curve obtained from the simulation.
Subsequently, to further validate the rationality of the method, multiple sets of experimental data corresponding to the simulated conditions were processed. A total of 50 sets of experiments and simulations were calculated, and their respective localization accuracies were compared, as shown in Figure 14.
The comparison chart of experimental and simulated localization accuracy at different leak hole diameters is shown in Figure 14. It can be seen that as the leak hole diameter increased, the accuracy of both experimental and simulated positions increased. However, when the leak hole diameter reached 12 mm, further increasing the leak hole diameter resulted in a large leak hole, causing the pressure wave generated by the leak to pass through the two measurement points in a very short time. The calculation of the time difference was inaccurate, leading to inaccurate localization calculations and a decrease in accuracy. Overall, the experimental results were close to the simulation results, with the localization accuracy fluctuating by about 2%.
The change curve chart of pipeline leak localization accuracy at different leak points is shown in Figure 15. The shape of the experimental pipeline network and the positions of the five leak points are fixed. Leak points 1 and 5 have consistent path lengths to the two pressure measurement points, and the localization accuracy is basically the same. Leak point 2 is relatively far from measurement point 1, with a larger error than points 1 and 5. The localization accuracy of leak point 3 is the lowest; the leak signal at point 3 is transmitted to the two pressure measurement points and must pass through the tees twice, regardless of the transmission path, and the distance to the two measurement points is relatively long, resulting in lower localization accuracy.
In general, the experimental results are basically consistent with the simulation results and are within the allowable error range, making the method feasible. Additionally, this study is a simplification based on the actual pipeline network. The actual underground heating pipeline network does not have tees and often uses two nearby three-way connectors instead. The reflection of the pressure wave is completely different, which brings some interference to the detection of complex actual pipeline networks. However, this interference only increases some local resistance during the calculation process, and the transmission of the pressure wave is slightly changed, having a minimal impact on the overall pressure change trend, as well as the leak detection and localization accuracy.

5. Conclusions

This article utilized the open-source finite element OpenFOAM 5.0 analysis software to construct numerical simulation models for single-pipe and complex pipeline fluid flow. By integrating a novel time delay estimation algorithm with the cross-correlation method for pipeline condition analysis and detection, the potential leak locations of the leakage source were ultimately determined, leading to the following conclusions:
  • Based on the forward pressure transport model, an objective function was introduced to combine the adjoint theory with the sensitivity analysis method to derive the forward adjoint equation. The sensitivity function was derived for pressure, and the adjoint operator was introduced to derive the transient flow field backward adjoint equation. The results prove that the backward tracing method can be used for pipeline leak detection.
  • Within OpenFOAM 5.0, the construction of the complex pipeline fluid flow numerical simulation model and the solution of the adjoint equation were completed. The pressure change at the leak hole during the leak was monitored, and a cross-correlation method was used for correlation analysis. It was found that after the pipeline leak, the maximum value of the signal correlation coefficient shifted near zero. Through the correlation comparison diagram, it can be seen that the emergence of pipeline leakage leads to a decrease in the maximum correlation coefficient value.
  • The accuracy of the simulated leak location under different leak hole sizes and different inlet pressures was compared. The results showed that the accuracy of the location based on the backward tracing method was between 92%~96%, indicating that this method can be applied to complex pipeline leak detection and positioning.
This study has achieved certain results in leak detection within complex pipeline systems, but it also has several limitations. Firstly, the layout and number of sensors used in the research may not have been optimized, which could affect the accuracy and efficiency of leak detection. Additionally, the study may not have adequately considered pressure variations in the pipeline under different operating conditions, such as temperature fluctuations and water hammer effects, which could impact the accuracy of the leak detection algorithms. Furthermore, the research might rely too heavily on theoretical models and simulation data, lacking validation in real pipeline environments, which could limit its applicability in the real world. Lastly, the study may not have sufficiently addressed issues related to network security and data protection, which have become increasingly important as leak detection systems rely more on digital data.
In this paper, based on the complex pipeline leak detection and positioning model, issues such as blockages, deformation, and pollution that also cause leaks were not considered. It is necessary to define the corresponding solvers, set the corresponding parameters and boundary conditions, and convert the positioning method into OpenFOAM language as much as possible to directly obtain diagnostic results under different conditions through the simulation system. In addition, the experimental system has certain instabilities and limitations, and there is still a gap from the actual complex pipeline. It only completes the solution and verification of the adjoint equation on a macro level, and further experiments and simulations need to be strengthened in combination with actual working conditions.
In future research, there is a need to further optimize the layout and number of sensors to enhance the accuracy and efficiency of leak detection. This involves developing more advanced algorithms to determine the most cost-effective sensor distribution for various pipeline configurations. Moreover, it is essential to consider pressure variations in the pipeline under different operating conditions, such as temperature fluctuations and water hammer effects, as these factors can significantly influence the accuracy of leak detection algorithms. Therefore, future studies should expand the current models to incorporate multi-physics influences, providing a more comprehensive simulation of the actual behavior of pipeline systems.
Additionally, the integration and analysis of real-time data will be a key direction for future research. With the advancement of Internet of Things (IoT) technology, real-time monitoring of pipeline systems has become feasible, but effectively processing and analyzing those data to improve the timeliness and accuracy of leak detection remains a challenge. The application of machine learning and artificial intelligence technologies can greatly enhance the predictive capabilities and anomaly detection of leak detection systems, making this an important area for future exploration.
Network security and data protection are also critical issues that cannot be overlooked in future research. As leak detection systems increasingly depend on digital data, strengthening the network security and data protection measures to ensure the safety and integrity of the data becomes essential. Furthermore, conducting detailed cost-benefit analyses will be necessary to evaluate the economic feasibility of the proposed methods compared to traditional leak detection technologies.
Long-term performance and maintenance studies will also be part of future work to ensure the stability and reliability of leak detection systems. Additionally, assessing the environmental impact of leaks and the effectiveness of leak detection systems in mitigating these impacts will be important directions for future research. Through these comprehensive studies, we can further enhance the performance of leak detection technologies, reduce costs, and improve their practical value in real pipeline systems.

Author Contributions

Data curation, Y.Z. and S.X. (Shengwei Xin); investigation, J.L.; project administration, S.X. (Shuai Xue) and Z.L.; resources, L.C.; supervision, S.X. (Shuai Xue); visualization, W.H.; writing—original draft, J.W. and S.Z.; writing—review and editing, Y.Z. All authors have read and agreed to the published version of the manuscript.

Funding

This research received no external funding.

Data Availability Statement

All data used to support the findings of this study are available from the corresponding author upon request.

Conflicts of Interest

Authors Jie Wang, Yue Zhu, Songyu Zou, Shuai Xue, Le Chen, Weilong Hou, Shengwei Xin and Jinglan Li were employed by the company Chnenergy Hami Coal Power Co., Ltd. The remaining authors declare that the research was conducted in the absence of any commercial or financial relationships that could be construed as a potential conflict of interest.

References

  1. Tu, R.; Jiao, Y.; Qiu, R.; Liao, Q.; Xu, N.; Du, J.; Liang, Y. Energy saving and consumption reduction in the transportation of petroleum products: A pipeline pricing optimization perspective. Appl. Energy 2023, 342, 121135. [Google Scholar] [CrossRef]
  2. Zhang, Z.; Xiang, S.; Yuan, Z.; Tang, H. A coupling prediction model of annular pressure build-up for deepwater oil and gas wells during transient-state testing. Geoenergy Sci. Eng. 2023, 230, 212162. [Google Scholar] [CrossRef]
  3. Su, W.; Li, J.; Lu, Z.; Jin, X.; Zhang, J.; Liu, Z.; Zhang, X. Performance analysis and optimization of a solar assisted heat pump-driven vacuum membrane distillation system for liquid desiccant regeneration. Energy Convers. Manag. 2024, 301, 118047. [Google Scholar] [CrossRef]
  4. Su, W.; Han, Y.; Liu, Z.; Jin, X.; Liu, Z.; Yang, D.; Zhang, X. Absorption heat pumps for low-grade heat utilization: A comprehensive review on working pairs, classification, system advances and applications. Energy Convers. Manag. 2024, 315, 118760. [Google Scholar] [CrossRef]
  5. Su, W.; Han, Y.; Jin, X.; Liu, Z.; Zhang, X. Energy, economic, and environmental evaluation of a GAX-based cross-type absorption-resorption heat pump. Energy Convers. Manag. 2024, 300, 117952. [Google Scholar] [CrossRef]
  6. Chen, X.; Liu, H.; Sun, X.; Zan, B.; Liang, M. Chloride corrosion behavior on heating pipeline made by AISI 304 and 316 in reclaimed water. RSC Adv. 2021, 11, 38765–38773. [Google Scholar] [CrossRef]
  7. Adedeji, K.B.; Hamam, Y.; Abe, B.T.; Abu-Mahfouz, A.M. Pressure Management Strategies for Water Loss Reduction in Large-Scale Water Piping Networks: A Review. In Advances in Hydroinformatics; Gourbesville, P., Cunge, J., Caignaert, G., Eds.; Springer: Singapore, 2018; pp. 465–480. [Google Scholar] [CrossRef]
  8. Latif, J.; Shakir, M.Z.; Edwards, N.; Jaszczykowski, M.; Ramzan, N.; Edwards, V. Review on condition monitoring techniques for water pipelines. Measurement 2022, 193, 110895. [Google Scholar] [CrossRef]
  9. Kim, M.-S.; Lee, S.-K. Detection of leak acoustic signal in buried gas pipe based on the time–frequency analysis. J. Loss Prev. Process Ind. 2009, 22, 990–994. [Google Scholar] [CrossRef]
  10. Bimpas, M.; Amditis, A.; Uzunoglu, N. Detection of water leaks in supply pipes using continuous wave sensor operating at 2.45 GHz. J. Appl. Geophys. 2010, 70, 226–236. [Google Scholar] [CrossRef]
  11. Bolotina, I.; Borikov, V.; Ivanova, V.; Mertins, K.; Uchaikin, S. Application of phased antenna arrays for pipeline leak detection. J. Pet. Sci. Eng. 2018, 161, 497–505. [Google Scholar] [CrossRef]
  12. Folkman, S.; Rice, J.; Sorenson, A.; Braithwaite, N. Survey of water main failures in the United States and Canada. J. AWWA 2012, 104, 70–79. [Google Scholar] [CrossRef]
  13. Parks, J. Water Loss Management and Customer Care. J. AWWA 2004, 96, 66–68. [Google Scholar] [CrossRef]
  14. Lambert, A.O. International Report: Water losses management and techniques. Water Supply 2002, 2, 1–20. [Google Scholar] [CrossRef]
  15. Nagaosa, R.S. A new numerical formulation of gas leakage and spread into a residential space in terms of hazard analysis. J. Hazard. Mater. 2014, 271, 266–274. [Google Scholar] [CrossRef]
  16. Sekhavati, J. Computational methods for pipeline leakage detection and localization: A review and comparative study. J. Loss Prev. Process Ind. 2022, 77, 104771. [Google Scholar] [CrossRef]
  17. Rajasekaran, U.; Kothandaraman, M. A Survey and Study of Signal and Data-Driven Approaches for Pipeline Leak Detection and Localization. J. Pipeline Syst. Eng. Pract. 2024, 15, 3124001. [Google Scholar] [CrossRef]
  18. Korlapati, N.V.S. Review and analysis of pipeline leak detection methods. J. Pipeline Sci. Eng. 2022, 2, 100074. [Google Scholar] [CrossRef]
  19. Datta, S. A review on different pipeline fault detection methods. J. Loss Prev. Process Ind. 2016, 41, 97–106. [Google Scholar] [CrossRef]
  20. Siebert, H.; Isermann, R. Pipeline leak detection and location by on-line-correlation with a process computer. Automatic 1977, 25, 69–74. [Google Scholar]
  21. Isermann, R. Proeess fault detection based on modeling and estimation methods. Automatic 1984, 20, 38–40. [Google Scholar] [CrossRef]
  22. Billmann, L.; Isermann, R. Leak Detection Methods for Pipelines. IFAC Proc. Vol. 1984, 17, 1813–1818. [Google Scholar] [CrossRef]
  23. Imoto, T.; Nakai, Y. Discrimination of peripheral and central vestibular disorders by means of a quantitative statistical method. J. Biomed. Eng. 1984, 6, 40–44. [Google Scholar] [CrossRef]
  24. Digernes, T. Real-Time Failure-Detection and Identification Applied to Supervision of Oil Transport in Pipelines. MIC 1980, 1, 39–49. [Google Scholar] [CrossRef]
  25. Benkherouf, A.; Allidina, A.Y. Leak detection and location in gas pipelines. IEE Proc. D Control Theory Appl. 1988, 135, 142. [Google Scholar] [CrossRef]
  26. Zhang, X. Statistical leak detection in gas and liquid pipelines. Pipes Pipelines Int. 1993, 38, 26–29. [Google Scholar]
  27. Zhang, X. Statistieal methods for detection and localization of leak in pipelines. Offshore Mech. Arctie Eng. Conf. 1992, 38, 85–92. [Google Scholar]
  28. Liou, J.C.P. Pipeline Integrity Monitoring Using System Impulse Response. In Volume 2: Design, Construction, and Operation Innovations; Compression and Pump Technology; SCADA, Automation, and Measurement; System Simulation; Geotechnical and Environmental; American Society of Mechanical Engineers: Calgary, AB, Canada, 1996; pp. 1137–1142. [Google Scholar] [CrossRef]
  29. Ferrante, M.; Brunone, B.; Rossetti, A.G. Harmonic analysis of pressure signal during transients for leak detection in pressurized pipes. In Proceedings of the 4th International Conference on Water Pipeline Systems, York, UK, 28–30 March 2001. [Google Scholar]
  30. Vítkovský, J.P.; Simpson, A.R.; Lambert, M.F. Leak Detection and Calibration Using Transients and Genetic Algorithms. J. Water Resour. Plann. Manag. 2000, 126, 262–265. [Google Scholar] [CrossRef]
  31. Verde, C. Leakage location in pipelines by minimal order nonlinear observer. In Proceedings of the 2001 American Control Conference. (Cat. No.01CH37148), Arlington, VA, USA, 25–27 June 2001; IEEE: New York, NY, USA, 2001; Volume 2, pp. 1733–1738. [Google Scholar] [CrossRef]
  32. Mpesha, W.; Hanif Chaudhry, M.; Gassman, S.L. Leak detection in pipes by frequency response method using a step excitation. J. Hydraul. Res. 2002, 40, 55–62. [Google Scholar] [CrossRef]
  33. Hemerly Costa, A.L.; Miranda De Souza, J.N.; De Medeiros, J.L. Detection, Localization and Quantification of Leaks in Pipeline Networks Using a Parameter Estimation Approach. In Proceedings of the 4th International Pipeline Conference, Parts A and B, Calgary, AB, Canada, 30 September–3 October 2002; ASMEDC: New York, NY, USA, 2002; pp. 1029–1035. [Google Scholar] [CrossRef]
  34. Ferrante, M.; Brunone, B. Pipe system diagnosis and leak detection by unsteady-state tests. 2. Wavelet analysis. Adv. Water Resour. 2003, 26, 107–116. [Google Scholar] [CrossRef]
  35. Covas, D.; Ramos, H.; Graham, N.; Maksimovic, C. Application of hydraulic transients for leak detection in water supply systems. Water Supply 2004, 4, 365–374. [Google Scholar] [CrossRef]
  36. Reddy, H.P.; Narasimhan, S.; Bhallamudi, S.M. Simulation and State Estimation of Transient Flow in Gas Pipeline Networks Using a Transfer Function Model. Ind. Eng. Chem. Res. 2006, 45, 3853–3863. [Google Scholar] [CrossRef]
  37. Taghvaei, M.; Beck, S.B.M.; Boxall, J.B. Leak and feature detection in a water distribution network. In Proceedings of the 10th BHR Group International Conference in the Pressure Surges Series, Edinburgh, UK, 14–16 May 2008; pp. 125–135. [Google Scholar]
  38. Ferraz, I.N.; Garcia, A.C.B.; Bernardini, F.C. Artificial Neural Networks Ensemble Used for Pipeline Leak Detection Systems. In Proceedings of the 2008 7th International Pipeline Conference, Calgary, AB, Canada, 29 September–3 October 2008; ASMEDC: New York, NY, USA, 2008; Volume 1, pp. 739–747. [Google Scholar] [CrossRef]
  39. Ahadi, M.; Bakhtiar, M.S. Leak detection in water-filled plastic pipes through the application of tuned wavelet transforms to Acoustic Emission signals. Appl. Acoust. 2010, 71, 634–639. [Google Scholar] [CrossRef]
  40. Ayala-Cabrera, D.; Herrera, M.; Montalvo, I.; Pérez-García, R. Towards the visualization of water supply system components with GPR images. Math. Comput. Model. 2011, 54, 1818–1822. [Google Scholar] [CrossRef]
  41. Wachla, D.; Przystalka, P.; Moczulski, W. A Method of Leakage Location in Water Distribution Networks using Artificial Neuro-Fuzzy System. IFAC-Pap. 2015, 48, 1216–1223. [Google Scholar] [CrossRef]
  42. Moser, G.; German Paal, S.; Smith, I.F.C. Performance comparison of reduced models for leak detection in water distribution networks. Adv. Eng. Inform. 2015, 29, 714–726. [Google Scholar] [CrossRef]
  43. Bermúdez, J.-R.; López-Estrada, F.-R.; Besançon, G.; Valencia-Palomo, G.; Torres, L.; Hernández, H.-R. Modeling and Simulation of a Hydraulic Network for Leak Diagnosis. MCA 2018, 23, 70. [Google Scholar] [CrossRef]
  44. Yang, X.; Fang, H.; Yu, X.; Li, S.; Liu, H. Study on the mechanism of vibration signal generation in water supply pipeline leaks. Measurement 2024, 229, 114415. [Google Scholar] [CrossRef]
  45. Fu, H.; Yang, L.; Liang, H.; Wang, S.; Ling, K. Diagnosis of the single leakage in the fluid pipeline through experimental study and CFD simulation. J. Pet. Sci. Eng. 2020, 193, 107437. [Google Scholar] [CrossRef]
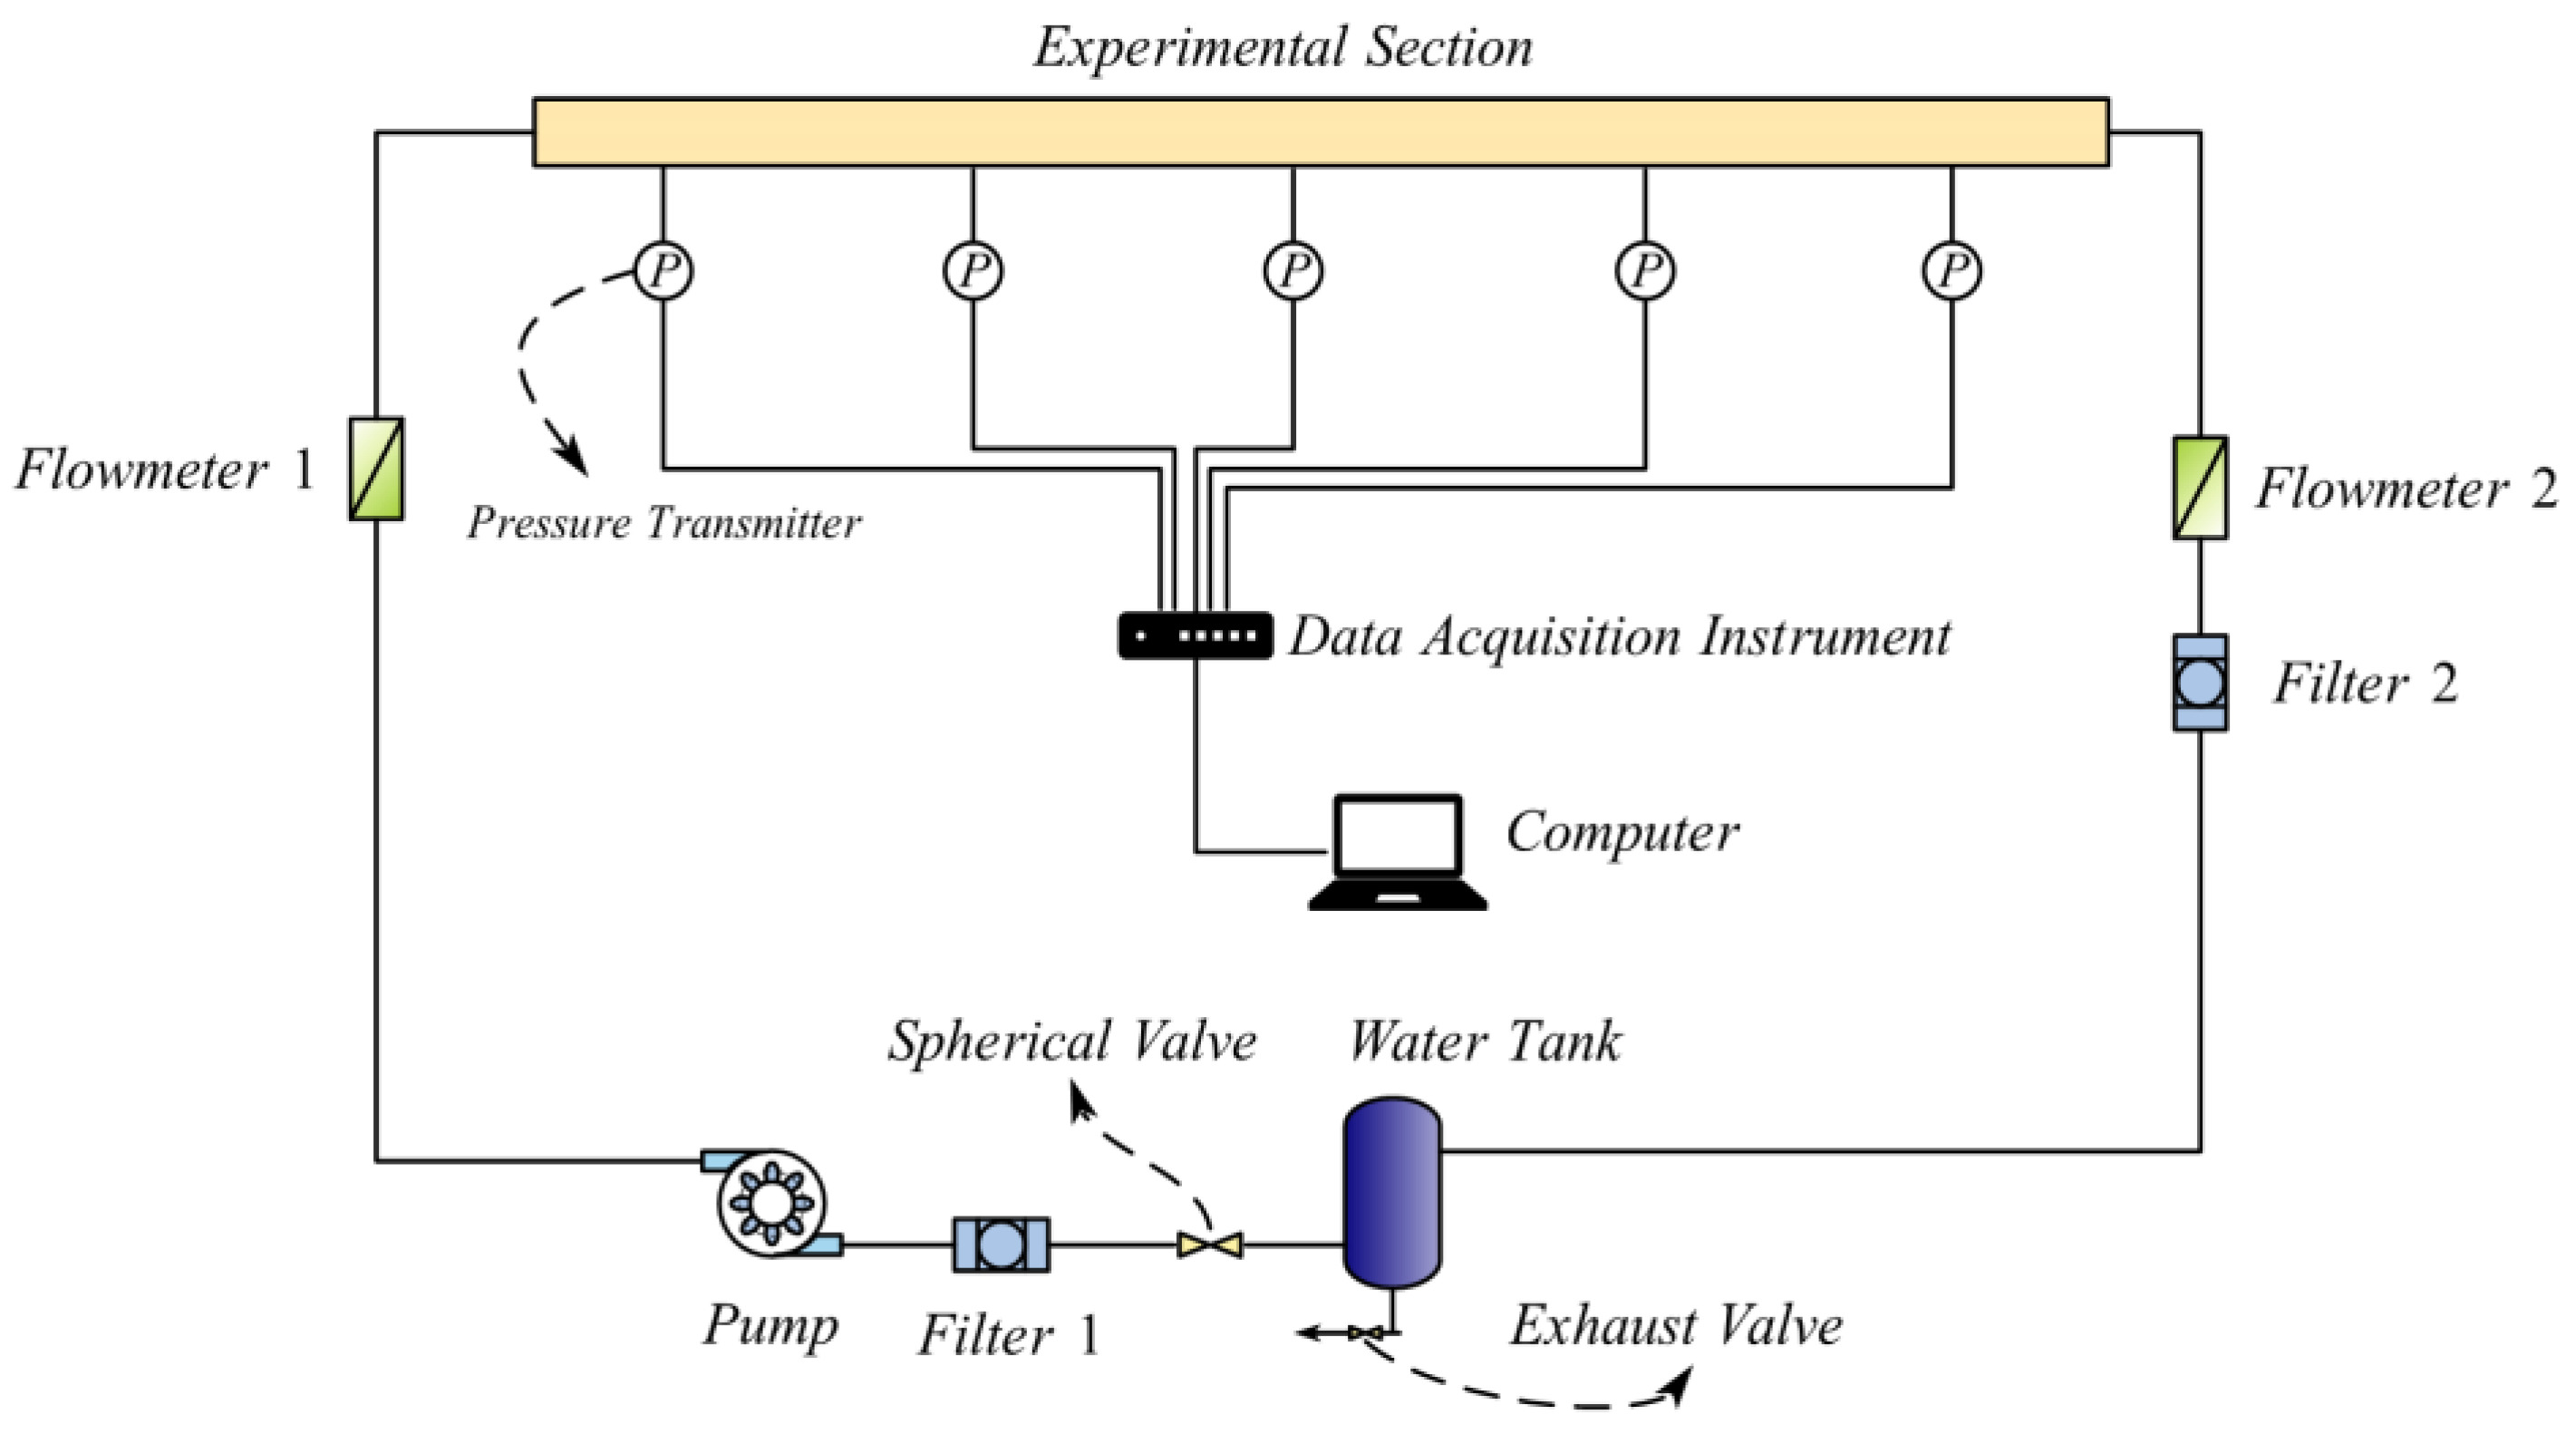
Figure 1. Experimental system.
Processes 12 02710 g001
Figure 2. Distribution of pressure measurement points and leak points on the experimental rig.
Processes 12 02710 g002
Figure 3. Pipeline network Front view of the experimental bench. (a) Front view of the experimental bench; (b) Side view of the experimental bench.
Processes 12 02710 g003
Figure 4. 4 × 4 and 2 × 2 Mesh Division.
Processes 12 02710 g004
Figure 5. Principle diagram of the novel time delay estimation method.
Processes 12 02710 g005
Figure 6. Schematic layout diagram of the pipeline network.
Processes 12 02710 g006
Figure 7. Pressure and correlation comparison chart at leak point 1 before and after the leak (a) P varies with time; (b) Rs1s2 (τ) varies with time.
Processes 12 02710 g007
Figure 8. Pressure and correlation comparison chart at leak point 2 before and after the leak (a) P varies with time; (b) Rs1s2 (τ) varies with time.
Processes 12 02710 g008
Figure 9. Pressure and correlation comparison chart at leak point 3 before and after the leak (a) P varies with time; (b) Rs1s2 (τ) varies with time.
Processes 12 02710 g009
Figure 10. Leak detection and localization flowchart.
Processes 12 02710 g010
Figure 11. Schematic diagram of potential leak locations.
Processes 12 02710 g011
Figure 12. Comparison of computational speeds of different methods.
Processes 12 02710 g012
Figure 13. Pressure variation chart. (a) experimental data; (b) simulation data.
Processes 12 02710 g013
Figure 14. Comparison of experimental localization accuracy at different hole diameters.
Processes 12 02710 g014
Figure 15. Comparison of pipeline localization accuracy at different leak points.
Processes 12 02710 g015
Table 1. Summary of pipeline leakage detection methods.
ResearchersMethods for Pipe Leak DetectionCharacteristics of Methods
Isermann [21]Fault-Sensitive Filtering MethodLinearizing the pipeline model is quite challenging.
Digemes [24]Fault Model Detection MethodThe experimental results are consistent with the model outcomes.
Benkberouf [25]Kalman Filtering MethodThey cannot fully correspond with the actual conditions.
Zhang [26]Dynamic Mass Balance MethodCombining pattern recognition theory with the method of least squares.
Ferrante [34]Wavelet Transform MethodAddressing the issue of information leakage in the transformation from time domain to frequency domain.
Table 2. Mesh independence check.
Mesh Count2,120,0004,420,0009,060,000
Pmax (kPa)26.1726.3326.35
Pmin (kPa)21.0921.1621.17
P (kPa)5.085.175.18
Table 3. Calculation results of E at different nodes.
i…N23467891012
Ei1.92390.00580.01060.35230.21010.24390.06180.10400.2357
Table 4. The impact of leak hole size on localization accuracy.
Leak Hole Size
(mm)
Leak Volume
(%)
Actual Distance to M2
(m)
Calculated Distance to M2
(m)
Error
(%)
41.51.2641.3395.95
62.81.3385.82
83.21.3335.43
104.11.3274.96
125.71.3244.78
146.51.3234.7
Disclaimer/Publisher’s Note: The statements, opinions and data contained in all publications are solely those of the individual author(s) and contributor(s) and not of MDPI and/or the editor(s). MDPI and/or the editor(s) disclaim responsibility for any injury to people or property resulting from any ideas, methods, instructions or products referred to in the content.