Article

Numerical Simulation Study on the Diffusion Characteristics of High-Pressure Hydrogen Gas Leakage in Confined Spaces

1
Novel Energy Development Center of Shengli Petroleum Administration, SINOPEC, Dongying 257000, China
2
College of New Energy, China University of Petroleum (East China), Qingdao 266580, China
*
Author to whom correspondence should be addressed.
Processes 2024, 12(12), 2711; https://doi.org/10.3390/pr12122711
Submission received: 23 October 2024 / Revised: 24 November 2024 / Accepted: 27 November 2024 / Published: 1 December 2024
(This article belongs to the Section Chemical Processes and Systems)

Abstract

:
Hydrogen, as one of the most promising renewable clean energy sources, holds significant strategic importance and vast application potential. However, as a high-energy combustible gas, hydrogen poses risks of fire and explosion in the event of a leakage. Hydrogen production plants typically feature large spatial volumes and complex obstacles, which can significantly influence the diffusion pathways and localized accumulation of hydrogen during a short-term, high-volume release, further increasing the risk of accidents. Implementing effective hydrogen leakage monitoring measures can mitigate these risks, ensuring the safety of personnel and the environment to the greatest extent possible. Therefore, this paper uses CFD methods to simulate the hydrogen leakage process in a hydrogen production plant. The study examines the molar fraction distribution characteristics of hydrogen in the presence of obstacles by varying the ventilation speed of the plant and the directions of leakage. The main conclusions are as follows: enhancing ventilation can effectively prevent the rapid increase in hydrogen concentration, with higher ventilation speeds yielding better suppression. After a hydrogen leak in a confined space, hydrogen tends to diffuse along the walls and accumulate in corner areas, indicating that hydrogen monitoring equipment should be placed in corner locations.

1. Introduction

In recent years, environmental pollution caused by the extensive use of fossil fuels has become increasingly severe. As a result, various clean and renewable energy sources, such as solar energy, wind energy, hydrogen energy, and biomass energy, have been developed to address environmental challenges [1,2]. Hydrogen, as a clean energy source, offers advantages such as zero emissions and high energy density. Promoting the development of hydrogen-related industries not only helps to solve global climate change and environmental pollution issues but also reduces reliance on fossil fuels [3,4]. However, hydrogen is a highly flammable gas, and it forms explosive mixtures in air over a wide concentration range. An explosion can occur when hydrogen concentrations reache between 4% and 75%, with an ignition energy as low as 0.018 mJ [5,6]. If hydrogen leaks into the air and encounters an ignition source, it can lead to severe explosions, posing significant threats to personnel and facilities. Therefore, the risks associated with hydrogen leakage must be taken seriously, and effective preventive and response measures should be implemented [7].
Hydrogen can escape through extremely small cracks, micropores, or even material defects, resulting in a significantly higher leakage risk compared to other gasses. Moreover, many common materials can experience hydrogen permeation after prolonged exposure [8]. In confined spaces, hydrogen leakage is more likely to result in localized high-concentration areas within a short period due to the enclosed environment, which could lead to catastrophic consequences [9,10]. Many researchers have conducted studies on the hydrogen leakage process in confined spaces; for instance, Yang et al. [11] conducted experimental research on hydrogen leakage in a customized chamber with non-ventilated environment, where hydrogen leaked from a 0.5 mm circular orifice under pressures ranging from 0.8 to 2.0 MPa. The experimental results showed that hydrogen formed vortex motion at the room corners and side walls. After 240 s, hydrogen concentration became uniformly distributed on the same horizontal plane. Then, Xu et al. [12] conducted experimental research and numerical simulations on the leakage and diffusion evolution of hydrogen in a large aspect ratio rectangular confined space. They obtained the leakage and diffusion characteristics of hydrogen under different leakage rates and directions. Based on their findings, they divided the hydrogen leakage and diffusion process into three stages: the buoyancy-dominated stage, the horizontal diffusion stage, and the vertical filling stage. However, the leakage direction and ventilation conditions can alter the diffusion path of hydrogen, potentially causing the molar concentration of hydrogen in localized regions to reach the lower explosive limit. For instance, Hajji et al. [13] used ANSYS Fluent to simulate the hydrogen diffusion process in residential garages. Their research focused on examining how building geometry, layout, and the characteristics of ventilation openings, including their shape and size, affect the formation of combustible hydrogen–air mixtures under natural ventilation conditions. Yu et al. [14] simulated the hydrogen leakage process of a hydrogen fuel cell vehicle with a storage pressure of 70 MPa, considering the influence of environmental wind, under different opening conditions of the sunroof, doors, and windshield. The simulation indicated that ambient wind could lower the hydrogen molar fraction at the vehicle’s front to under 4%, whereas the rear still stayed within the flammable hazard zone. Then, Gao et al. [15] used ANSYS Fluent to simulate hydrogen leakage during the transport of hydrogen fuel cell vehicles within a sealed ship’s compartment. They obtained the variation in hydrogen concentration for different leakage locations and under different ventilation conditions. Based on the simulation results, they identified the optimal locations for hydrogen sensors. The above studies indicate that when hydrogen leakage occurs, ventilation helps dissipate the leaked hydrogen and reduces its concentration.
Obstacles can alter the propagation path and speed of hydrogen leakage, affecting the diffusion range and concentration distribution of the leaked gas. For example, Hou et al. [16] studied the impact of obstacle position on hydrogen dispersion behavior during hydrogen leakage from a hydrogen fuel cell bus under non-ventilated, natural ventilation, and mechanical ventilation conditions. The results indicated that, as the distance between the obstacle and the leakage point decreased, the impact of the obstacle on hydrogen dispersion behavior increased. Furthermore, the hydrogen concentration on the side without obstacles was found to be two to three times higher than on the side with obstacles, implying that obstacles may promote the escape of hydrogen. Qian et al. [17] simulated the hydrogen leakage process at a hydrogen refueling station and found that as the distance between the leakage aperture and the obstacle decreases, the profile of the hydrogen cloud becomes increasingly difficult to predict, with hydrogen accumulating more readily near the obstacle.
In summary, in confined spaces, ventilation can promote the mixing of leaked hydrogen with ambient air, thereby reducing hydrogen concentration and explosion risks. Ventilation can also control the hydrogen flow, altering its diffusion path and rate, and thereby controlling the extent of the leakage’s impact. Additionally, obstacles can cause hydrogen to accumulate in certain areas, affecting the rate and characteristics of hydrogen diffusion, thus increasing the explosion risk. Therefore, in hydrogen production and storage processes within confined spaces, it is essential to consider the effects of ventilation and obstacles on hydrogen leakage diffusion and take appropriate safety and preventive measures. This paper will investigate the hydrogen leakage process in a small hydrogen production plant, obtain the molar fraction distribution of hydrogen under different ventilation conditions and leakage directions in the presence of obstacles, and propose corresponding monitoring measures.

2. Numerical Calculation Model

2.1. Model Assumption

The following assumptions are made in this study:
(1)
The hydrogen–air mixture can be treated as an ideal gas and follows the ideal gas law;
(2)
The pressure remains constant during the hydrogen leakage process;
(3)
Hydrogen does not undergo any chemical reactions with other gasses in the environment during the leakage process, and the ambient temperature is maintained at 298.15 K with no heat exchange with the surroundings;
(4)
The hydrogen exhibits turbulent flow during the leakage process.

2.2. Governing Equation

During the hydrogen leakage process, the gas exhibits continuous flow and adheres to the laws of conservation of mass, momentum, energy, and species.
(1)
Continuity Equation
ρ t + ( ρ u ) x + ( ρ v ) y + ( ρ w ) z = 0
where ρ represents the density, t is time, and u, v, and w are the components of the velocity vector in the x, y, and z directions, respectively.
(2)
Momentum equation
( ρ u ) t + · ( u u ) = p x + τ x x x + τ y x y + τ z x z + F x
( ρ v ) t + · ( v u ) = p y + τ x y x + τ y y y + τ z y z + F y
( ρ w ) t + · ( w u ) = p z + τ x z x + τ y z y + τ z z z + F z
where p represents the pressure, τ is the viscous stress, F is the body force per unit volume, and u is the velocity vector.
(3)
Energy equation
( ρ T ) t + · ( ρ u T ) = x ( k c p T x ) + y ( k c p T y ) + z ( k c p T z ) + S T
where cp represents the specific heat capacity at a constant pressure, T is the temperature, k is the thermal conductivity, and ST is the viscous dissipation.
(4)
Compositional equation
( ρ ω i ) t + · ( ρ ω i u ) = x ( J i ( ρ ω i ) x ) + y ( J i ( ρ ω i ) y ) + z ( J i ( ρ ω i ) z )
where ωi represents the volume density of component i, and Ji is the diffusion flux of component i.

2.3. Turbulence Model

The standard k-ε model assumes that the flow is fully turbulent, neglecting the effects of molecular viscosity. The standard k-ε model in ANSYS Fluent is based on semi-empirical formulas, and it requires the solving of two separate transport equations for the turbulent kinetic energy (k) and the turbulent dissipation rate (ε).
( ρ k ) t + ( ρ k u i ) x i = x j μ + μ t σ k k x j + G k + G b ρ ε Y M + S k
( ρ ε ) t + ( ρ ε u i ) x i = x j μ + μ t σ ε ε x j + C 1 ε ε k ( G k + C 3 ε G b ) C 2 ε ρ ε 2 k + S ε
The turbulent viscosity μt formula is
μ t = ρ C μ k 2 ε
where ui represents the time-averaged velocity, Gk denotes the production of turbulent kinetic energy due to mean velocity gradients, and Gb represents the production of turbulent kinetic energy due to buoyancy. YM accounts for the contribution of fluctuating dilatation in compressible turbulence to the overall dissipation rate. Sk and Sε are user-defined source terms. The constants C1ε, C2ε, and Cμ, have values of 1.44, 1.92, and 0.09, respectively. The turbulent Prandtl numbers σk and σε are 1.0 and 1.3, respectively. Additionally, when the direction of hydrogen flow is parallel to gravity, C3ε is set to 1. When the flow direction is perpendicular to gravity, C3ε is set to 0.

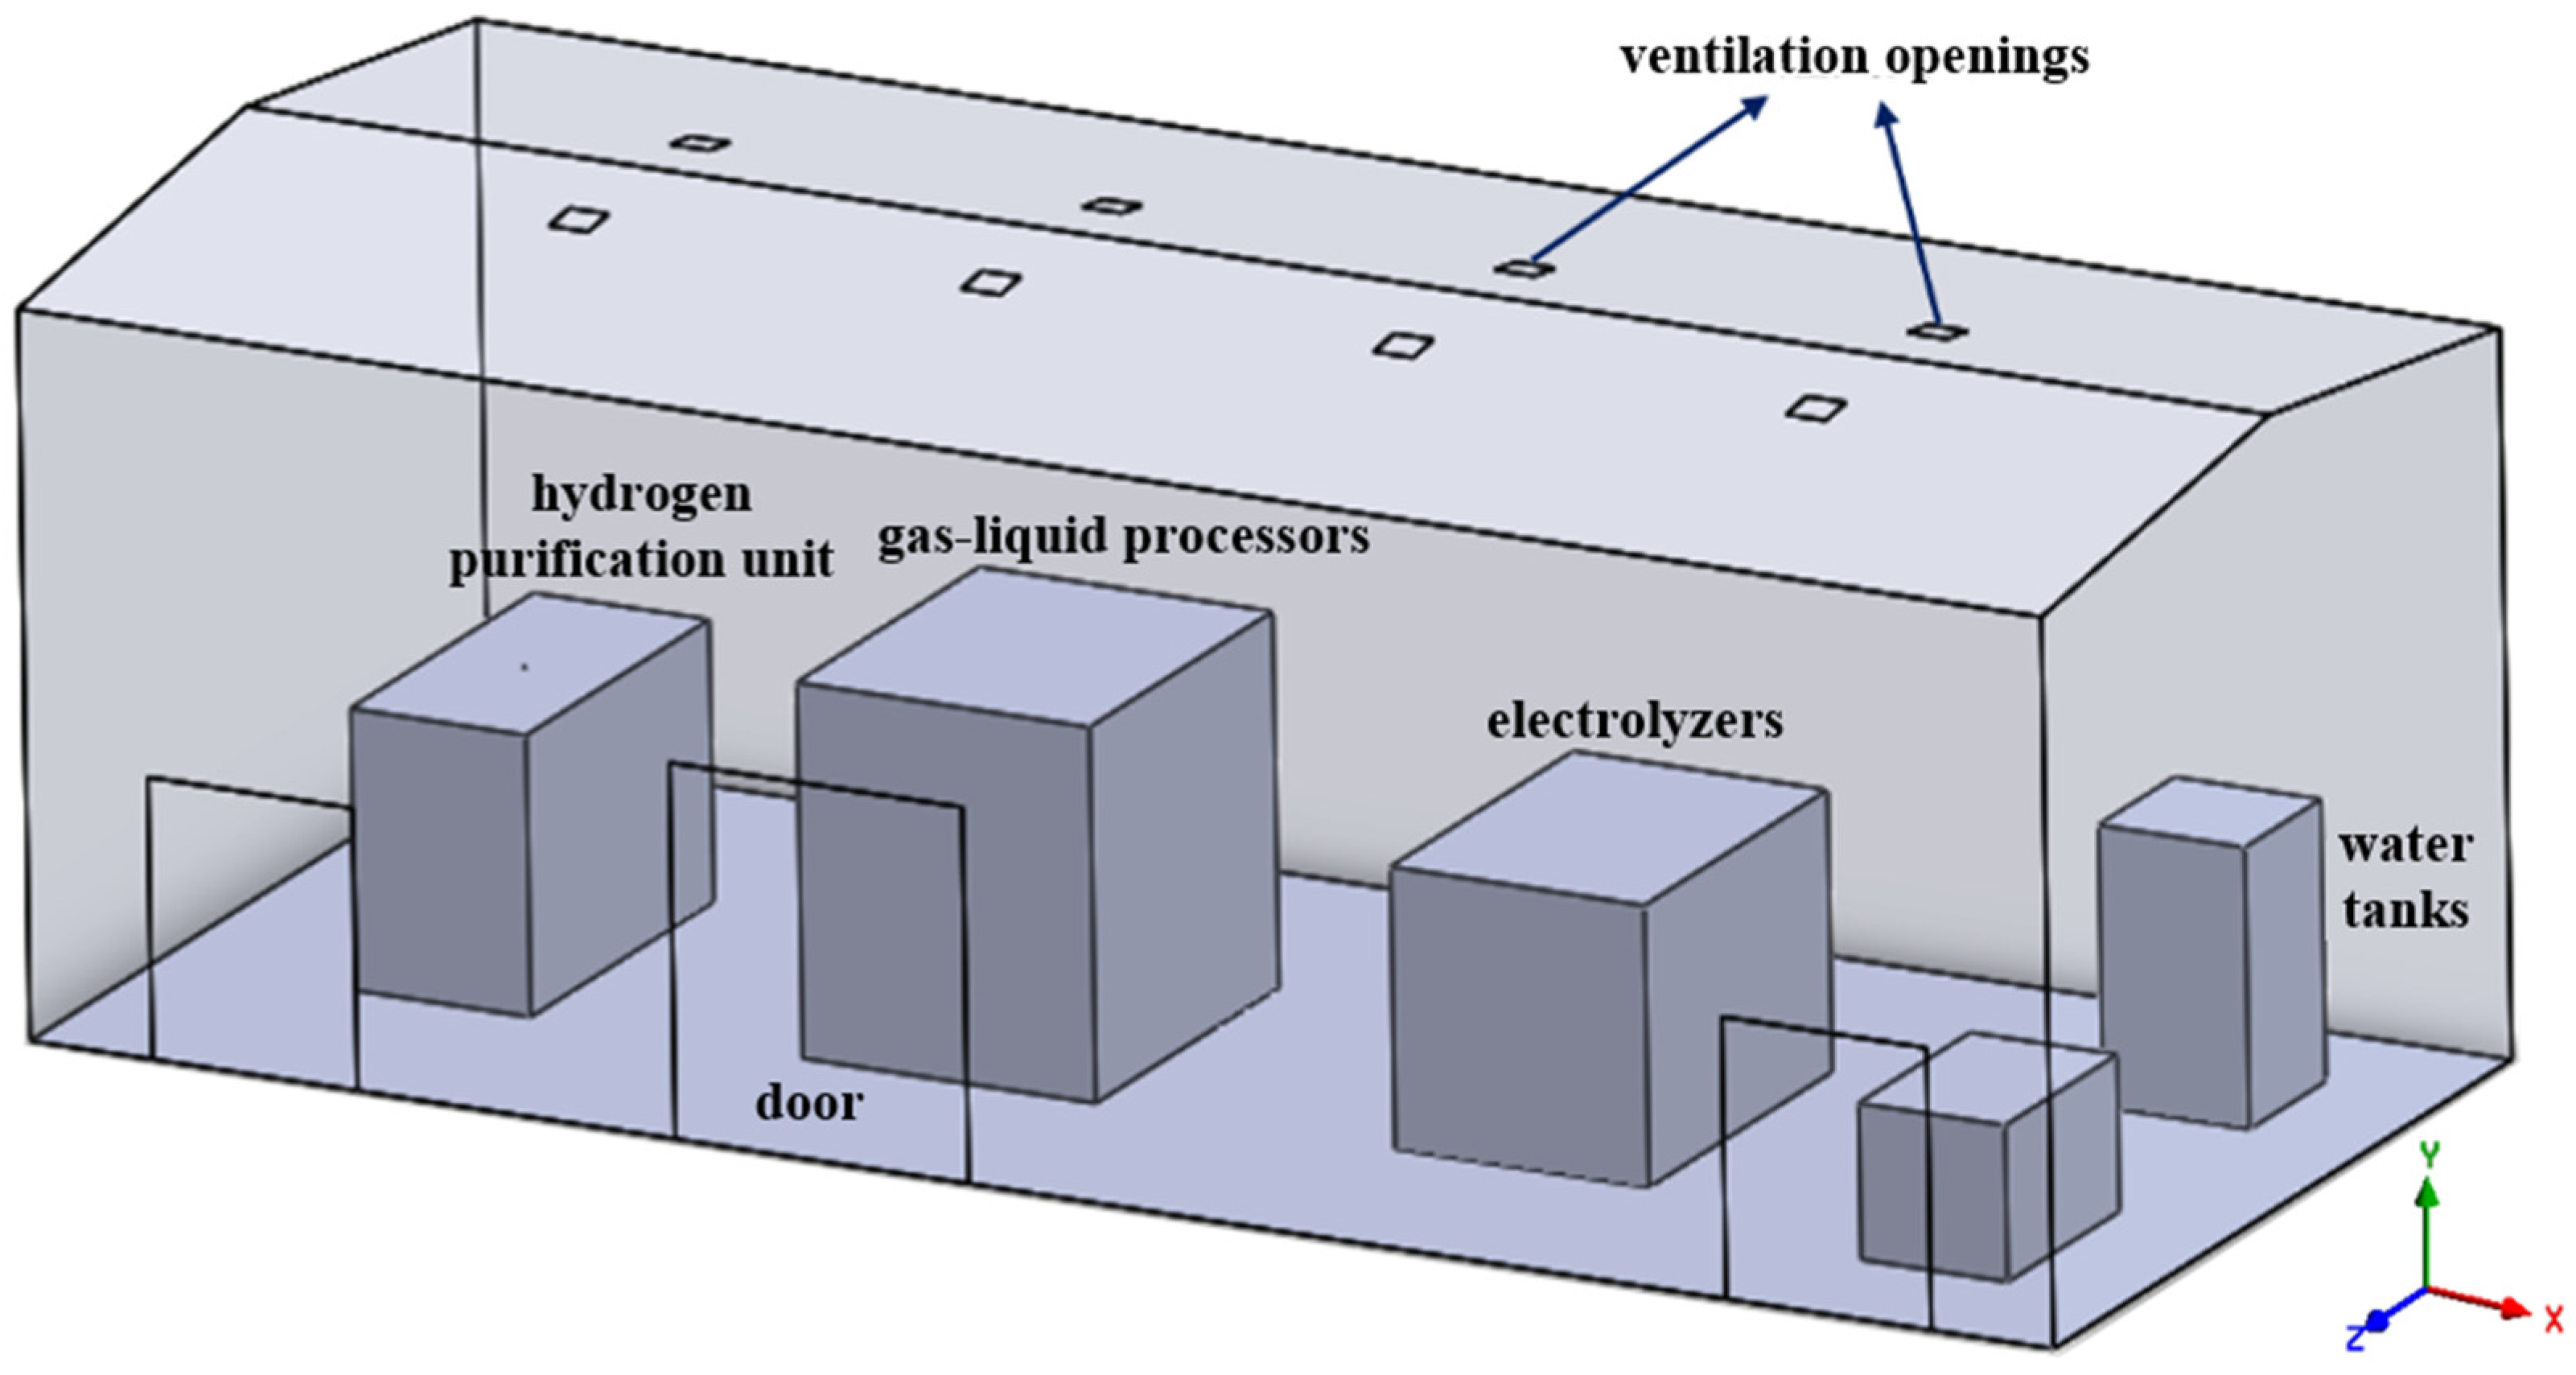
2.4. Geometric Model

The geometric model for the simulation is shown in Figure 1. The hydrogen production plant is 20.7 m × 9.0 m × 7.0 m, with a roof tilt angle of 7°. Ventilation openings are located at the top of the plant, consisting of a total of eight vents, each measuring 0.4 m × 0.4 m. The front wall of the plant features two doors: one measures 2.1 m × 2.7 m, while the other measures 3.0 m × 3.6 m. The hydrogen leakage points are positioned on the top surface, back surface, and left side surface of the hydrogen purification unit. Hydrogen enters the plant interior through a 20 mm circular leak port at a pressure of 2.1 MPa to simulate the hydrogen leakage process. Additionally, Table 1 lists the coordinates of the monitoring points arranged on the top, front, back, and right sides of the plant, with their specific distribution illustrated in Figure 2.

2.5. Simulation Setup

The hydrogen leakage process was simulated using the CFD software ANSYS Fluent (version 2022 R1, ANSYS, Inc., Canonsburg, PA, USA). The turbulence model selected was the standard k-ε model, with buoyancy effects enabled and the standard wall functions applied. The gas mixture was modeled using the species transport model and assumed to behave as an ideal gas. The hydrogen leakage point was modeled with a pressure inlet boundary condition, where the inlet pressure was set to 2.1 MPa and the temperature to 298.15 K. The ventilation outlets were assigned pressure outlet boundary conditions, with a gauge pressure of 0. The factory doors were set as velocity inlets, with a temperature of 298.15 K to simulate natural ventilation. For the pressure–velocity coupling, the SIMPLE algorithm was employed. The time step was set to 0.2 s, and the total simulation time was 200 s.

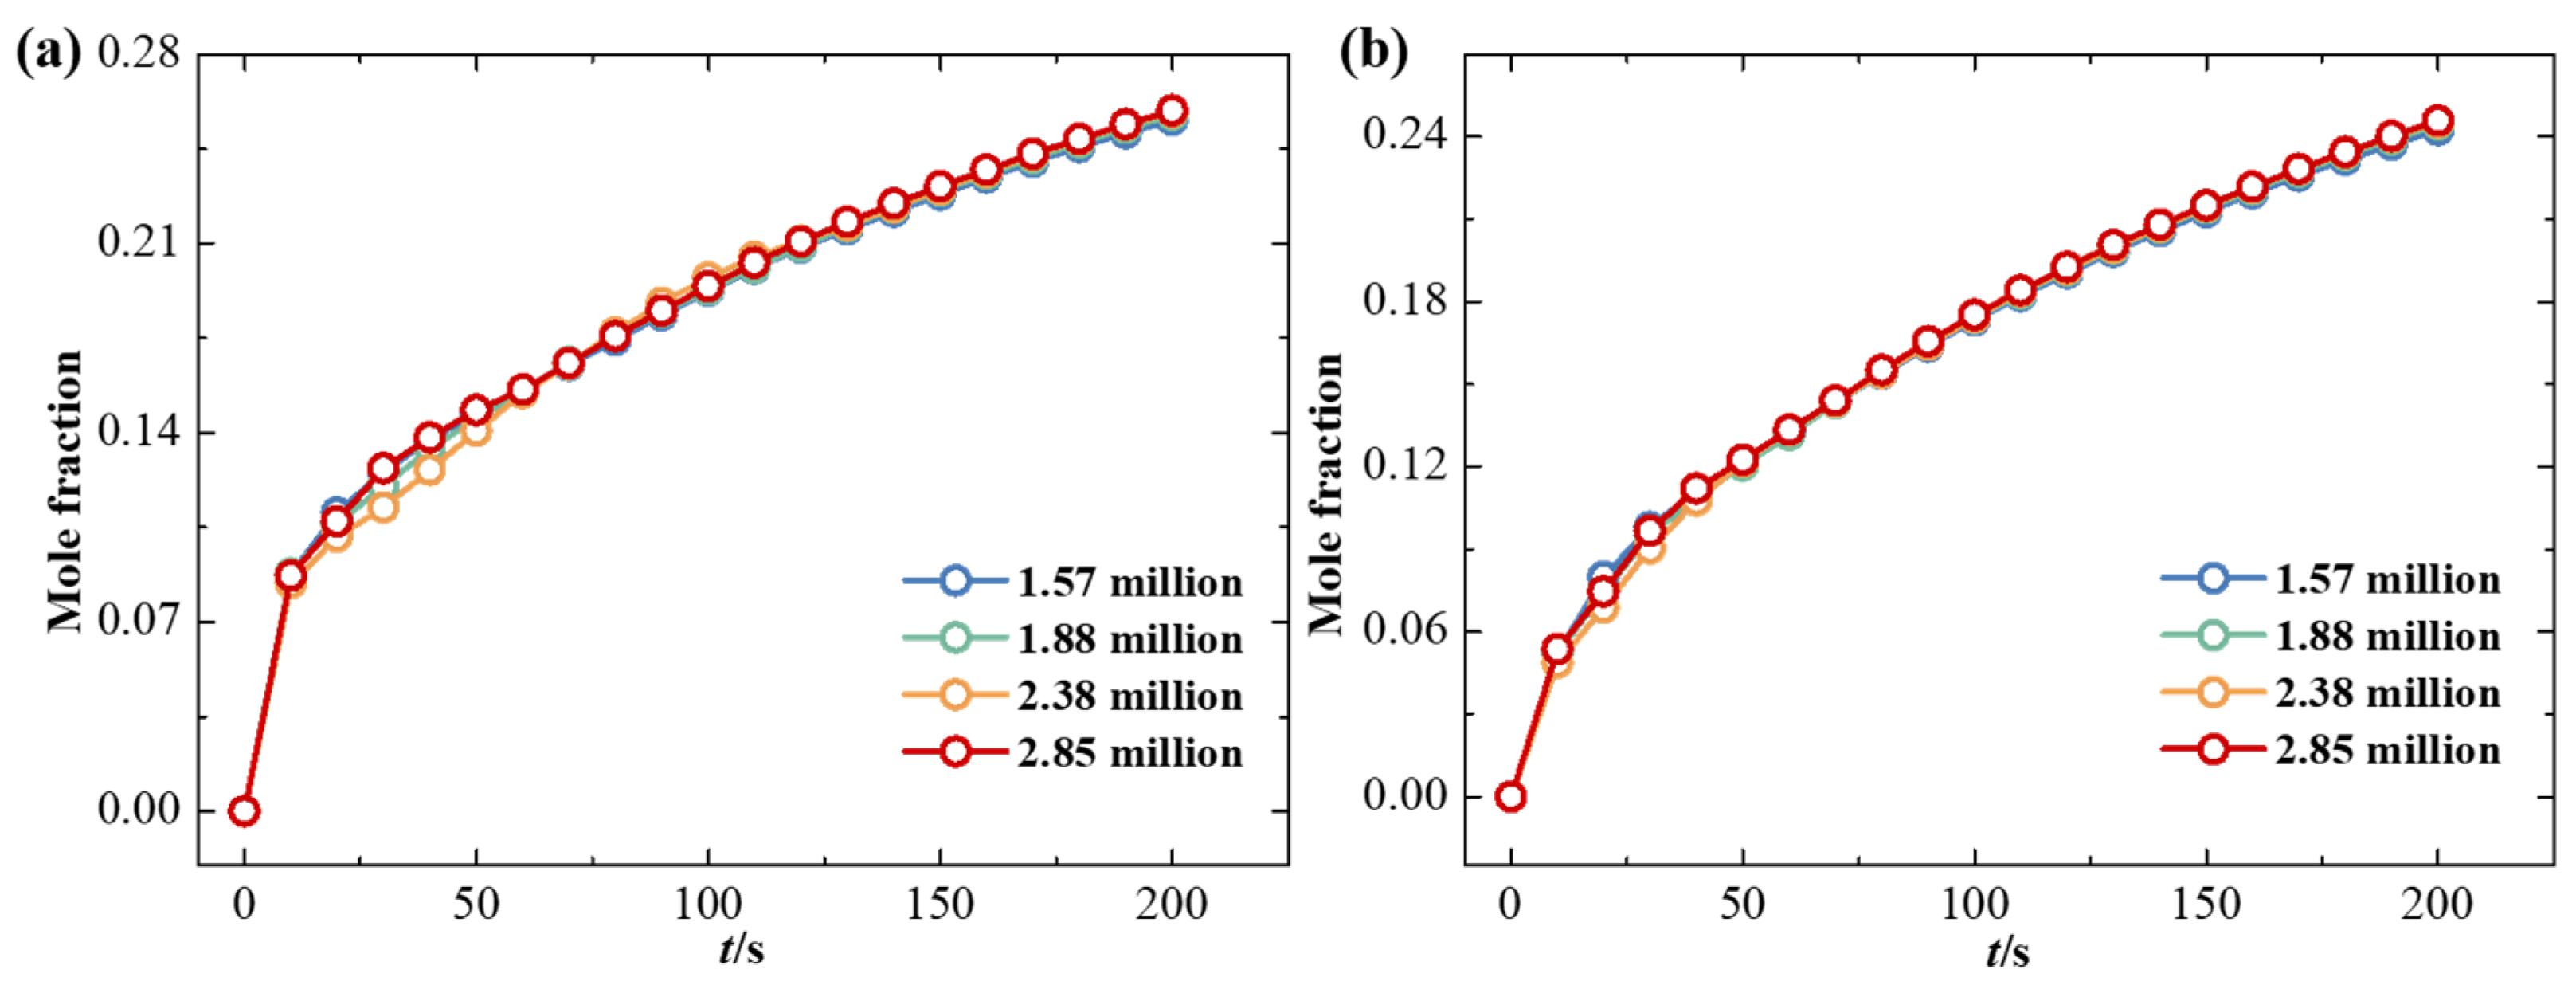
2.6. Grid Division and Independence Assessment

A hexahedral mesh was used, with local mesh refinement applied around the hydrogen leakage points and ventilation outlets. A total of four mesh configurations were generated, consisting of 1.57 million, 1.88 million, 2.38 million, and 2.85 million cells, respectively, for grid independence testing. The hydrogen concentration variation curves at the monitoring points for the four mesh configurations are shown in Figure 3. It can be observed that the simulation results for all four mesh configurations are essentially consistent. Therefore, to balance computational accuracy and efficiency, the mesh configuration with 1.88 million cells was selected for the final calculations. This section explains the mesh generation and grid independence study conducted for the simulation.

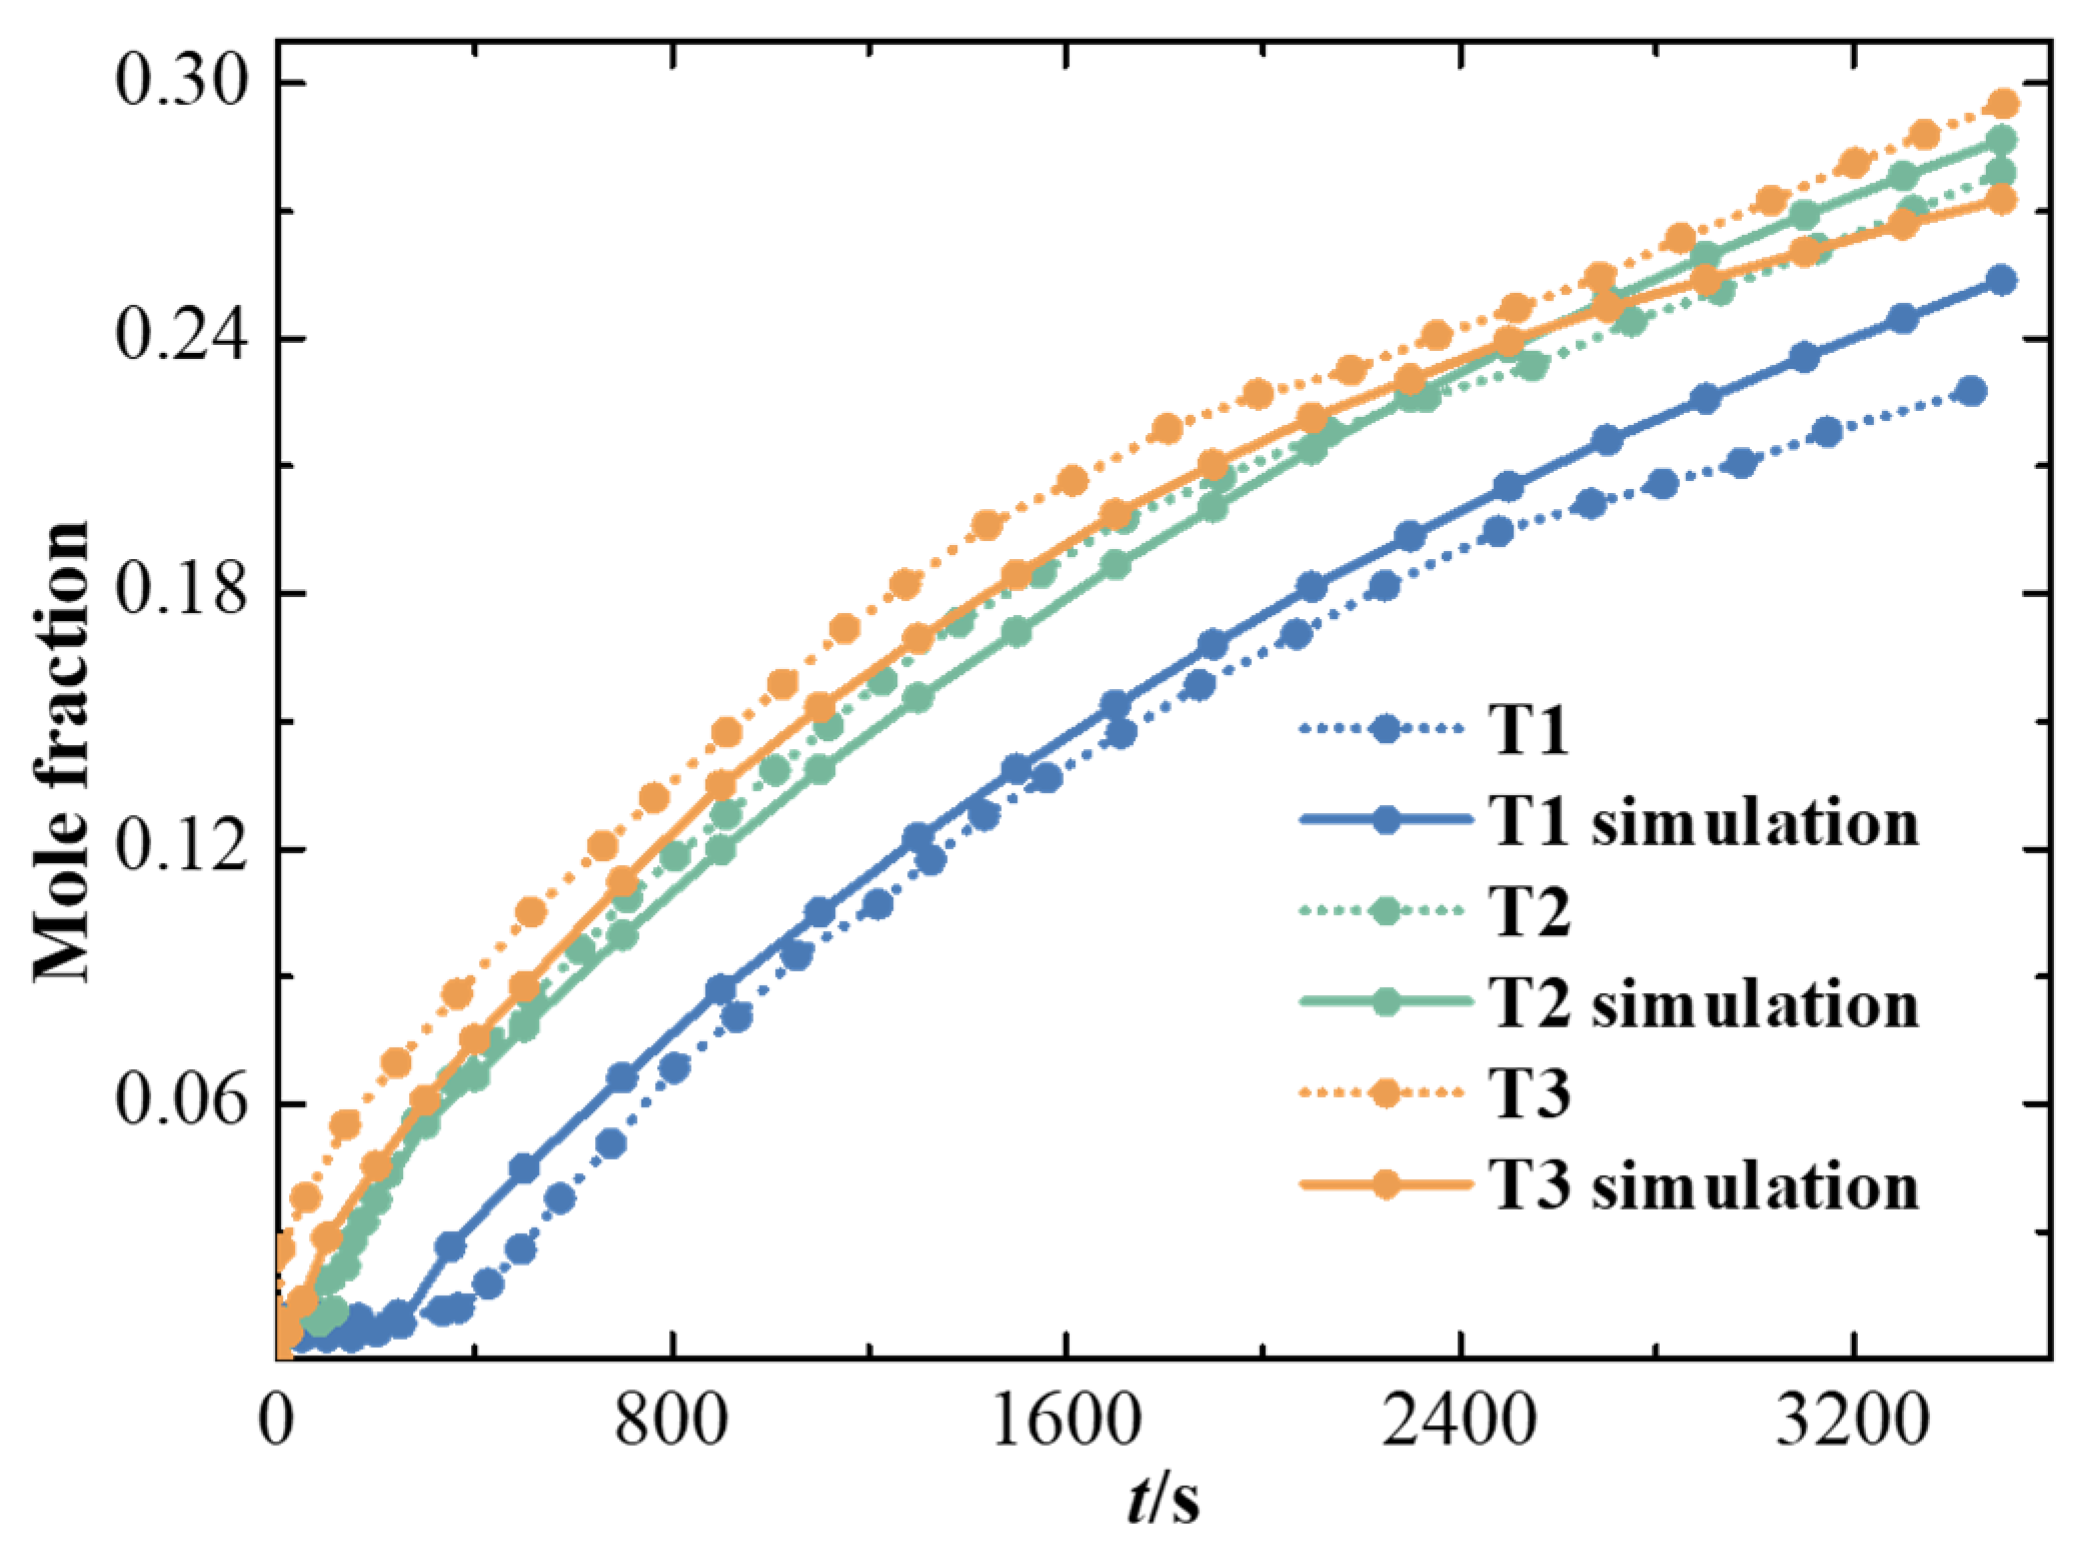
2.7. Hydrogen Leakage Concentration Field Simulation Verification

The present study uses the experimental results of Pitts et al. [18] for validation. Pitts et al. conducted experiments in a garage measuring 6.1 m × 6.1 m × 3.05 m. A garage door, measuring 2.4 m × 2.1 m, was located centrally at the bottom of the front wall. Two square windows with a side length of 0.2 m were positioned on the right side wall, 2.1 m above the ground. In the experiment, hydrogen was released from the top of a rectangular box located at the center of the garage, measuring 0.305 m × 0.305 m × 0.15 m. The hydrogen leakage had a mass flow rate of 0.833 kg/min and lasted for 3651 s. Three sensors were placed inside the garage to measure the hydrogen concentration, located at the coordinates (3.05, 5.49, 0.38), (3.05, 5.49, 1.52), and (3.05, 5.49, 3.05), and were labeled as sensors T1, T2, and T3. The hydrogen mole fraction variation curves at the three monitoring points T1, T2, and T3, obtained from the experimental results, are shown in Figure 4.
Figure 4 demonstrates that the simulation results closely align with the experimental data, showing a maximum error of under 10%. Therefore, it is considered feasible to use CFD simulations to predict the concentration distribution of hydrogen leakage in confined spaces.

3. Results and Discussion

In the hydrogen production plant, the pressure in the hydrogen purification unit is 2.1 MPa. The pressure vessels and pipelines of the hydrogen purification system are intricate, and, in the event of a leak, the mole fraction of hydrogen can locally exceed 4% within a short time, leading to a high risk of combustion and explosion in confined spaces. Therefore, understanding the distribution of the hydrogen mole fraction during leakage from a hydrogen purification unit in confined spaces is of great significance for formulating safety measures. By considering the impact of obstacles such as gas–liquid processors, electrolyzers, and water tanks on the hydrogen diffusion process within a plant, this study examines the impact of various ventilation conditions and leakage orientations on the distribution of hydrogen mole fractions. The findings can serve as a reference for designing hydrogen leakage monitoring schemes in confined spaces.

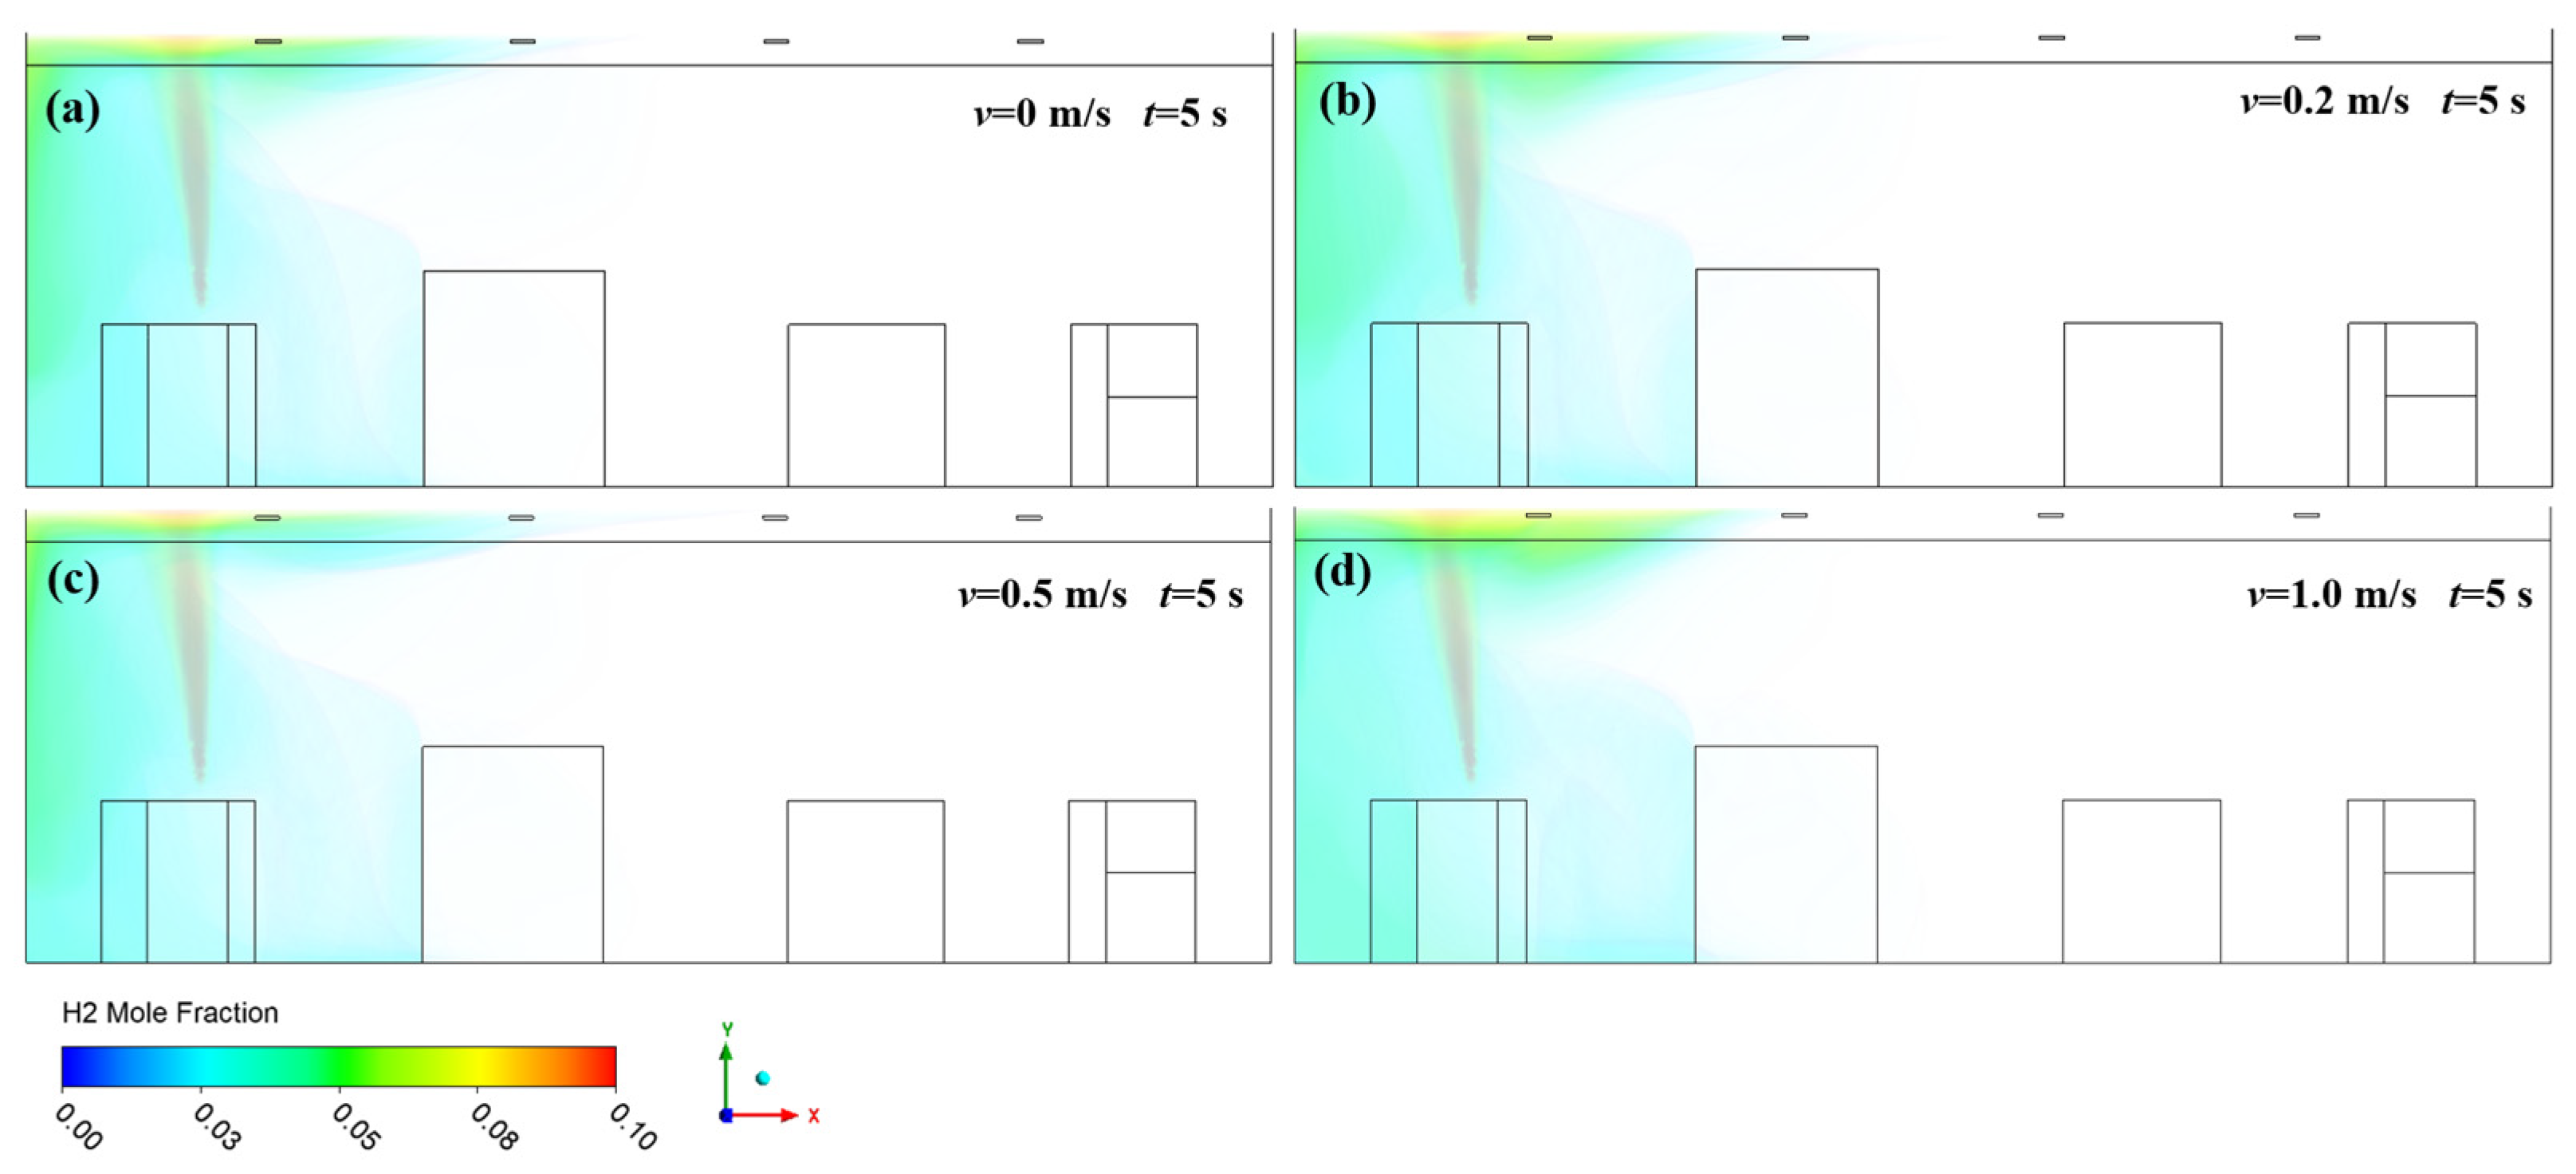
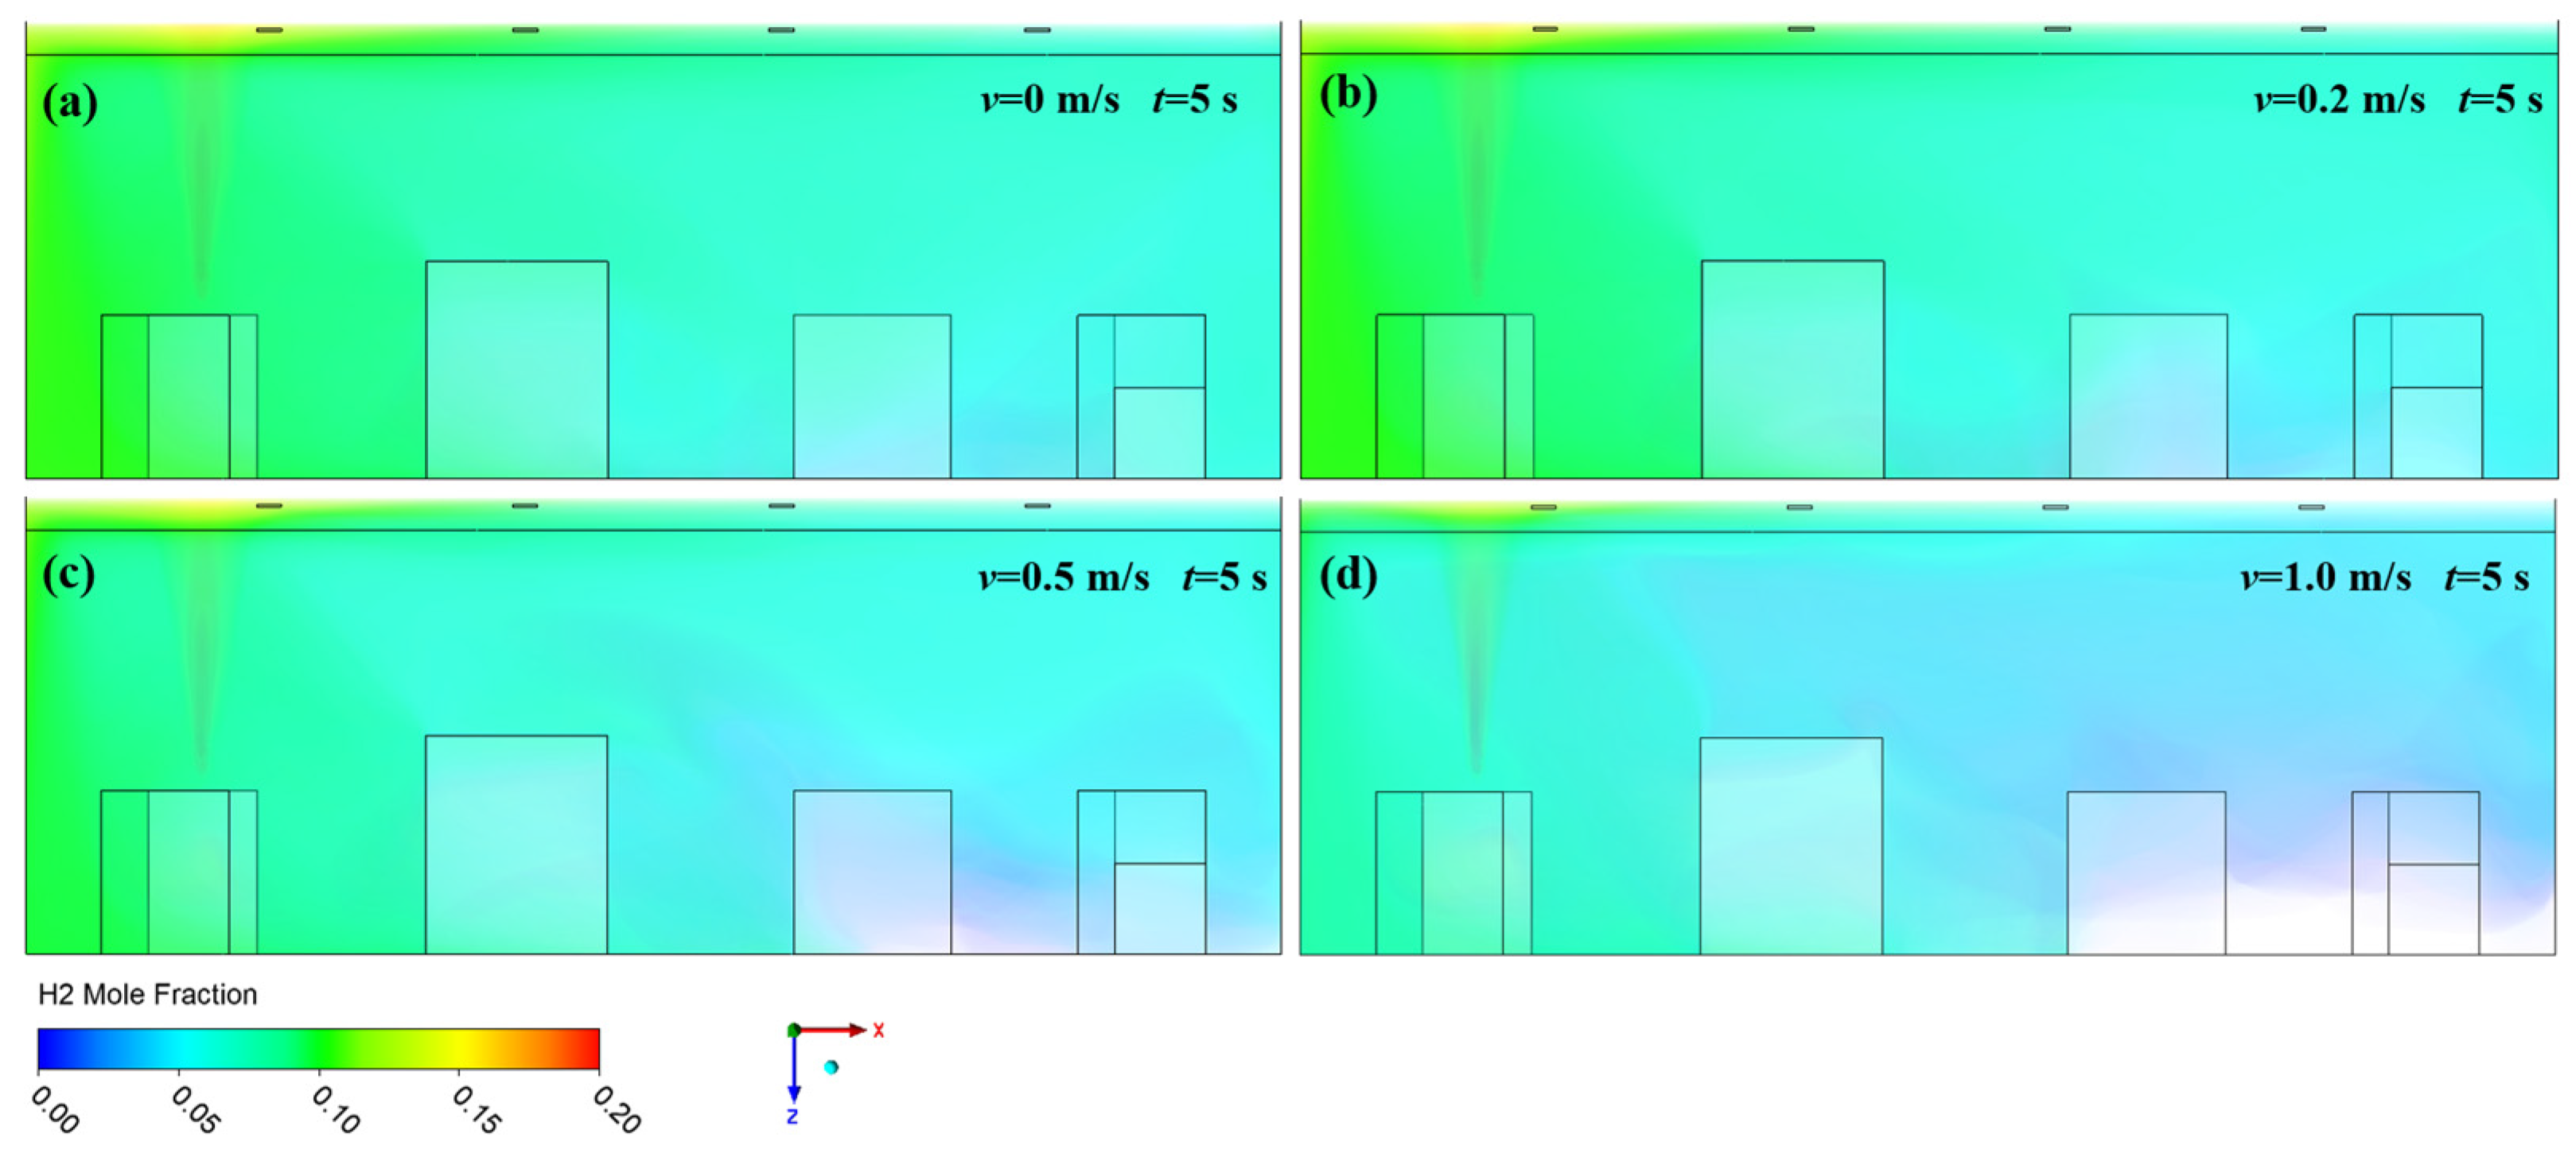
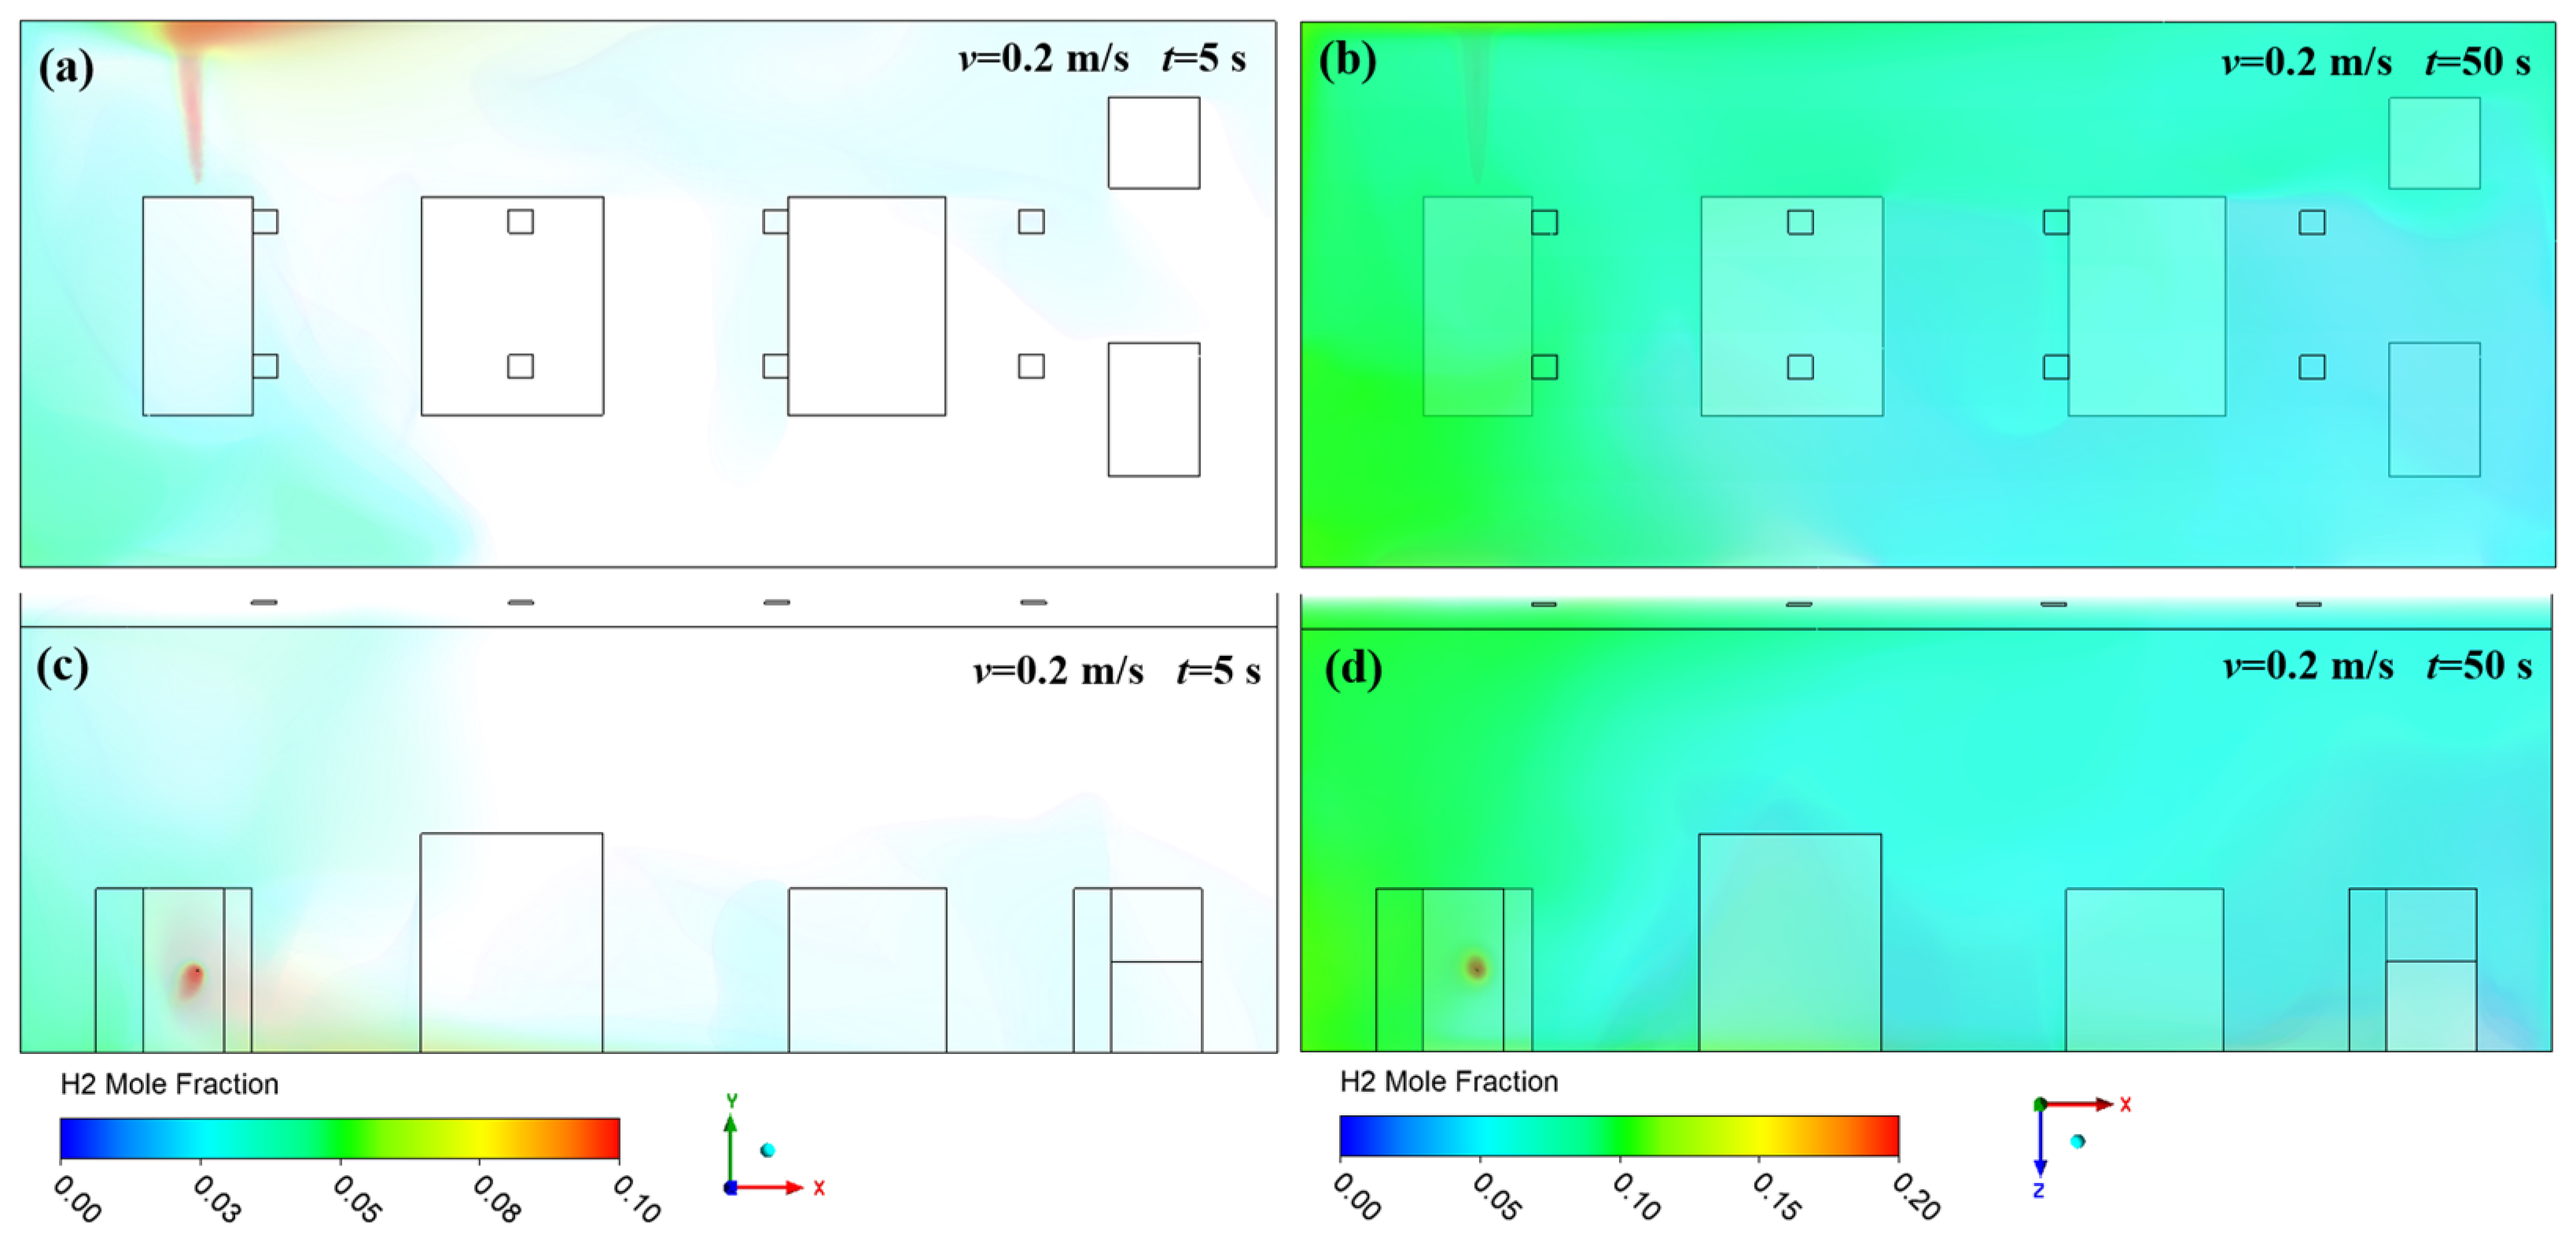
3.1. Effect of Ventilation on Hydrogen Diffusion

In actual production processes, the factory doors have an inflow velocity that affects the hydrogen distribution characteristics inside the plant. This section examines the influence of varying inflow velocities through the factory doors on hydrogen diffusion after a leakage occurs at the top of the hydrogen purification unit under ventilated conditions. The inflow velocity v is set at 0 m/s, 0.2 m/s, 0.5 m/s, and 1.0 m/s, providing a reference for optimizing ventilation conditions. Figure 5 and Figure 6 show the mole fraction contours of hydrogen at time t = 5 s after a leak at the top of the hydrogen purification unit. From Figure 5a and Figure 6a, it can be observed that, after the hydrogen leaks from the top of the hydrogen purification unit, it quickly diffuses to the roof of the plant under the influence of pressure. Upon reaching the roof, the hydrogen begins to spread laterally. When hydrogen encounters the left side wall, it continues to diffuse downward along the wall. Since there are no obstacles on the right side of the roof, hydrogen continues to spread toward the center of the plant along the roof, with the mole fraction directly above the leakage point being higher than in other areas. As shown in Figure 5b–d and Figure 6b–d, increasing the inflow velocity of the door significantly reduces the hydrogen mole fraction near the left side wall. Due to the presence of the gas–liquid processor, hydrogen is blocked on the left side of the processor, so during the initial stages of the leak, hydrogen primarily diffuses into the plant along the wall.
Figure 7 and Figure 8 display the mole fraction contours of hydrogen after 50 s of leakage. From Figure 7a and Figure 8a, it can be observed that, as hydrogen continues to leak, it gradually fills the entire plant space. Notably, the area near the leakage point on the left side exhibits a high mole fraction, exceeding 15%, indicating that this region is highly susceptible to combustion and explosion. As the leakage time increases, the influence of obstacles within the plant on hydrogen diffusion diminishes. However, as shown in Figure 7b–d and Figure 8b–d, increasing the inflow velocity at the doorway leads to an overall reduction in hydrogen mole fraction within the plant, particularly in the areas near the leakage point, including the upper region of the plant and the left side. The inflow velocity significantly lowers the hydrogen concentration close to the leakage point. This indicates that effective ventilation measures must be implemented during the production process to reduce hydrogen concentrations in the event of a leak, thereby minimizing the potential losses associated with hydrogen leakage.
Due to the high hydrogen mole fractions at the top and left sides of the plant, the mole fractions at the wall measurement points were monitored, resulting in the time-dependent mole fraction graph shown in Figure 9. In Figure 9a, when v = 0 m/s, the hydrogen mole fractions at monitoring points up-1, up-2, and up-3 rapidly increased to 0.11, 0.07, and 0.05, respectively, at 20 s after the leakage began. As the leakage time increased, the rate of increase in mole fraction began to diminish, and the differences in mole fractions between the monitoring points gradually decreased. At t = 200 s, the hydrogen mole fractions at up-1, up-2, and up-3 were 0.26, 0.24, and 0.23, respectively. In contrast, as shown in Figure 9b–d, the hydrogen mole fractions at various monitoring points on the left side and front and back walls of the plant quickly rose above 0.04 within 20 s after the leakage, reaching the lower limits for combustion and explosion. During the subsequent leakage process, the hydrogen mole fractions did not vary significantly over time. Therefore, in actual monitoring processes, it is essential to monitor the area above the leakage point to provide an early warning in the initial moments of hydrogen leakage.
From the hydrogen mole fraction distribution cloud maps in Figure 7 and Figure 8, it is evident that ventilation can significantly reduce the hydrogen concentration near the leakage point. To quantitatively characterize the impact of ventilation on the hydrogen mole fraction, Figure 10 presents the time-dependent mole fraction at monitoring points up-1 and left-1. It can be observed that. as the wind speed increases, at 60 s after the leakage occurs, the hydrogen mole fraction at monitoring point up-1 decreases from 0.16 at v = 0 m/s wind speed to 0.12 at v = 1.0 m/s, representing a reduction of 25%. At a leakage duration of 200 s, the mole fraction decreases from 0.26 to 0.13, indicating a 50% reduction. Correspondingly, at left-1, the hydrogen mole fraction decreases from 0.12 at 0 m/s to 0.08 at v = 1.0 m/s, a reduction of 33%, and at 200 s of leakage time, it decreases from 0.22 to 0.09, amounting to a 59% reduction. It is noteworthy that, as the leakage duration increases, the mole fractions at the monitoring points exhibit different rates of change. Higher wind speeds correlate with slower increases in mole fraction. For example, at v = 0 m/s, the hydrogen mole fraction at up-1 rises from 0.16 to 0.26 at 200 s, a 62.5% increase, whereas at v = 1.0 m/s, it only increases from 0.12 to 0.13, an 8.3% increase. This indicates that enhanced ventilation conditions can significantly lower the hydrogen mole fraction near the leakage point. Therefore, in actual production processes, it is essential to implement increased ventilation measures to reduce hydrogen concentrations.

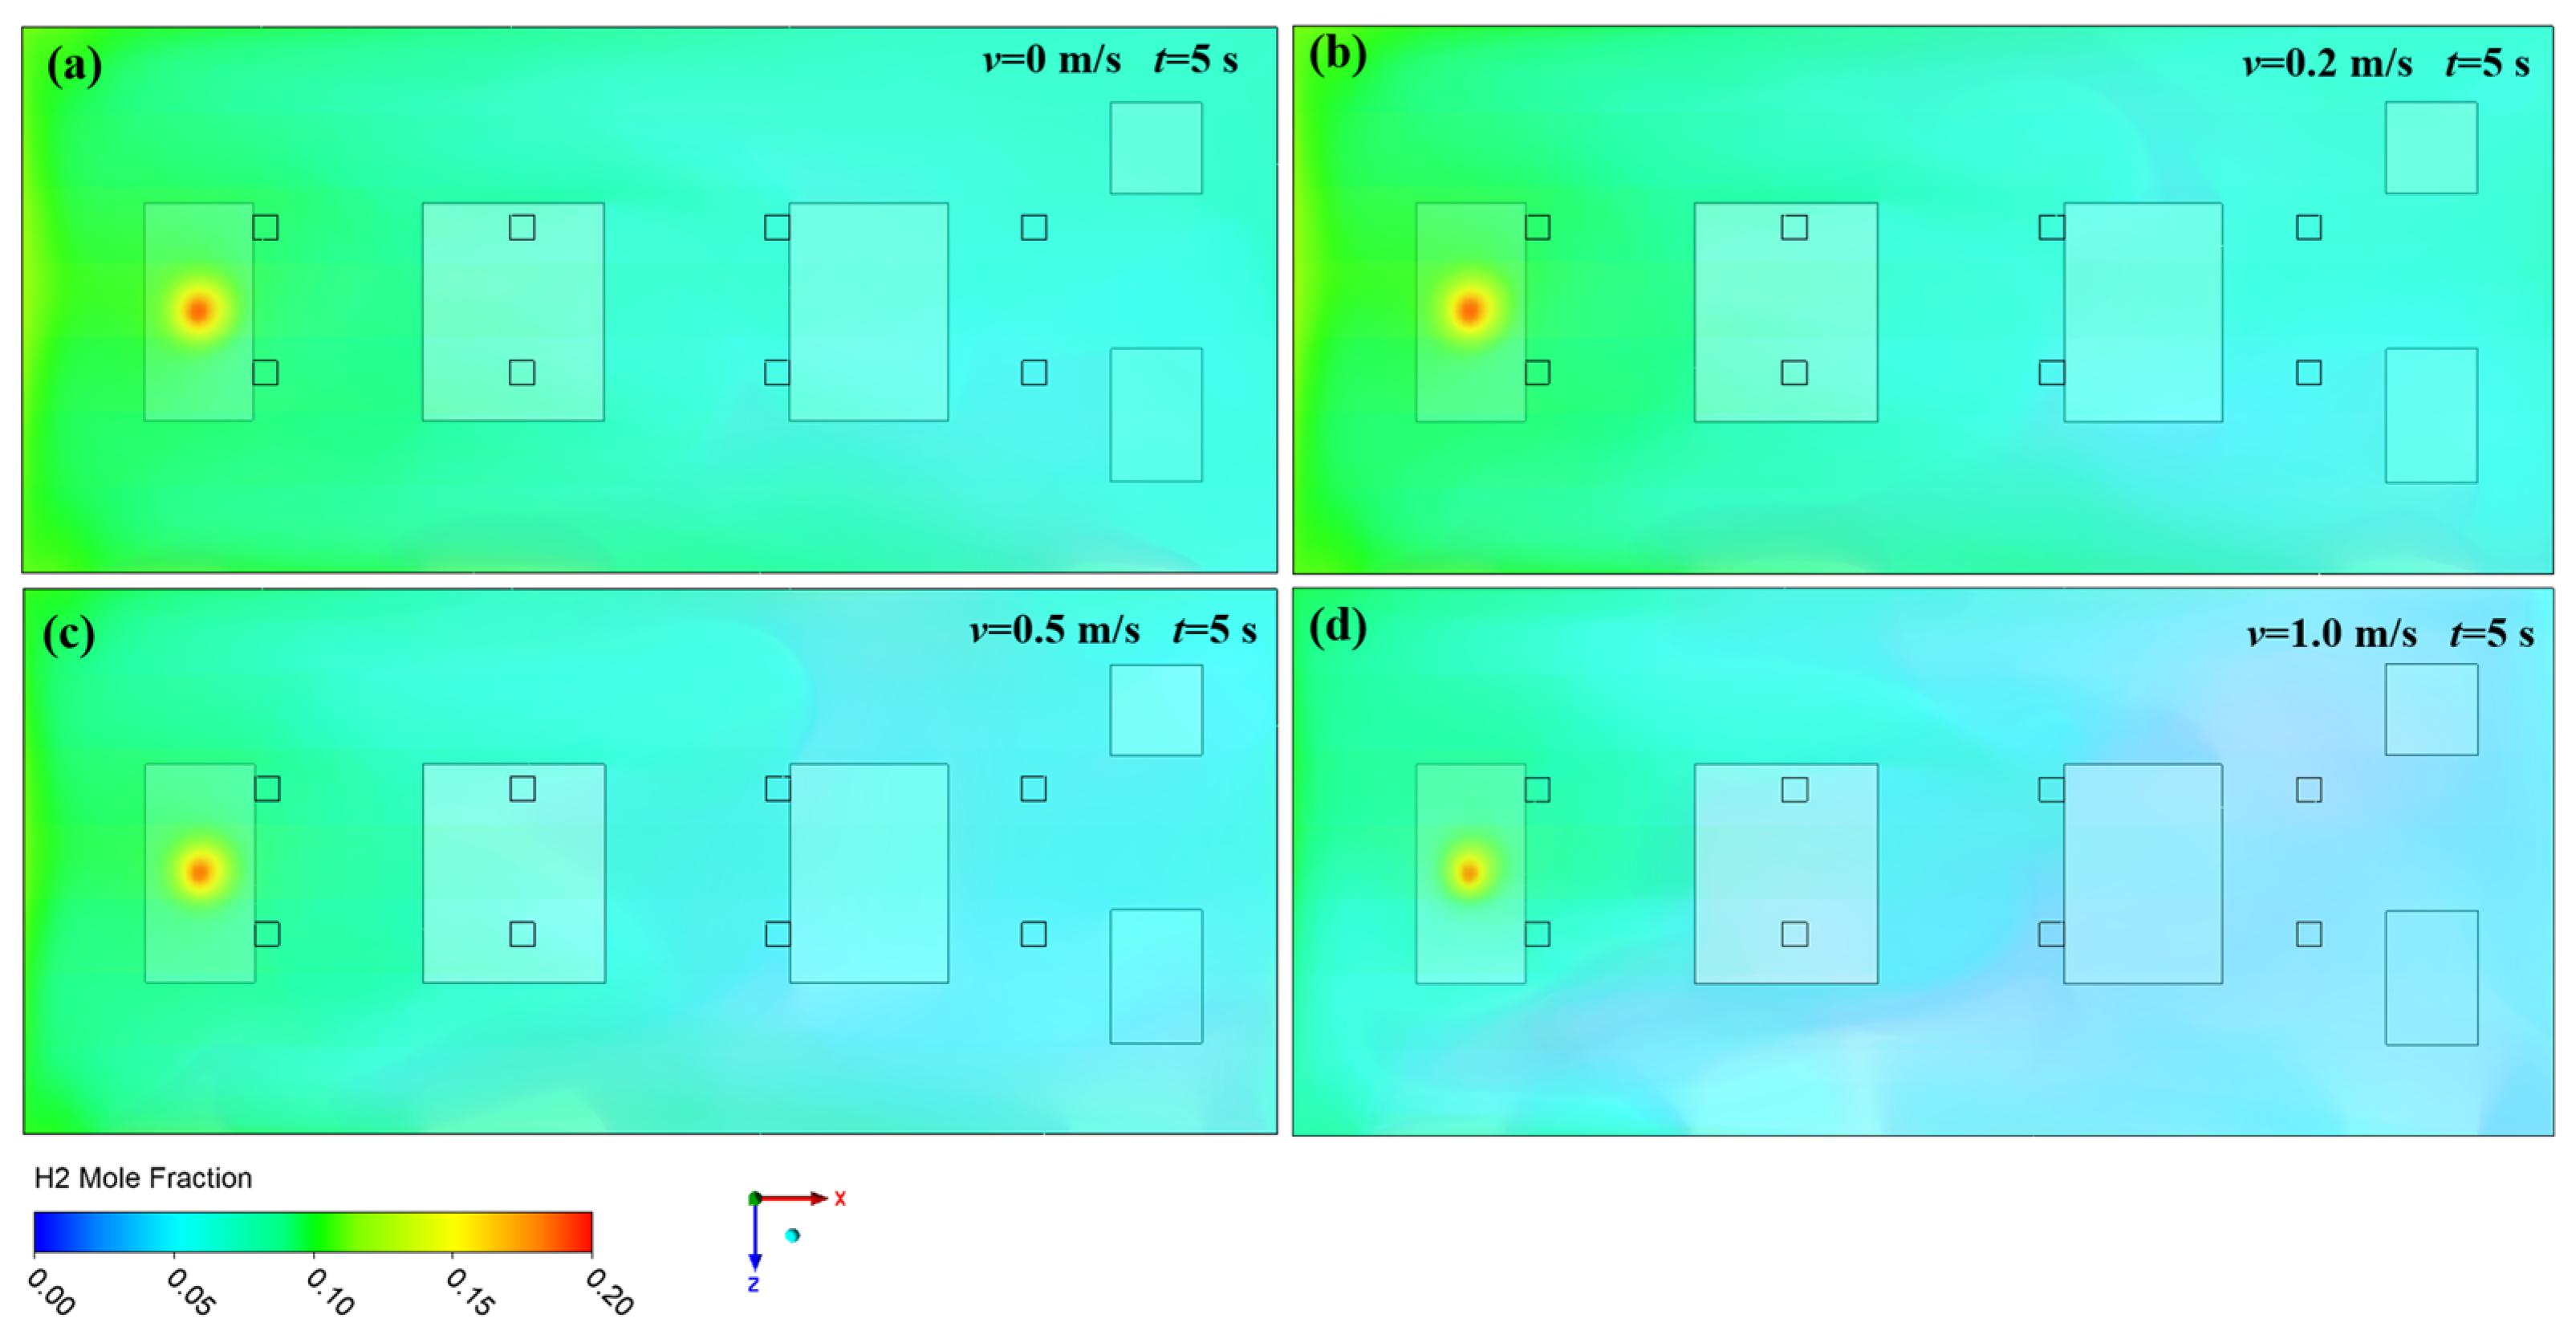
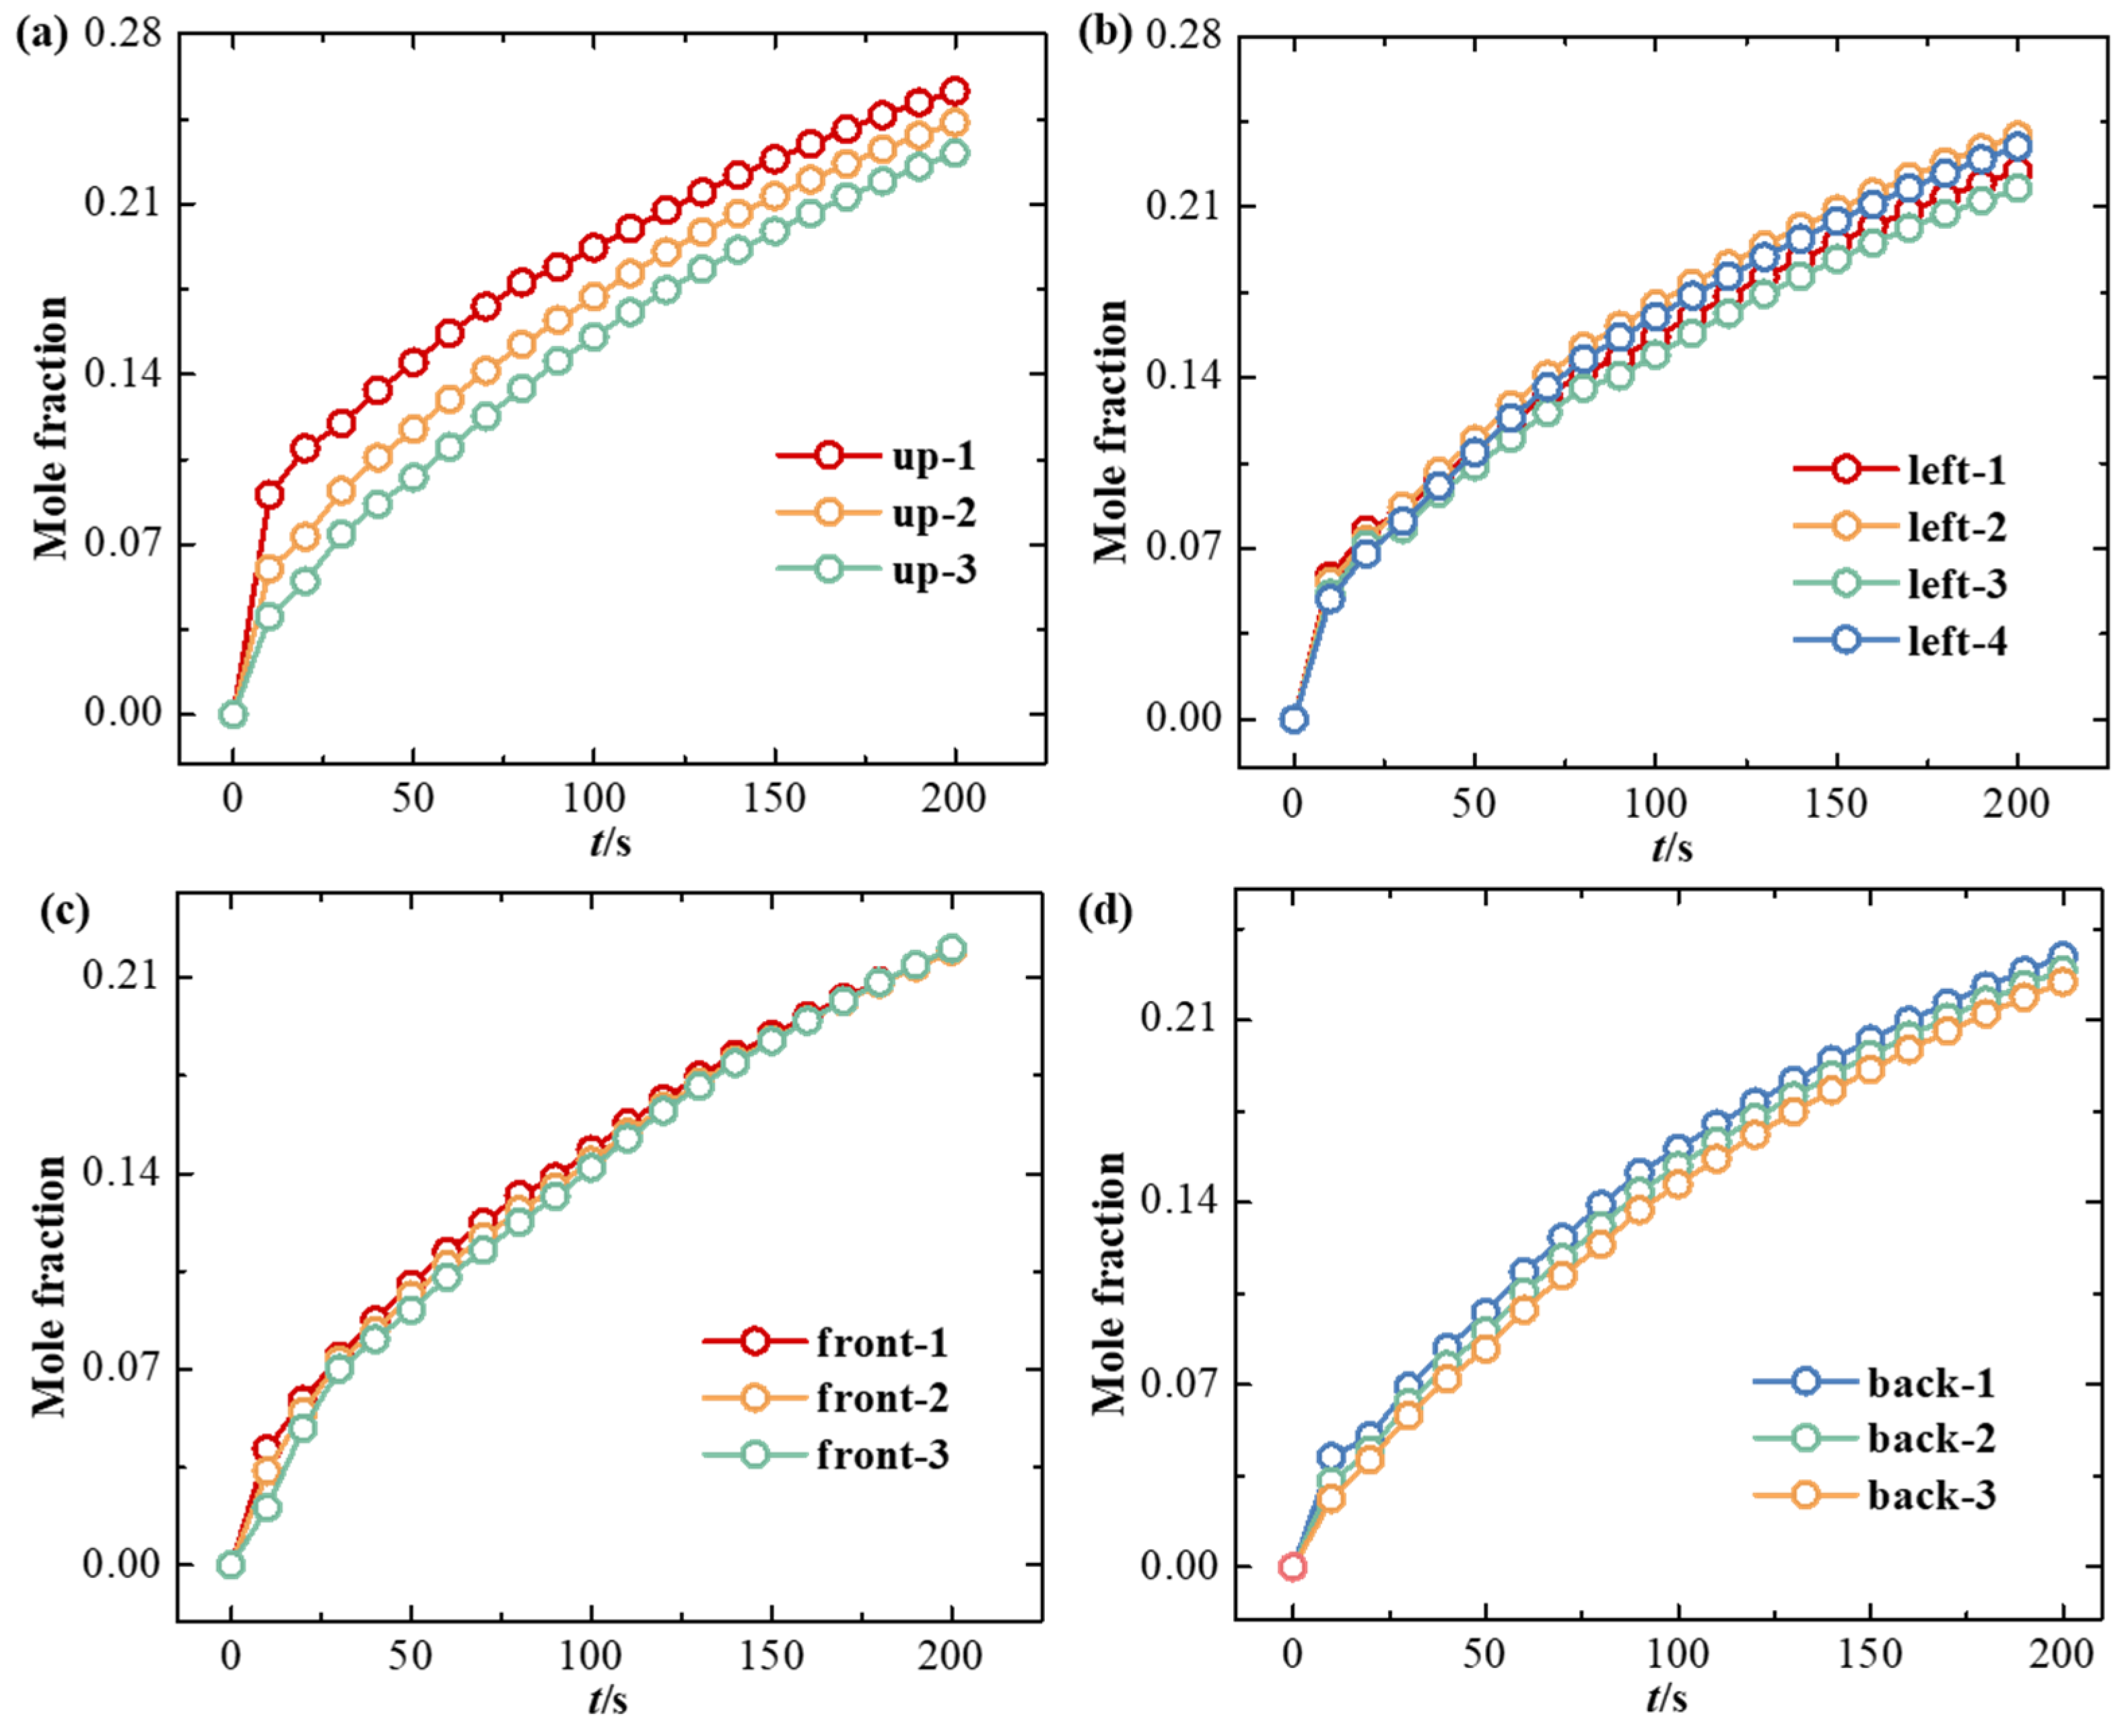
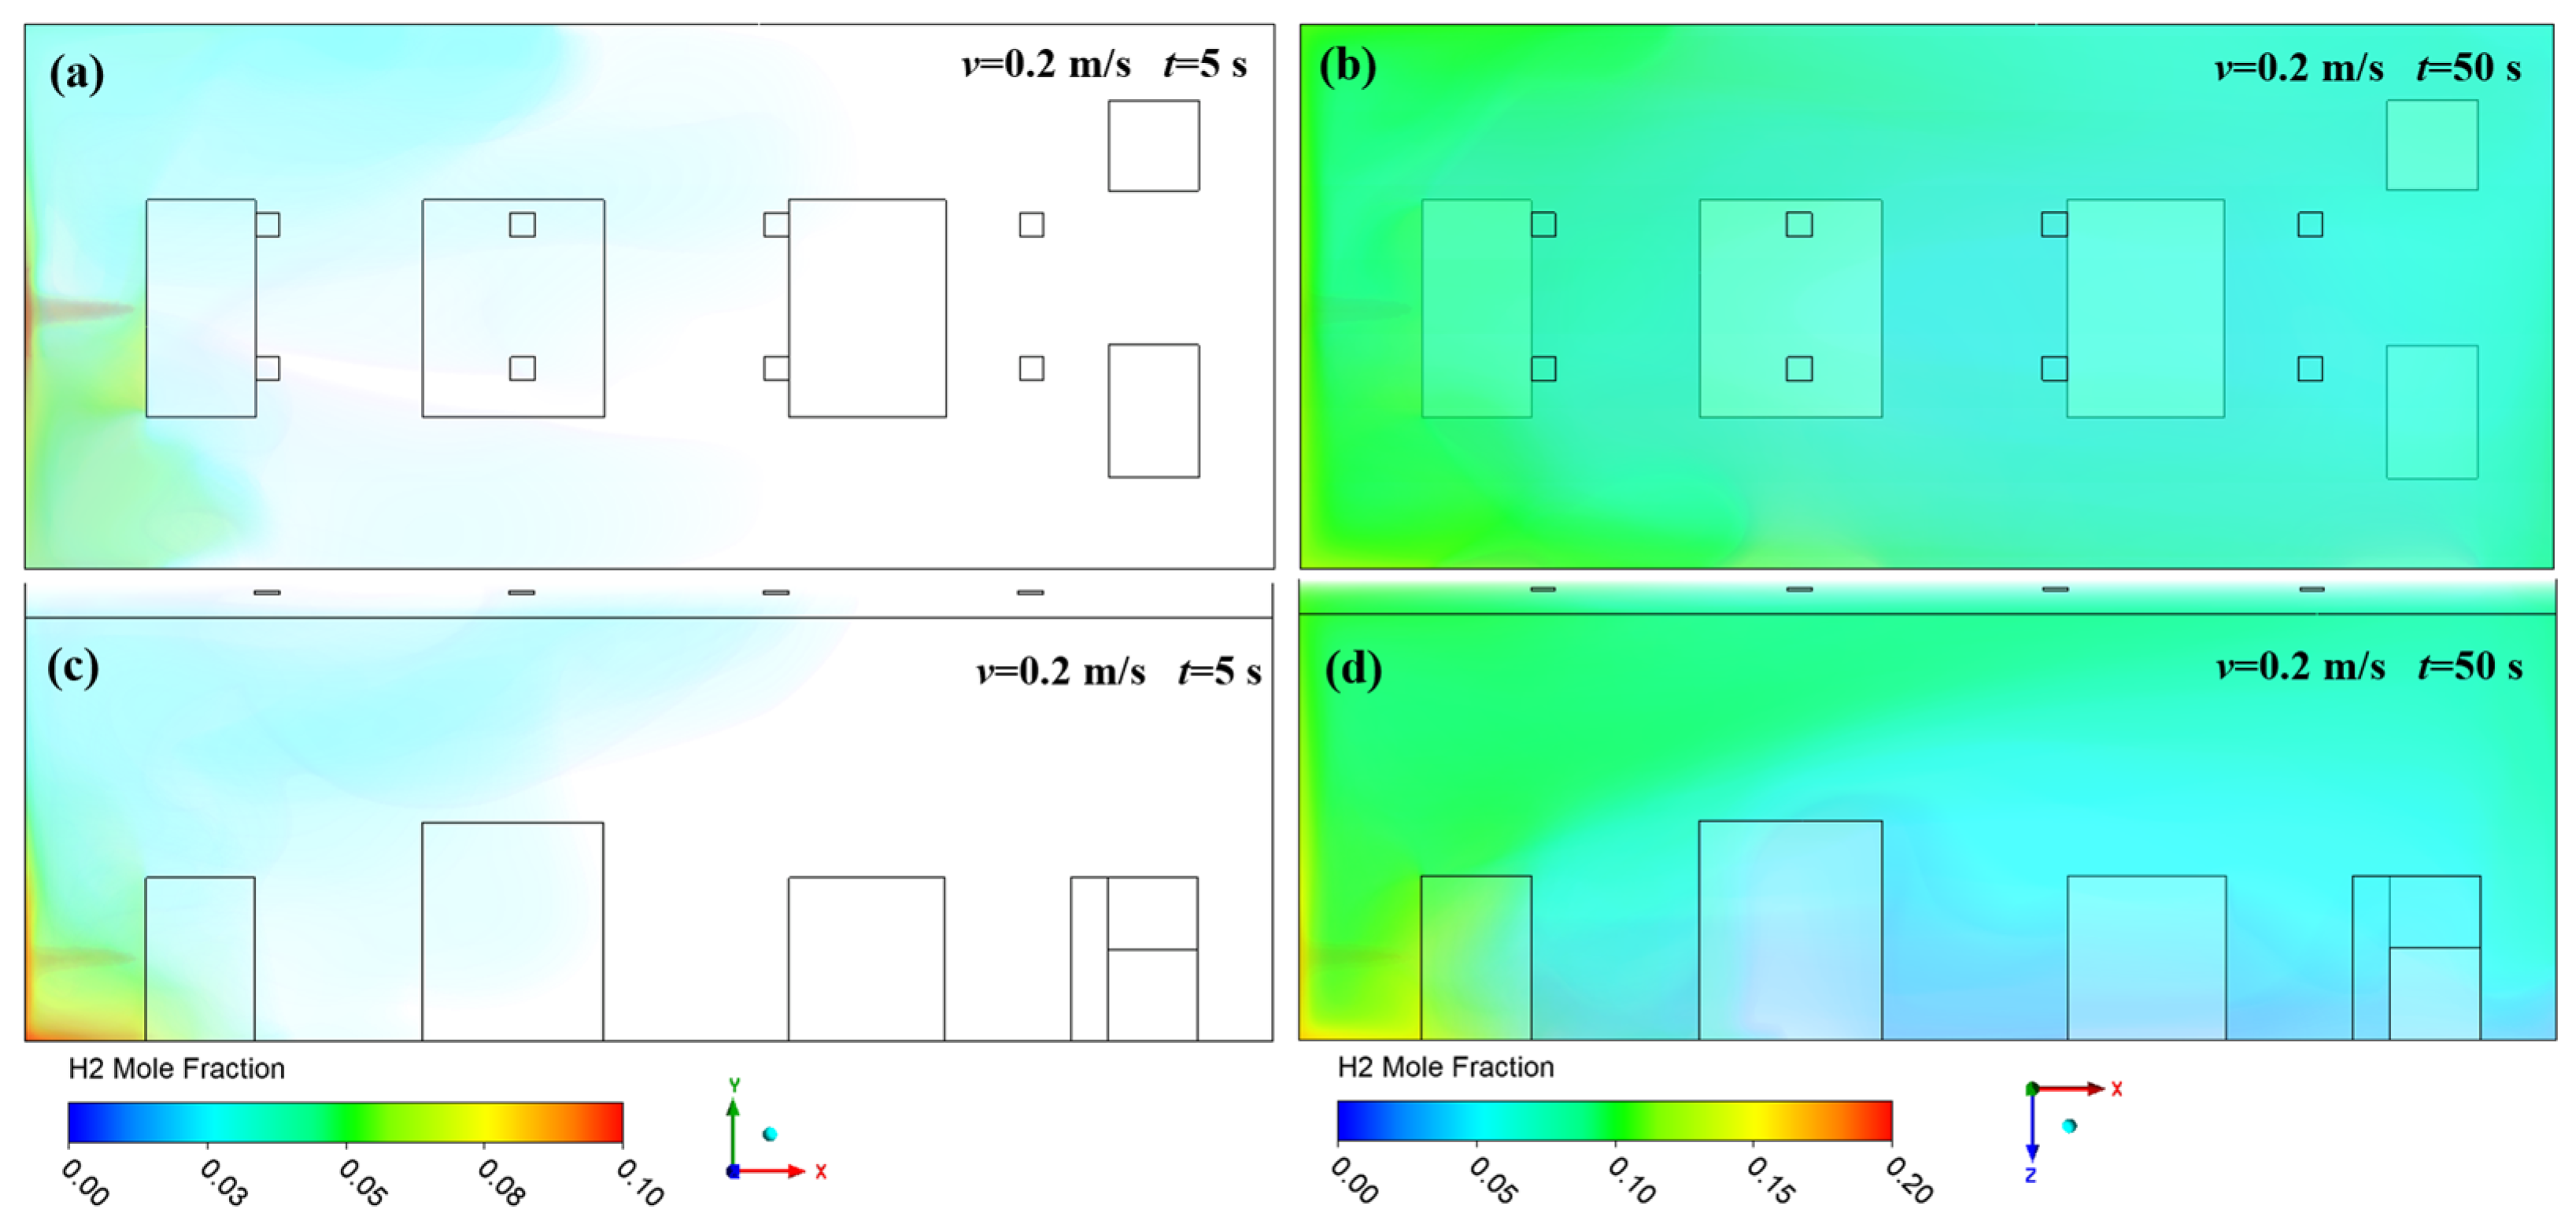
3.2. Effect of Leakage Direction on Hydrogen Diffusion

The direction of leakage influences the diffusion process of hydrogen within the facility. This section will explore the mole fraction distribution following leaks from the rear and left sides of the hydrogen purification unit, with the inlet wind speed at the factory door set to v = 0.2 m/s to simulate real operational conditions. As shown in Figure 11a,c, when a leak occurs at the rear of the hydrogen purification unit, hydrogen diffuses along the left wall toward the front of the facility. Due to the proximity of the leak point to the ground, hydrogen first accumulates near the floor. As leakage continues and ventilation from the factory door occurs, the mole fraction of hydrogen near the ground remains lower than that at the top of the left wall. Notably, the leaked hydrogen continues to diffuse toward the center of the facility, and the presence of obstacles results in higher hydrogen mole fractions in the rear area than near the front door (Figure 11b,d). Figure 12 quantitatively presents the changes in hydrogen mole fraction at monitoring points on the top and rear walls when a leak occurs at the back of the hydrogen purification unit. It can be observed that the growth rate of hydrogen mole fractions at points up-1, up-2, and up-3 decreases over time. However, due to the diffusion of hydrogen along the rear wall, the mole fractions at monitoring points back-1 and back-2 increase rapidly to 0.06 and 0.04 within 10 s of leakage, respectively, while the mole fraction at back-3 rises to 0.05 at 20 s, all exceeding the lower limits for combustion and explosion of hydrogen.
When a leak occurs on the left side of the hydrogen purification unit, as illustrated in Figure 13a,c, the leaked hydrogen rapidly diffuses to the front and rear walls upon contact with the left side, spreading toward the central area of the facility along these walls. Initially, the ground area near the leak point exhibits a high mole fraction of hydrogen. As depicted in Figure 13b,d, as the leakage time increases, the hydrogen mole fraction near the factory door is notably lower compared to other regions, while higher mole fractions are observed in the left and upper regions of the facility, making it difficult for hydrogen in the left area to dissipate through ventilation. Figure 14 illustrates the variations in hydrogen mole fraction at the monitoring points on the top and left sides of the facility when a leak occurs on the left side of the hydrogen purification unit. As seen in Figure 14a, the hydrogen that leaks and directly contacts the left wall causes a rapid increase in mole fractions at the left-1, left-2, left-3, and left-4 monitoring points, all exceeding 0.2 after 160 s of leakage. In contrast, monitoring points up-1, up-2, and up-3, which are farther from the leak point, only see up-1 exceed 0.2 after 200 s, as shown in Figure 14b. In summary, when the direction of hydrogen leakage is not upward, this leads to the accumulation of hydrogen in areas close to the leak point, making it challenging to detect the leakage promptly through monitoring points located in the upper regions of the facility.

4. Conclusions

This study used CFD simulation software Fluent to investigate the leakage process of the hydrogen purification unit in a hydrogen production facility, drawing the following conclusions from variations in wind speed and leakage direction:
(1)
High-pressure hydrogen primarily diffuses rapidly along the walls of the facility, with local mole fractions near the leak point quickly reaching the explosive limit of 4%. Increasing the inlet wind speed effectively suppresses the rapid rise in hydrogen mole fraction in localized areas, with greater wind speeds yielding better suppression. In practical scenarios, it is essential to consider the leakage location and install exhaust fans along the walls to create airflow, thereby enhancing ventilation.
(2)
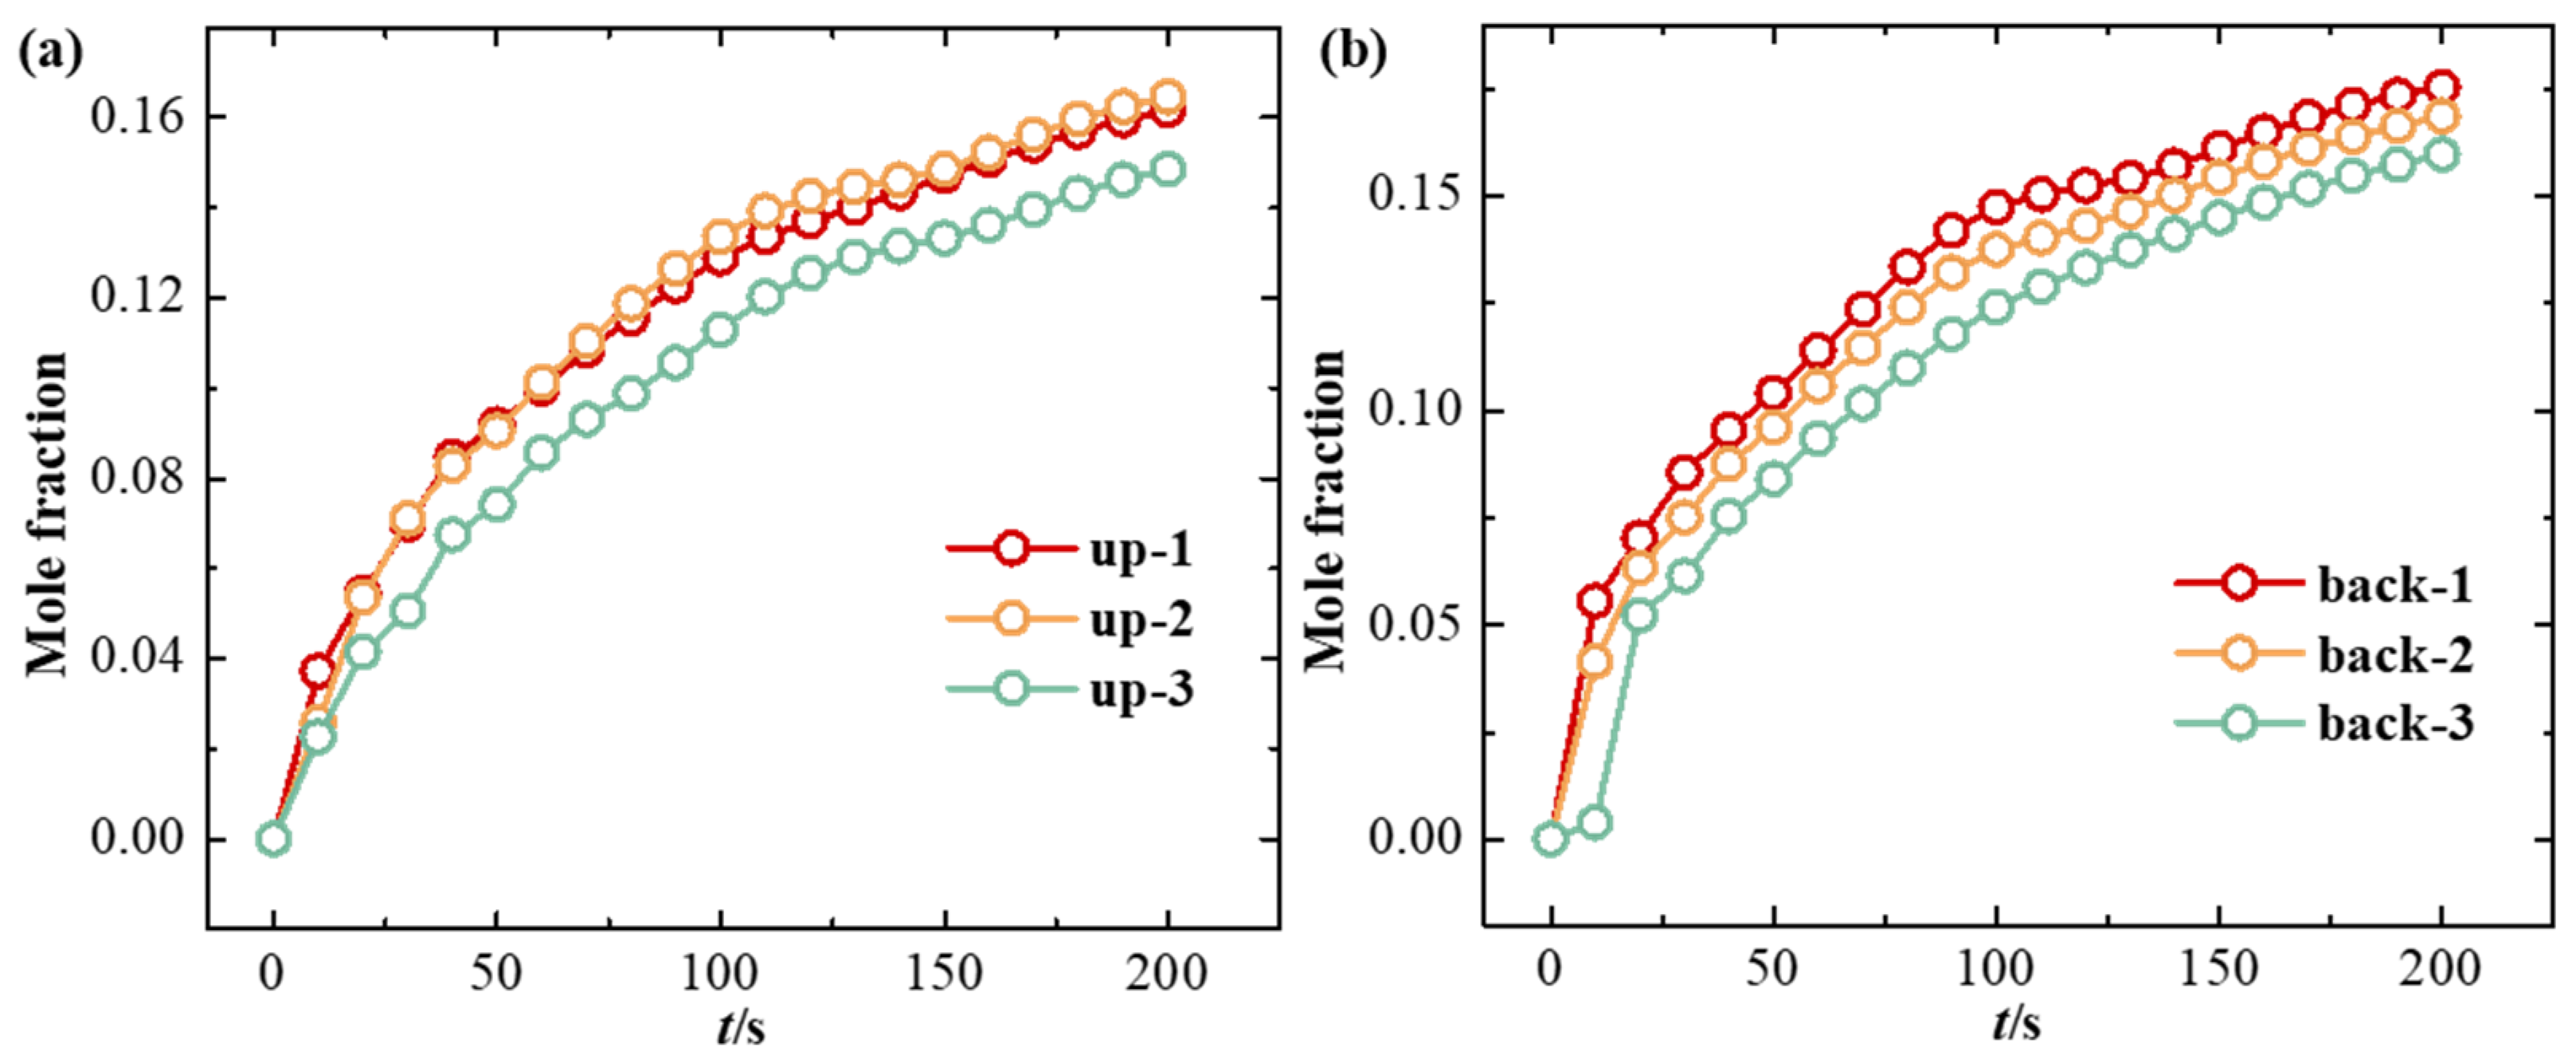
The study revealed that hydrogen tends to accumulate at wall corners regardless of the leakage direction before gradually diffusing to other walls. This is due to a change in the flow direction of hydrogen at the corners, which reduces the diffusion speed. This phenomenon emphasizes the necessity of placing hydrogen monitoring devices at wall junctions for timely detection of hydrogen leaks. Additionally, because hydrogen has a lower density than air, installing monitoring equipment at the top of the facility helps to detect hydrogen leaks early, thereby mitigating potential safety risks.
(3)
In terms of recommendations for standards and regulations, hydrogen leakage tests should be conducted under operating conditions to evaluate the leakage characteristics of equipment during normal operation, establish permissible emission limits, and ensure that hydrogen diffusion does not pose potential hazards. Additionally, it is recommended that hydrogen leakage tests are performed under parking conditions, particularly considering the risk of rapid hydrogen accumulation in confined spaces due to buoyancy effects.

Author Contributions

Conceptualization, F.-M.L.; methodology, J.-D.L. and C.-Y.Z.; software, Y.Z.; formal analysis, Z.-N.W. and L.Y.; data curation, Y.Z.; writing—original draft, Y.Z.; writing—review and editing, J.-D.L.; supervision, F.-M.L. and L.G.; project administration, F.-M.L.; funding acquisition, F.-M.L. All authors have read and agreed to the published version of the manuscript.

Funding

The authors are grateful for the supports of Natural Science Foundation of Shandong Province (No. ZR2023QE034).

Data Availability Statement

The original contributions presented in the study are included in the article, further inquiries can be directed to the corresponding author.

Conflicts of Interest

Authors Feng-Ming Li, Zheng-Nan Wei and Lin Yuan were employed by the Novel Energy Development Center of Shengli Petroleum Administration, SINOPEC. The remaining authors declare that the research was conducted in the absence of any commercial or financial relationships that could be construed as a potential conflict of interest.

References

  1. Hassan, Q.; Viktor, P.; Al-Musawi, T.J.; Ali, B.M.; Algburi, S.; Alzoubi, H.M.; Al-Jiboory, A.K.; Sameen, A.Z.; Salman, H.M.; Jaszczur, M. The renewable energy role in the global energy Transformations. Renew. Energy Focus 2024, 48, 100545. [Google Scholar] [CrossRef]
  2. Bampaou, M.; Panopoulos, K. An overview of hydrogen valleys: Current status, challenges and their role in increased renewable energy penetration. Renew. Sustain. Energy Rev. 2025, 207, 114923. [Google Scholar] [CrossRef]
  3. Yue, M.; Lambert, H.; Pahon, E.; Roche, R.; Jemei, S.; Hissel, D. Hydrogen energy systems: A critical review of technologies, applications, trends and challenges. Renew. Sustain. Energy Rev. 2021, 146, 111180. [Google Scholar] [CrossRef]
  4. Le, T.T.; Sharma, P.; Bora, B.J.; Tran, V.D.; Truong, T.H.; Le, H.C.; Nguyen, P.Q.P. Fueling the future: A comprehensive review of hydrogen energy systems and their challenges. Int. J. Hydrogen Energy 2024, 54, 791–816. [Google Scholar] [CrossRef]
  5. Ishimoto, J.; Shimada, S. Coupled computing for reactive hydrogen leakage phenomena with crack propagation in a pressure tank. Int. J. Hydrogen Energy 2022, 47, 2735–2758. [Google Scholar] [CrossRef]
  6. Yang, F.; Wang, T.; Deng, X.; Dang, J.; Huang, Z.; Hu, S.; Li, Y.; Ouyang, M. Review on hydrogen safety issues: Incident statistics, hydrogen diffusion, and detonation process. Int. J. Hydrogen Energy 2021, 46, 31467–31488. [Google Scholar] [CrossRef]
  7. Yang, N.; Deng, J.; Wang, C.; Bai, Z.; Qu, J. High pressure hydrogen leakage diffusion: Research progress. Int. J. Hydrogen Energy 2024, 50, 1029–1046. [Google Scholar] [CrossRef]
  8. Campari, A.; Ustolin, F.; Alvaro, A.; Paltrinieri, N. A review on hydrogen embrittlement and risk-based inspection of hydrogen technologies. Int. J. Hydrogen Energy 2023, 48, 35316–35346. [Google Scholar] [CrossRef]
  9. Zhang, M.; Lv, H.; Kang, H.; Zhou, W.; Zhang, C. A literature review of failure prediction and analysis methods for composite high-pressure hydrogen storage tanks. Int. J. Hydrogen Energy 2019, 44, 25777–25799. [Google Scholar] [CrossRef]
  10. Ramirez, J.P.B.; Halm, D.; Grandidier, J.-C.; Villalonga, S.; Nony, F. 700 bar type IV high pressure hydrogen storage vessel burst–Simulation and experimental validation. Int. J. Hydrogen Energy 2015, 40, 13183–13192. [Google Scholar] [CrossRef]
  11. Yang, Z.; Hao, D.; Wang, F.; Qin, C.; Chen, X.; Tian, Y. Quantitative analysis of hydrogen leakage and diffusion processes based on real-time concentration measurement at different spatial positions in a customized chamber. Int. J. Hydrogen Energy 2024, 66, 231–241. [Google Scholar] [CrossRef]
  12. Xu, Q.; Chen, G.; Xie, M.; Li, X.; Zhao, Y.; Su, S.; Li, S. Experimental and numerical studies on hydrogen leakage and dispersion evolution characteristics in space with large aspect ratios. J. Clean. Prod. 2024, 438, 140467. [Google Scholar] [CrossRef]
  13. Hajji, Y.; Bouteraa, M.; Elcafsi, A.; Belghith, A.; Bournot, P.; Kallel, F. Natural ventilation of hydrogen during a leak in a residential garage. Renew. Sustain. Energy Rev. 2015, 50, 810–818. [Google Scholar] [CrossRef]
  14. Yu, X.; Wang, C.; He, Q. Numerical study of hydrogen dispersion in a fuel cell vehicle under the effect of ambient wind. Int. J. Hydrogen Energy 2019, 44, 22671–22680. [Google Scholar] [CrossRef]
  15. Gao, Y.; Liu, H.; Hou, Y. Effects of leakage location and ventilation condition on hydrogen leakage during shipping of fuel cell vehicles. Int. J. Hydrogen Energy 2024, 54, 1532–1543. [Google Scholar] [CrossRef]
  16. Hou, X.; Lan, H.; Zhao, Z.; Li, J.; Hu, C.; Li, Y. Effect of obstacle location on hydrogen dispersion in a hydrogen fuel cell bus with natural and mechanical ventilation. Process. Saf. Environ. Prot. 2023, 171, 995–1008. [Google Scholar] [CrossRef]
  17. Qian, J.-Y.; Li, X.-J.; Gao, Z.-X.; Jin, Z.-J. A numerical study of hydrogen leakage and diffusion in a hydrogen refueling station. Int. J. Hydrogen Energy 2020, 45, 14428–14439. [Google Scholar] [CrossRef]
  18. Pitts, W.M.; Yang, J.C.; Blais, M.; Joyce, A. Dispersion and burning behavior of hydrogen released in a full-scale residential garage in the presence and absence of conventional automobiles. Int. J. Hydrogen Energy 2012, 37, 17457–17469. [Google Scholar] [CrossRef]
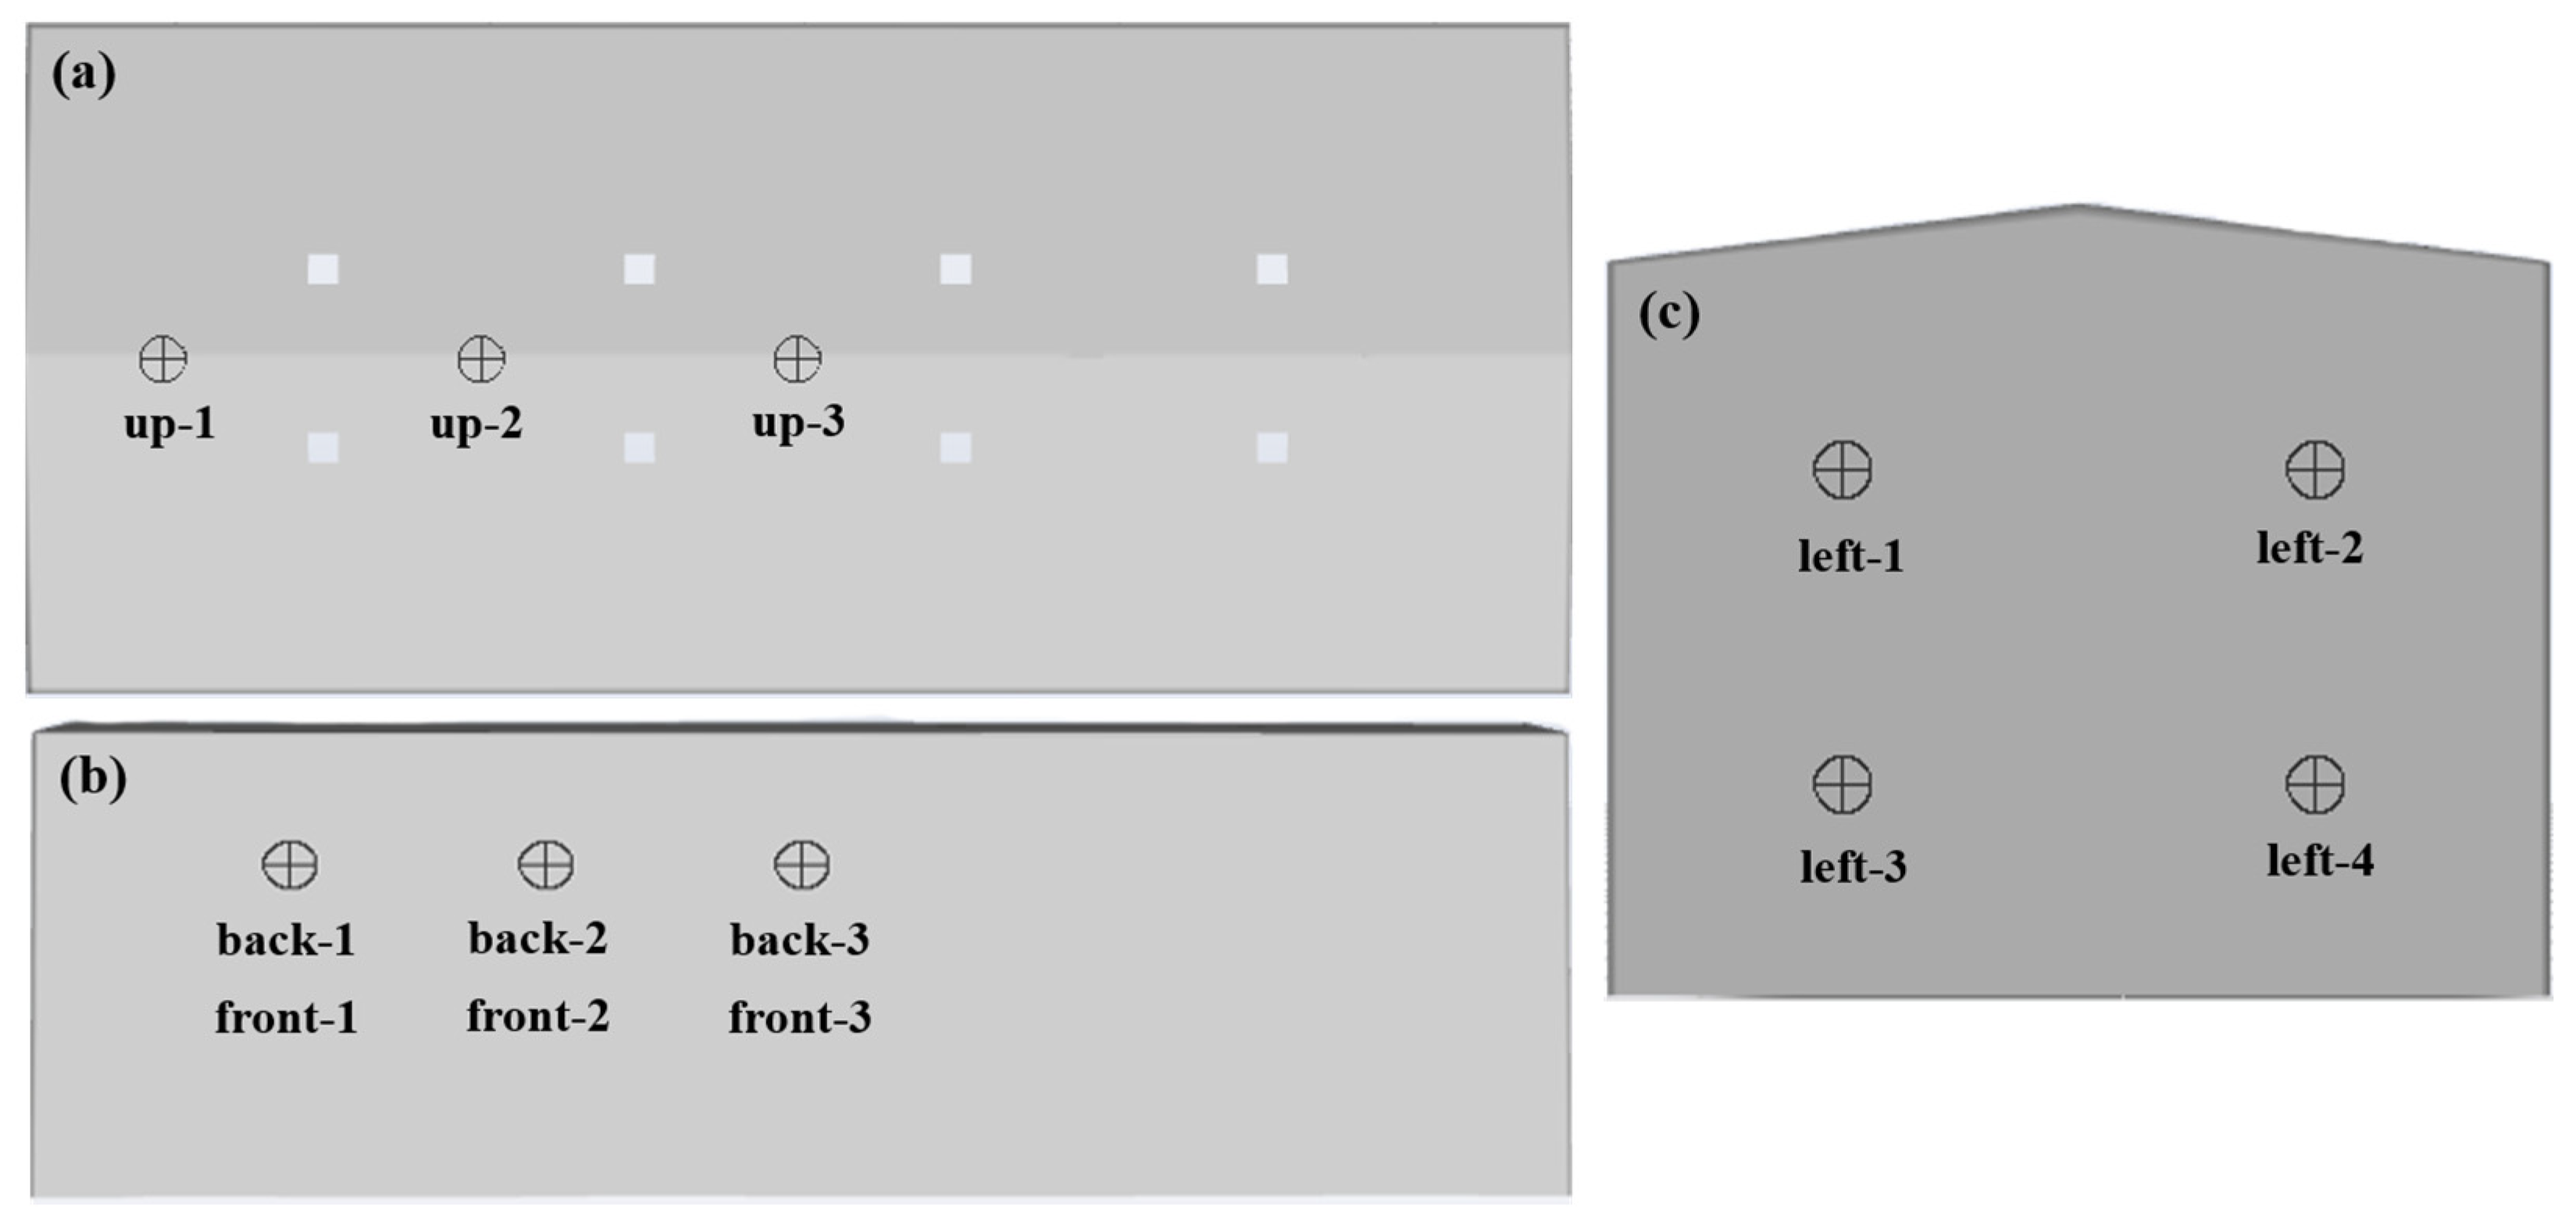
Figure 1. Schematic diagram of the geometric model.
Processes 12 02711 g001
Figure 2. Schematic diagram of hydrogen monitoring points. (a) Top monitoring points; (b) front/rear wall monitoring points; (c) left side monitoring points.
Processes 12 02711 g002
Figure 3. Grid independence test. (a) At up-1 monitoring point; (b) at up-2 monitoring point.
Processes 12 02711 g003
Figure 4. Comparison between experimental results and simulation results.
Processes 12 02711 g004
Figure 5. Hydrogen leakage distribution diagram at the top of the hydrogen purification unit under different wind speeds at t = 5 s. (a) v = 0 m/s; (b) v = 0.2 m/s; (c) v = 0.5 m/s; (d) v = 1.0 m/s (Front view).
Processes 12 02711 g005
Figure 6. Hydrogen leakage distribution diagram at the top of the hydrogen purification unit under different wind speeds at t = 5 s. (a) v = 0 m/s; (b) v = 0.2 m/s; (c) v = 0.5 m/s; (d) v = 1.0 m/s (Top view).
Processes 12 02711 g006
Figure 7. Hydrogen leakage distribution diagram at the top of the hydrogen purification unit at different wind speeds at t = 50 s. (a) v = 0 m/s; (b) v = 0.2 m/s; (c) v = 0.5 m/s; (d) v = 1.0 m/s (Front view).
Processes 12 02711 g007
Figure 8. Hydrogen leakage distribution diagram at the top of the hydrogen purification unit under different wind speeds at t = 50 s. (a) v = 0 m/s; (b) v = 0.2 m/s; (c) v = 0.5 m/s; (d) v = 1.0 m/s (Top view).
Processes 12 02711 g008
Figure 9. Hydrogen mole fraction at different monitoring points. (a) Top monitoring points; (b) left monitoring points; (c) front monitoring points; (d) back monitoring points (v = 0 m/s).
Processes 12 02711 g009
Figure 10. Hydrogen mole fraction under different wind speeds. (a) At up-1 monitoring point; (b) at left-1 monitoring point.
Processes 12 02711 g010
Figure 11. Hydrogen leakage distribution diagram at the rear of the hydrogen purification plant. (a,b) Top view; (c,d) front view.
Processes 12 02711 g011
Figure 12. Hydrogen mole fraction at the rear surface leaks. (a) Top monitoring points; (b) back monitoring points.
Processes 12 02711 g012
Figure 13. Hydrogen leakage distribution diagram at the left of the hydrogen purification plant. (a,b) Top view; (c,d) front view.
Processes 12 02711 g013
Figure 14. Hydrogen mole fraction at the left surface leaks. (a) Left monitoring points; (b) top monitoring points.
Processes 12 02711 g014
Table 1. Numbers and coordinates of monitoring points.
Station NumberCoordinateStation NumberCoordinate
up-1(1.91, 7.5, 0)back-1(3.45, 5, 4.5)
up-2(6.13, 7.5, 0)back-2(6.9, 5, 4.5)
up-3(10.35, 7.5, 0)back-3(10.35, 5, 4.5)
front-1(3.45, 5, −4.5)left-1(0, 5, 2.25)
front-2(6.9, 5, −4.5)left-2(0, 5, −2.25)
front-3(10.35, 5, −4.5)left-3(0, 2, 2.25)
left-4(0, 2, −2.25)
Disclaimer/Publisher’s Note: The statements, opinions and data contained in all publications are solely those of the individual author(s) and contributor(s) and not of MDPI and/or the editor(s). MDPI and/or the editor(s) disclaim responsibility for any injury to people or property resulting from any ideas, methods, instructions or products referred to in the content.

