Article

Finite Element Simulation and Piezoelectric Sensor Array-Driven Two-Stage Impact Location on Composite Structures

1
School of Mechanical and Electrical Engineering, Jinling Institute of Technology, Nanjing 211169, China
2
College of Mechanical and Electrical Engineering, Wenzhou University, Wenzhou 325035, China
*
Author to whom correspondence should be addressed.
Processes 2024, 12(12), 2675; https://doi.org/10.3390/pr12122675
Submission received: 29 October 2024 / Revised: 20 November 2024 / Accepted: 25 November 2024 / Published: 27 November 2024
(This article belongs to the Special Issue Reliability and Engineering Applications (Volume II))

Abstract

:
Impact monitoring is an effective approach to ensuring the safety of composite structures. The accuracy of current algorithms mostly depends on the number of physical sensors, which is not an economical way for large-area composite structures. In order to combine the advantages of sparse and dense arrays, a two-stage collaborative approach is proposed to locate the general areas and precise positions of impacts on composite structures. In Stage I, the steering vector information of the possible position is simulated according to the principle of array sensor signal processing, and a virtual array sparse feature map is constructed. When an actual impact arrives, a similarity algorithm is then used to find the suspected area in the map, which narrows down the search area to a large extent. In Stage II, a compensated two-dimensional multiple signal classification (2D-MUSIC) algorithm-based imaging method is applied to estimate the precise position of the impact in the suspected area. Finally, the accuracy and effectiveness of the proposed method are validated by numerical simulation and experiments on a carbon fiber composite panel. Both numerical and experimental results verify that the two-stage impact location method can effectively monitor composite structures with sufficient accuracy and efficiency.

1. Introduction

Composite materials, especially laminated carbon fiber-reinforced plastics (CFRPs), exhibit superior mechanical performance due to their significantly higher specific stiffness and strength properties [1]. Although composite structures offer many advantages, their inspection and monitoring of barely visible impact damage (BVID) becomes more challenging. Impact damage on composite structures can occur from various low-velocity impacts, such as dropped tools. Therefore, impact monitoring techniques have the potential to significantly improve the efficiency of structural maintenance [2].
Acoustic emissions caused by impacts spread around in composite structures in the form of waves [3]. The responses of the waves are then received by distributed sensors fixed on the structures. Piezoelectric transducers (PZTs) are capable of receiving Lamb waves from large surface areas for detecting impacts. Many studies have been conducted on impact and damage location. Among them, model-based techniques are one of the basic approaches which establish a physical model based on time of flight (TOF) and geometric relationships. Yang et al. [4] used guided waves to extract damage information and locate damage. Jiang et al. [5] established modal acoustic emission parameters to extract damage. Memmolo et al. [6] developed a guided wave-based structural health monitoring system for damage assessment. Zhao et al. [7] applied laser-generated guided waves to assess two kinds of damage.Hu et al. [8] proposed a RAPID algorithm to locate damages under liquid-filled conditions. Most of the existing literature adopts a sparse sensor arrangement that can accurately capture the sources of information within a certain local area. However, for large-area composite structure monitoring, more physical sensors need to be placed over the entire monitoring area to improve the effectiveness and accuracy.
Another array sensor arrangement in compact form consists of a few PZT elements arranged along a line or circle at a uniform pitch. This arrangement has been proven to allow for the fast and efficient inspection of a certain size of area and offers a cost-effective way to automate the interrogation process. Purekar et al. [9] constructed a phased sensor array for detecting delamination damages in thin composite laminates. Engholm [10] constructed a uniform circular array to estimate the direction of arrival of Lamb waves on aluminum plates. Ren et al. [11] constructed a linear piezoelectric (PZT) sensor array and proposed a scanning spatial-wavenumber filter-based imaging method for multiple damages on aircraft composite structures. Zhong et al. [12] constructed a plum-blossom sensor array to realize omni-directional impact localization for composite plates using two-dimensional multiple signal classification. Although the above array sensor arrangements based on source localization methods are effective for simple structures, their main challenge is sensitivity to gain-phase errors induced by factors of uncertainty such as anisotropy [13] or the operating environment [14].
From the literature review, the sparse sensor arrangement-based approaches divide the monitoring range into small areas, and the advantage is that the impact signal characteristics in the small area can be well obtained, but a large number of physical sensors is needed to form a network. In addition, the array signal processing method densely arranges some sensors in a certain area of the monitoring area, and can realize omnidirectional monitoring by phase or frequency control, but the anisotropy and attenuation of composite materials will reduce the monitoring accuracy and efficiency. It appears evident that combining the advantages of sparse and array sensor arrangements may be an effective way for locating damages using Lamb wave processing. And the Finite Element Method (FEM) is crucial in obtaining a prior understanding of the impact-induced flexural wave modes and mechanisms [15]. To combine the advantages of sparse and dense arrays, a two-stage collaborative approach is proposed to locate the general areas and precise position of impacts on composite structures. The steering vector information of the possible position is firstly simulated according to the principle of array sensor signal processing, and a virtual array sparse feature map is constructed. Then, a compensated two-dimensional multiple signal classification (2D-MUSIC) algorithm-based imaging method is applied to estimate the precise position of the impact.
The structure of this article is as follows: Section 2 derives the hybrid physics model-based two-stage impact location method. In Section 3, numerical and experimental verifications on a carbon fiber composite panel are conducted, and Section 4 presents the conclusion and suggestions for further research.

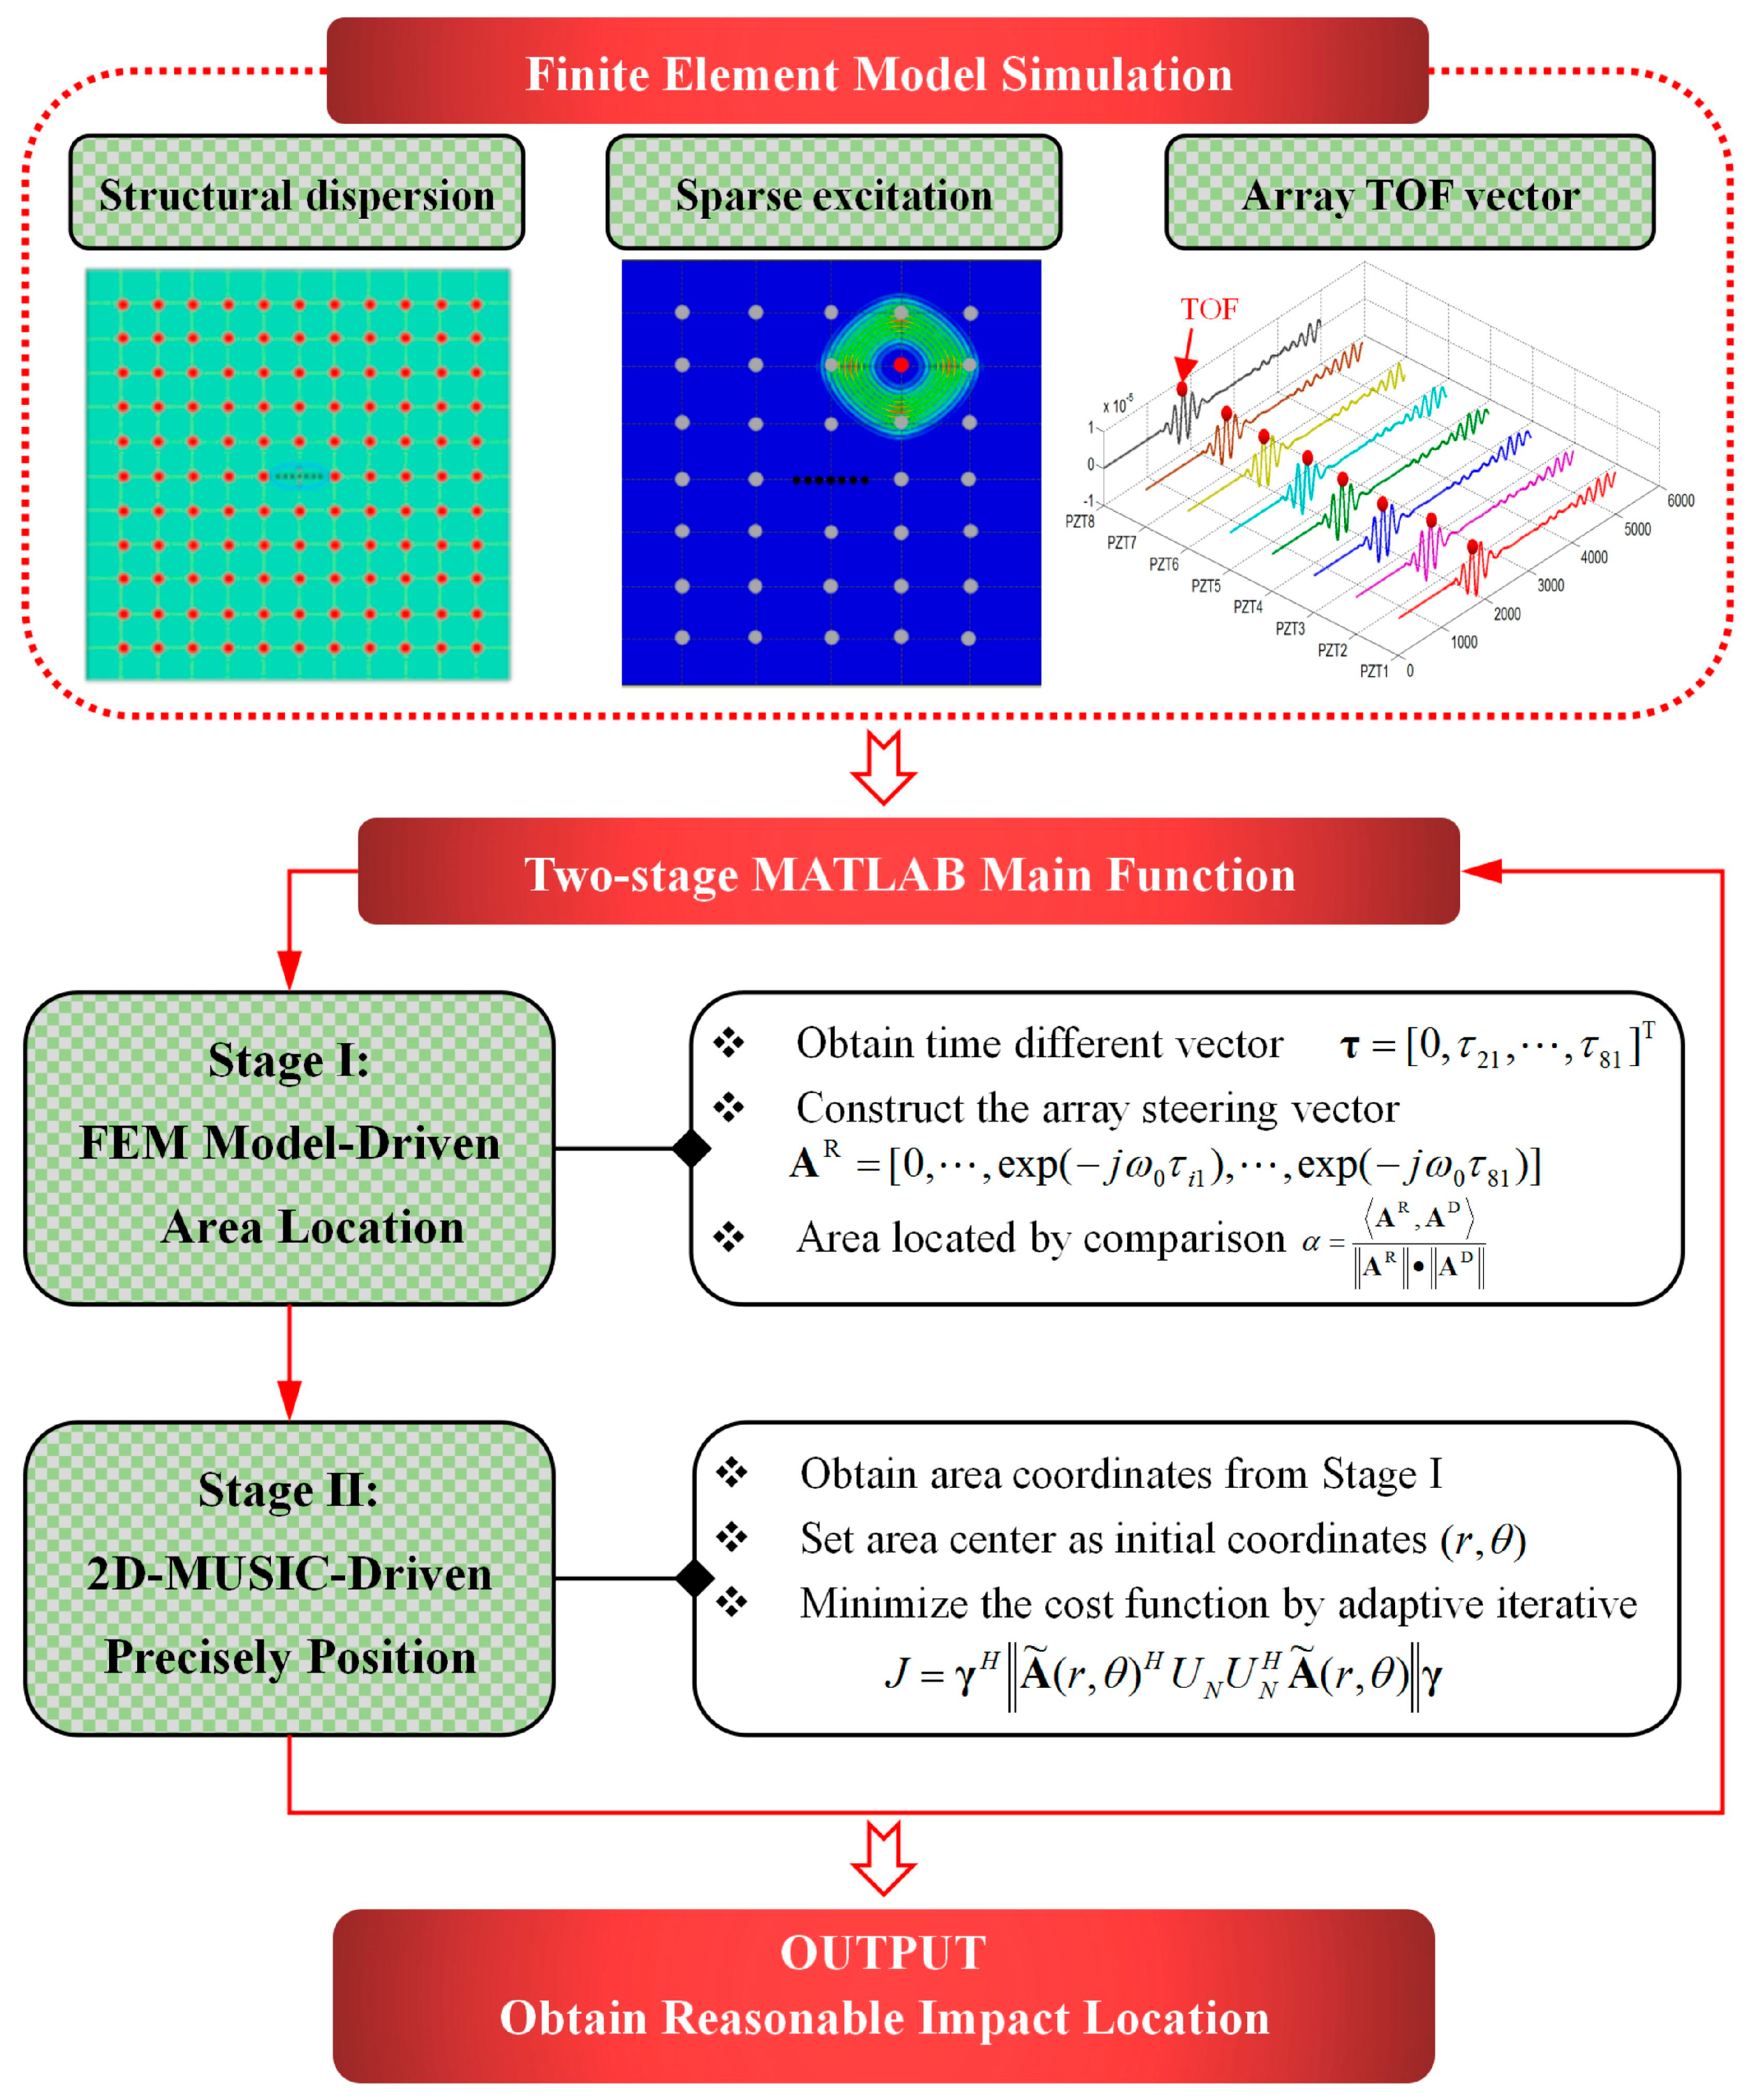
2. Two-Stage Impact Location Method

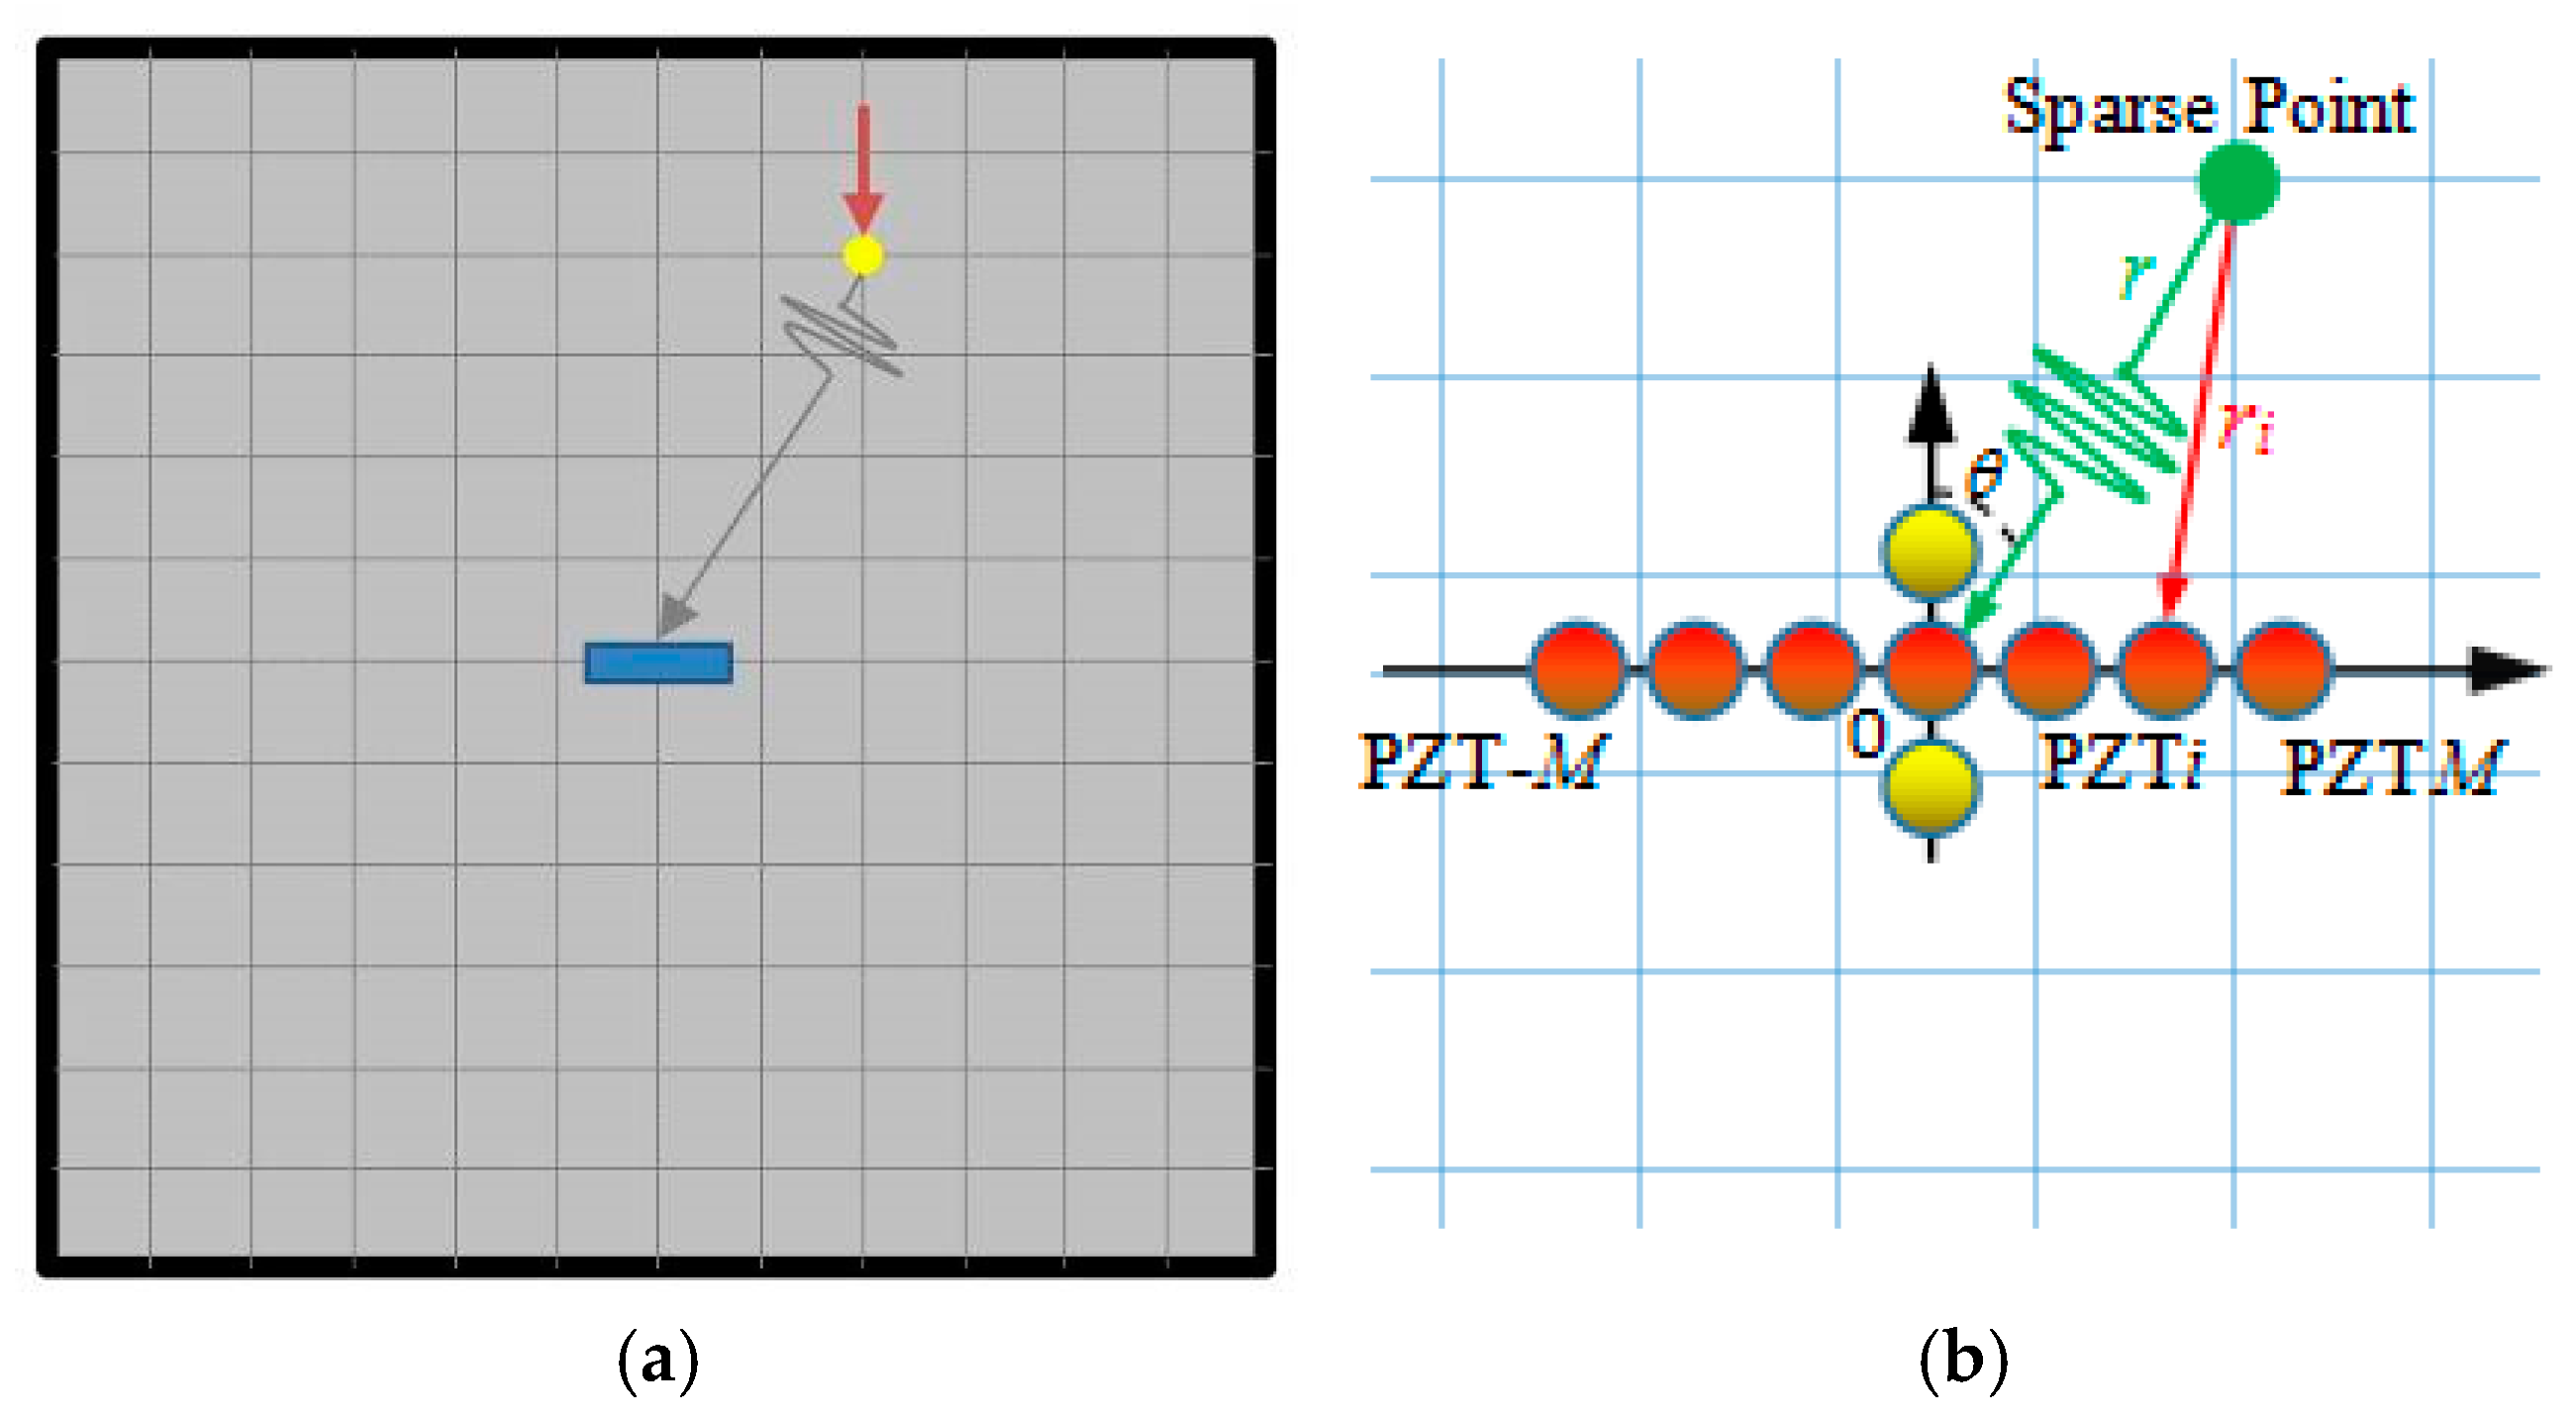
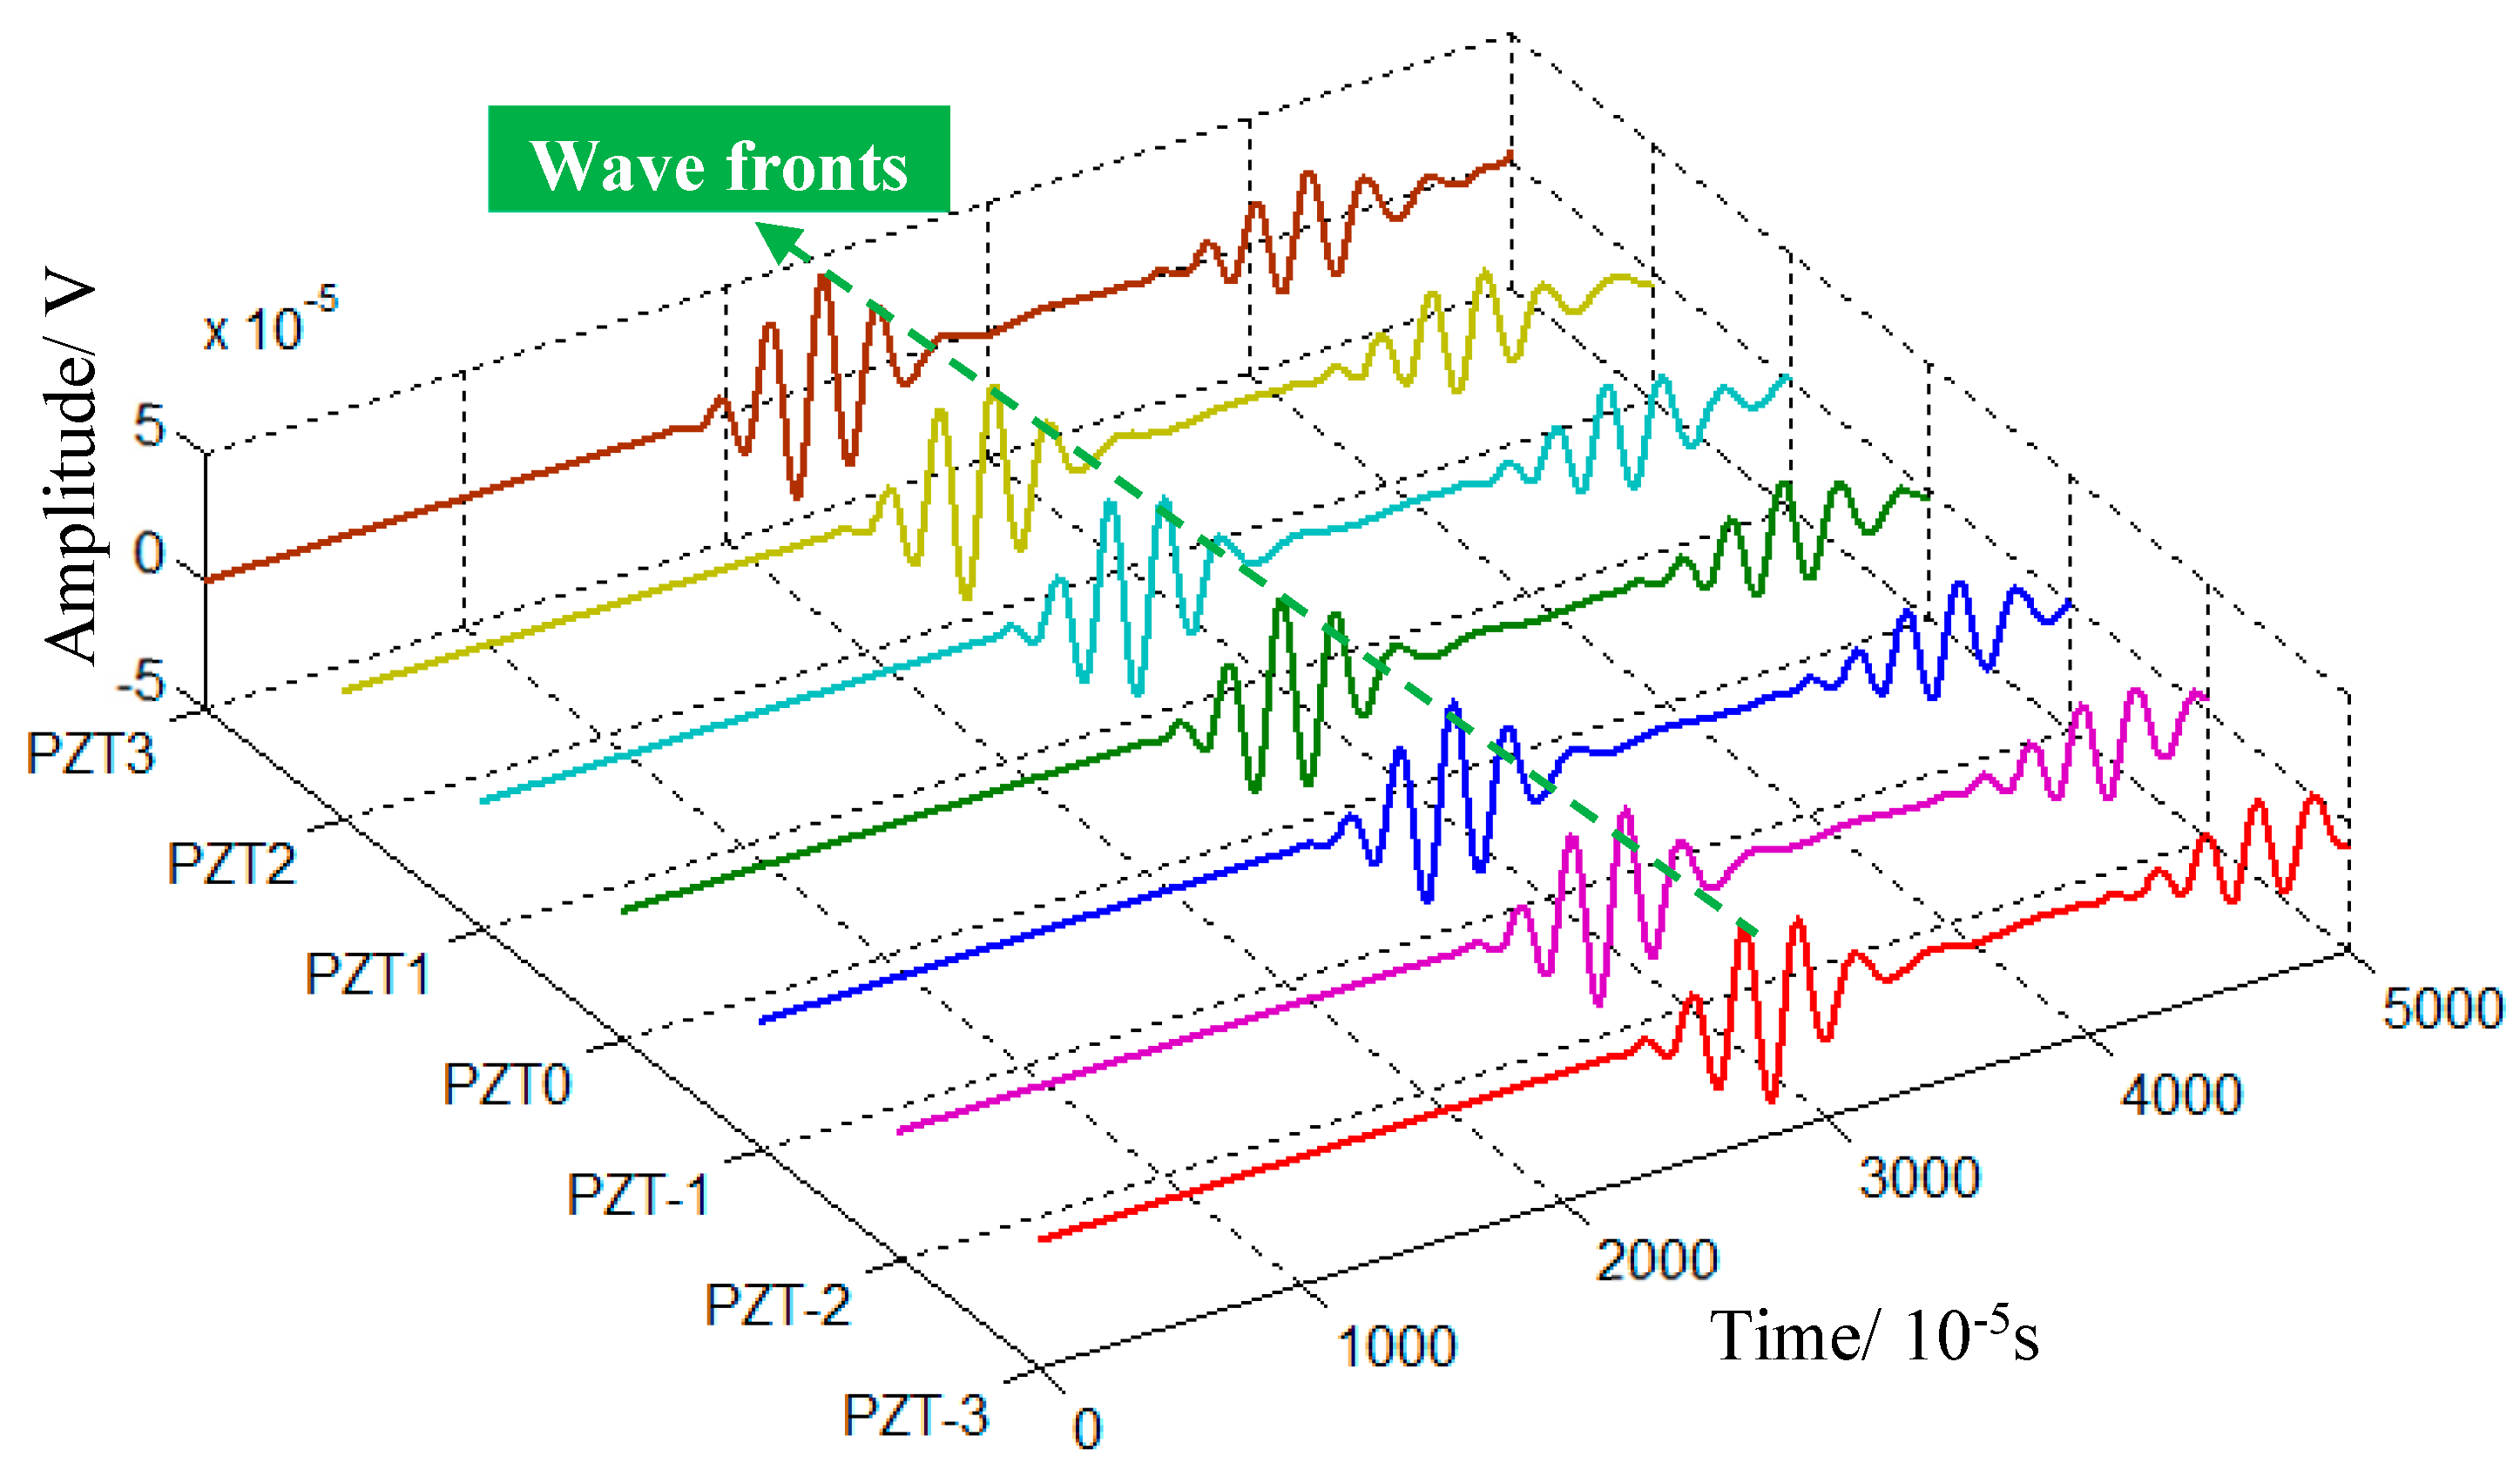
2.1. Array Signal Model

The monitoring area can be divided into small grids, with each intersection point being regarded as a potential impact source. Let us assume that an impact occurred at a sparse location. This sparse location is defined in terms of an elevation polar coordinate system (r, θ). Two × M piezoelectric (PZT) sensors are arranged on the plate. The distance between two sensors is d ≤ λ/2, where λ is the wavelength of wave signal. The far-field assumption assumes that the wave source is located at a distance far away from the sensors which can be regarded as planar waves. However, impacts often happen near the sensors. For the near-field situation, the wave fronts of the elastic waves can only be considered to be spherical other than planar, and a near-field array signal should be modeled to perform the impact monitoring of composite structures. As shown in Figure 1, θ denotes the angle of wave propagating direction with respect to the horizontal axis, r is defined as the distance between the impact source and the origin of the polar coordinates, and ri is defined as the distance between the impact source and the ith PZT.
Considering that a certain frequency ω0 component extracted from the impact-induced flexural wave arrives at the sensor PZT 0, the corresponding output s 0 ( t ) can be presented as
s 0 ( t ) = u 0 ( t ) e j ( ω 0 t k r )
where u 0 ( t ) is the signal output amplitude at the sensor PZT 0, k = ω 0 / c is the wavenumber, and c is average velocity. In this case of uniform linear array, Δ r i 0 is defined as the difference between the propagation distance r from the sparse point to the reference PZT0, and the propagation distance ri from the sparse point to the PZT i, and the corresponding output s i ( t i ) can be presented as
s i ( t i ) = u i ( t i ) e j { ω 0 t k r i } = u i ( t i ) e j { ω 0 t k [ r Δ r i 0 ] } , M i M
where u i ( t i ) is the signal output amplitude at the sensor PZT i. τ i 0 is defined as the time difference between the waves arrived at PZT 0 and PZT i, and Equation (2) can be rewritten as
s i ( t i ) = u 0 ( t τ i 0 ) e j ( ω 0 t k r ) e j k Δ i 0 = u 0 ( t τ i 0 ) e j ( ω 0 t k r ) e j ω 0 Δ r i 0 / c
That is,
τ i 0 = Δ r i 0 c
Since τ i 0 has only several orders of magnitude of the reciprocal of the frequency (kHz), the output amplitude difference by PZT of this array can be neglected, so that
u i ( t i ) = u 0 ( t 0 τ i 0 ) u 0 ( t 0 )
Then, the corresponding output s i ( t ) can be presented using the reference element s 0 ( t )
s i ( t i ) = s 0 ( t ) e j ω 0 τ i 0
This shows that the output signal of each sensor is mainly manifested by a phase delay. In an array signal model, the array steering vector is commonly used to indicate the changes in phase delay, which can be presented as
a i ( r , θ ) = e j ω 0 τ i 0 = exp ( 2 π f Δ r i 0 / c )
where f denotes the center frequency. By substituting the difference in arrival time in Equation (4), Δ r i 0 can be established using the triangular relationship
τ i 0 = Δ i 0 c = r r 2 + ( i 1 ) 2 d 2 2 r ( i 1 ) d sin θ c , M i M
For the whole PZT sensors array, the array steering vector could be represented as
A ( r , θ ) = [ a M ( r , θ ) , a M + 1 ( r , θ ) , , a 0 ( r , θ ) , , a M ( r , θ ) ] T
Therefore, for an arbitrary suspected impact on the plate, its steering vector relative to the PZT array is unique. In this study, the array steering vector is defined as an array sparse feature. Finite element simulation is one of the best methods to obtain all sparse array features of a particular structure.

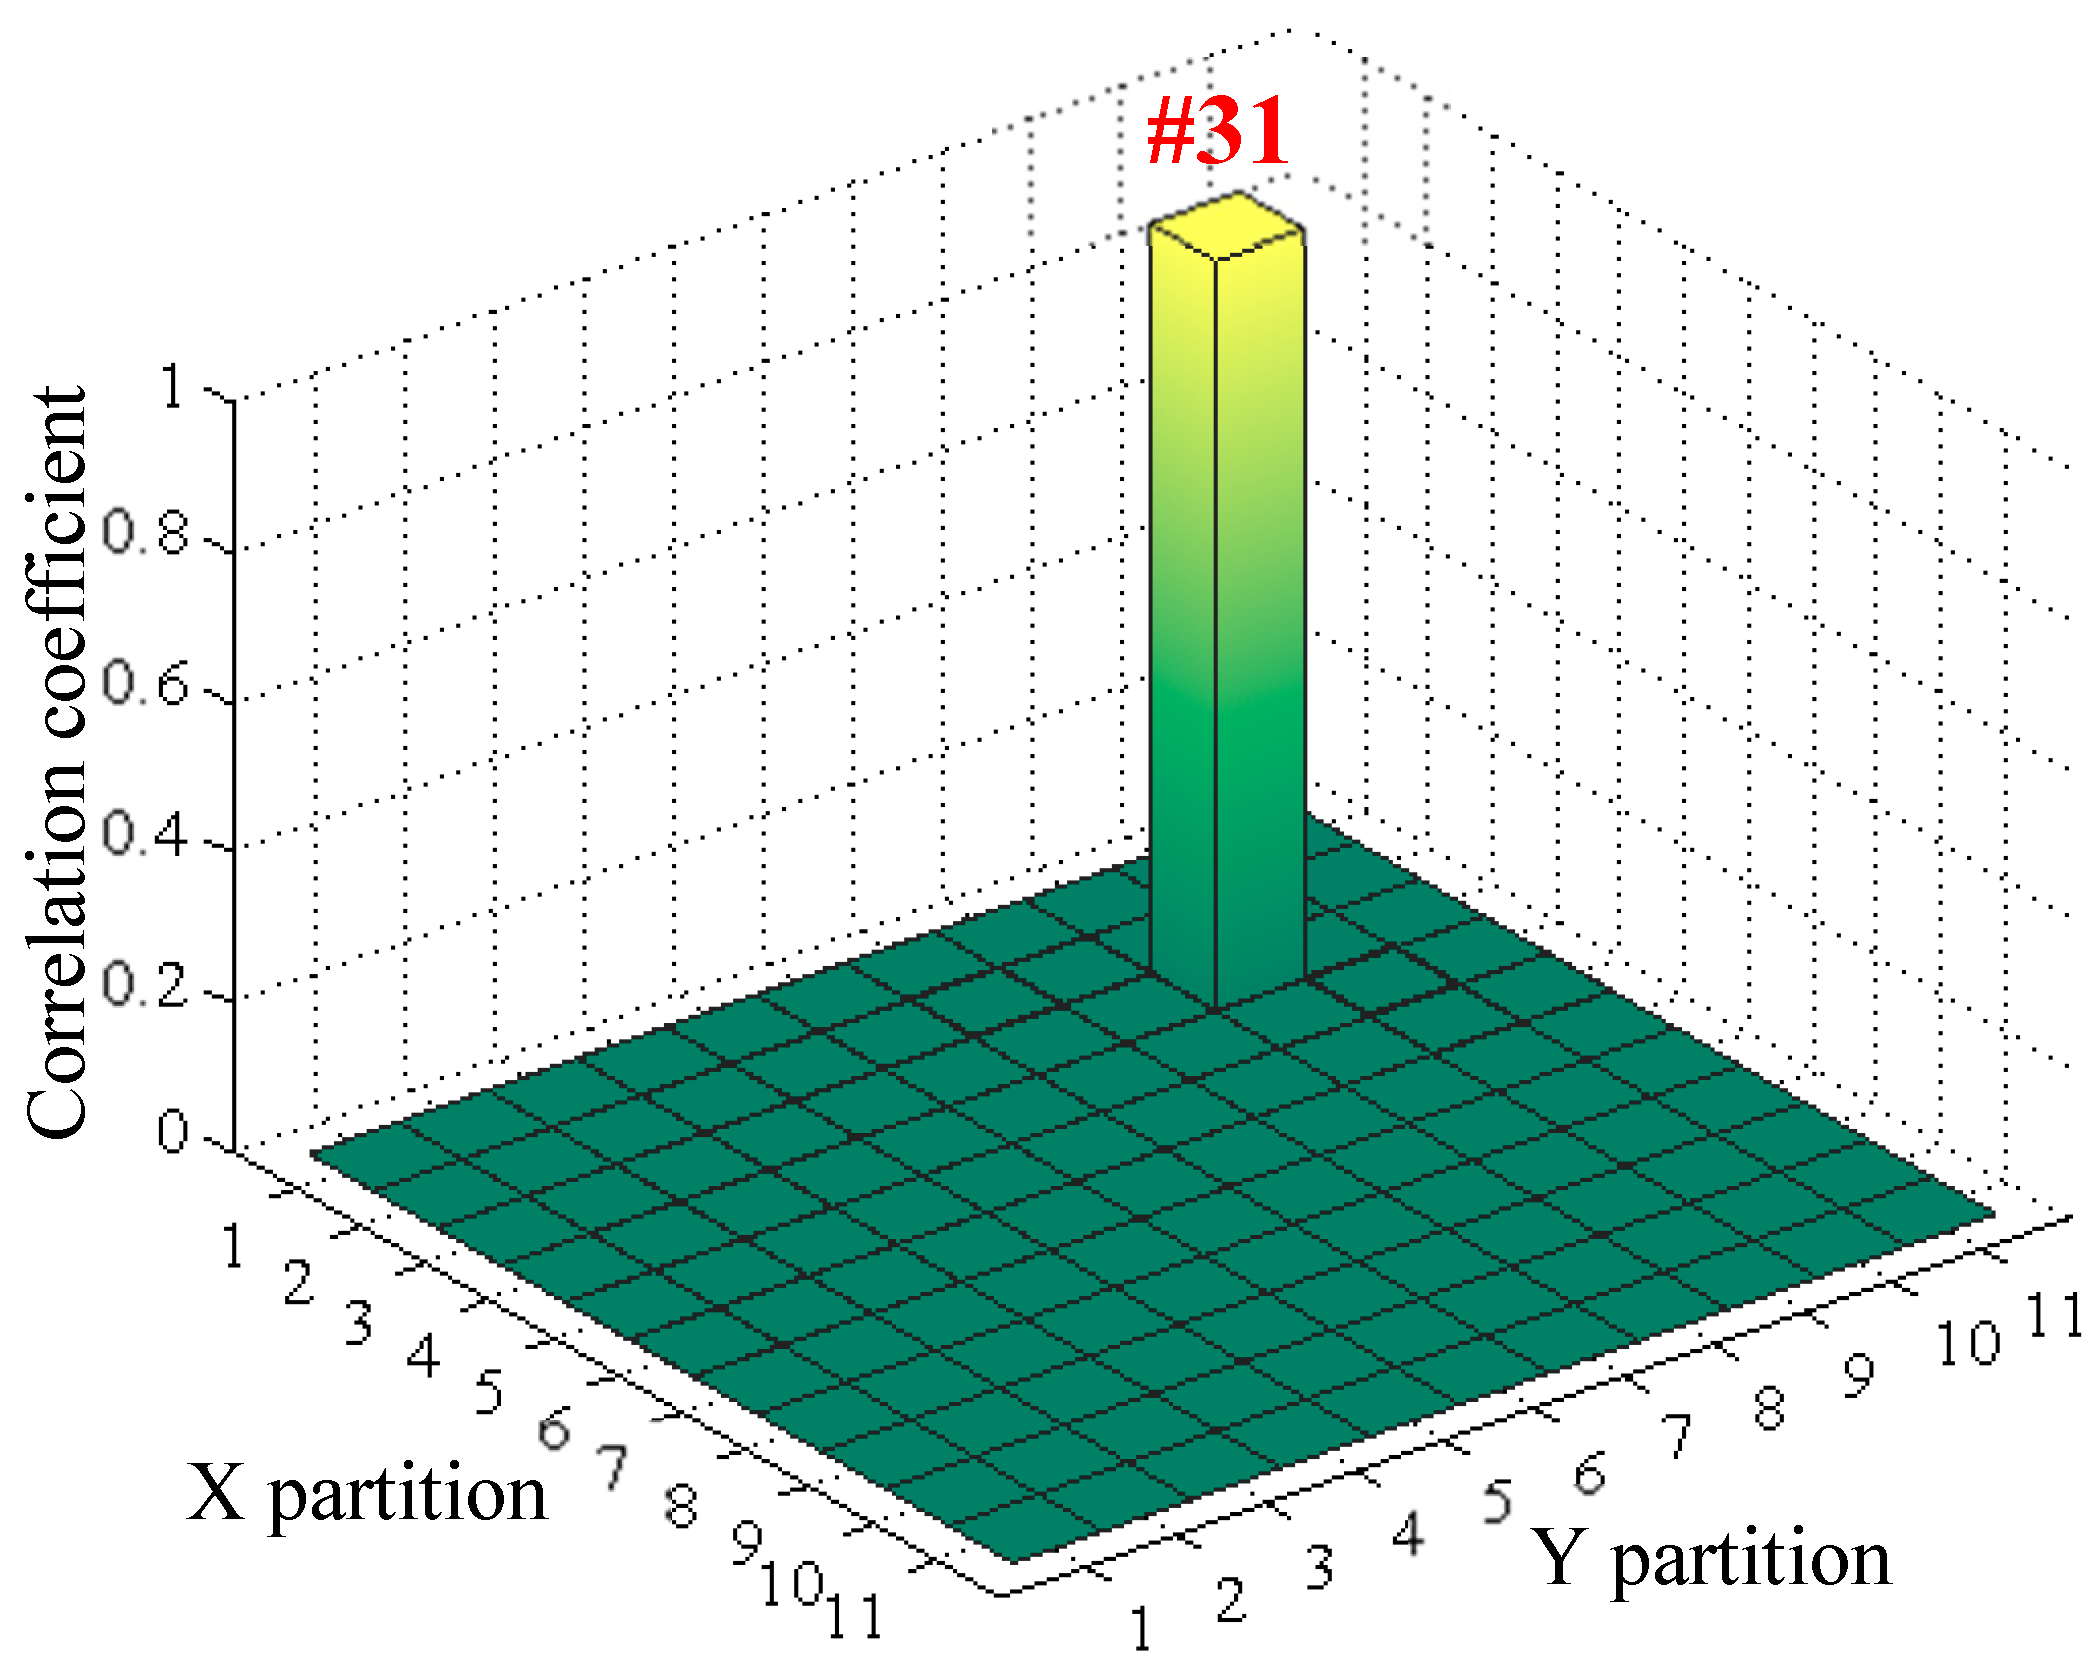
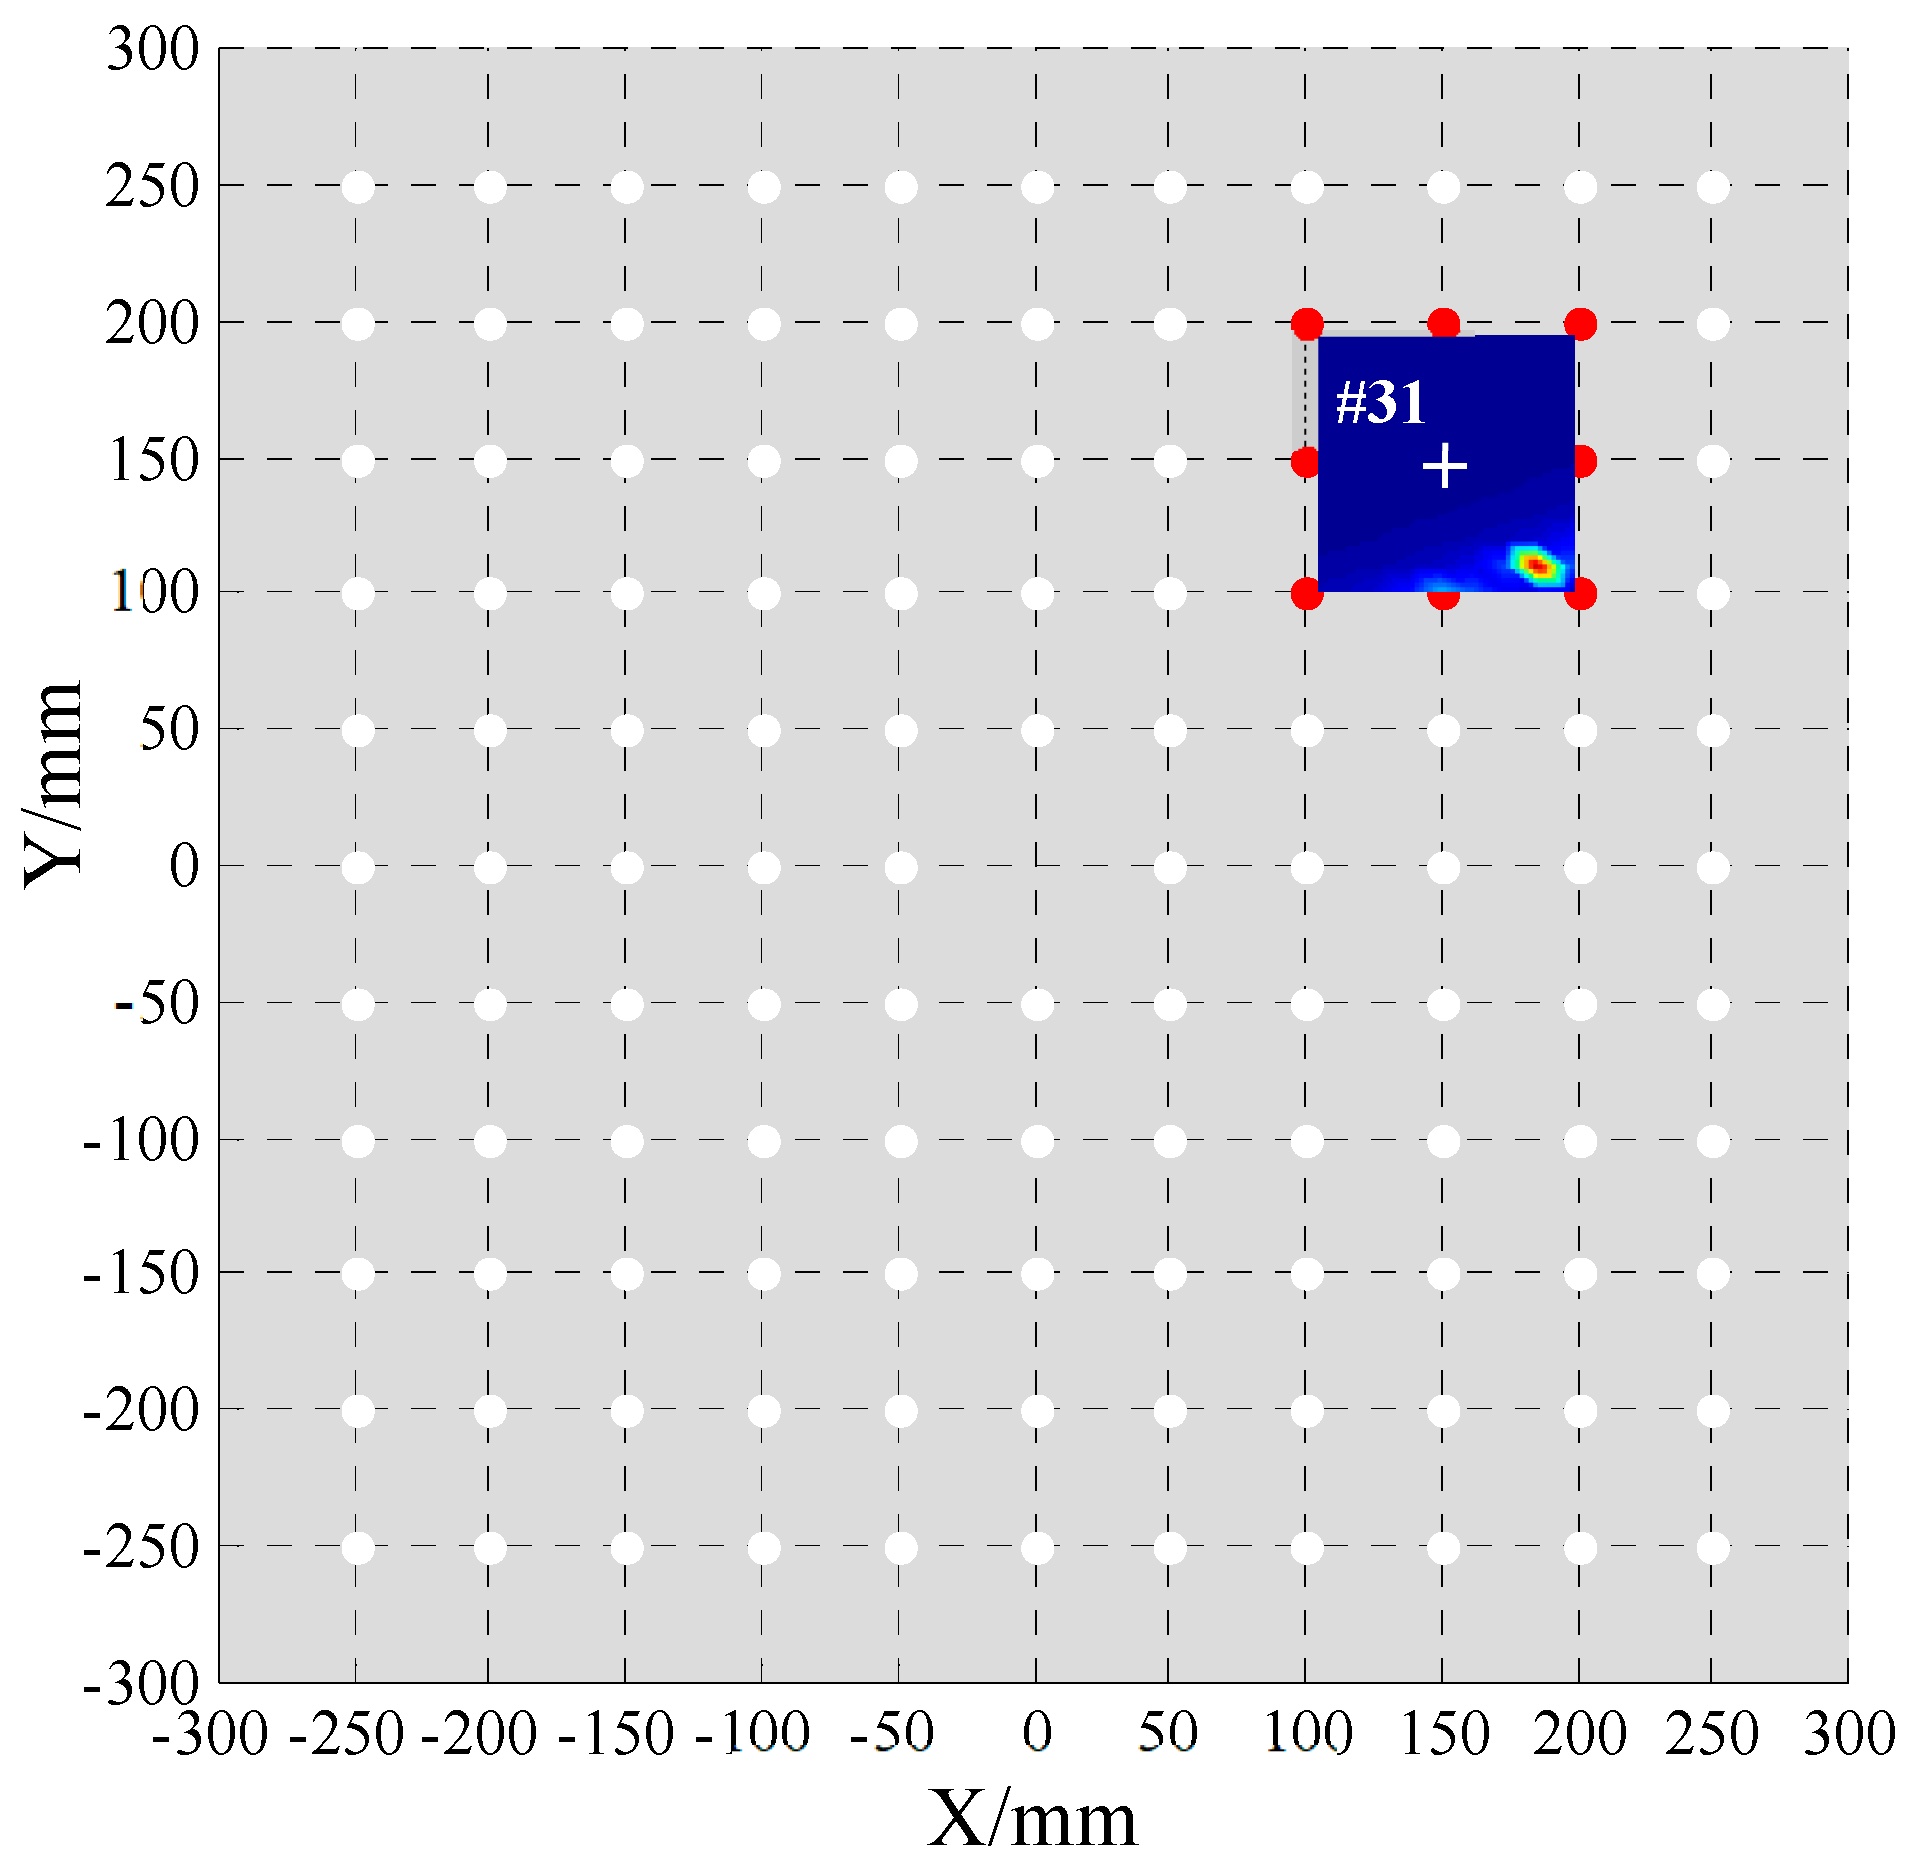
2.2. FEM Model-Driven Area Localization

The array signals are received in response to a simulated impact-induced flexural wave at a sparse point. Wave fronts are clearly visible in each sensor signal and can be termed as direct waves for measuring the time of arrival (TOA). Hilbert transform is applied to extract the envelope curves of the array signals at a specific frequency. The peaks of these direct wave envelopes are selected to measure the time of flight (TOF) t i . Consequently, the TOFs of the responded array signals can be obtained as a column vector T
T = [ t M , , t i , , t M ] T , M i M
Then, the time different vector τ i 0 with the PZT 0 as a reference
τ = [ τ M 0 , , τ i 0 , , τ M 0 ] T , M i M
And the virtual array steering vector A R for reference
A R = [ exp ( j ω 0 τ M 0 ) , , exp ( j ω 0 τ i 0 ) , , exp ( j ω 0 τ M 0 ) ] T , M i M
By repeatedly simulating excitation at all sparse points, a virtual array sparse feature map is established and saved. When Lamb waves are emitted as a result of impacts, each PZT sensor in the array can obtain both the direct wave and the scattered signal echoes. Additionally, the array steering vector corresponding to the damage signals (denoted as AD) can also be derived. The location of these damages can be determined by comparison α using the following formula
α = A R , A D A R · A D

2.3. Two-Dimensional MUSIC Algorithm-Driven Precise Position

In the suspicious area, the compensated 2D-MUSIC method proposed in the authors’ previous work [16] is used in impact imaging to precisely establish the distance and direction. Firstly, the narrow-band signal x i ( t ) considering background noise n ( t ) could be represented as
x i ( t ) = r r i s 0 ( t ) e j ω 0 τ i 0 + n i ( t )
Then, the whole array response signals are integrated as
X ( t ) = A ( r , θ ) s 0 ( t ) + N ( t )
And
X ( t ) = [ x M ( t ) , , x 0 ( t ) , , x M ( t ) ] T A ( r , θ ) = [ a M ( r , θ ) , , a 0 ( r , θ ) , , a M ( r , θ ) ] T N ( t ) = [ n M ( t ) , , n 0 ( t ) , , n M ( t ) ] T
In the compensated 2D-MUSIC method, by considering the uncertain factor effects, the gain-phase errors matrix Γ is constructed as
Γ ( r , θ ) = d i a g [ Γ M ( r , θ ) , Γ 0 ( r , θ ) , , Γ M ( r , θ ) ]
The gain-phase error of the PZT i with gain-phase errors is
Γ i ( r , θ ) = exp [ j ω 0 ( τ ^ i 0 τ i 0 ) ] = exp ( j ω 0 Δ τ i 0 ) , i = M , , 0 , , M
The signal steering vector in Equation (9) after compensation is performed as
A ˜ ( r , θ ) = Γ ( r , θ ) A ( r , θ )
The basic idea of the MUSIC algorithm is to eigen-decompose the covariance matrix of the observed signal vector from the sensor array, and obtain the signal subspace and noise subspace. The covariance matrix of whole response signals is
R ˜ = 1 N X X H = U S Σ S U S H + U N Σ N U N H
where Us and UN mean the signal subspace and the noise subspace corresponding to the largest eigenvalue Σ S and the small eigenvalues Σ N , N denotes the sampling length, and H is the conjugate transpose.
The spatial spectrum can be computed as
P MUSIC ( r , θ ) = 1 A ˜ H ( r , θ ) U N U N H A ˜ ( r , θ )
where the area localization (sparse point) in Section 2.2 is considered as the initial estimate value of the impact location for the adaptive iterative method. By constructing a cost function J, the precise estimates of (r, θ) could be acquired by minimizing the cost function. The schematic diagram presented in Figure 2 illustrates the hybrid physics model for two-stage impact localization.

3. Numerical and Experimental Verification

3.1. FEM Model

A finite element analysis model of a carbon fiber composite panel was created in ABAQUS with the ply sequence [0/45/0/−45/0/45/90/−45/0/45/0/−45/0]. The material parameter are listed in Table 1. The finite element analysis model is shown in Figure 3. The panel FEM model is divided into regions to form 120 cross sparse points, whose numbers from the inside out are #1~#120. To meet the signal model of circular array above, eight nodes are selected to simulate PZTs as receivers, and the spacing d of their adjacent elements is set to 10 mm. C3D8I three-dimensional solid elements are used in the FEM model. The element size l e is set to 1 mm to satisfy the condition.
A Lamb wave with an excitation frequency of 50 kHz is selected for the impact-induced flexural wave at each sparse point. The time step and the sampling time are set to 0.1 μs and 0.5 ms, respectively. Wave fronts appear obviously in each signal of the sensor array to measure the time of arriving, and their peaks of direct waves are selected to measure the TOF using Equation (10). By repeated simulation excitation at all sparse points, the virtual array sparse feature map is established.

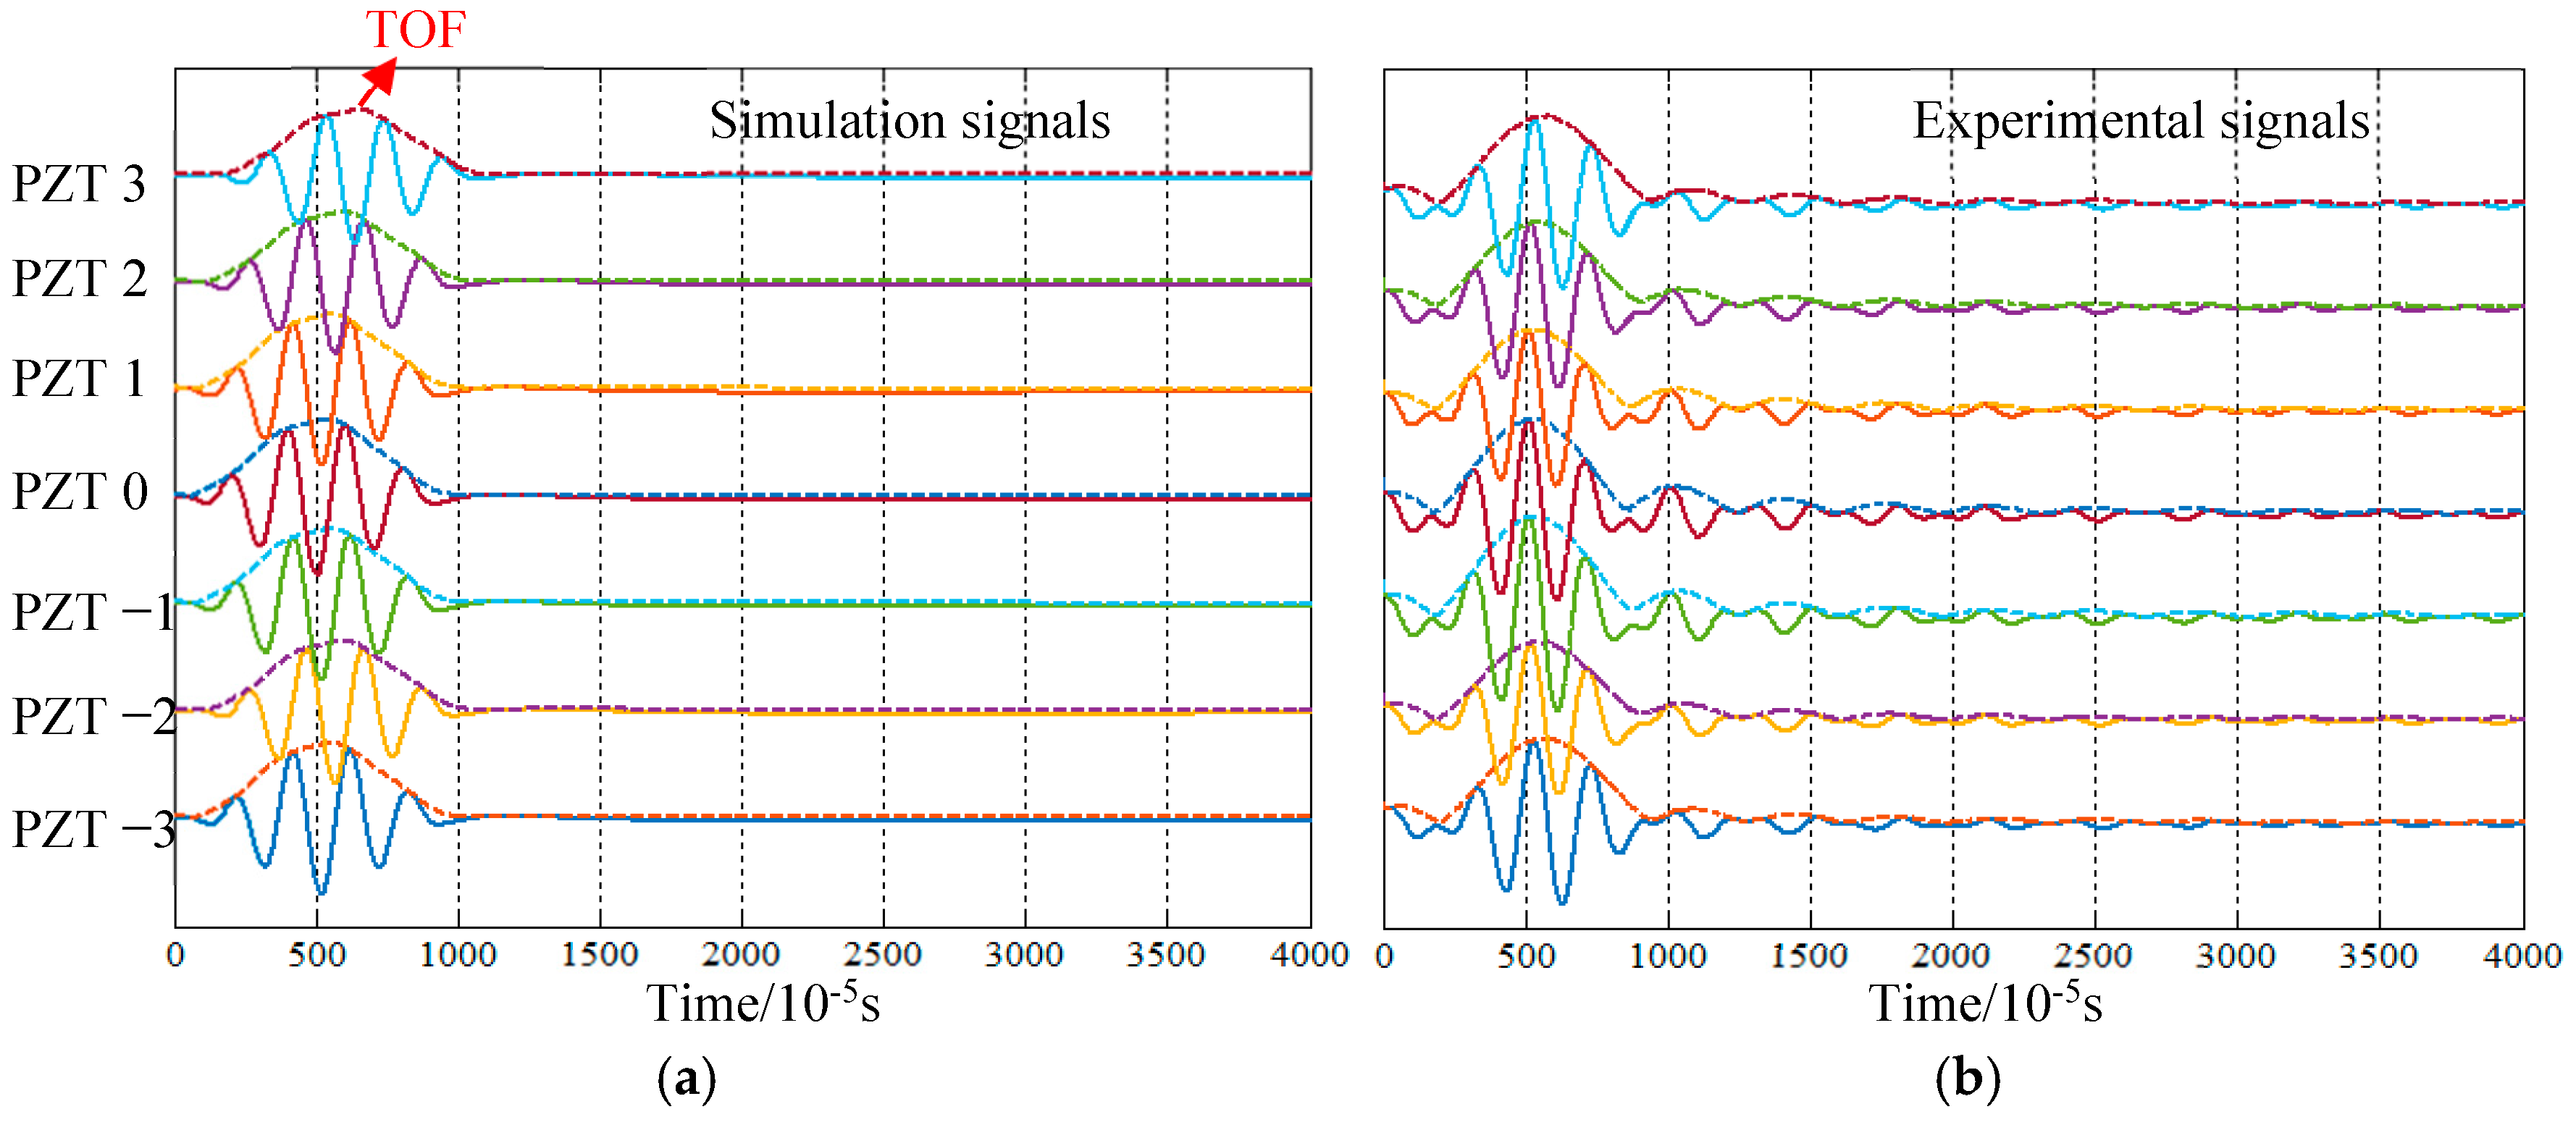
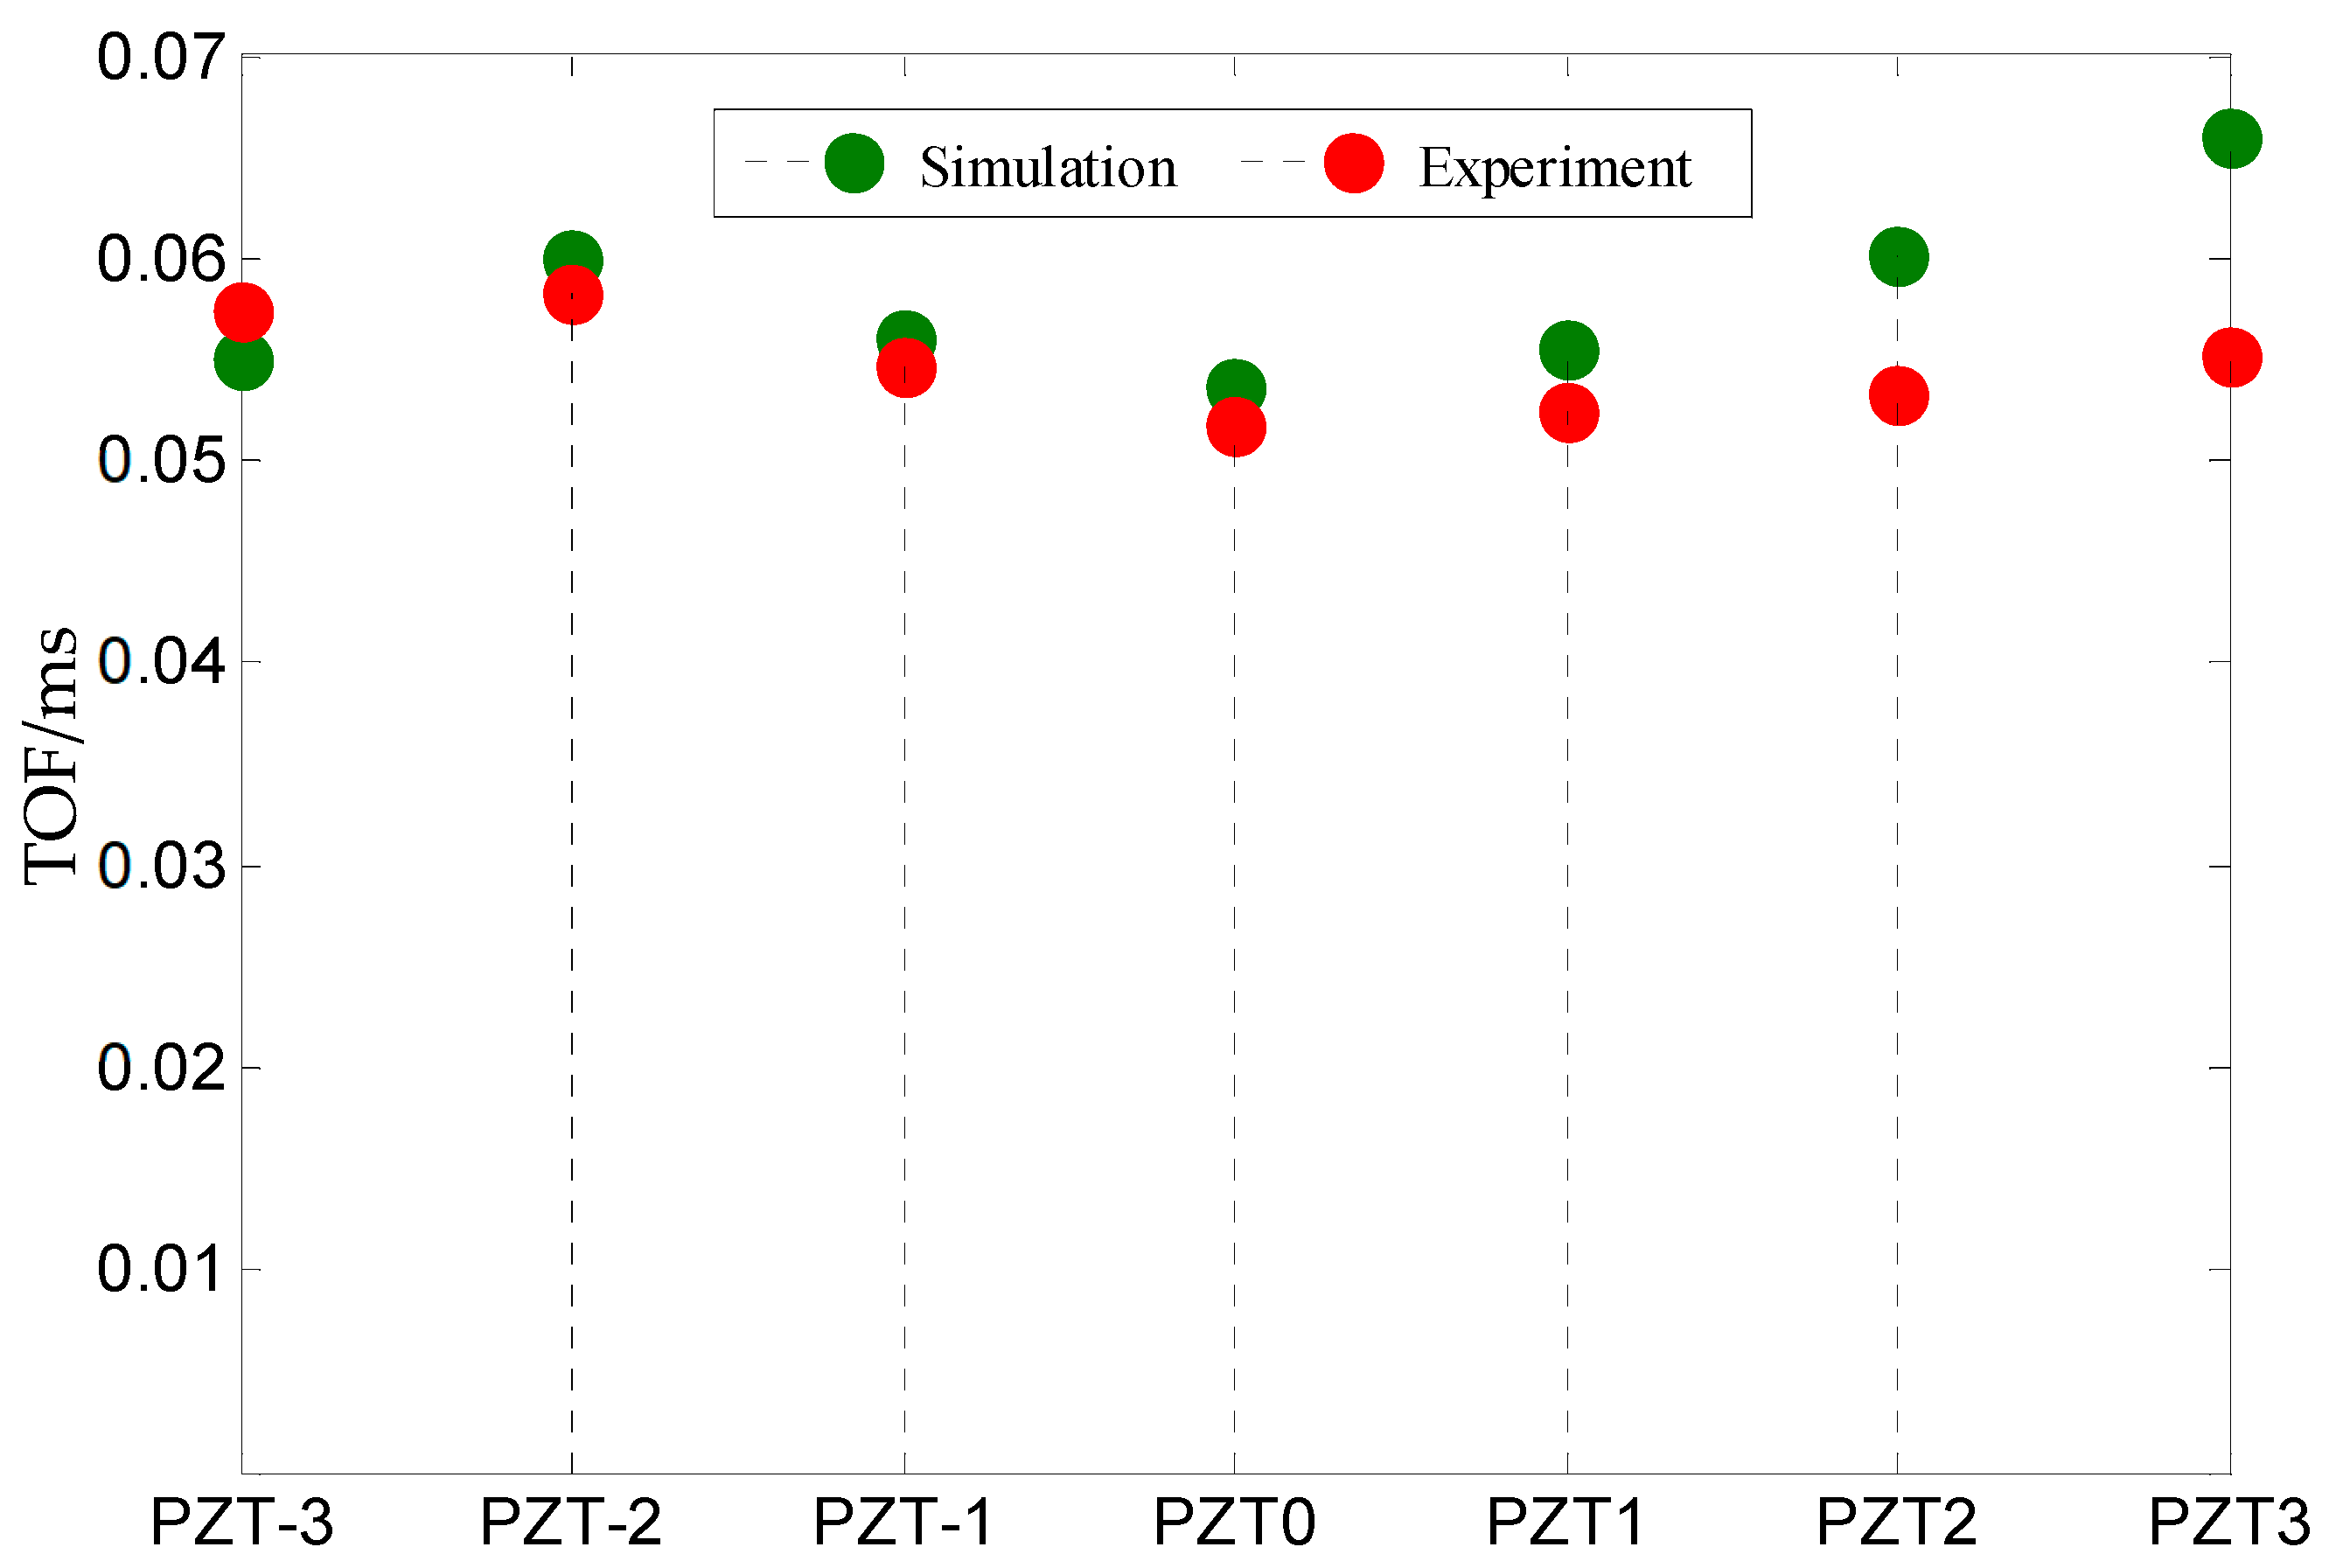
3.2. Numerical Verification

In this section, simulation cases that did not belong to sparse points are first verified. These cases are located at the positions (180 mm, 110 mm), labeled as S1, (−80 mm, 130 mm), labeled as S2, and (120 mm, −120 mm), labeled as S3. Taking (180 mm, 110 mm), labeled as S1, as an example, the array signals were received in response to a simulated impact-induced flexural wave at that position, as shown in Figure 4. Wave fronts appeared clearly in the array signal. Based on the direct wave of each array element depicted in the figure, the peaks of the wave packets were selected to measure each time of flight (TOF) using the Hilbert transform, and these measurements were organized into a column vector. This vector was then used to represent the steering vector AD of the array sensor for stage I area localization. The simulated impact could be located by comparing it with the reference array steering vector AR in the virtual array sparse feature map simulated by the finite element simulation. Since the real impact location was not known in actual applications, one must compare the measured steering vector with the entire virtual array sparse feature map. The localization imaging result is shown in Figure 5.
From the area localization of Stage I, eight points near the sparse point #31 were selected and enclosed within a small imaging area. This demonstrates that the search area can be significantly narrowed down during precise positioning using the 2D-MUSIC algorithm. The spatial spectrum for the S1 case, applied at (180 mm, 110 mm), is shown in Figure 6. The color represents the magnitudes at each search point. In the figure, the deepest point indicates the localized impact position. The highest test pixel point in the figure corresponds to the predicted impact point (180 mm, 108 mm). Figure 6 indicates that the typical cases were successfully detected, with errors of 0 mm and 2 mm, respectively. The other three cases, including (−80 mm, 130 mm) labeled as S2 and (120 mm, −120 mm) labeled as S3, are also listed in Table 2. The predicted positions are consistent with the actual impact locations. The location results and their errors for these three cases, compared with actual impact damages, are also listed in Table 2. The numerical verification confirms that the hybrid physics model-based two-stage impact localization method can effectively monitor composite structures with high accuracy.

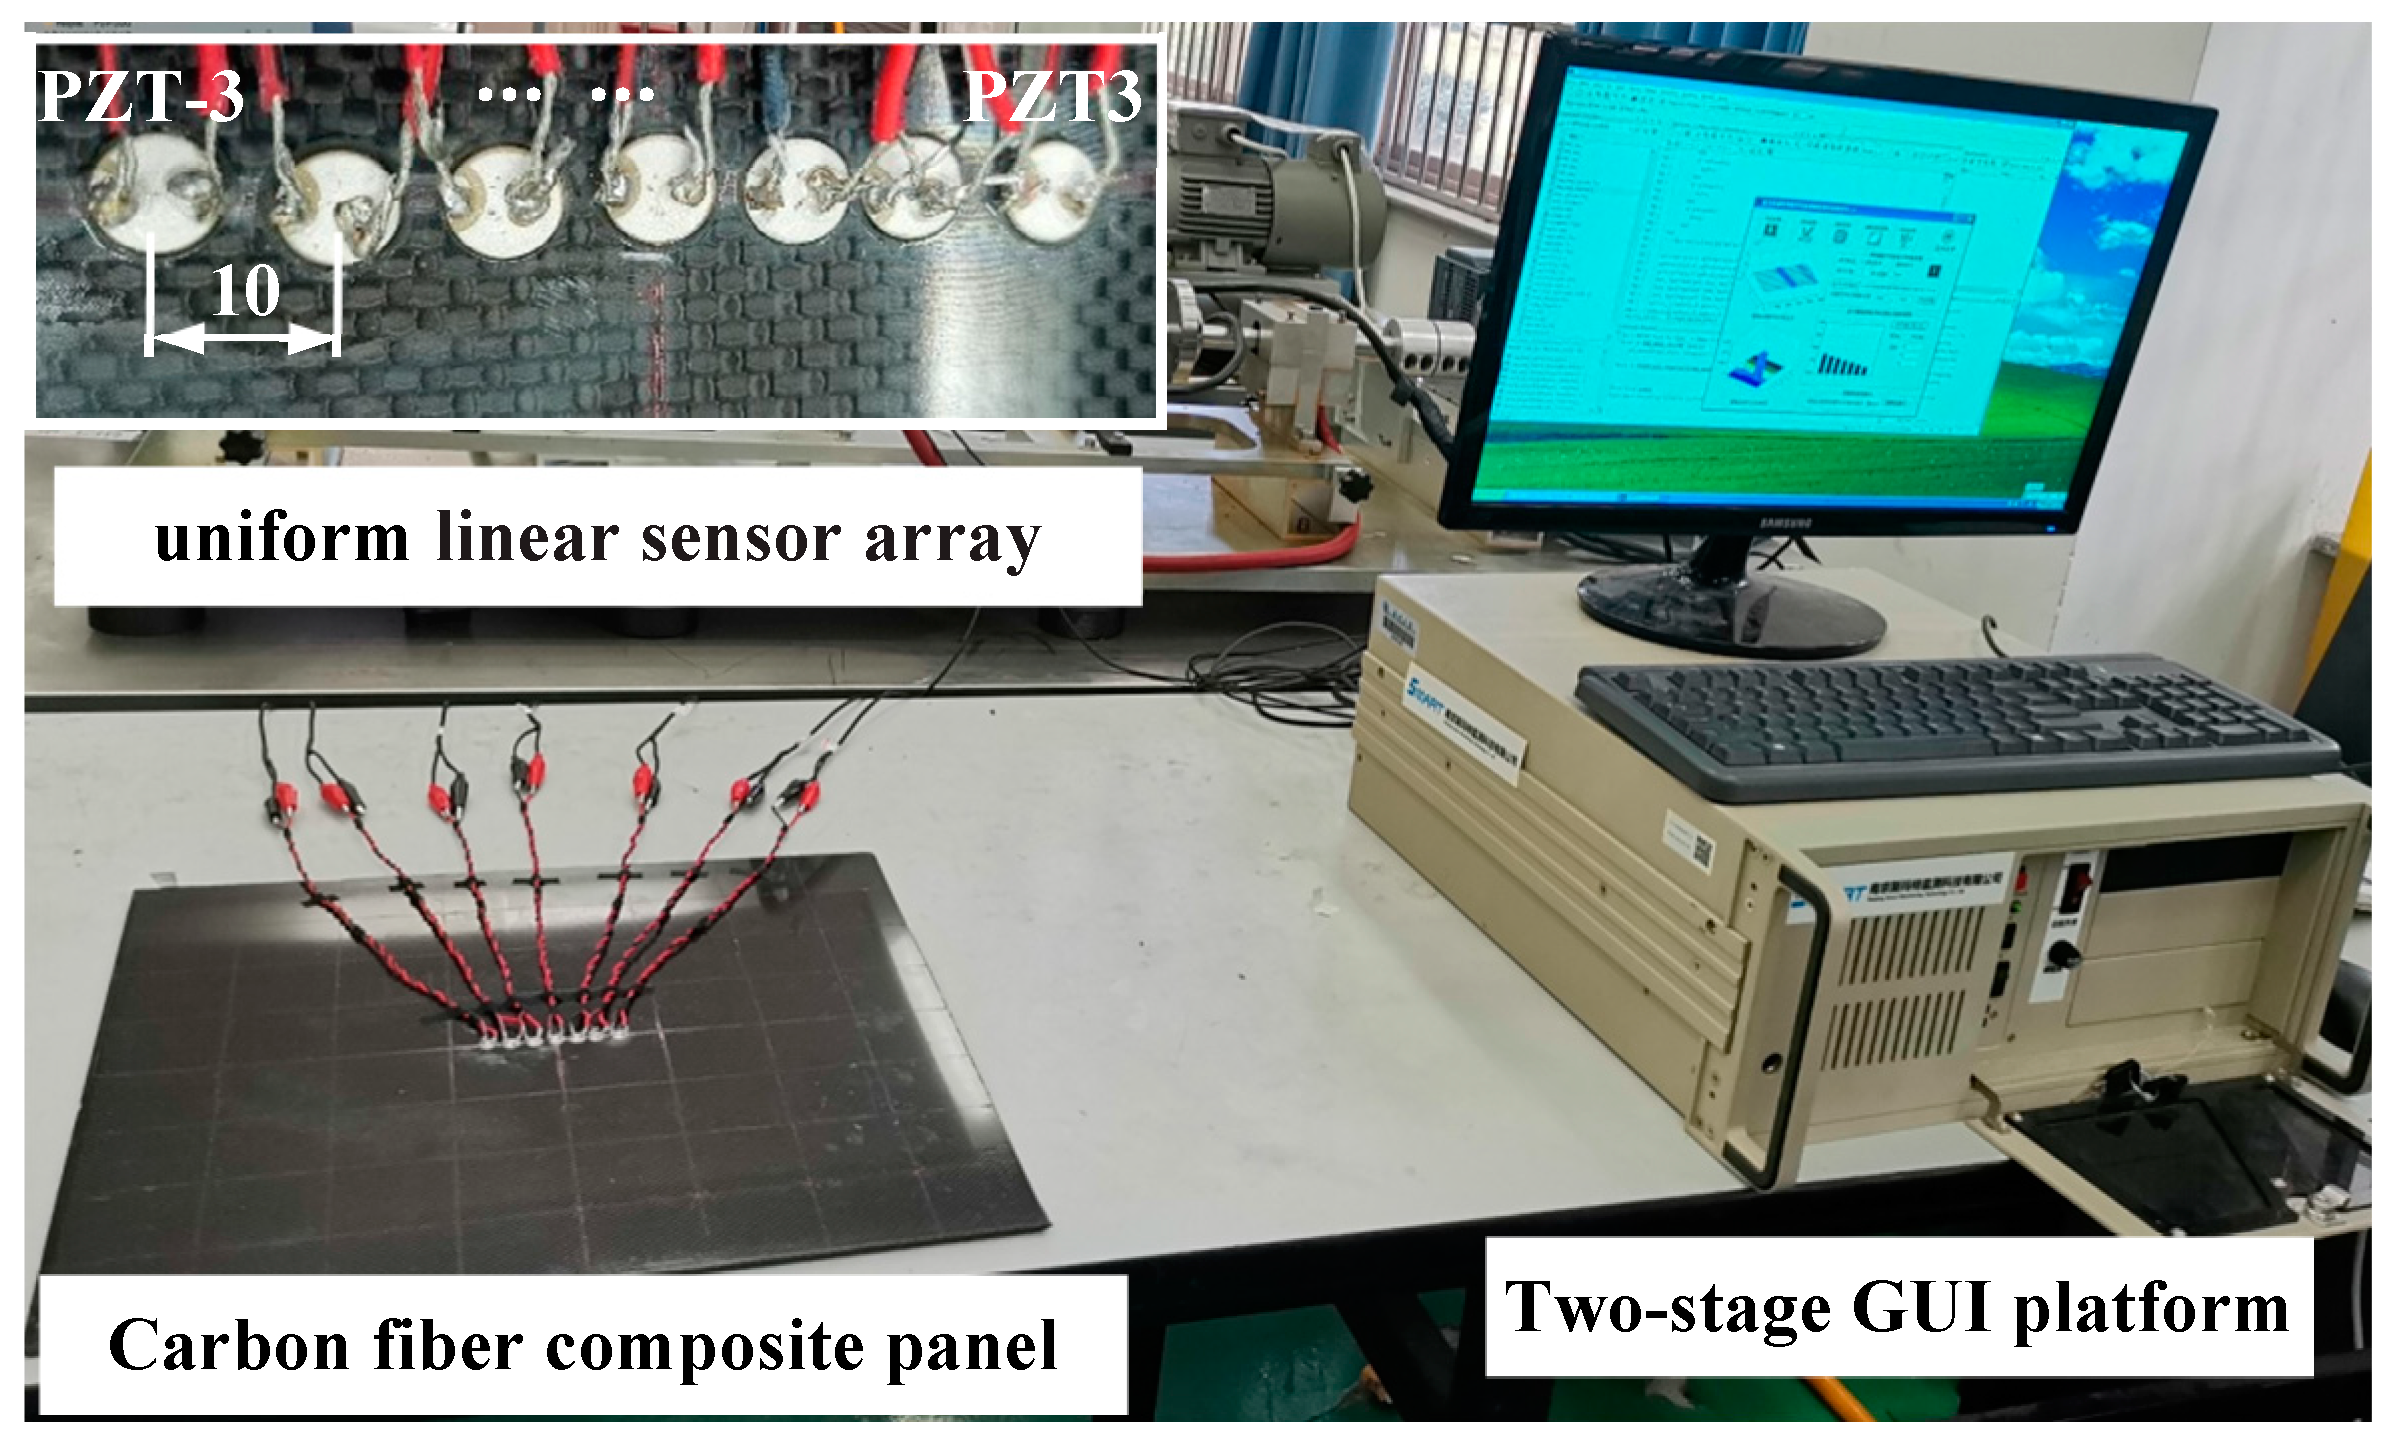
3.3. Experimental Verification

The carbon fiber composite panel used in the experimental verification possesses the same material parameters as the FEM described in the previous section. A steel ball with a diameter of 20 mm is freely dropped to simulate impact events.
Figure 7 illustrates the experimental setup, which comprises a uniform linear sensor array consisting of 7 PZT sensors, a carbon fiber composite panel, and the integrated structural health monitoring system. Each PZT sensor has dimensions of 0.48 mm × 8 mm. These PZT sensors are arranged with a spacing of 10 mm and are labeled sequentially as PZT-3, PZT-2, …, PZT3. Furthermore, a hybrid physics model-based two-stage GUI (Graphical User Interface) platform is developed to acquire the array response signals from the experiments and to locate impacts. Four low-velocity impacts with the steel ball are conducted at different positions on the panel. The sampling rate is set to 10 MHz, and the sampling length is set to 5000 samples. The trigger voltage is set to 1 V.
The impact signals of experimental case E1 are analyzed first. To align with the finite element analysis model, a central frequency of 50 kHz is selected for narrow-band signal extraction processing. Figure 8 presents the narrow-band signals and their envelopes for both simulation and experimental data at the same impact point. The peaks of the wave fronts in their envelopes are selected to measure the TOF for each PZT sensor signal. The TOF comparison between simulation signals and experimental signals is shown in Figure 9. It can be observed from the figure that the TOFs in the experimental signals are notably close to those in the simulation signals. These TOFs are represented as steering vectors for the array sensor, serving as the basis for Stage I area localization. Then, the covariance matrix of the observed signal vector is eigen-decomposed to obtain the signal subspace and noise subspace. These subspaces are utilized for precise positioning using the MUSIC algorithm.
Four experimental cases are investigated at positions (0 mm, 50 mm), (150 mm, 120 mm), (100 mm, 150 mm), and (−110 mm, 70 mm). The area localization and precise position of the experimental impact cases imaging results are shown in Figure 10. The predicted location results and errors are summarized and listed in Table 3. The predicted locations are in good agreement with the actual impact positions, and the predicted errors are almost below 2 cm.

4. Conclusions

In this paper, we have proposed a hybrid physics model-based two-stage impact location approach to locate the general areas and precise position of impacts on composite structures. The proposed method divides the impact monitoring of composite structures into two steps, and makes better use of the advantages of sparse and dense arrays to achieve more efficient and accurate impact localization with fewer PZT sensors. Simulation and experiment results demonstrate that the area localization and precise positions are in good agreement with the actual impact positions, and the predicted errors are almost below 2 cm.
The current implementation of the two-stage impact location approach has the following limitations, which direct the way of our future work. First, the existing models are only implemented in simple composite plates. However, we should investigate how to model composites with more anisotropic and complex structures. Second, the current algorithms only address the localization of a single impact source. When multiple signals or correlated signal sources appear at the same time, we should explore how to carry out the correlated signals in Stage I.
Further research is still worthwhile to systematically address the effects of simultaneous environmental factors. Additionally, more research needs to be conducted on correlated sources and complex structural health monitoring.

Author Contributions

Conceptualization, Z.W. and Y.Z.; methodology, Y.Z. and Z.W.; software, Y.Z.; validation, Z.W. and Y.Z.; formal analysis, Z.W.; investigation, Z.W.; resources, Y.Z.; data curation, Y.Z.; writing—original draft preparation, Z.W.; writing—review and editing, Y.Z.; visualization, Y.Z.; supervision, Y.Z.; project administration, Z.W.; funding acquisition, Z.W. All authors have read and agreed to the published version of the manuscript.

Funding

This study was financially supported by the National Natural Science Foundation of China (No.51905242, No.52075232), the Natural Science Foundation of Jiangsu Province of China (No.BK20201112), and the High-level talent work start-up fee funded project of the Jinling Institute of Technology of China (No.jit-b-201823).

Data Availability Statement

The original contributions presented in this study are included in the article. Further inquiries can be directed to the corresponding author.

Conflicts of Interest

The authors declare no conflicts of interest.

References

  1. Lin, M.; Guo, S.; He, S.; Li, W.; Yang, D. Structure health monitoring of a composite wing based on flight load and strain data using deep learning method. Compos. Struct. 2022, 286, 115305. [Google Scholar] [CrossRef]
  2. Zhu, K.; Qing, X.; Liu, B.; He, T. A passive localization method for stiffened composite structures with a parameterized laminate model. J. Sound Vib. 2020, 489, 115683. [Google Scholar] [CrossRef]
  3. Nucera, C.; White, S.; Chen, Z.M.; Kim, H.; Scalea, D.; Lanza, F. Impact monitoring in stiffened composite aerospace panels by wave propagation. Struct. Health Monit. 2015, 14, 547–557. [Google Scholar] [CrossRef]
  4. Hu, C.; Yang, B.; Xiao, B.; Xuan, F.Z.; Xiang, Y. Damage Localization In Pressure Vessel Using Guided Wave-Based Techniques: Optimizing The Sensor Array Configuration to Mitigate Nozzle Effects. Appl. Acoust. 2022, 185, 108393. [Google Scholar] [CrossRef]
  5. Jiang, P.; Liu, X.; Li, W.; Guo, F.; Hong, C.; Liu, Y.; Yang, C. Damage Characterization of Carbon Fiber Composite Pressure Vessels Based On Modal Acoustic Emission. Materials 2022, 15, 4783. [Google Scholar] [CrossRef] [PubMed]
  6. Memmolo, V.; Maio, L.; Ricci, F. Assessment of Damage in Composite Pressure Vessels Using Guided Waves. Sensors 2022, 22, 5182. [Google Scholar] [CrossRef] [PubMed]
  7. Zhao, J.; Yang, L.; Wang, H.; Zhao, J.; Li, N.; Chang, L.; Ji, H.; Qiu, J. Laser-Generated Guided Waves For Damage Detection in Metal-Lined Composite-Overwrapped Pressure Vessels. Polymers 2022, 14, 3823. [Google Scholar] [CrossRef] [PubMed]
  8. Hu, G.; Chen, C.; Zhou, S.; Zhai, S. A Study on Defect Tomographic Imaging in Pressure Vessel With Liquid Medium. J. Press. Vessel Technol. 2020, 142, 041601. [Google Scholar] [CrossRef]
  9. Purekar, A.S.; Pines, D.J. Damage Detection in Thin Composite Laminates Using Piezoelectric Phased Sensor Array and Guided Wave Interrogation. J. Intell. Mater. Syst. Struct. 2010, 21, 995–1010. [Google Scholar] [CrossRef]
  10. Engholm, M.; Stepinski, T. Direction of Arrival Estimation of Lamb Wave Using Circular Arrays. Struct. Health Monit. 2011, 10, 467–480. [Google Scholar] [CrossRef]
  11. Ren, Y.; Qiu, L.; Yuan, S.; Bao, Q. On-Line Multi-Damage Scanning Spatial-Wavenumber Filter Based Imaging Method for Aircraft Composite Structure. Materials 2017, 10, 519. [Google Scholar] [CrossRef] [PubMed]
  12. Zhong, Y.; Xiang, J. A Two-Dimensional Plum-Blossom Sensor Array-Based Multiple Signal Classification Method for Impact Localization in Composite Structures. Comput.-Aided Civ. Infrastruct. Eng. 2016, 31, 633–643. [Google Scholar] [CrossRef]
  13. Bao, Q.; Yuan, S.; Wang, Y.; Qiu, L. Anisotropy Compensated Music Algorithm Based Composite Structure Damage Imaging Method. Compos. Struct. 2019, 214, 293–303. [Google Scholar] [CrossRef]
  14. Zuo, H.; Yang, Z.; Tian, S.; Chen, X. Damage identification for plate-like structures using ultrasonic guided wave based on improved MUSIC method. Compos. Struct. 2018, 203, 164–171. [Google Scholar] [CrossRef]
  15. Karami, P.; Tabatabaei, S.A.; Zangaraki, R. Experimental and Numerical Analyses of Progressive Damage in Non-Circular Metal/Composite Hybrid Vessels Under Internal Pressure. Int. J. Damage Mech. 2015, 24, 1261–1279. [Google Scholar] [CrossRef]
  16. Wang, Z.; Zhong, Y.; Zhou, J.; Li, C.; Zhong, L. Environmental Effects on Piezoelectric Sensors Array Signals and a Compensated Damage Imaging Method. Materials 2021, 14, 6742. [Google Scholar] [CrossRef] [PubMed]
Figure 1. Observed array signal model. (a) Lamb wave induced by impacts. (b) Signal model using linear PZT array.
Processes 12 02675 g001
Figure 2. Hybrid physics model-based two-stage impact localization procedure.
Processes 12 02675 g002
Figure 3. The panel FEM model. (a) Numbered nodes for excitation. (b) Laminates of materials.
Processes 12 02675 g003
Figure 4. The array sensor signals and their wave fronts of the S1 simulated impact.
Processes 12 02675 g004
Figure 5. Stage I: Area localization of S1 simulated impact.
Processes 12 02675 g005
Figure 6. Stage II: Precise position of S1 simulated impact.
Processes 12 02675 g006
Figure 7. Experiment setup.
Processes 12 02675 g007
Figure 8. The array sensor narrow-band signals and their envelopes. (a) Simulation signal. (b) Experimental signal.
Processes 12 02675 g008
Figure 9. TOF comparison of simulation signals and experimental signals.
Processes 12 02675 g009
Figure 10. Area localization and precise position of experimental impact cases.
Processes 12 02675 g010aProcesses 12 02675 g010b
Table 1. Material parameters of the carbon fiber composite panel.
E1E2E3G12G13
132 GPa8.8 GPa8.8 GPa4.95 GPa4.95 GPa
G23 μ 12 μ 13 μ 23 ρ
3.35 GPa0.3150.3150.331540 kg/m3
Table 2. Predicted location results and errors of simulated impact cases.
No.Simulated CaseArea LocalizationPrecise Position
X/mmY/mmr/mmθ/°X/mmY/mmEx/mmEy/mm
S1180110#312103118010802
S2−80130#27152121−7813020
S3120−120#85169315119 −11911
Table 3. Predicted location results and errors of experimental impact cases.
No.Simulated CaseArea LocalizationPrecise Position
X/mmY/mmr/mmθ/°X/mmY/mmEx/mmEy/mm
E1050#50509005000
E2150120#42212411601401020
E3100150#3019759100170020
E4−11070#48136144−11080010
Disclaimer/Publisher’s Note: The statements, opinions and data contained in all publications are solely those of the individual author(s) and contributor(s) and not of MDPI and/or the editor(s). MDPI and/or the editor(s) disclaim responsibility for any injury to people or property resulting from any ideas, methods, instructions or products referred to in the content.

