
Feasibility Evaluation of I–Shaped Horizontal Salt Cavern for Underground Natural Gas Storage

Abstract
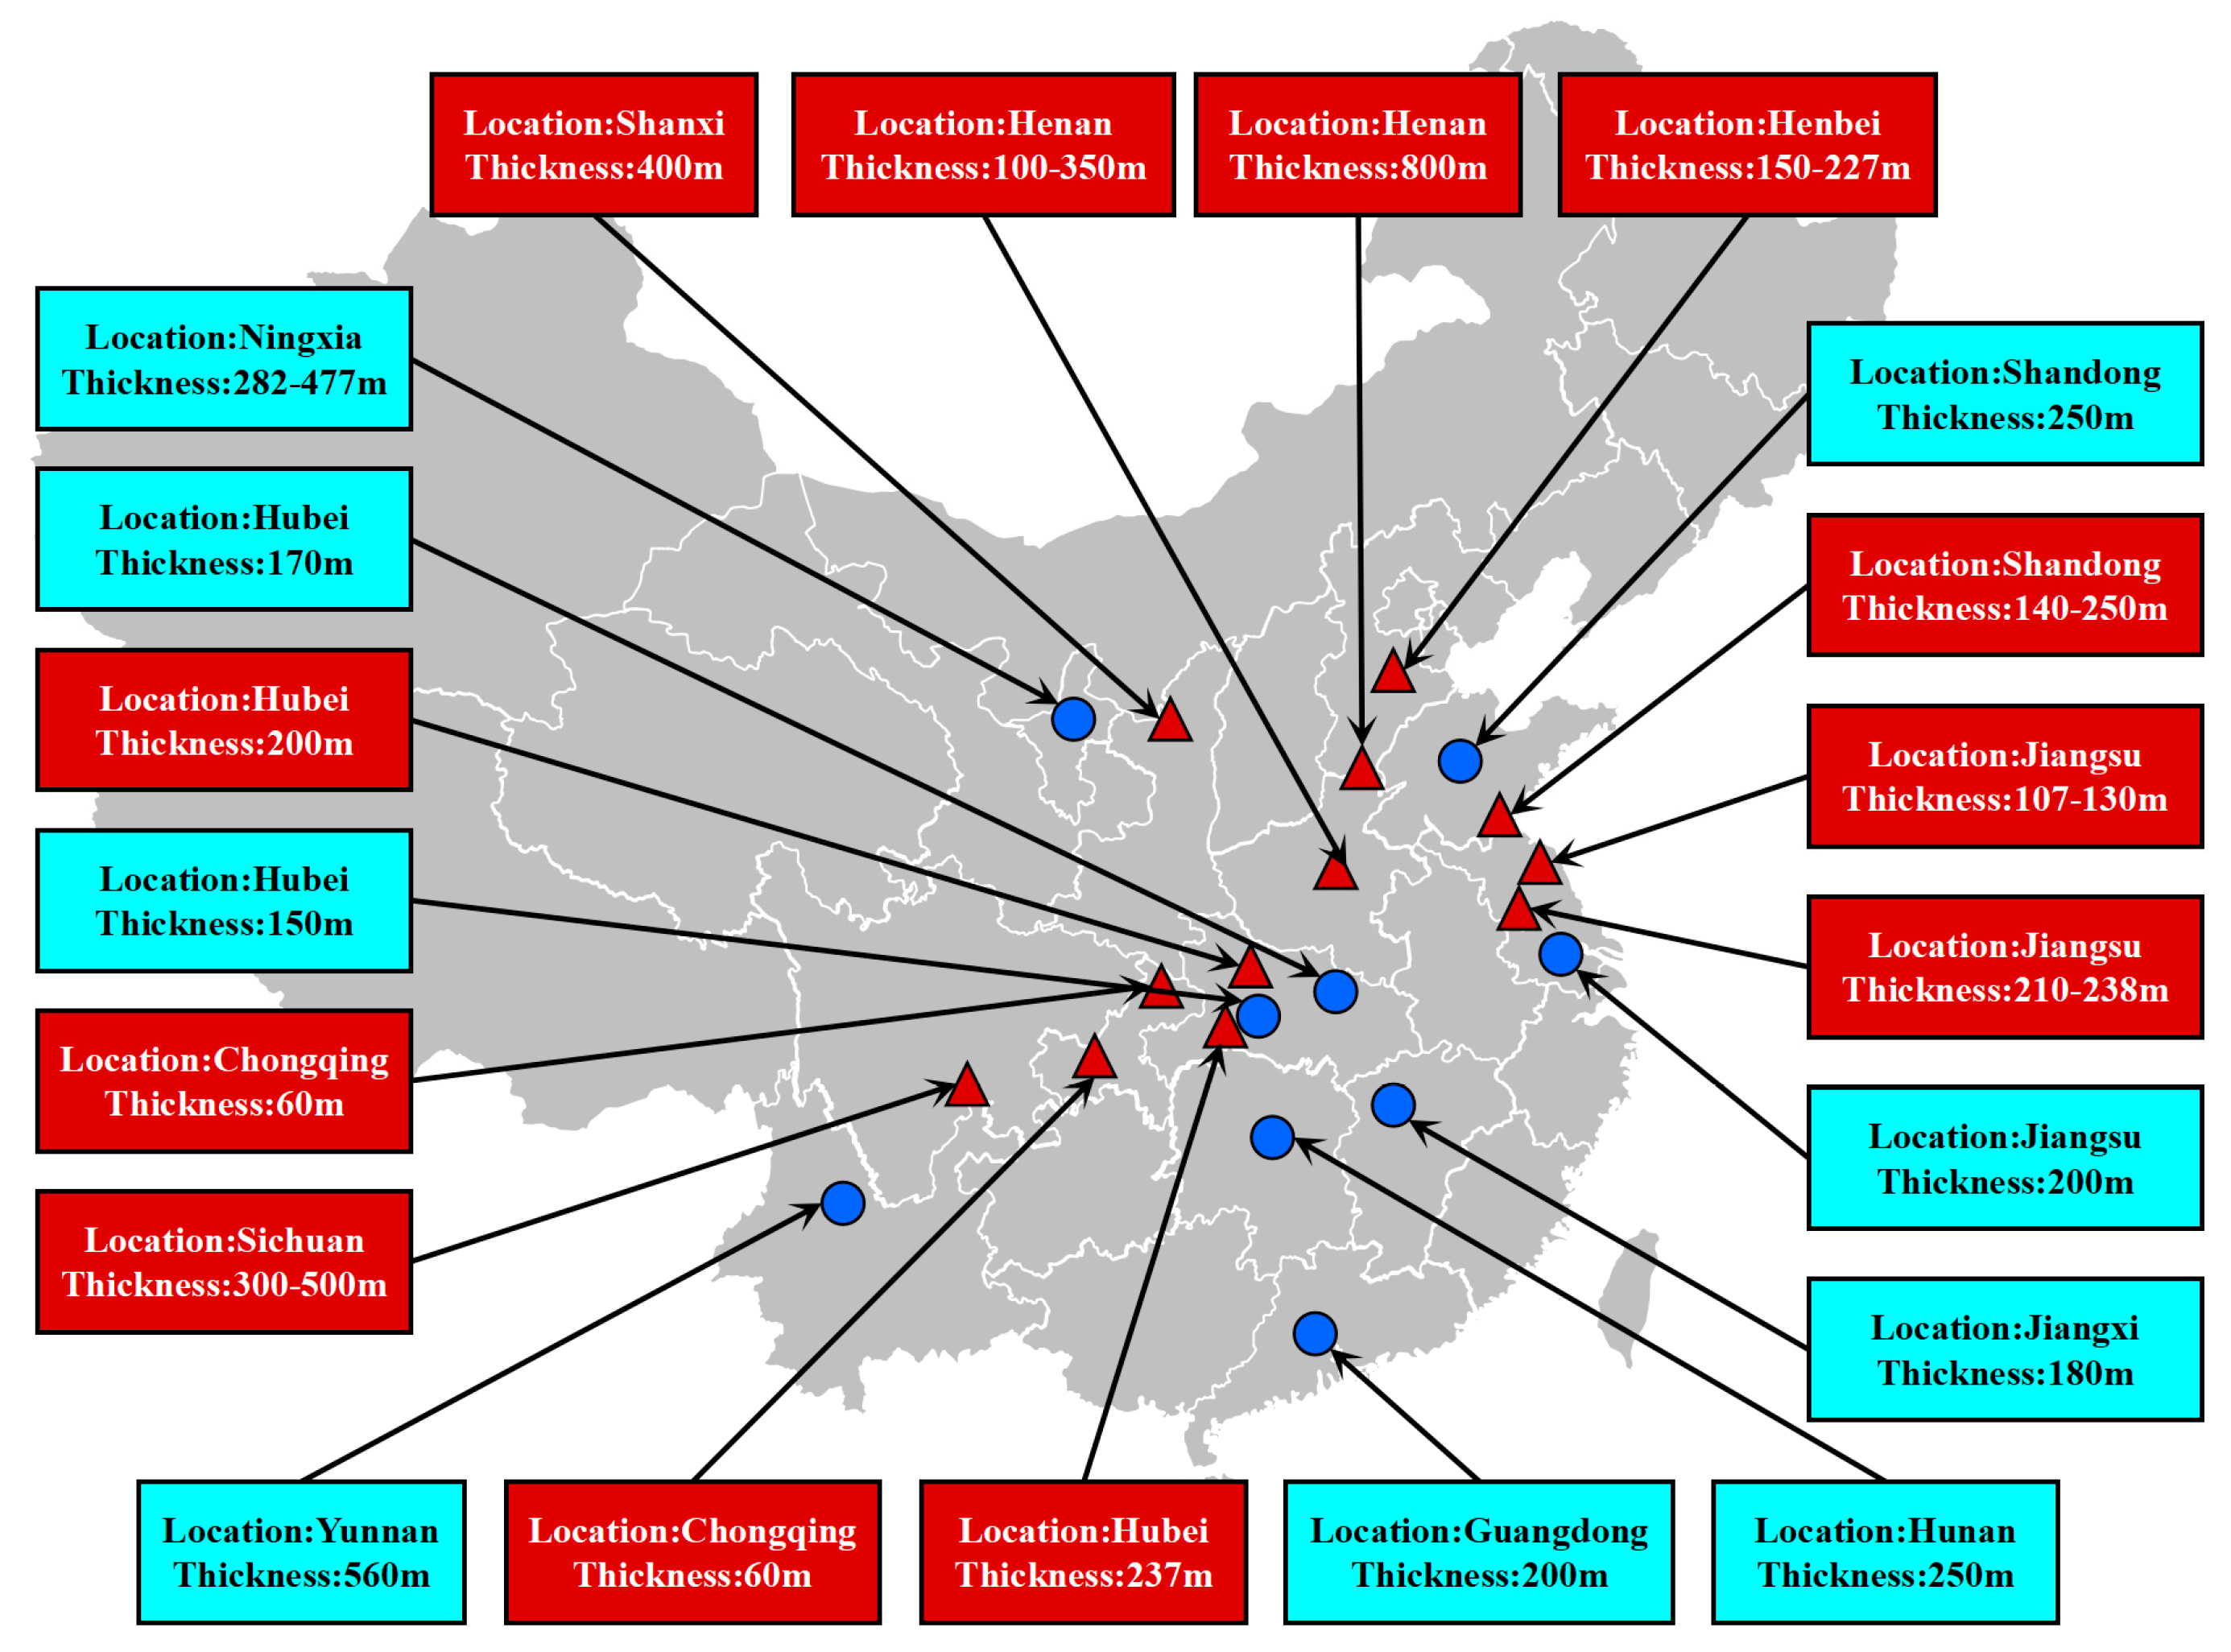
1. Introduction
2. Construction Methods and Applicability
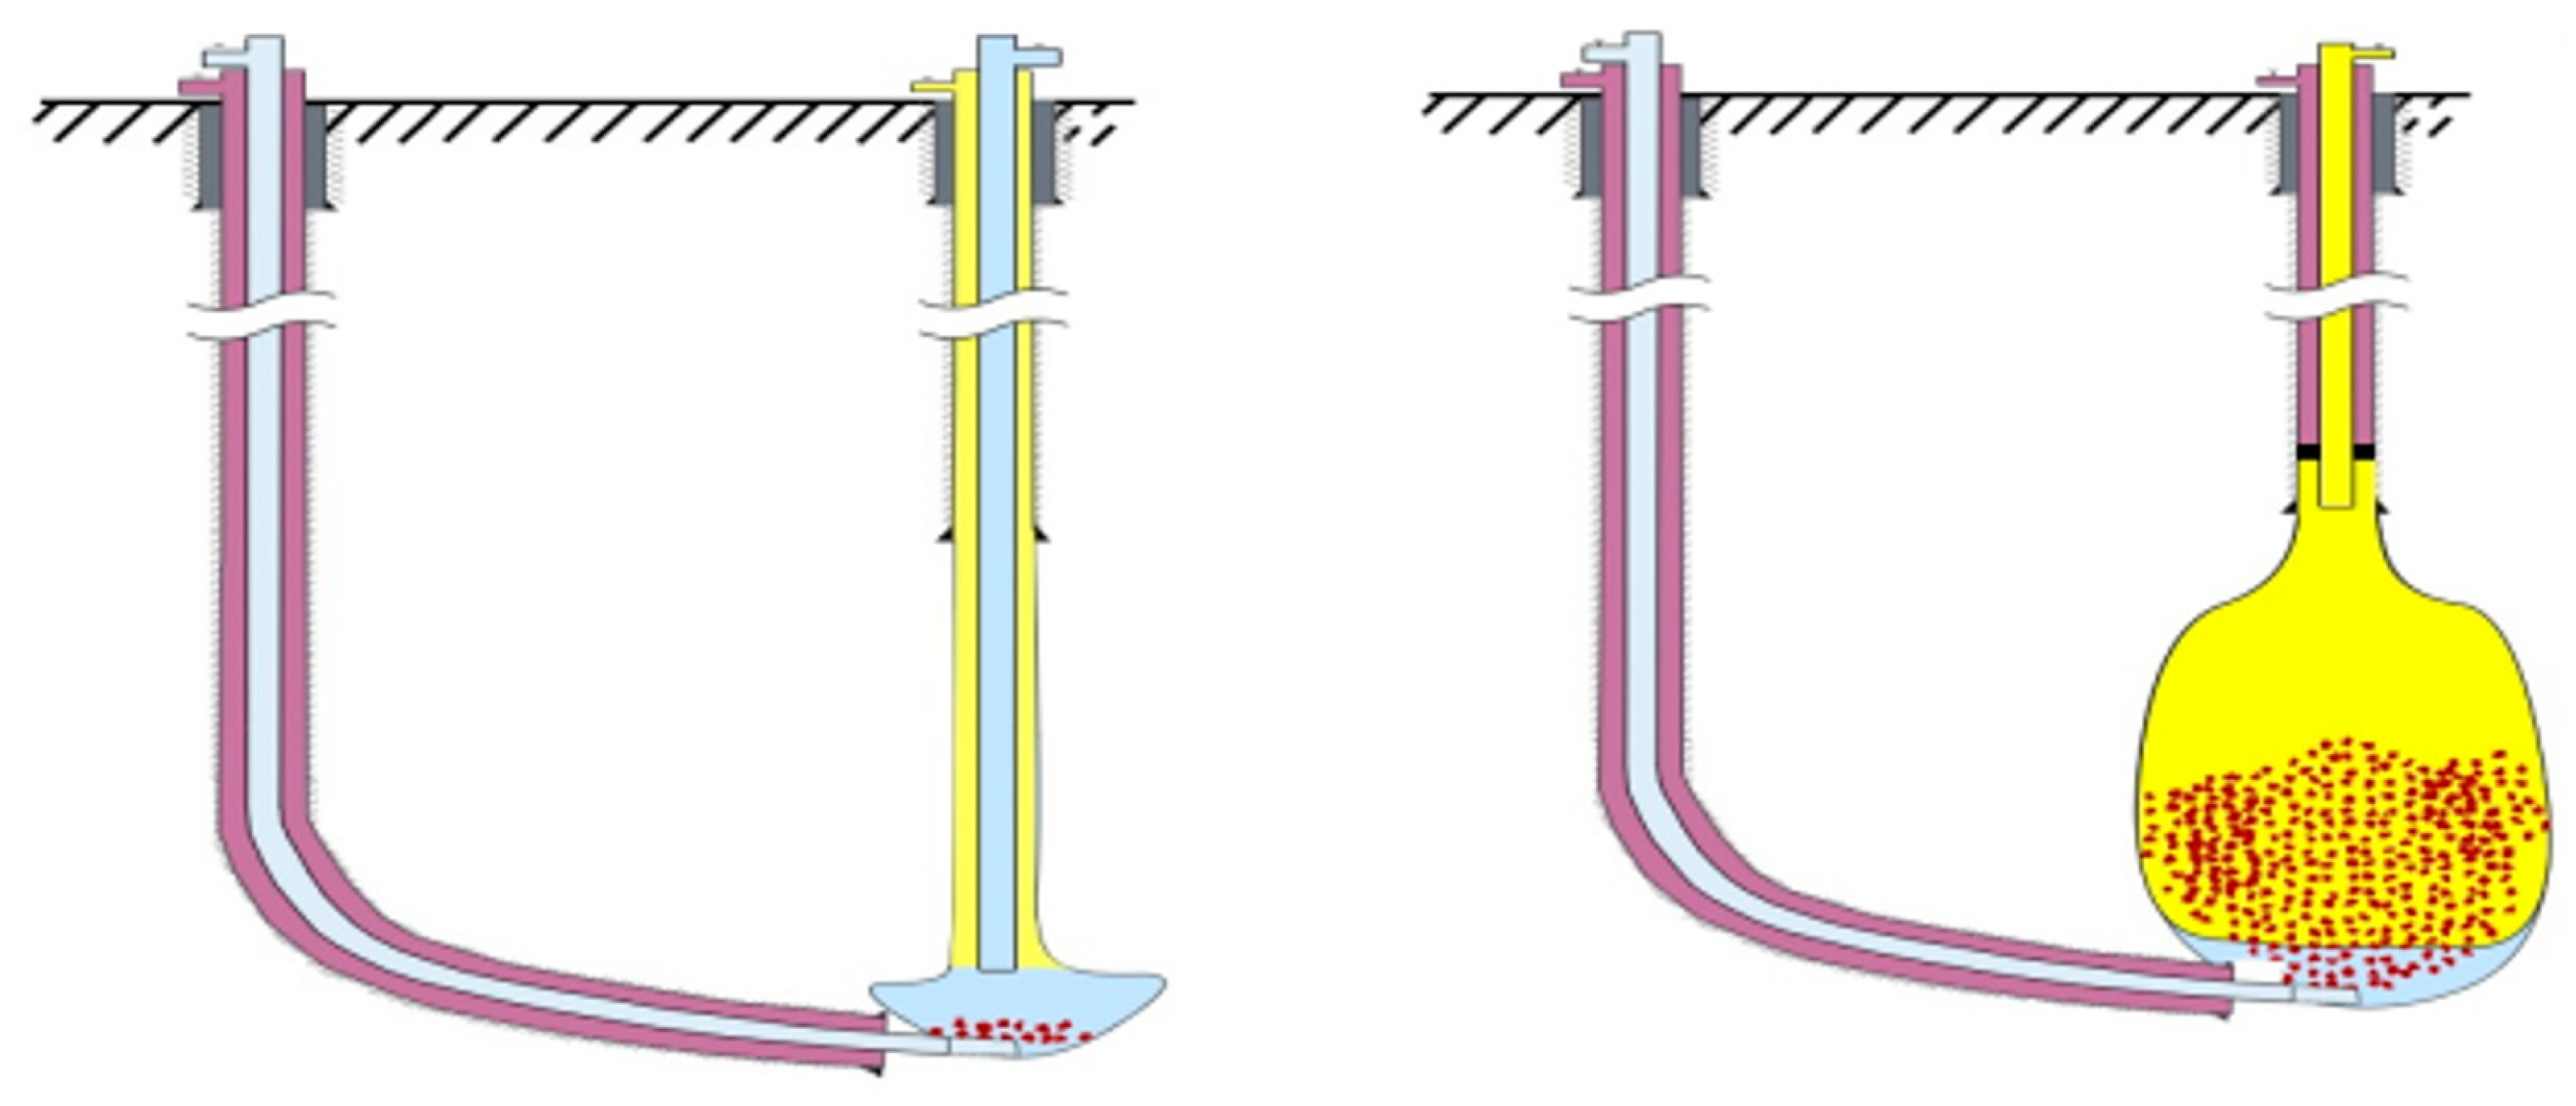
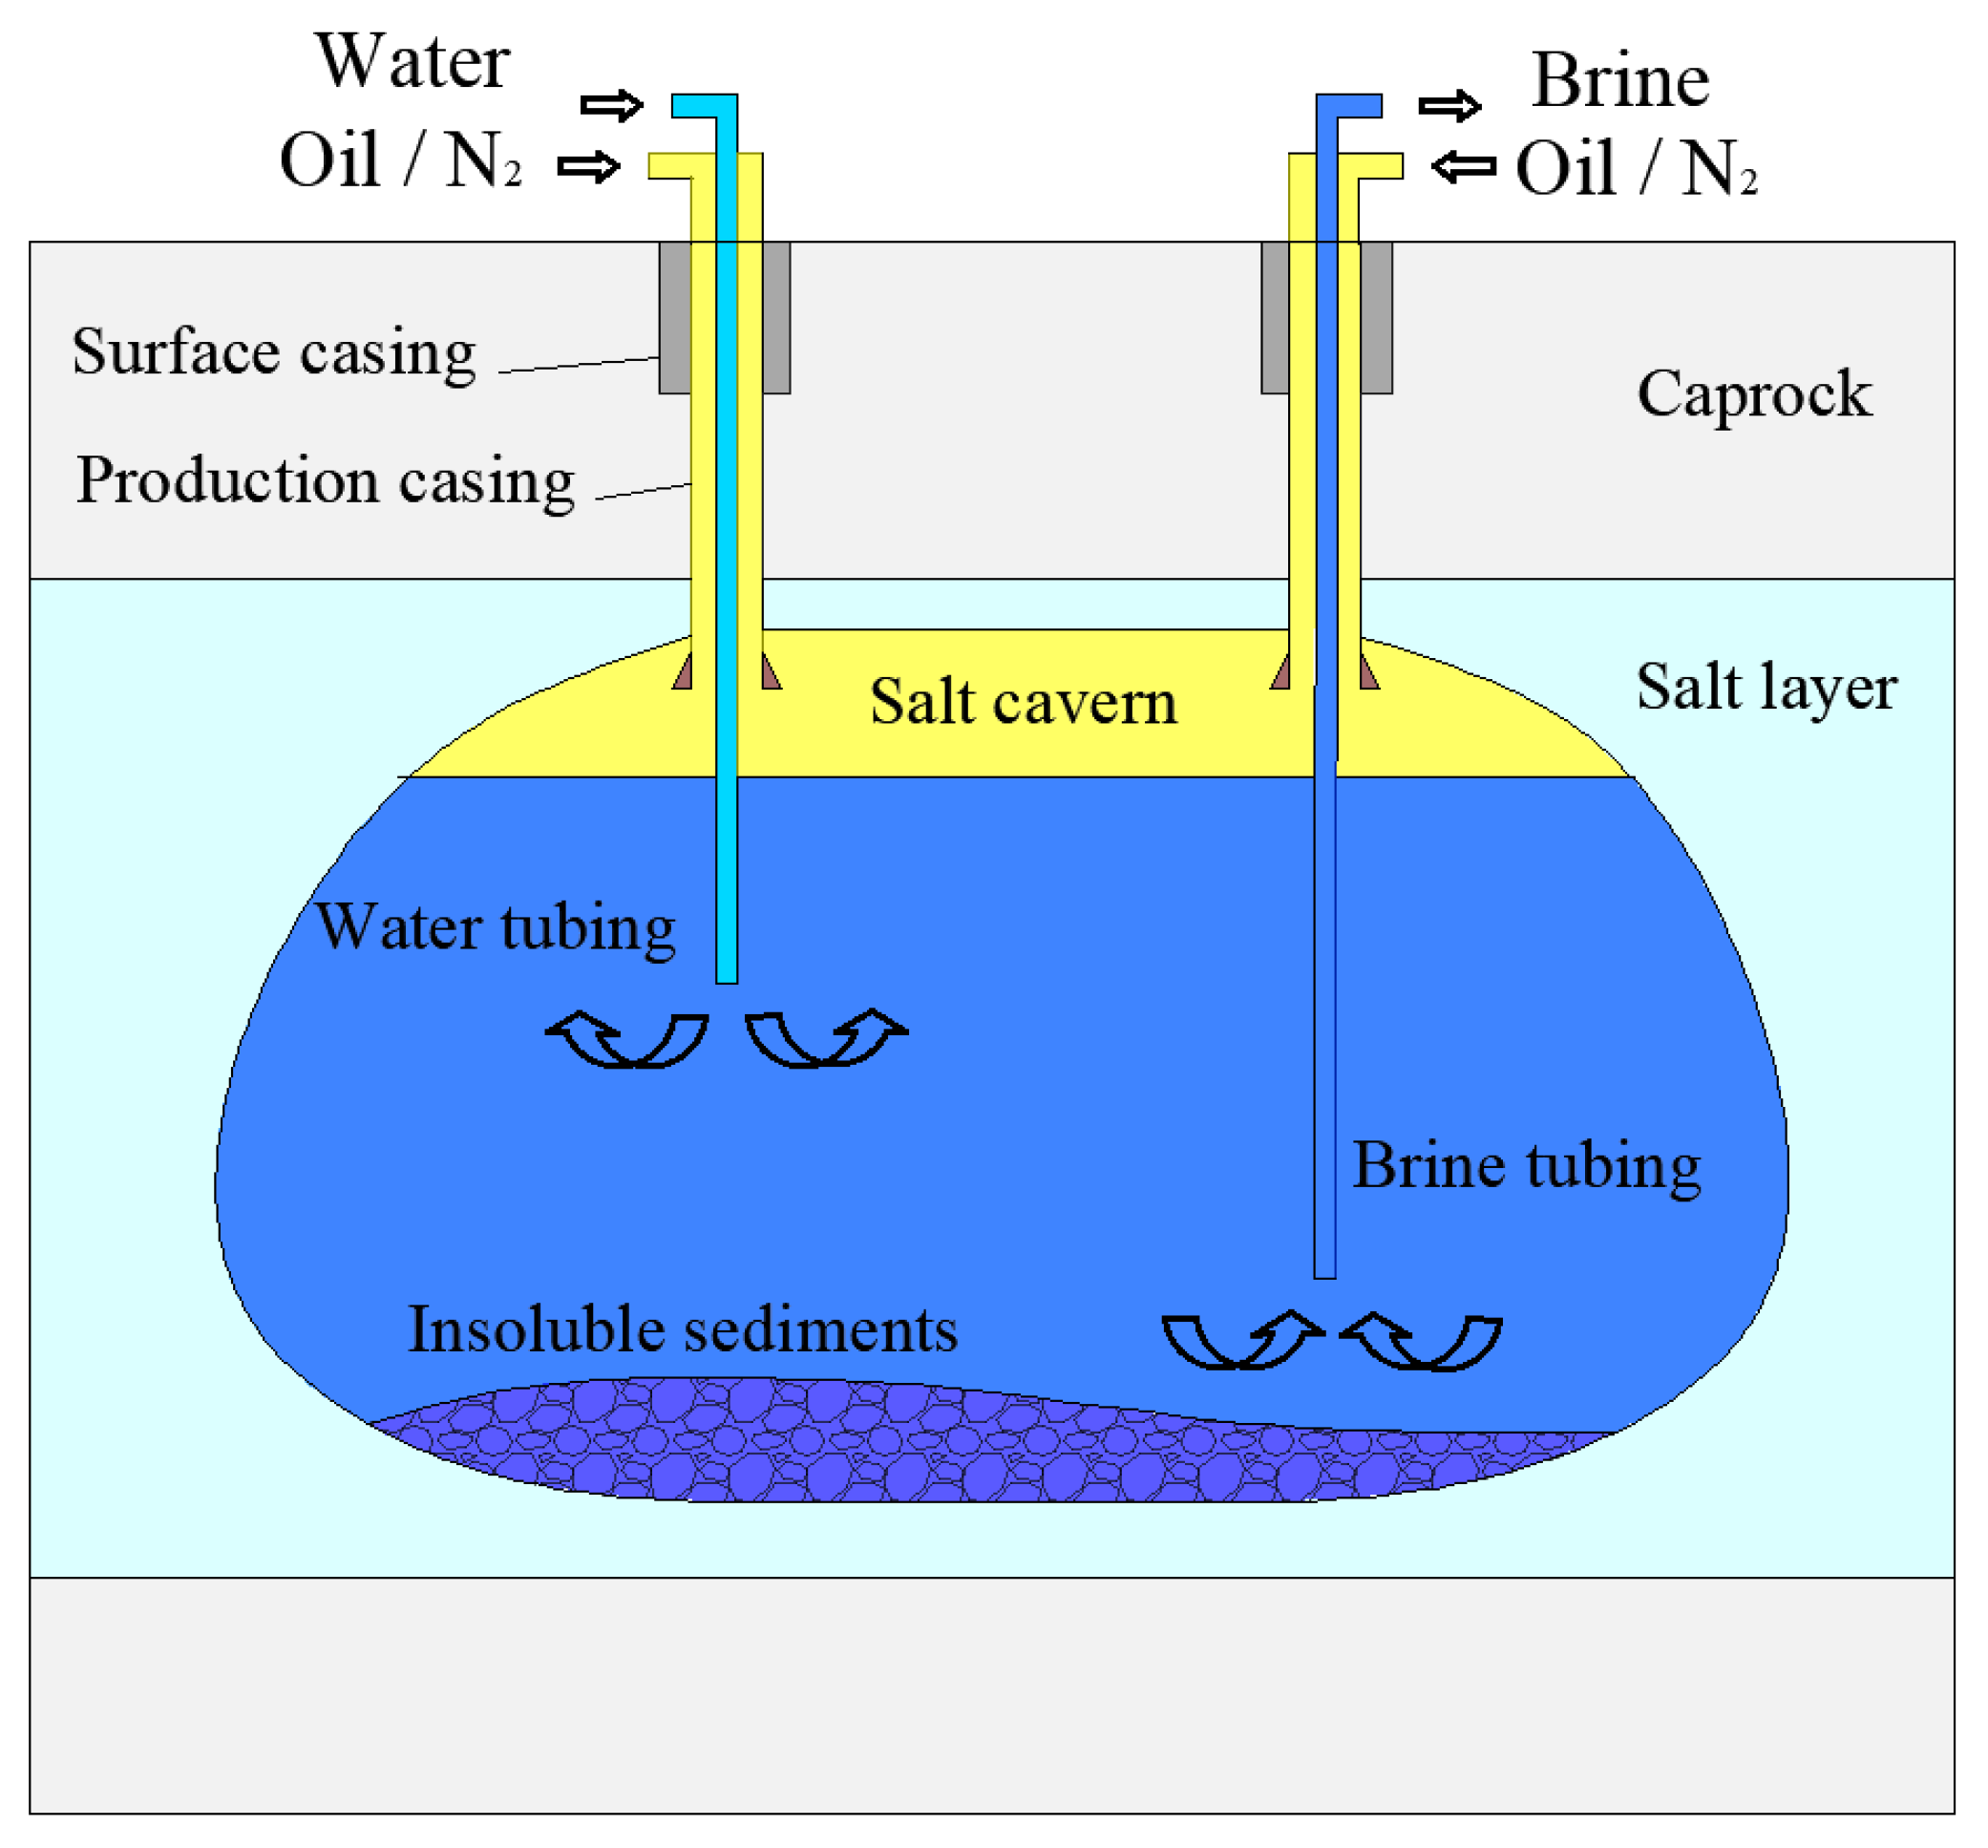
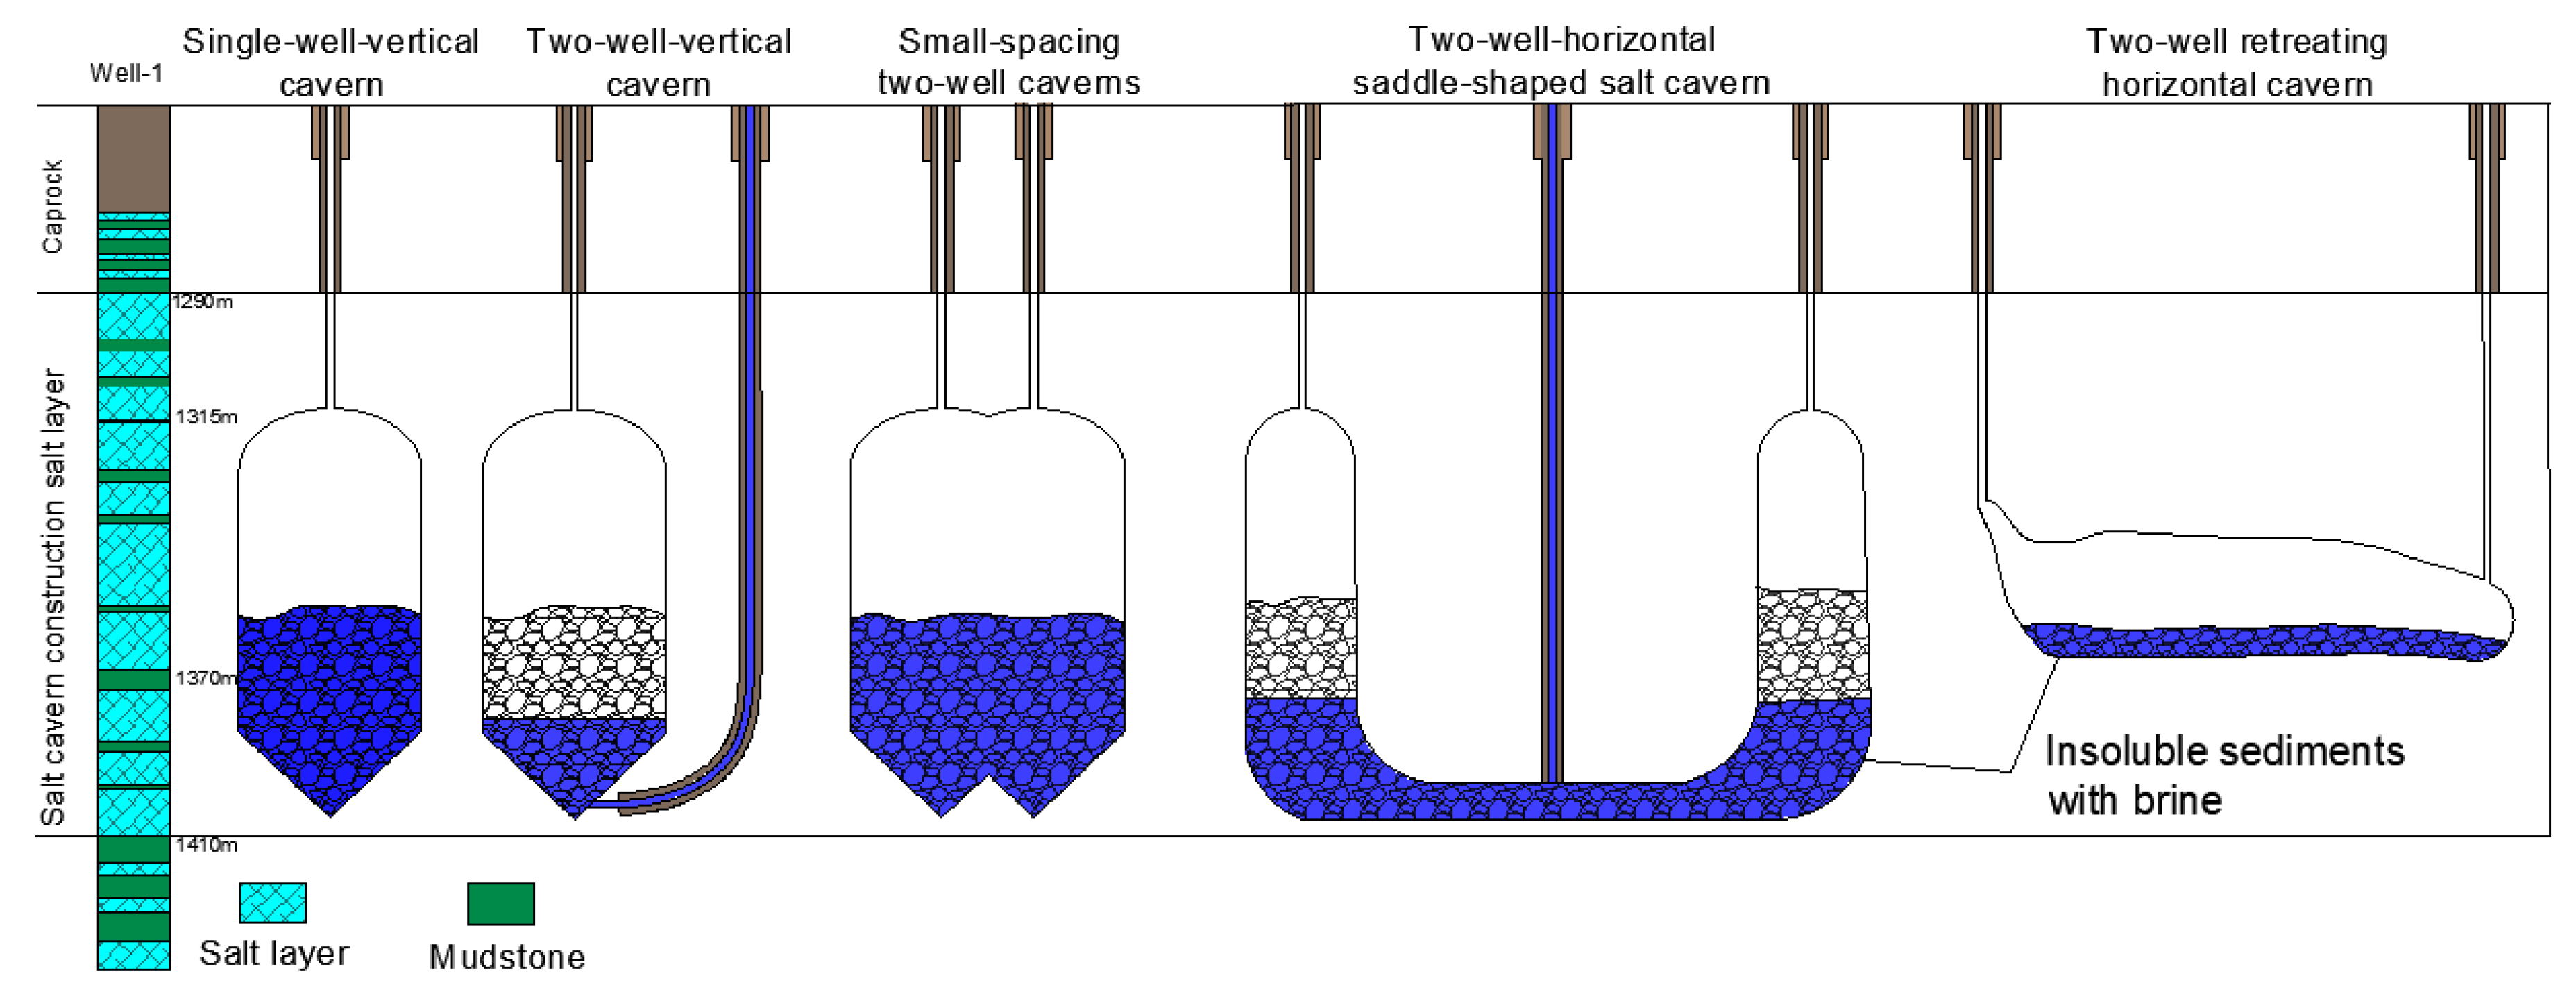
2.1. Cavern Construction Method
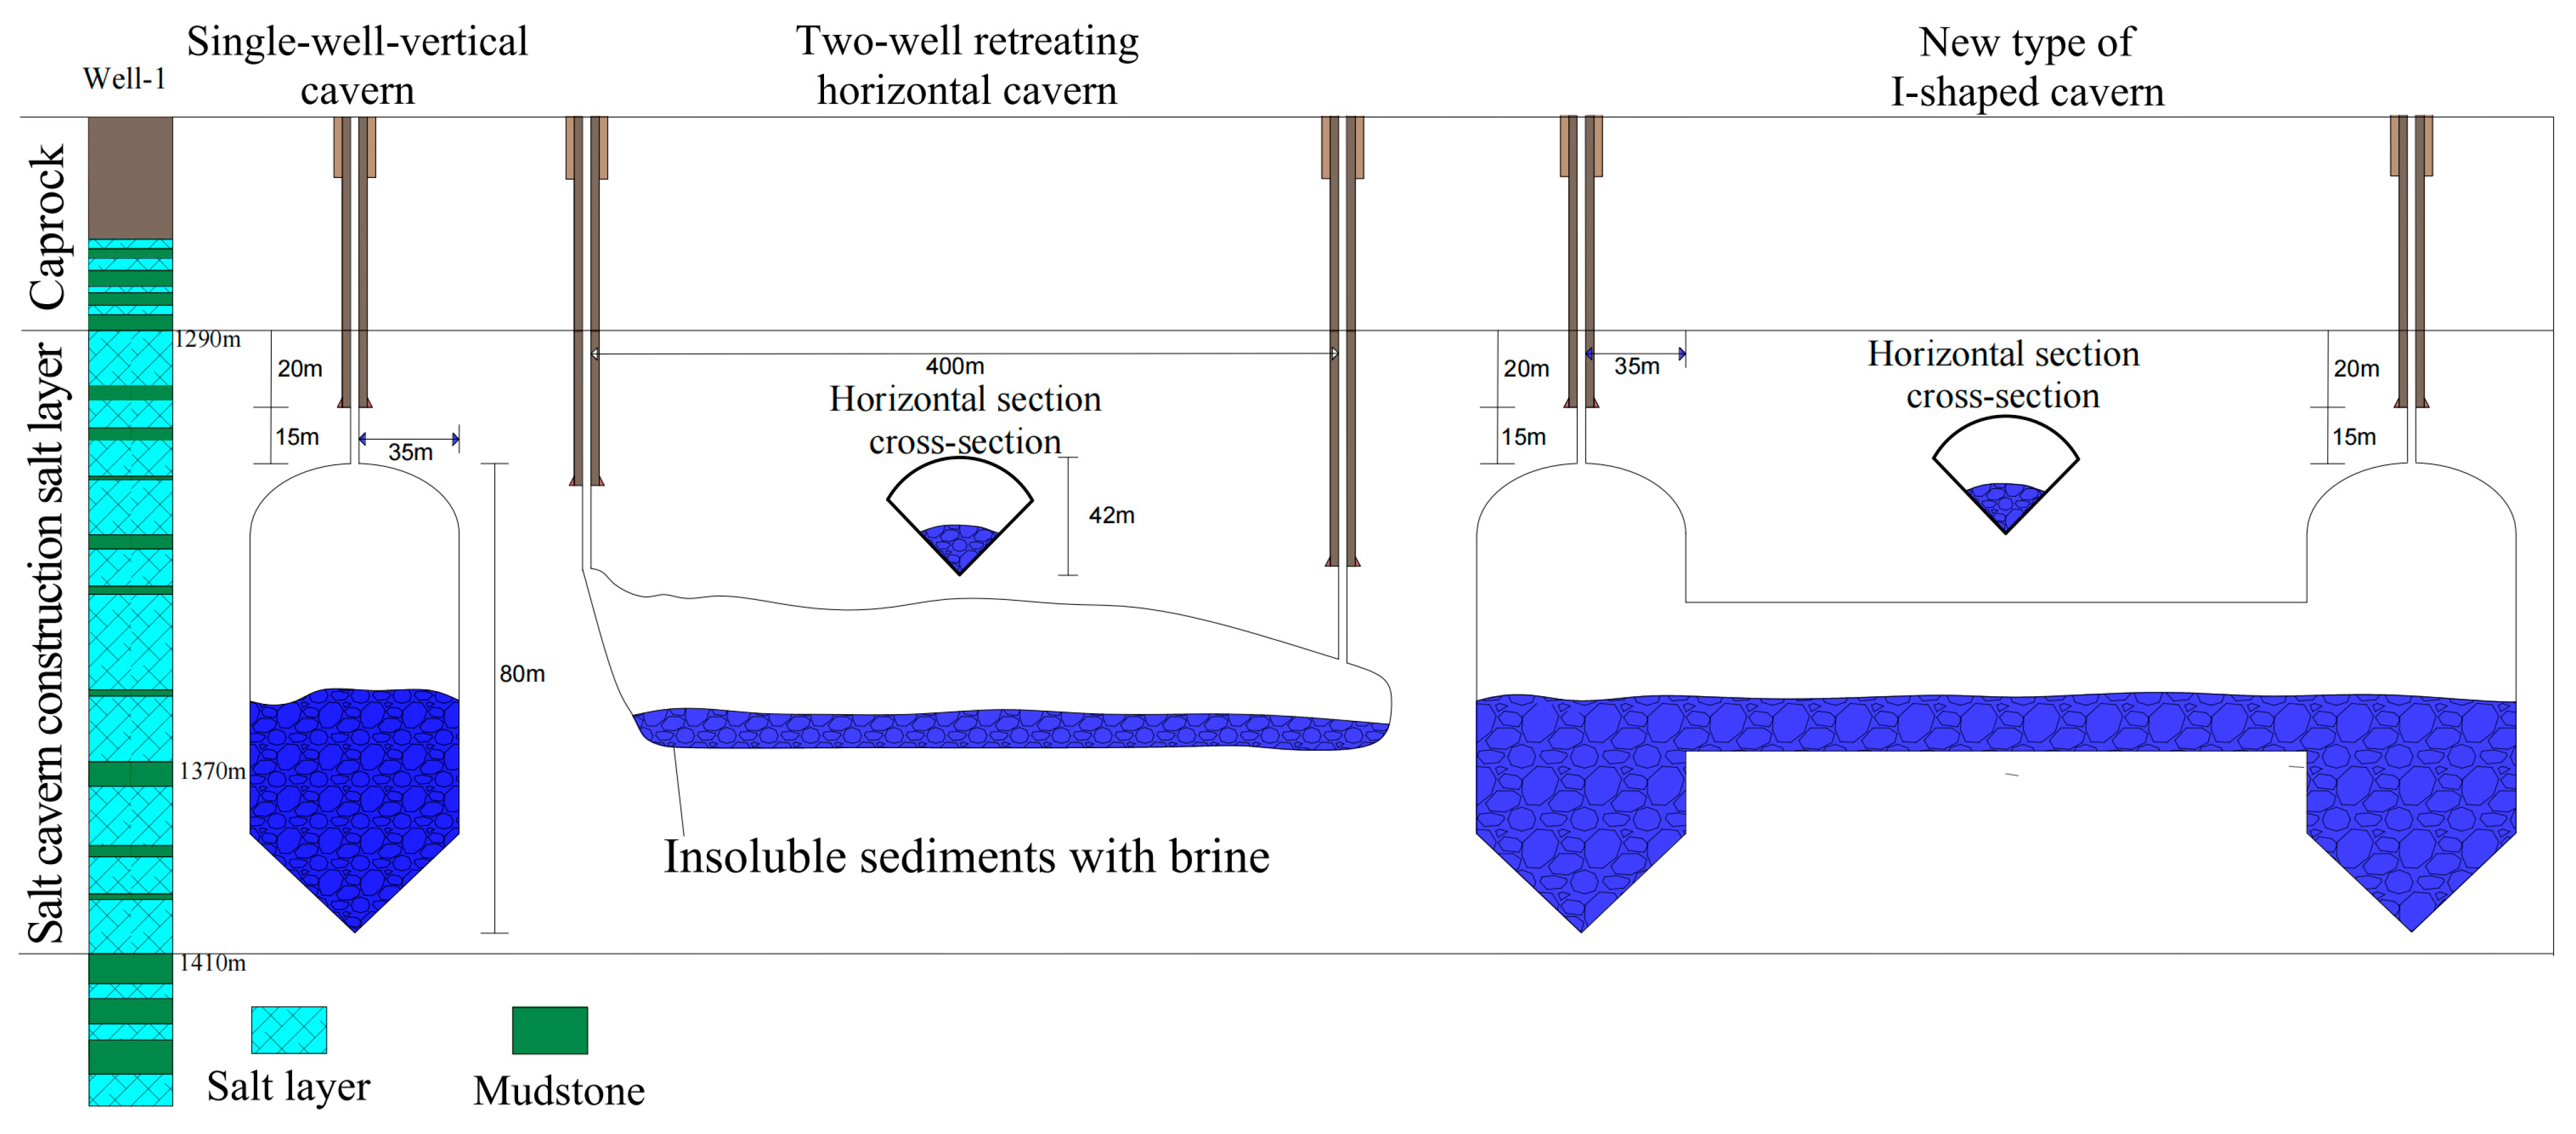
2.1.1. Single–Well–Vertical (SWV) Cavern
2.1.2. Two–Well–Directional (TWD) Cavern
2.1.3. Small–Spacing Two–Well (SSTW) Cavern
2.1.4. Two–Well–Horizontal Saddle–Shaped (TWHS) Cavern
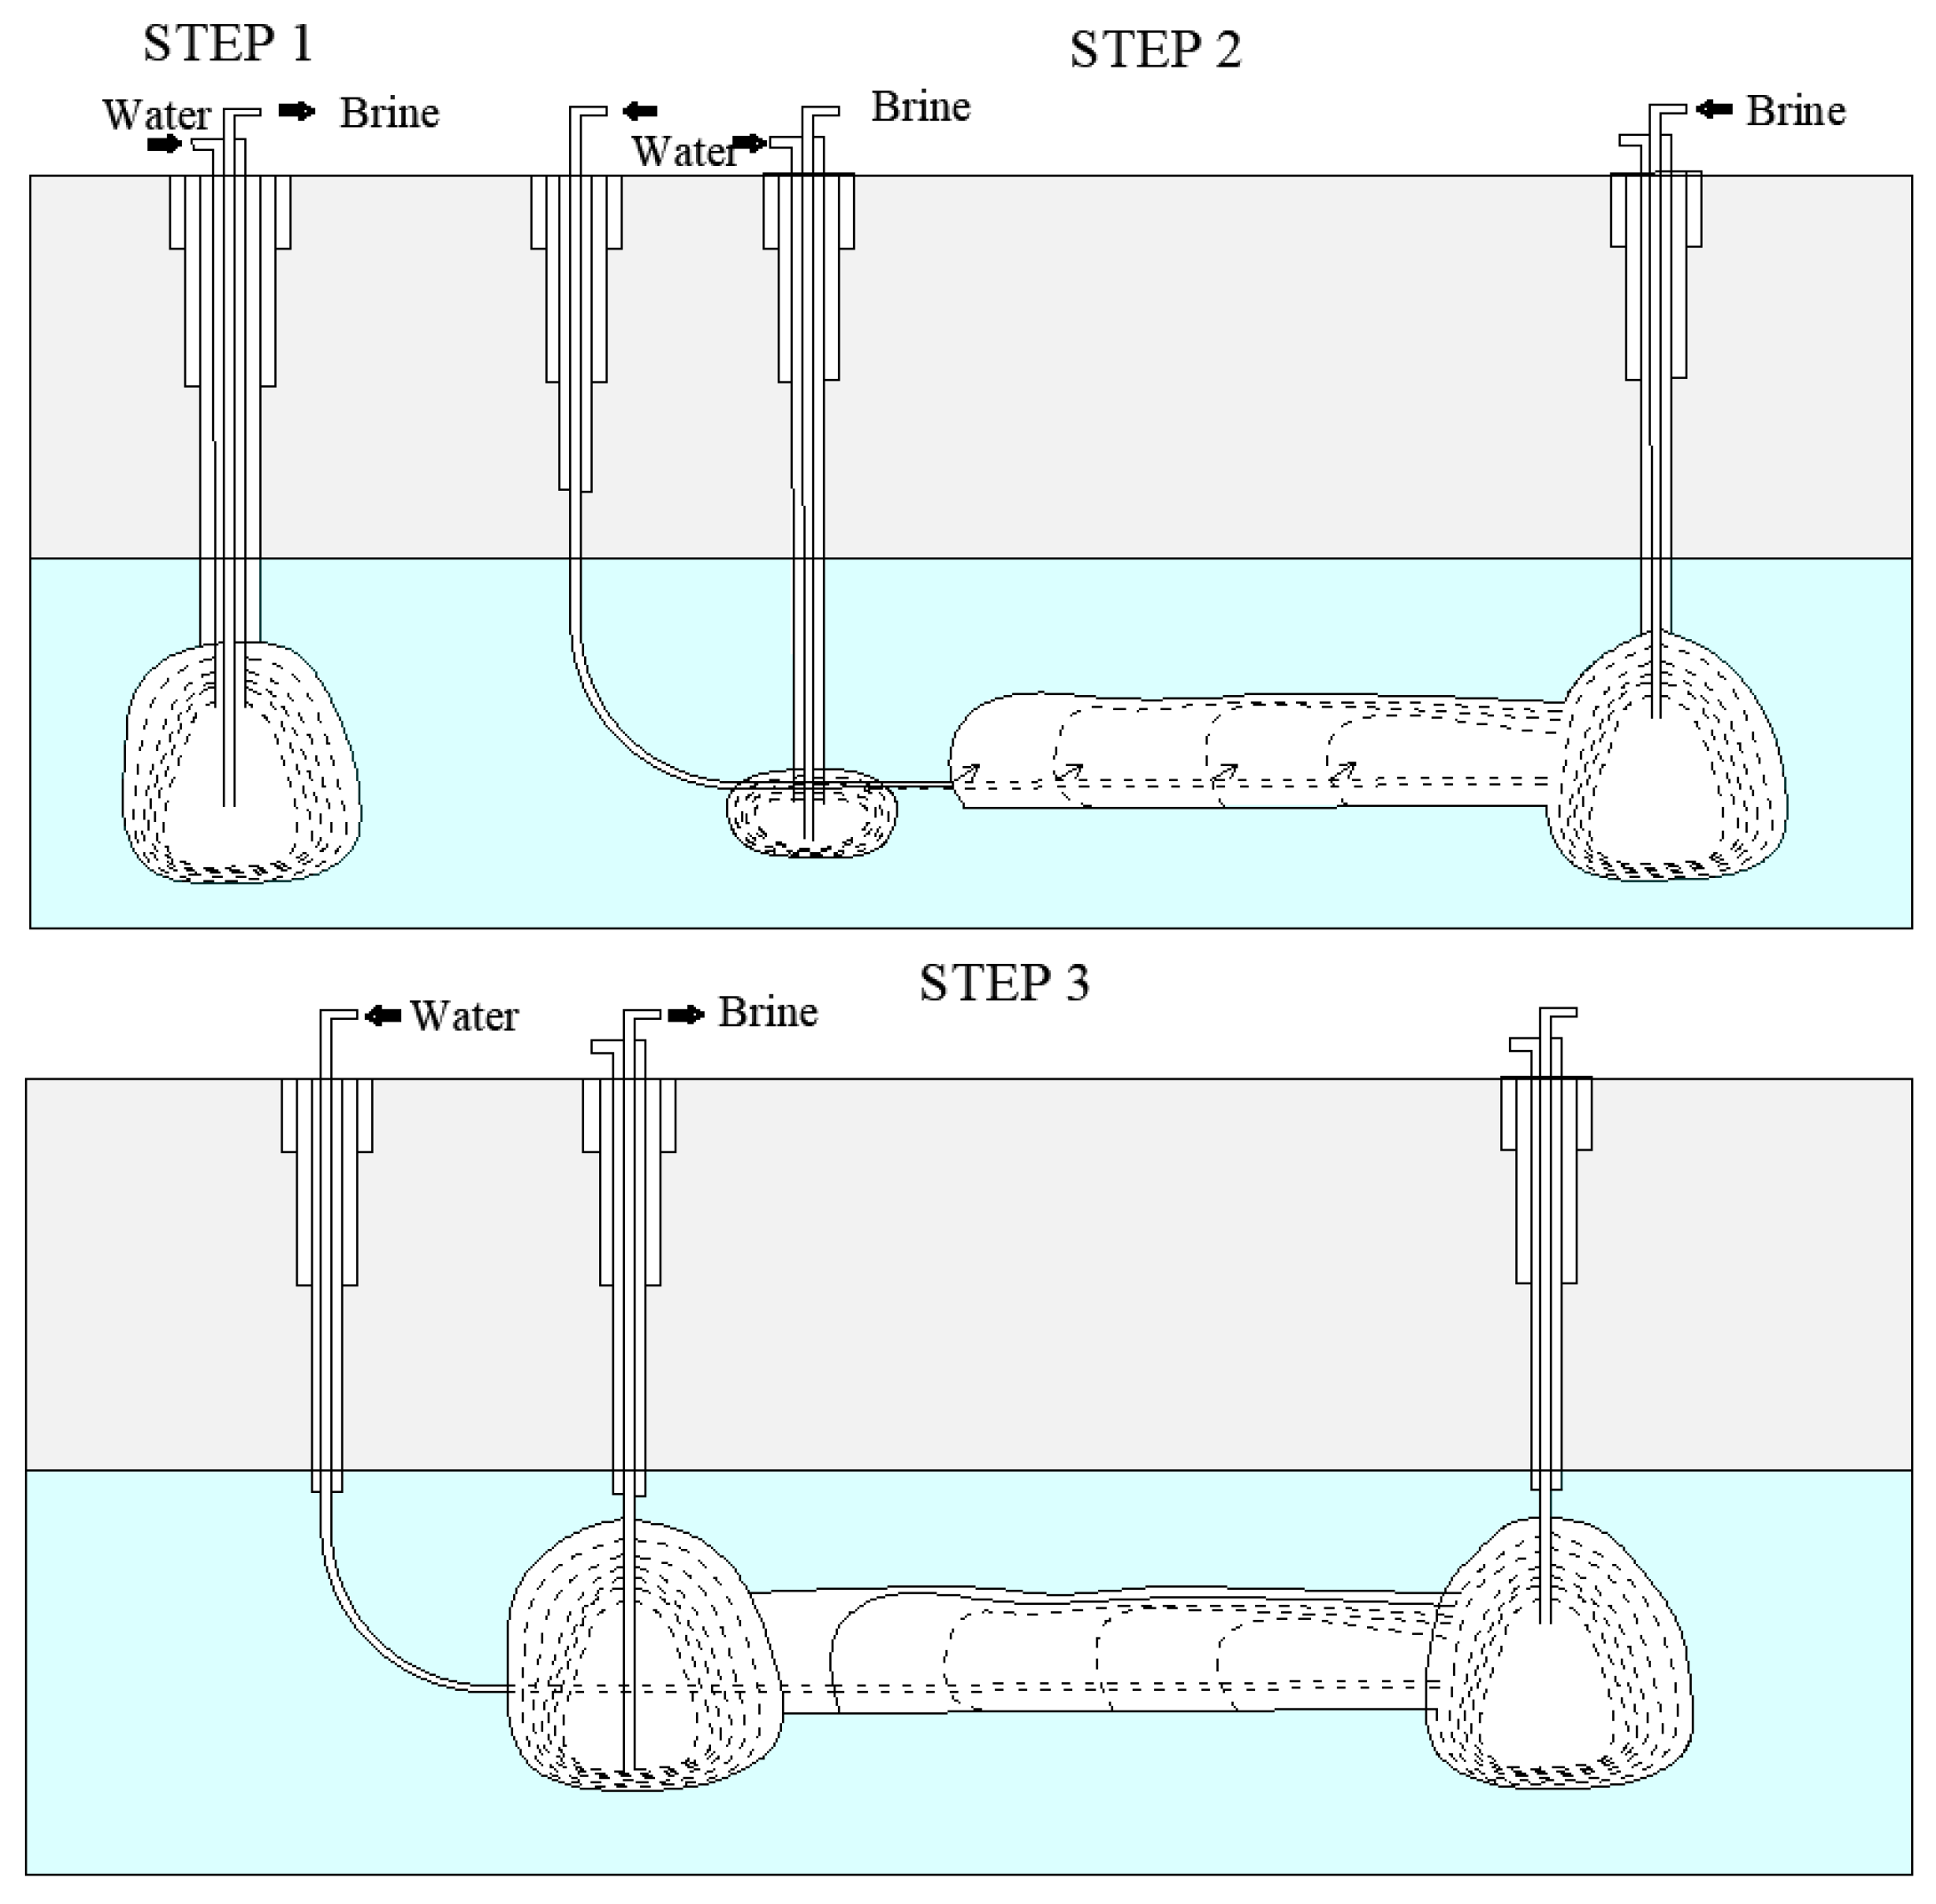
2.1.5. Two–Well Retreating Horizontal (TWRH) Cavern
2.2. Cavern Construction Economic and Technological Comparison
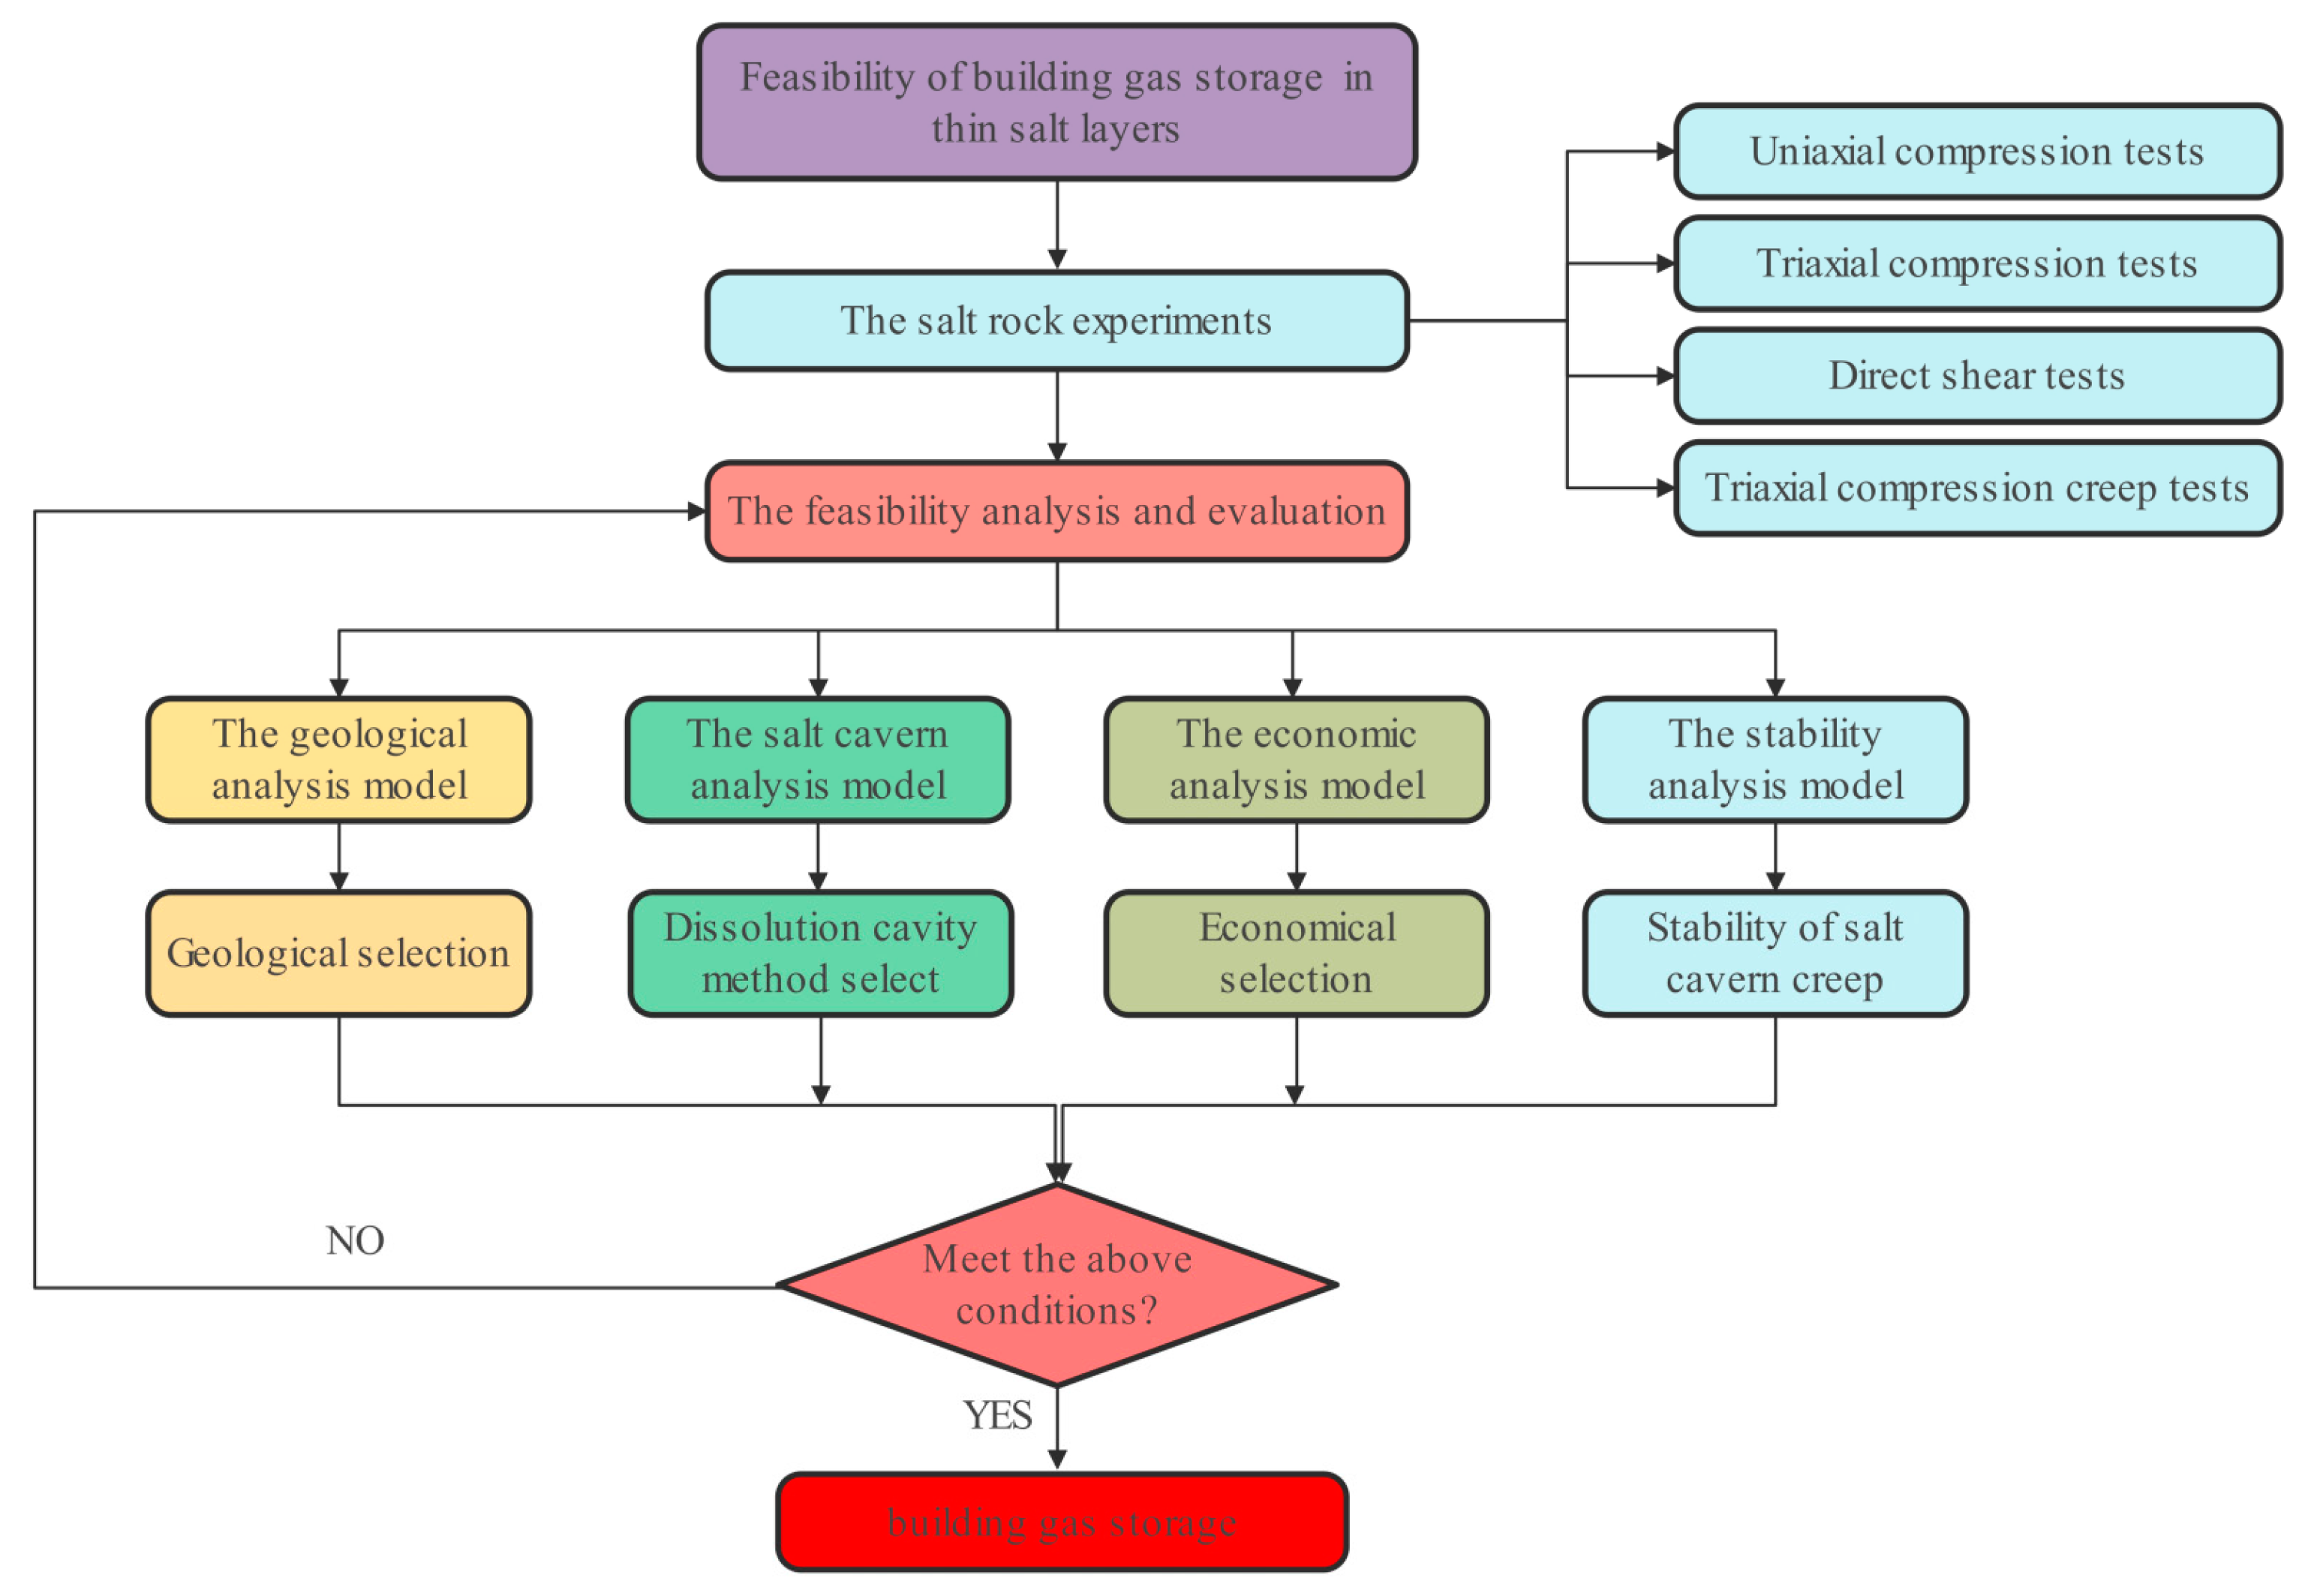
2.3. The Experiment and Evaluation Method
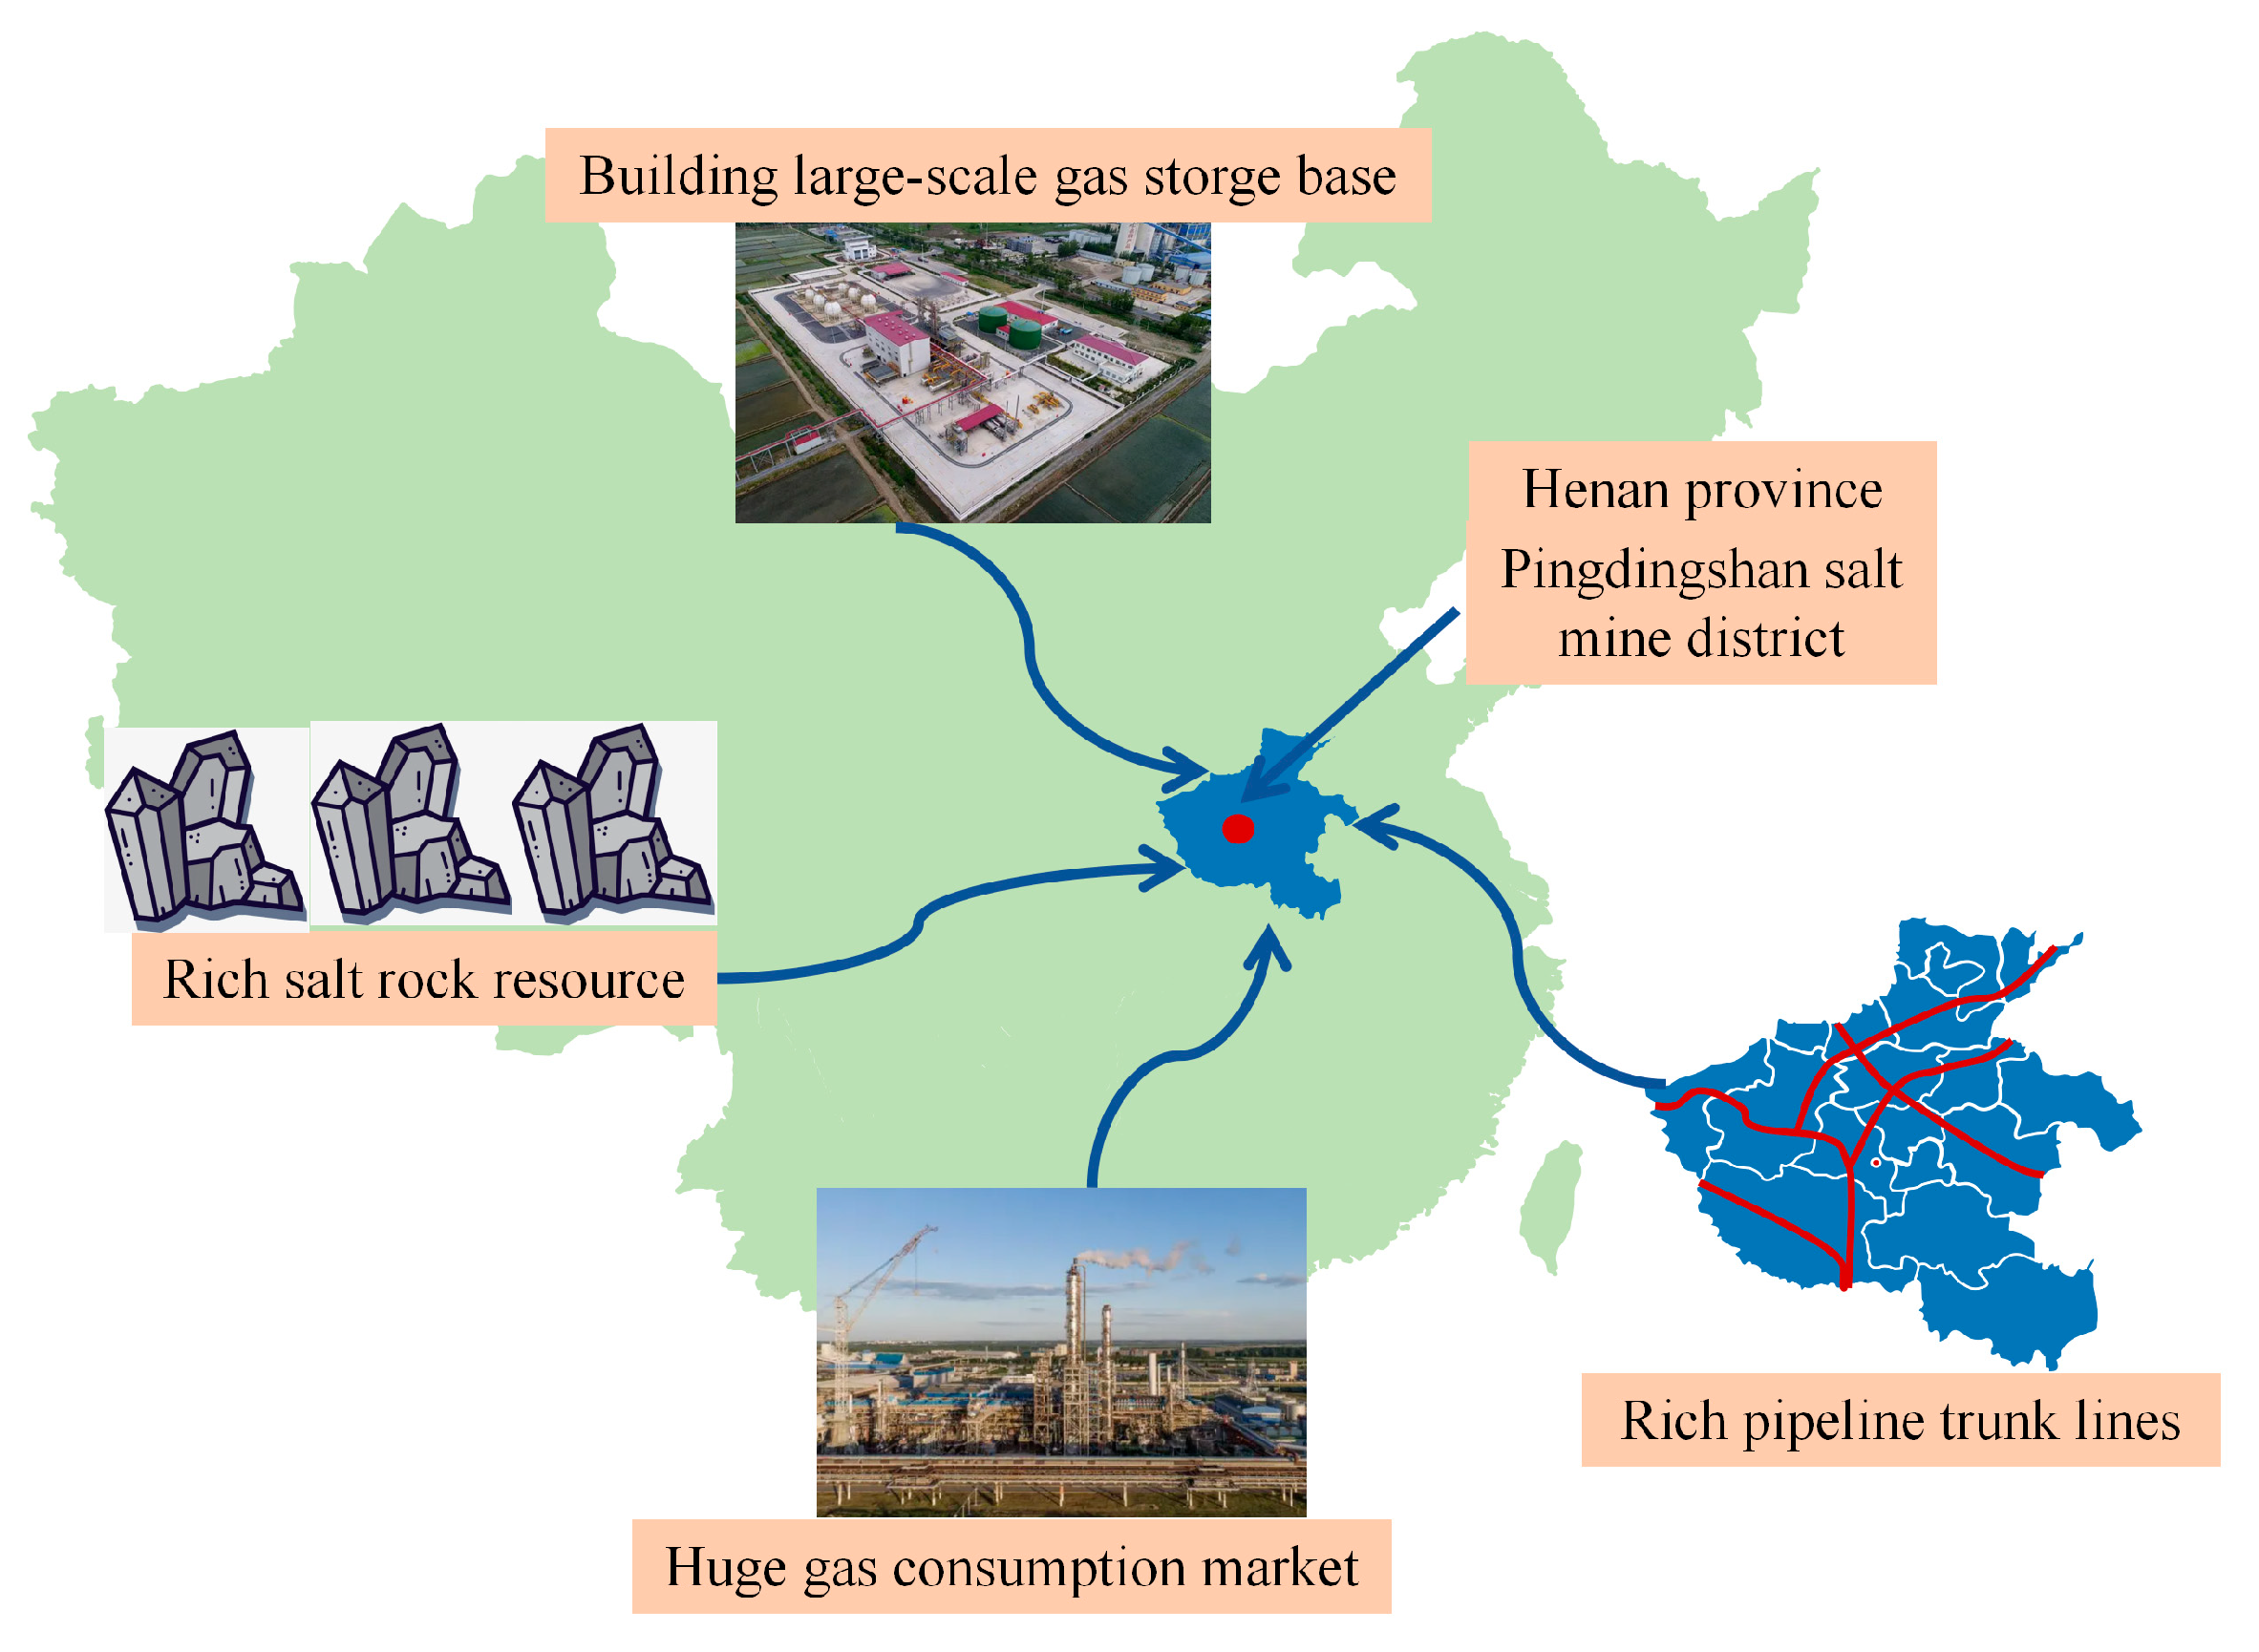
2.3.1. The Experiment Site
2.3.2. The Experiment Methods
3. Salt Rock Laboratory Tests
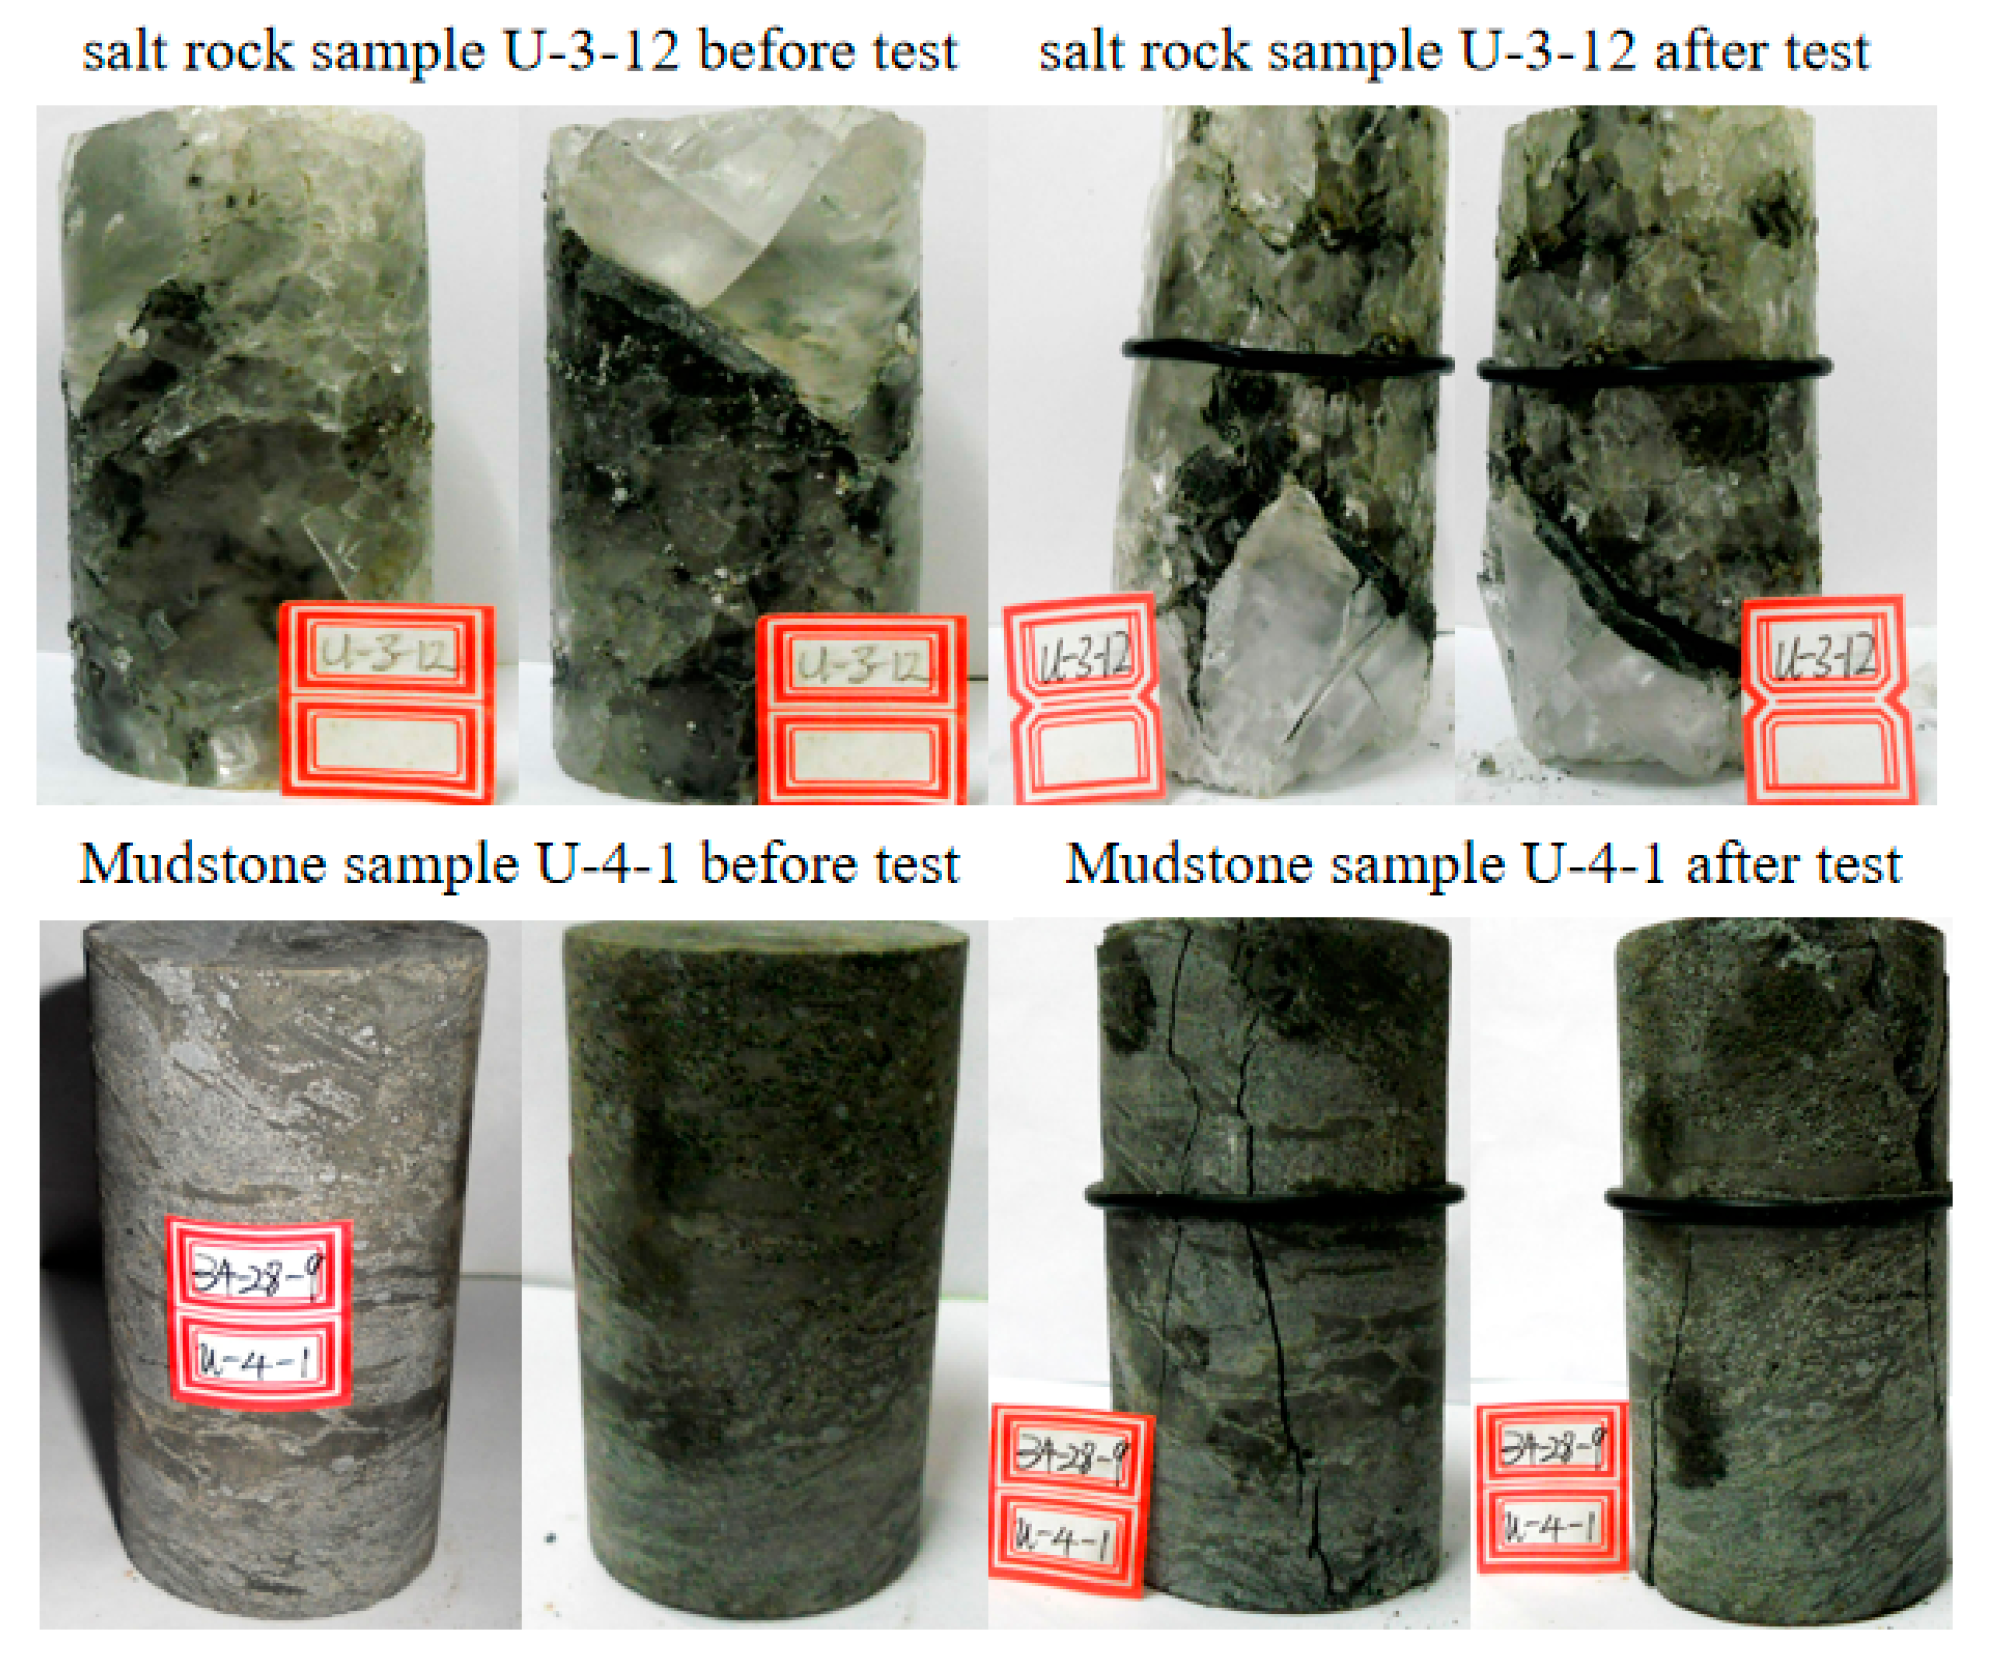
3.1. Uniaxial Compression Tests
3.2. Triaxial Compression Tests
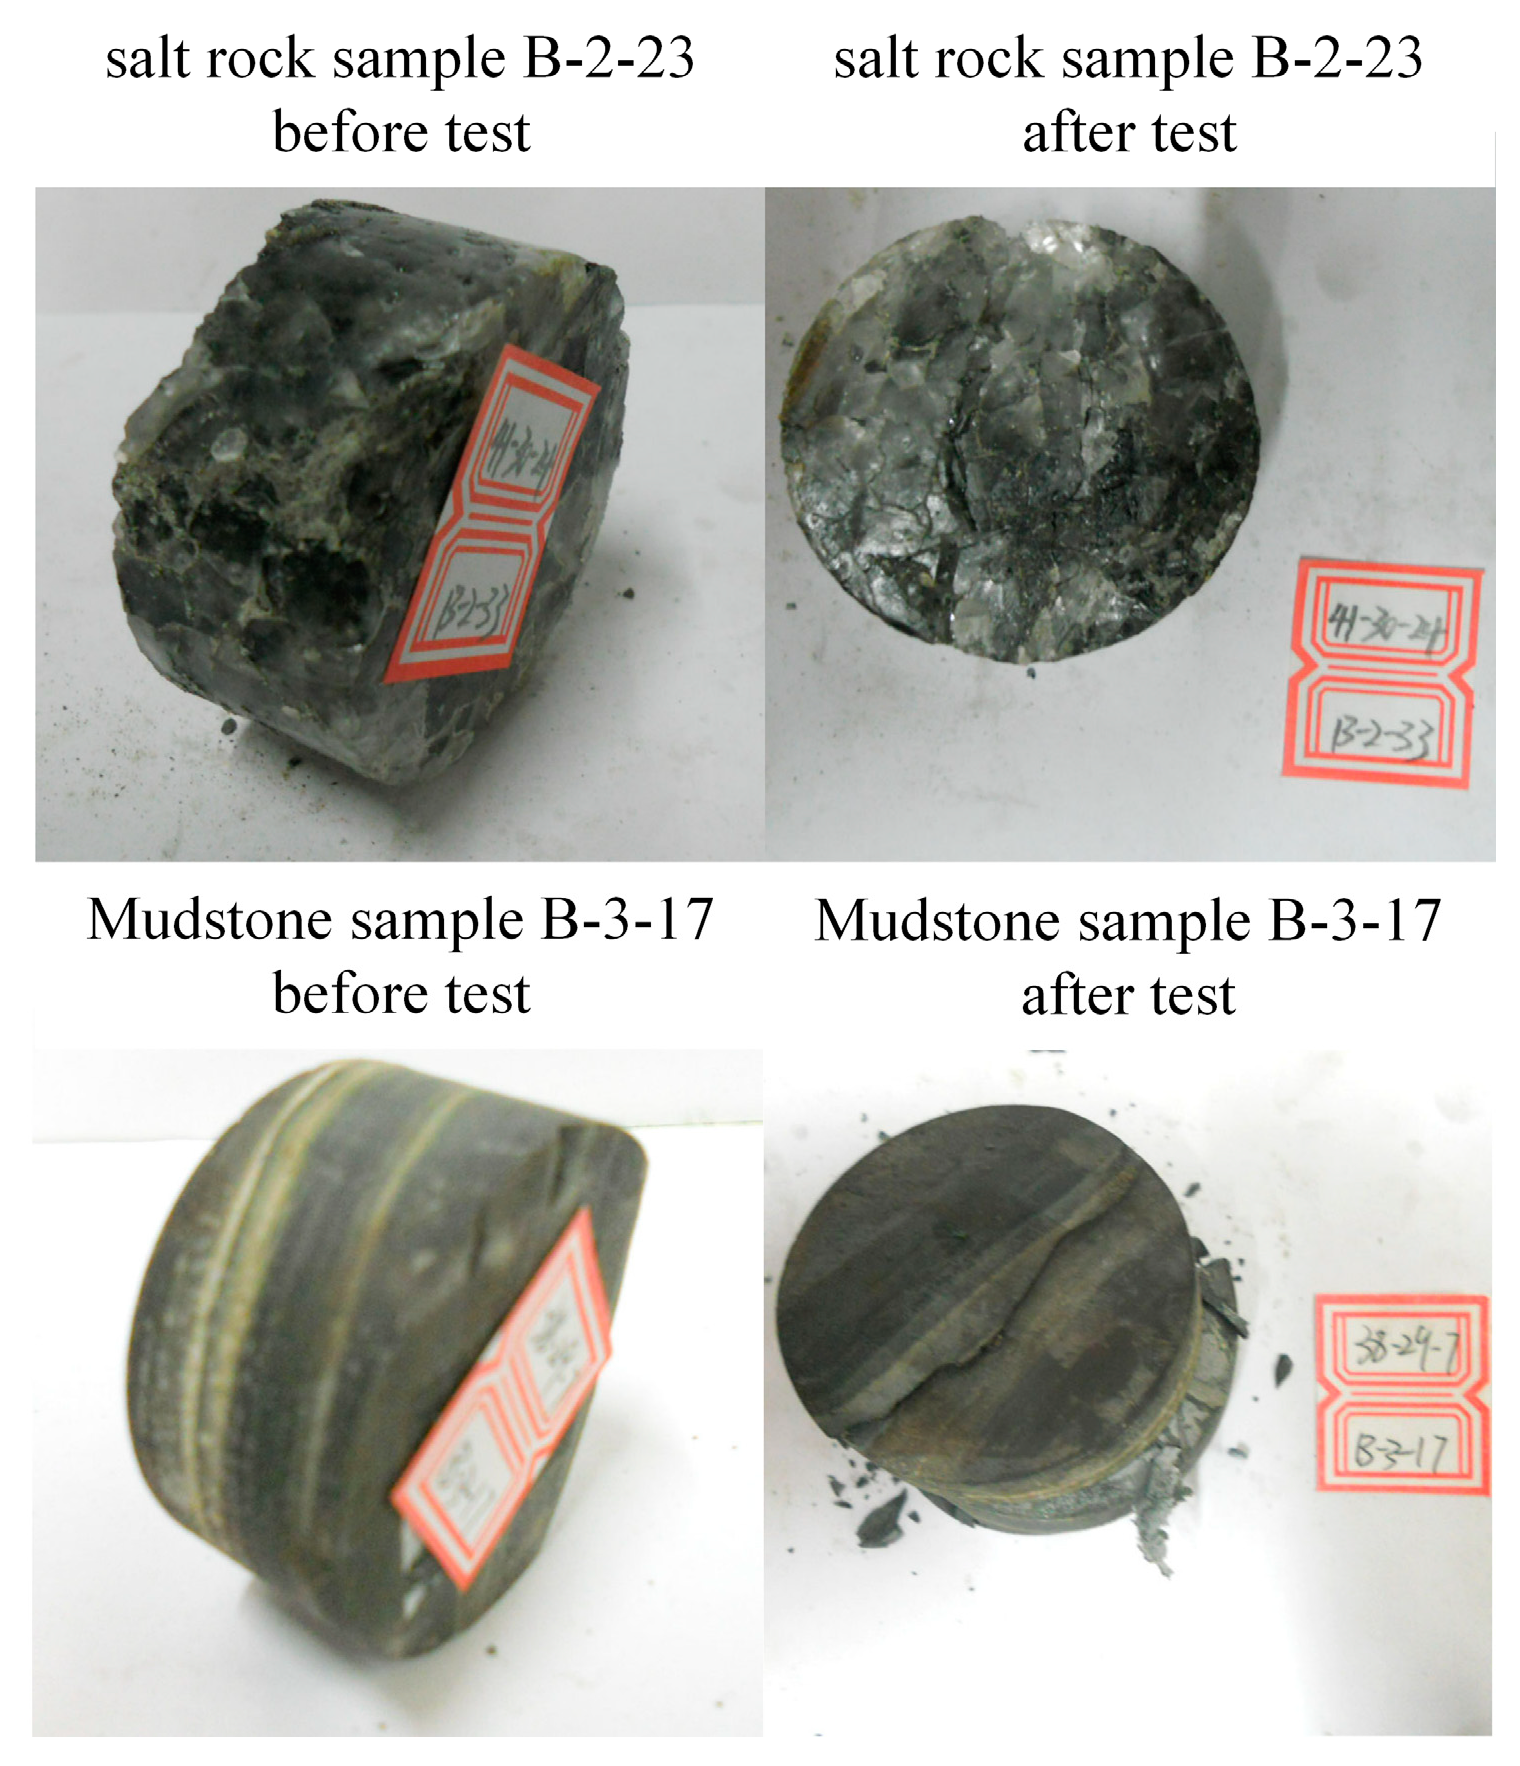
3.3. Brazilian Disk Splitting Test
3.4. Triaxial Compression Creep Tests
4. Feasibility Analysis of Construction
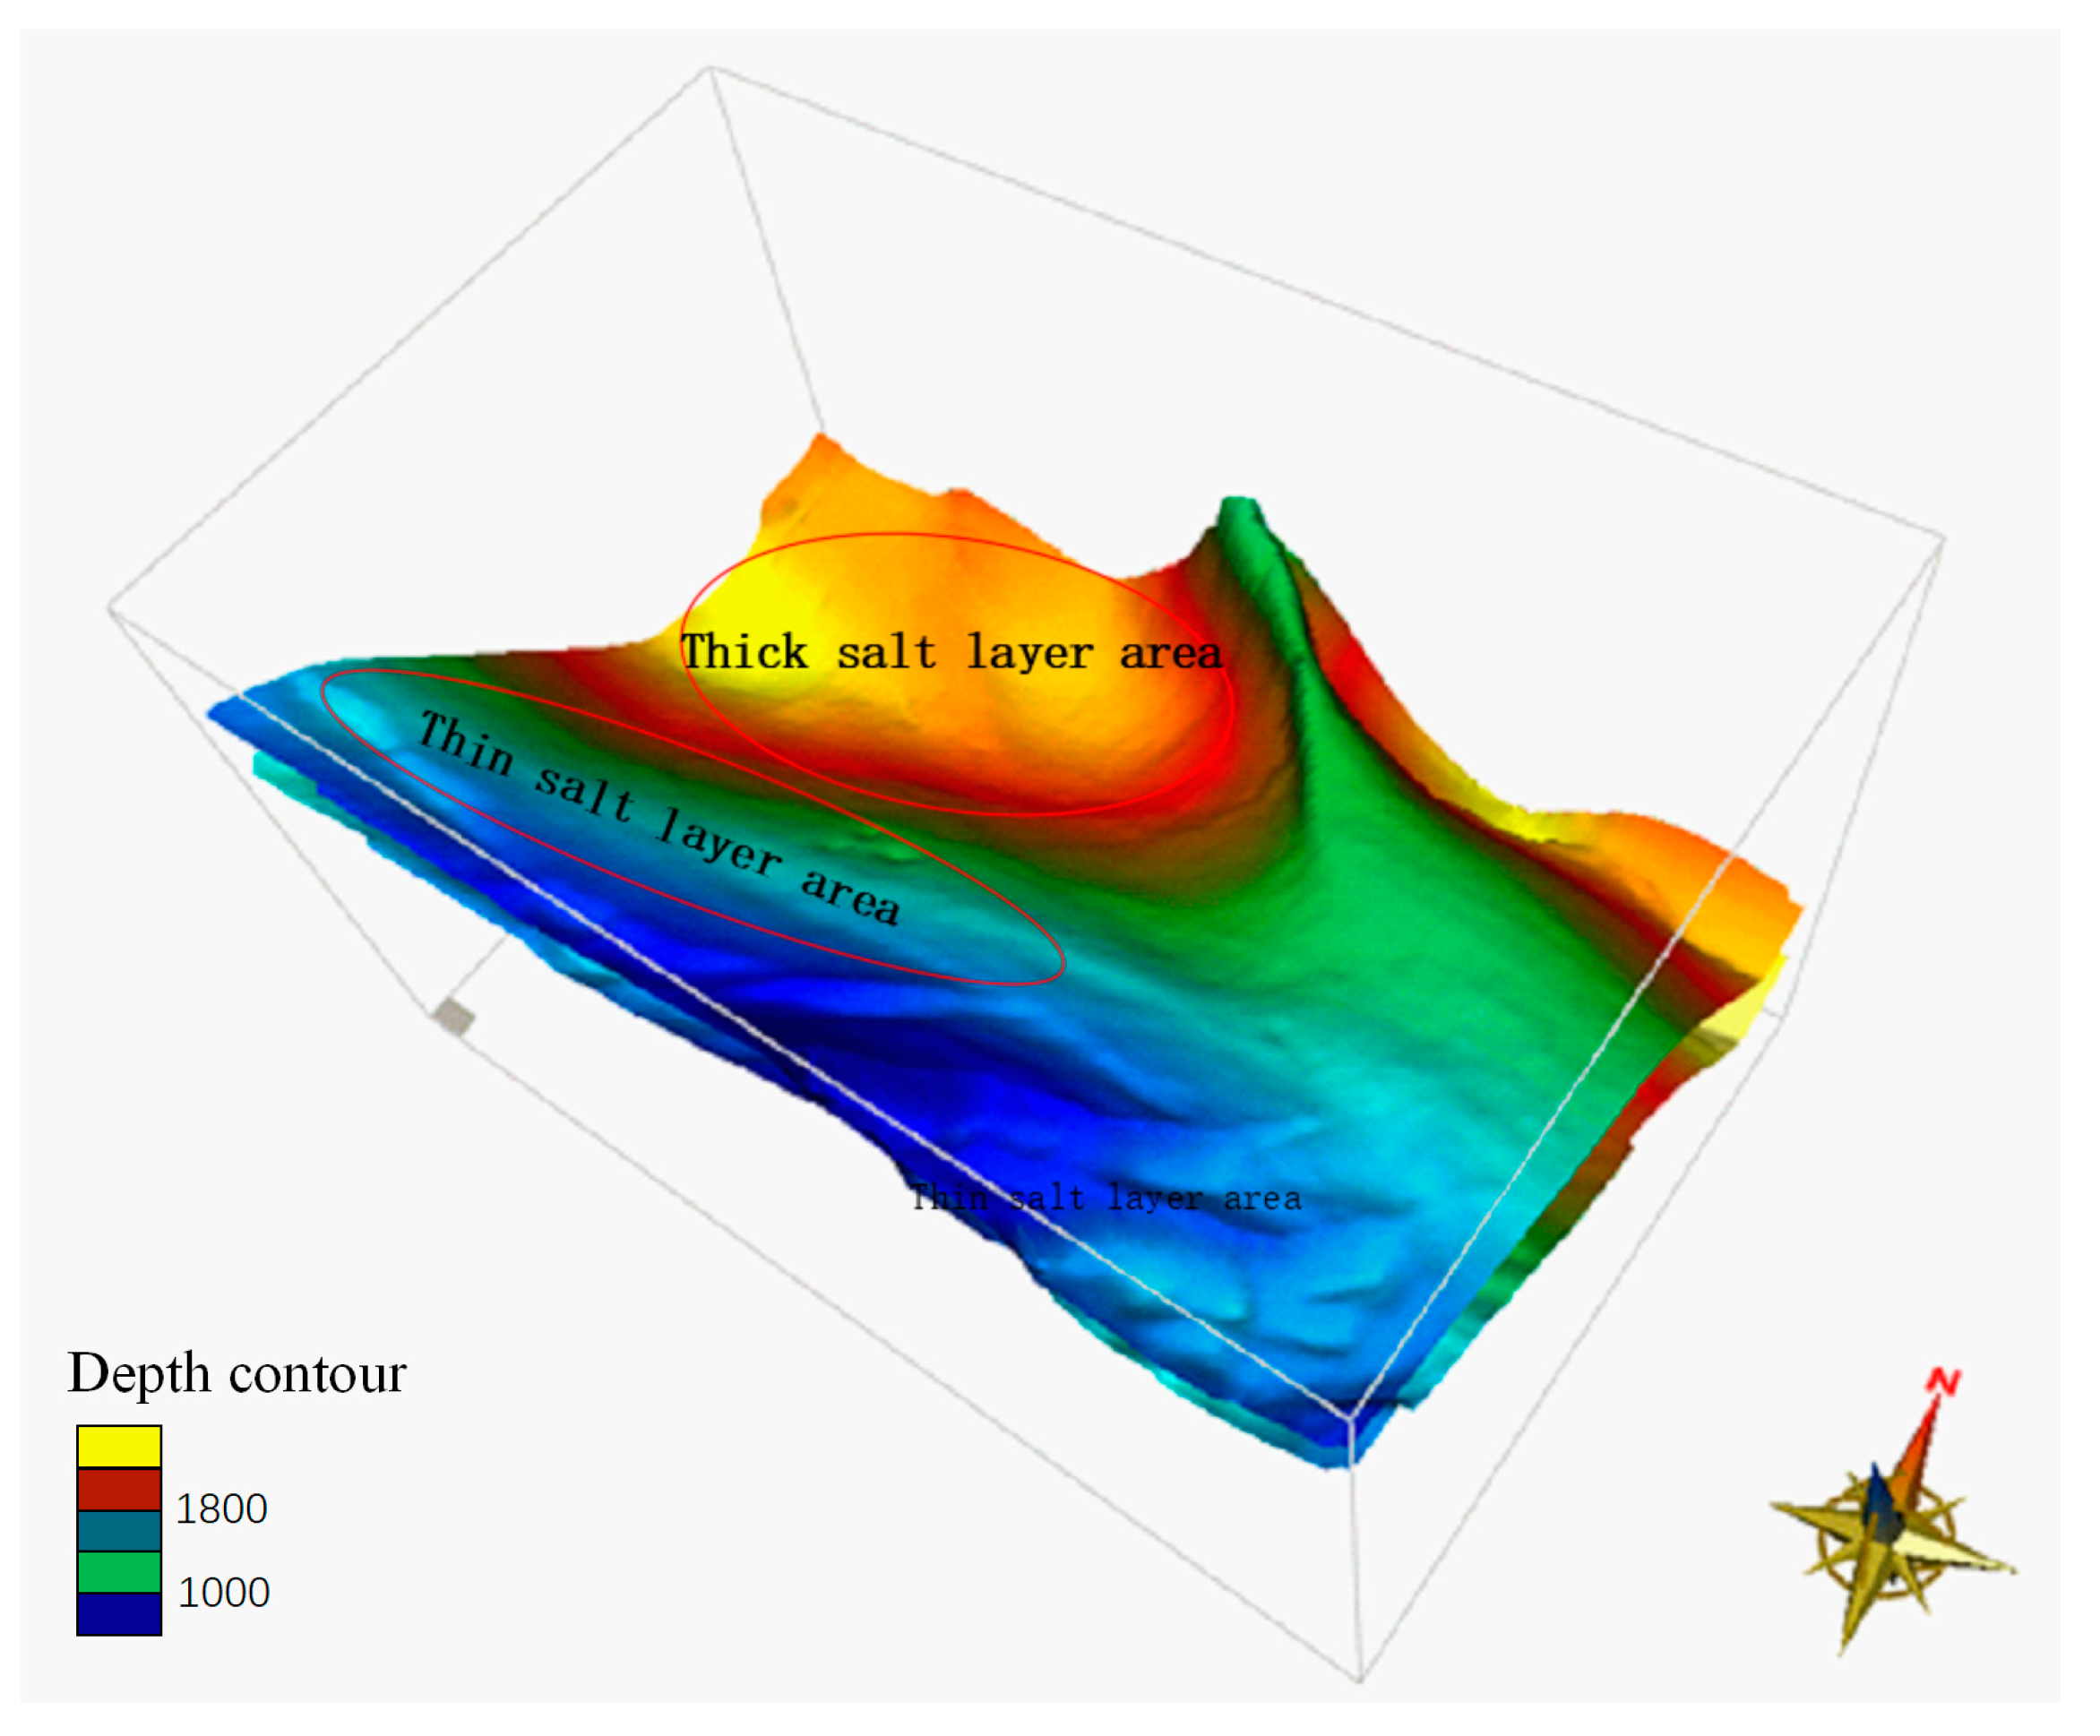
4.1. Geological Analysis
4.2. Cavern Construction
4.3. Economic Evaluation
4.4. Analysis of Cavern Stability
4.4.1. Three–Dimensional Stability Analysis Model
4.4.2. Calculation Parameters
4.4.3. Work Conditions
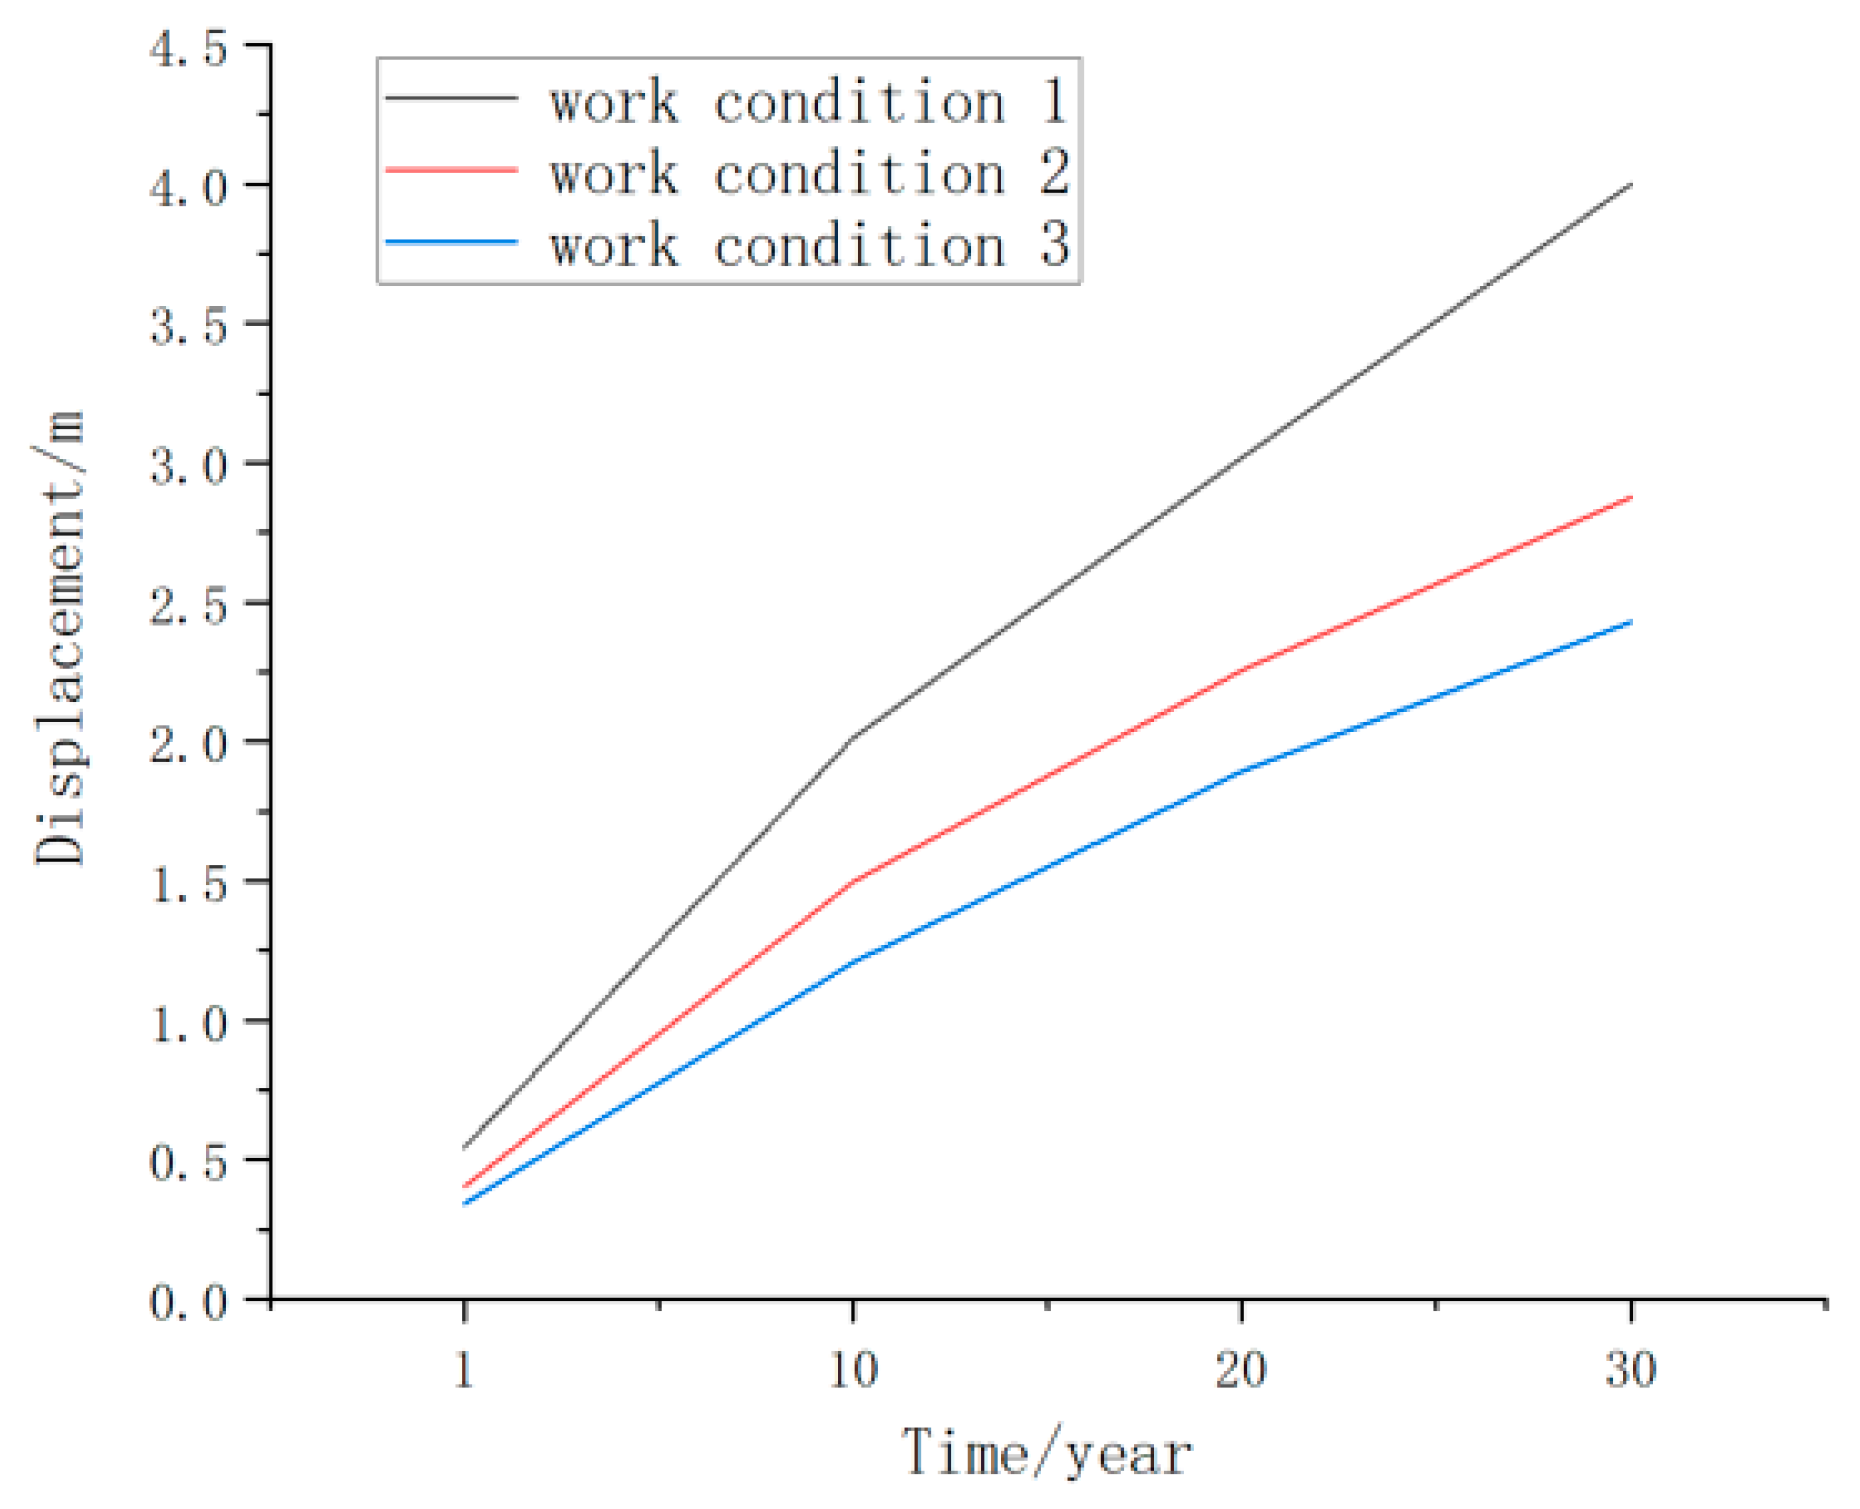
4.4.4. Deformation Analysis of Surrounding Rock
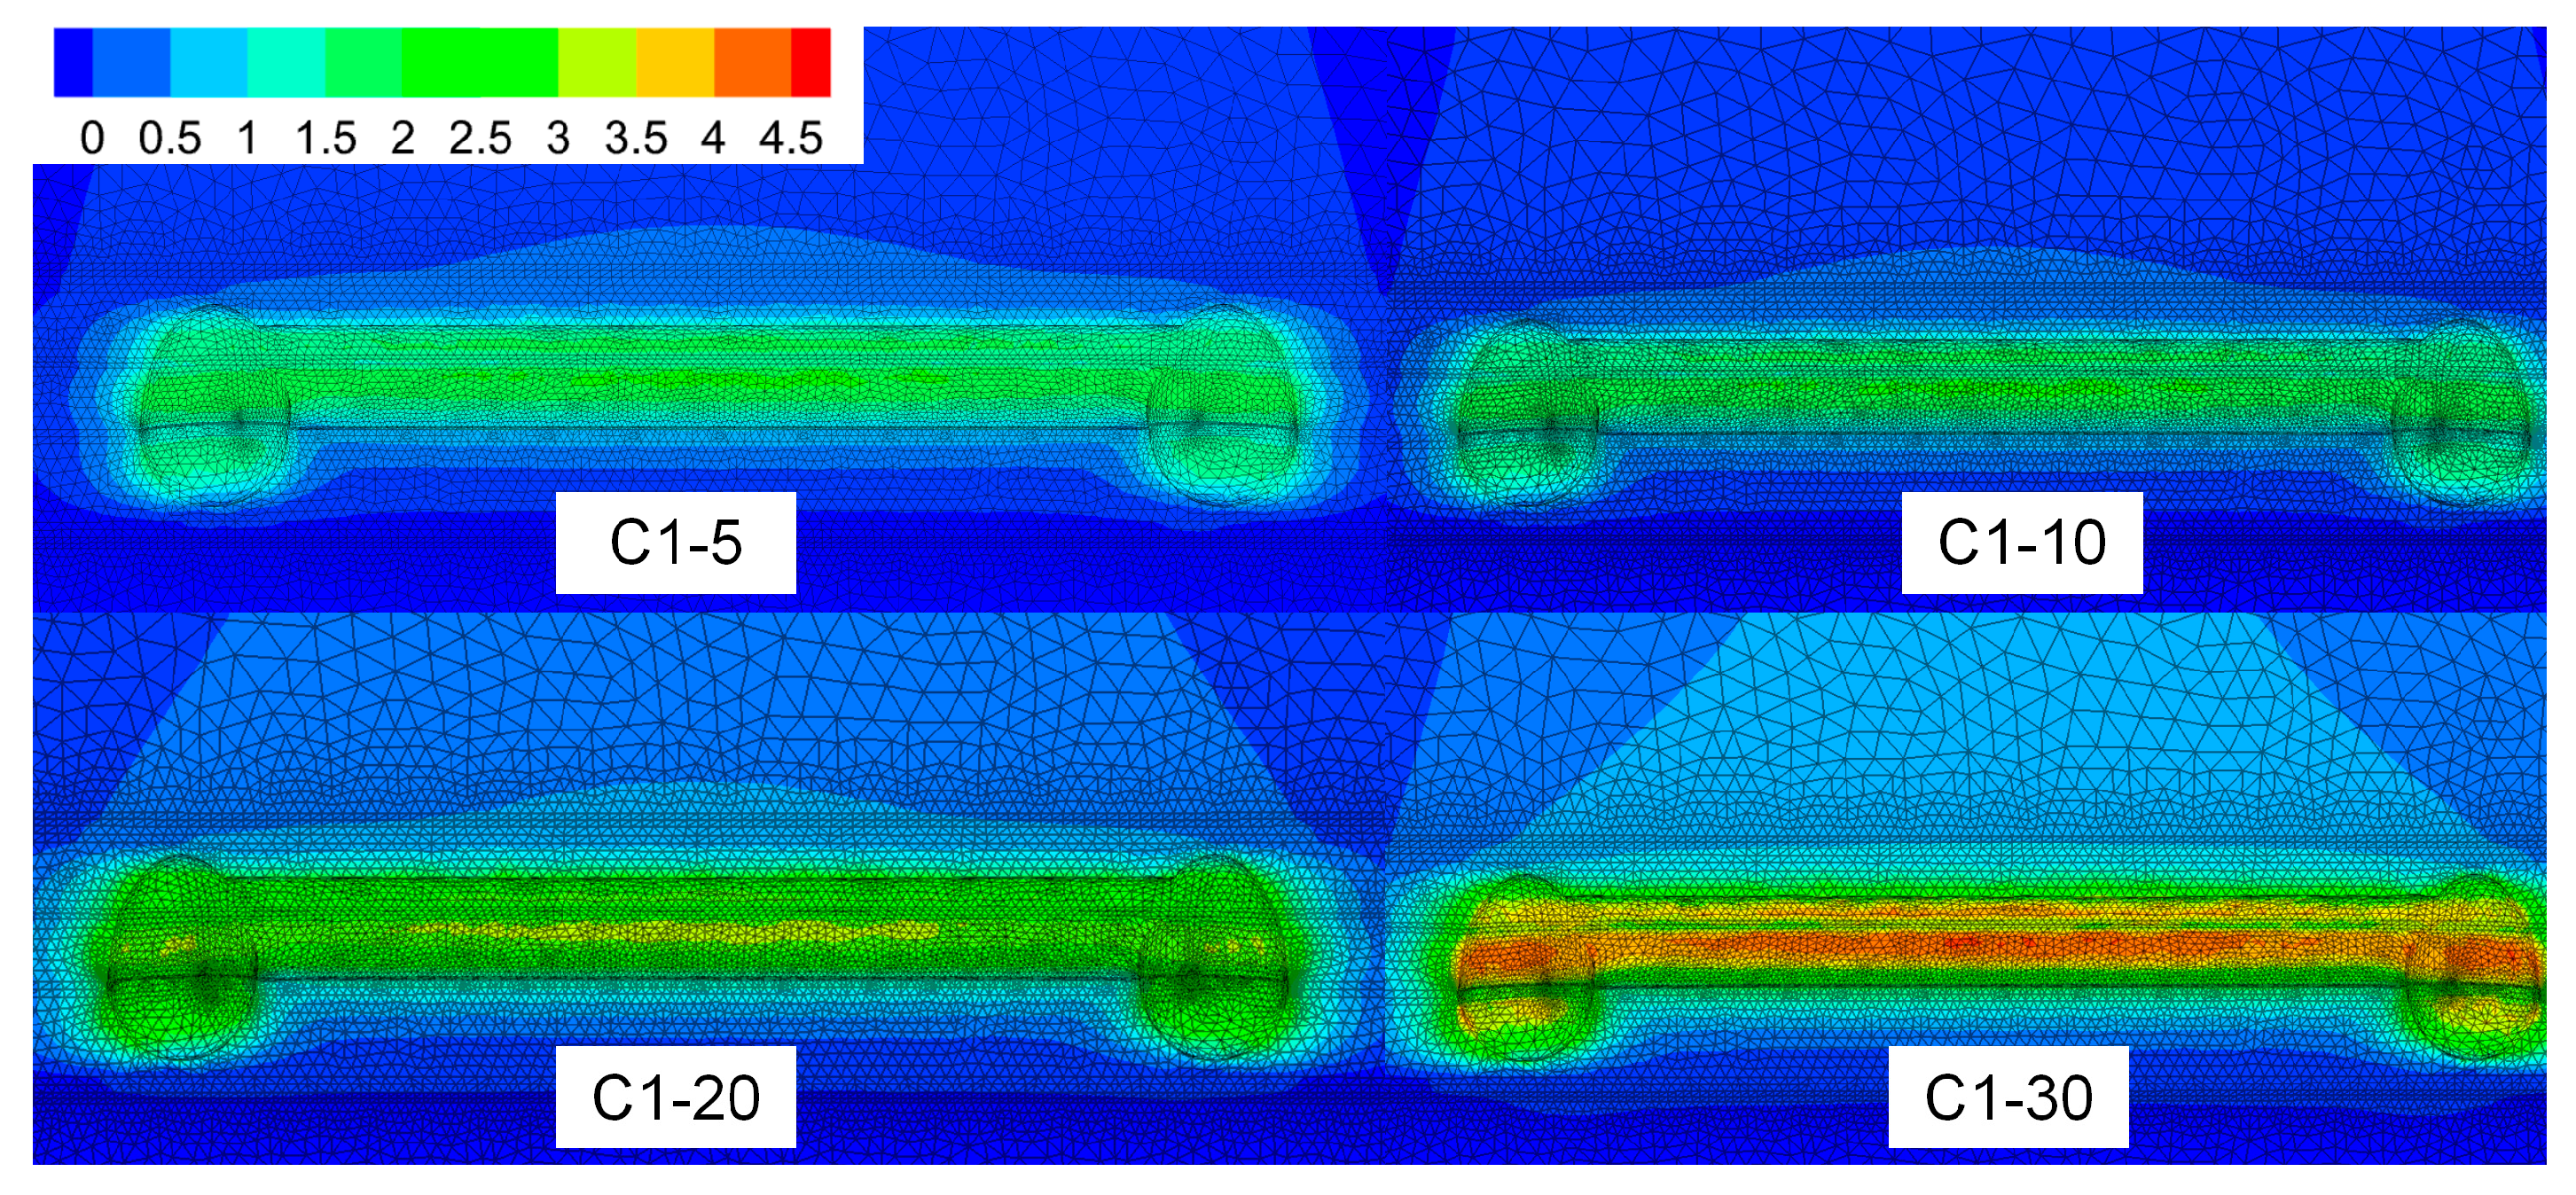
4.4.5. Volume Shrinkage
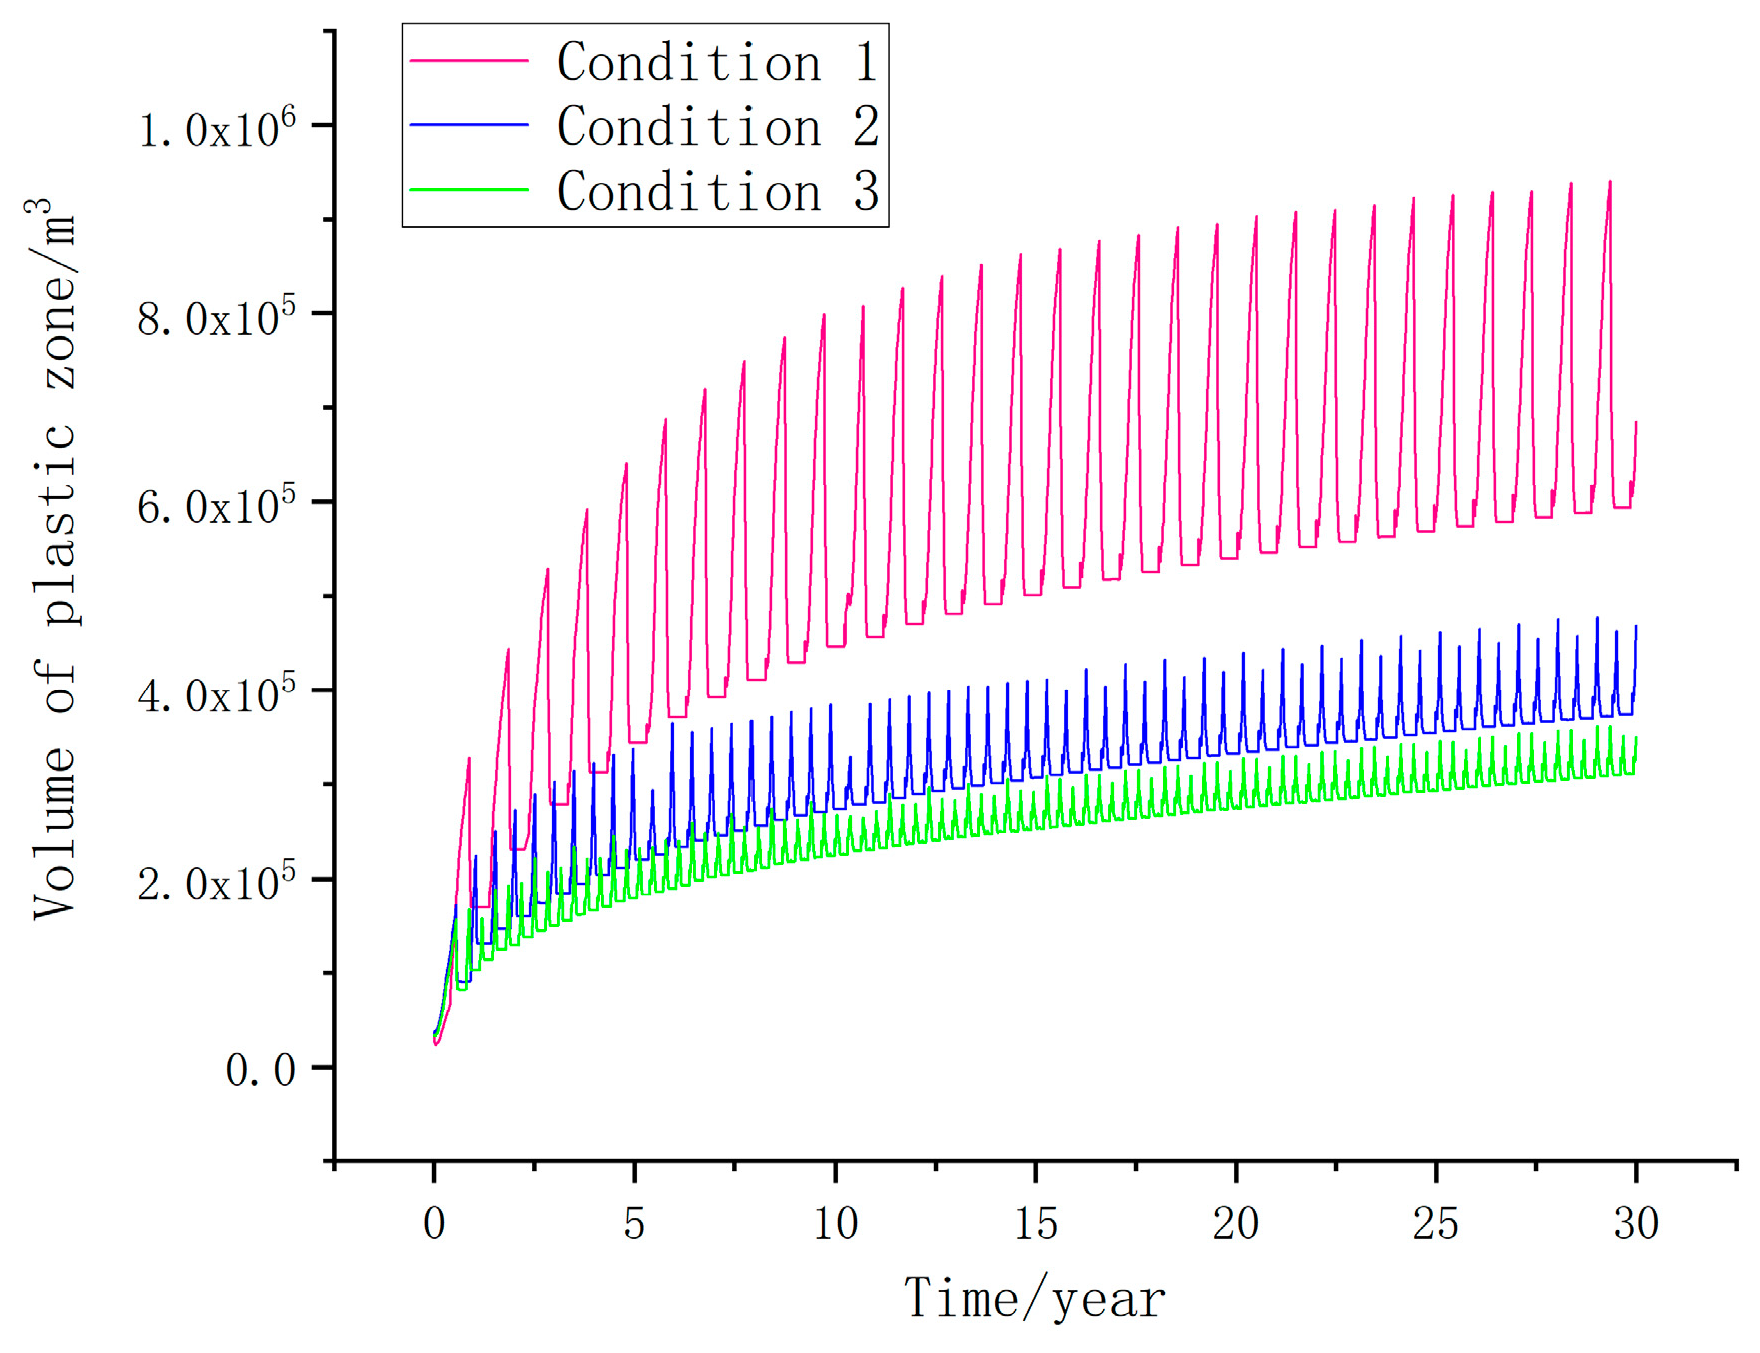
4.4.6. Relative Plastic Zones
4.4.7. Safety Factor
5. Conclusions and Prospect
- (i)
- A systematic comparison of various cavern construction methods was performed, analyzing their economic feasibility in thin salt layers. The horizontal multi–step method was identified as the optimal choice. The primary issue with conventional vertical cavern construction is the small volume and poor economic returns. Although the horizontal multi–step method remains the best option for constructing thin salt layers, it requires a specific salt quality and interlayer thickness, making it unsuitable for most of China’s multi–layered thin salt mines.
- (ii)
- A series of rock mechanics tests (unconfined compression, triaxial compression, Brazilian splitting, and triaxial creep) were conducted. Test results indicate that the experimental area has potential for constructing salt cavern gas storage.
- (iii)
- Based on 3D seismic data analysis, optimal locations within the 90–120 m range were identified.
- (iv)
- A new I–shaped cavern design, suitable for thin salt layers with multiple interlayers and low cavern formation rates, was proposed. The optimized horizontal cavern increases the effective volume by approximately 39% compared to the SWV cavern. Comparatively, the investment for the optimized horizontal cavern construction is reduced by 9.6% compared to conventional single–well, single–cavern methods and by 7.3% compared to the horizontal multi–step construction method.
- (v)
- An analysis of three injection and production scenarios was conducted for thin–salt–layer constructions, employing criteria such as the displacement, volume shrinkage rate, plastic zone, and safety factor for stability evaluation. The results demonstrate that the I–shaped cavern exhibits good stability, ensuring the stability of the surrounding rock under gas storage operation conditions.
Author Contributions
Funding
Data Availability Statement
Conflicts of Interest
References
- Li, L. Development of natural gas industry in China: Review and prospect. Nat. Gas Ind. 2021, 41, 187–196. [Google Scholar] [CrossRef]
- Hannan, M.A.; Hoque, M.M.; Mohamed, A.; Ayob, A. Review of energy storage systems for electric vehicle applications: Issues and challenges. Renew. Sustain. Energy Rev. 2017, 69, 771–789. [Google Scholar] [CrossRef]
- de Jong, C. Gas storage valuation and optimization. J. Nat. Gas Sci. Eng. 2015, 24, 365–378. [Google Scholar] [CrossRef]
- Lin, B.; Wang, T. Forecasting natural gas supply in China: Production peak and import trends. Energy Policy 2012, 49, 225–233. [Google Scholar] [CrossRef]
- Zhang, G.; Li, B.; Zheng, D.; Ding, G.; Wei, H.; Qian, P.; Li, C. Challenges to and proposals for underground gas storage (UGS) business in China. Nat. Gas Ind. 2017, 37, 153–159. [Google Scholar] [CrossRef]
- Liu, W.; Jiang, D.; Chen, J.; Daemen JJ, K.; Tang, K.; Wu, F. Comprehensive feasibility study of two–well–horizontal caverns for natural gas storage in thinly–bedded salt rocks in China. Energy 2018, 143, 1006–1019. [Google Scholar] [CrossRef]
- Lord, A.S.; Kobos, P.H.; Borns, D.J. Geologic storage of hydrogen: Scaling up to meet city transportation demands. Int. J. Hydrog. Energy 2014, 39, 15570–15582. [Google Scholar] [CrossRef]
- Liu, W.; Li, Q.; Yang, C.; Shi, X.; Wan, J.; Jurado, M.J.; Li, Y.; Jiang, D.; Chen, J.; Qiao, W.; et al. The role of underground salt caverns for large–scale energy storage: A review and prospects. Energy Storage Mater. 2023, 63, 103045. [Google Scholar] [CrossRef]
- Zhang, N.; Gao, X.; Yan, B.; Zhang, Y.; Ji, S.; Shi, X. Overview of Salt Cavern Oil Storage Development and Site Suitability Analysis. Processes 2024, 12, 1709. [Google Scholar] [CrossRef]
- Luo, X.; Wang, J.; Dooner, M.; Clarke, J. Overview of current development in electrical energy storage technologies and the application potential in power system operation. Appl. Energy 2015, 137, 511–536. [Google Scholar] [CrossRef]
- Li, H.; Ma, H.; Liu, J.; Zhu, S.; Zhao, K.; Zheng, Z.; Zeng, Z.; Yang, C. Large–scale CAES in bedded rock salt: A case study in Jiangsu Province, China. Energy 2023, 281, 128271. [Google Scholar] [CrossRef]
- Małachowska, A.; Łukasik, N.; Mioduska, J.; Gębicki, J. Hydrogen Storage in Geological Formations–The Potential of Salt Caverns. Energies 2022, 15, 5038. [Google Scholar] [CrossRef]
- Tackie–Otoo, B.N.; Haq, M.B. A comprehensive review on geo–storage of H2 in salt caverns: Prospect and research advances. Fuel 2024, 356, 129609. [Google Scholar] [CrossRef]
- Maraggi, L.M.R.; Moscardelli, L.G. Hydrogen storage potential of salt domes in the Gulf Coast of the United States. J. Energy Storage 2024, 82, 110585. [Google Scholar] [CrossRef]
- Wei, L.; Jie, C.; Deyi, J.; Xilin, S.; Yinping, L.; Daemen, J.J.K.; Chunhe, Y. Tightness and suit–ability evaluation of abandoned salt caverns served as hydrocarbon energies storage under adverse geological conditions (AGC). Appl Energy 2016, 703, 20. [Google Scholar]
- Zhang, Z.; Jiang, D.; Liu, W.; Chen, J.; Li, E.; Fan, J.; Xie, K. Study on the mechanism of roof collapse and leakage of horizontal cavern in thinly bedded salt rocks. Environ. Earth Sci. 2019, 78, 292. [Google Scholar] [CrossRef]
- Zhang, G.; Li, Y.; Yang, C.; Daemen, J.J.K. Stability and tightness evaluation of bedded rock salt formations for underground gas/oil storage. Acta Geotech. 2014, 9, 161–179. [Google Scholar] [CrossRef]
- Jiang, D.; Wang, Y.; Liu, W.; Li, L.; Qiao, W.; Chen, J.; Li, D.; Li, Z.; Fan, J. Construction simulation of large–spacing–two–well salt cavern with gas blanket and stability evaluation of cavern for gas storage. J. Energy Storage 2022, 48, 103932. [Google Scholar] [CrossRef]
- Jing, W.; Zhao, Y.; Kong, J.; Huang, C.; Jilani, K.M.; Li, H. The time–space prediction model of surface settlement for above underground gas storage cavern in salt rock based on Gaussian function. J. Nat. Gas Sci. Eng. 2018, 53, 45–54. [Google Scholar] [CrossRef]
- Lyu, C.; Dai, H.; Ma, C.; Zhou, P.; Zhao, C.; Xu, D.; Zhang, L.; Liang, C. Prediction model for three–dimensional surface subsidence of salt cavern storage with different shapes. Energy 2024, 297, 131265. [Google Scholar] [CrossRef]
- Li, Y.P.; Shi, X.L.; Yang, C.H.; Qu, D.A. Several Key Problems About Control of Solution Mining for Oil/Gas Storage in Deep Salt Mine. Chin. J. Rock Mech. Eng. 2012, 31, 1785–1796. [Google Scholar]
- Jiang, D.Y.; Yi, L.; Chen, J.; Ren, S.; Zhang, J.W.; Li, Y.P. Similar Experiment of the Concentration Field in Layered Salt–rock Cavity in Construction Period. J. Sichuan University. Eng. Sci. Ed. 2014, 46, 14–21. [Google Scholar]
- Li, J.; Shi, X.; Yang, C.; Li, Y.; Wang, T.; Ma, H.; Shi, H.; Li, J.; Liu, J. Repair of irregularly shaped salt cavern gas storage by re–leaching under gas blanket. J. Nat. Gas Sci. Eng. 2017, 45, 848–859. [Google Scholar] [CrossRef]
- Chen, J.; Liu, W.; Jiang, D.; Zhang, J.; Ren, S.; Li, L.; Li, X.; Shi, X. Preliminary investigation on the feasibility of a clean CAES system coupled with wind and solar energy in China. Energy 2017, 127, 462–478. [Google Scholar] [CrossRef]
- Xing, W.; Zhao, J.; Hou, Z.; Were, P.; Li, M.; Wang, G. Horizontal natural gas caverns in thin–bedded rock salt formations. Environ. Earth Sci. 2015, 73, 6973–6985. [Google Scholar] [CrossRef]
- Yuan, G.; Wan, J.; Li, J.; Li, G.; Xia, Y.; Ban, F.; Zhang, H.; Jurado, M.J.; Peng, T.; Liu, W. Stability analysis of a typical two–well–horizontal saddle–shaped salt cavern. J. Energy Storage 2021, 40, 102763. [Google Scholar] [CrossRef]
- Li, J.; Tang, Y.; Shi, X.; Xu, W.; Yang, C. Modeling the construction of energy storage salt caverns in bedded salt. Appl. Energy 2019, 255, 113866. [Google Scholar] [CrossRef]
- Shi, X.; Zhang, S. Construction modeling and parameter optimization of multi–step horizontal energy storage salt caverns. Energy 2020, 203, 6433. [Google Scholar]
- Igoshin, A.I.; Kazaryan, V.A.; Pozdnyakov, A.G.; Salokhin, V.I.; Vasjuta, Y.S. Creation of Tunnel Cavities in Rock Salt Beds of Small Thickness; Solution Mining Research Institute Spring Meeting: Krakow, Poland, 1997. [Google Scholar]
- Yang, C.; Wang, T.; Qu, D.; Ma, H.; Li, Y.; Shi, X.; Daemen, J. Feasibility analysis of using horizontal caverns for underground gas storage: A case study of Yunying salt district. J. Nat. Gas Sci. Eng. 2016, 36, 252–266. [Google Scholar] [CrossRef]
- Wang, T.; Yang, C.; Ma, H.; Daemen, J.; Wu, H. Safety evaluation of gas storage caverns located close to a tectonic fault. J. Nat. Gas Sci. Eng. 2015, 23, 281–293. [Google Scholar] [CrossRef]
- Yang, C.; Wang, T.; Li, Y.; Yang, H.; Li, J.; Qu, D.; Xu, B.; Yang, Y.; Daemen, J. Feasibility analysis of using abandoned salt caverns for large–scale underground energy storage in China. Appl. Energy 2015, 137, 467–481. [Google Scholar] [CrossRef]
- Dong, Z.; Li, Y.; Li, H.; Wang, Z.; Shi, X.; Chen, X.; Lu, Q. Experimental Study on the Influence of Temperature on Rock Salt Creep. Rock Mech. Rock Eng. 2023, 56, 3499–3518. [Google Scholar] [CrossRef]
- Li, W.; Chen, G.; Ding, S.; Zhang, Y. A method for assessing the gas capacity based on thermodynamic state analysis for salt cavern during operation. J. Energy Storage 2022, 50, 104316. [Google Scholar] [CrossRef]
- Liu, J.; Wang, Y.; Xie, K.; Liu, Y. Gas injection and brine discharge in rock salt gas storage studied via numerical simulation. PLoS ONE 2018, 13, e0207058. [Google Scholar] [CrossRef] [PubMed]
- Li, Q.; Liu, W.; Jiang, L.; Qin, J.; Wang, Y.; Wan, J.; Zhu, X. Comprehensive safety assessment of two–well–horizontal caverns with sediment space for compressed air energy storage in low–grade salt rocks. J. Energy Storage 2024, 102, 114037. [Google Scholar] [CrossRef]
- Wei, X.; Shi, X.; Li, Y.; Li, P.; Ban, S.; Zhao, K.; Ma, H.; Liu, H.; Yang, C. A comprehensive feasibility evaluation of salt cavern oil energy storage system in China. Appl. Energy 2023, 351, 121807. [Google Scholar] [CrossRef]
- Wang, Y.; Zhang, X.; Jiang, D.; Liu, W.; Wan, J.; Li, Z.; Fan, J.; Wang, W. Study on stability and economic evaluation of two–well–vertical salt cavern energy storage. J. Energy Storage 2022, 56, 106164. [Google Scholar] [CrossRef]
- Li, H.; Deng, J.; Wanyan, Q.; Feng, Y.; Kamgue Lenwoue, A.R.; Luo, C.; Hui, C. Numerical Investigation on Shape Optimization of Small–Spacing Twin–Well for Salt Cavern Gas Storage in Ultra–Deep Formation. Energies 2021, 14, 2859. [Google Scholar] [CrossRef]
- Devries, M.K. Numerical Simulations of Natural gas Storage Caverns in Bedded Salt; American Rock Mechanics Association: Saddle Brook, NJ, USA, 2005. [Google Scholar]
- Sobolik, S.R. Analysis of Cavern and Well Stability at the Bryan Mound SPR Site Using the M D Salt Creep Model; Sandia National Laboratories: Albuquerque, NM, USA, 2018. [Google Scholar]


| Method | Advantages | Disadvantages | Applicability | Drilling and Completion Cost |
|---|---|---|---|---|
| SWV cavern | (i) Mature technology and wide applicability | (i) Slow cavern formation rate (ii) High tubing friction | Wide applicability | CNY 14 million |
| TWD cavern | (i) Sediment voids utilized (ii) Increased gas storage capacity | (i) Risk of directional good blockage | Low–grade salt rock with a thick salt layer | CNY 28 million |
| SSTW cavern | (i) Low cavern formation cost (ii) Fast cavern formation rate (iii) High salt utilization rate | (i) Immature technology | The thickness of the salt layer is relatively large | CNY 24 million |
| TWHS cavern | (i) Low cavern formation cost (ii) Fast cavern formation rate (iii) High salt utilization rate | (i) Risk for roof collapse (ii) Difficult to control cavern shape | Big, thick salt layer | CNY 42 million |
| TWRH cavern | (i) Low cavern formation cost (ii) Fast cavern formation rate (iii) High salt utilization rate | (i) Difficult to control cavern shape | Thin salt layer without thick interlayer | CNY 32 million |
| Lithology | Specimen ID | Uniaxial Compression Strength (MPa) | Elastic Modulus (GPa) | Poisson’s Ratio |
|---|---|---|---|---|
| Salt rock | U–2–12 | 23.35 | 8.49 | 0.21 |
| U–3–14 | 25.22 | 5.9 | 0.23 | |
| U–3–13 | 23.64 | 6.98 | 0.28 | |
| U–3–12 | 15.56 | 4.36 | 0.31 | |
| U–3–15 | 22.57 | 8.19 | 0.25 | |
| Mudstone | U–4–1 | 25.52 | 11.2 | 0.24 |
| Lithology | Specimen ID | Confining Pressure (MPa) | Axial Compression (MPa) | Cohesive Force (MPa) | Internal Friction Angle | ||
|---|---|---|---|---|---|---|---|
| Maximum | Strain 1% | Strain 2% | |||||
| Salt rock | T–2–11 | 15 | 74.58 | 25.851 | −15.395 | 5.77 | 34 |
| T–2–12 | 15 | 45.24 | 2.427 | −0.902 | |||
| T–2–13 | 20 | 58.47 | 4.832 | −1.8 | |||
| T–2–14 | 20 | 47.1 | 2.766 | −2.028 | |||
| T–2–16 | 30 | 73.99 | 9.104 | −4.596 | |||
| Mudstone | T–3–1 | 15 | 64.039 | 5.017 | −4.804 | 7.74 | 26.5 |
| T–3–2 | 20 | 59.975 | 2.5 | −2.92 | |||
| T–3–11 | 30 | 89.212 | 2.417 | −0.539 | |||
| T–4–1 | 15 | 55.044 | 3.48 | −1.462 | |||
| T–4–2 | 20 | 57.345 | 3.604 | −3.267 | |||
| T–5–1 | 30 | 78.886 | 2.653 | −0.387 | |||
| Lithology | Specimen ID | Breaking Load (kN) | Tensile Strength (MPa) | Average Value (MPa) |
|---|---|---|---|---|
| Salt rock | B–2–11 | 2.54 | 1.35 | 1.34 |
| B–2–12 | 2.59 | 1.33 | ||
| B–2–13 | 3.17 | 1.582 | ||
| B–2–21 | 2.14 | 1.23 | ||
| B–2–22 | 2.48 | 1.4 | ||
| B–2–23 | 2.8 | 1.525 | ||
| B–2–31 | 3.17 | 1.596 | ||
| B–2–32 | 2.27 | 1.119 | ||
| B–2–33 | 1.74 | 0.892 | ||
| Mudstone | B–3–16 | 10.93 | 5.579 | 3.22 |
| B–3–17 | 3.62 | 1.863 | ||
| B–3–18 | 7.34 | 3.83 | ||
| B–3–19 | 11.78 | 6.453 | ||
| B–3–21 | 4.89 | 2.6 | ||
| B–3–31 | 6.1 | 3.154 | ||
| B–3–32 | 5.86 | 2.918 | ||
| B–3–33 | 4.38 | 2.311 | ||
| B–3–34 | 5.52 | 2.861 | ||
| B–3–35 | 6.21 | 3.283 | ||
| B–3–36 | 3.62 | 1.877 | ||
| B–3–37 | 3.7 | 1.97 |
| Lithology | Specimen ID | Confining Pressure (MPa) | Deviatoric Stress (MPa) | Steady–State Creep Rate (h−1) | Time (h) |
|---|---|---|---|---|---|
| Salt rock | C–1–2 | 30 | 15 | 6.0 × 10⁻⁵ | 67 |
| 30 | 20 | 1.3 × 10⁻⁴ | 98 | ||
| 30 | 25 | 2.4 × 10⁻⁴ | 96 | ||
| C–1–3 | 30 | 15 | 5.0 × 10⁻⁵ | 21 | |
| 30 | 20 | 1.0 × 10⁻⁴ | 25 | ||
| 30 | 25 | 4.0 × 10⁻⁴ | 57 | ||
| C–1–4 | 10 | 30 | 1.87 × 10⁻⁴ | 48 | |
| 10 | 45 | 7.19 × 10⁻⁴ | 510 | ||
| C–1–5 | 10 | 55 | 5.68 × 10⁻⁵ | 35 | |
| C–1–6 | 10 | 15 | 3.29 × 10⁻⁵ | 48 | |
| 10 | 20 | 6.51 × 10⁻⁵ | 48 | ||
| 10 | 25 | 2.95 × 10⁻⁴ | 110 | ||
| 10 | 30 | 6.72 × 10⁻⁴ | 75 | ||
| 10 | 40 | 2.4 × 10⁻³ | 30 | ||
| Mudstone | C–2–2 | 20 | 10 | 1.02 × 10⁻⁶ | 56 |
| 20 | 2.87 × 10⁻⁶ | 64 | |||
| 30 | 5.9 × 10⁻⁶ | 60 |
| Geologic Parameter | Value |
|---|---|
| Top depth of salt cavern construction salt layer (m) | 1290–1410 |
| Salt layer thickness (m) | 120 |
| Depth of casing shoe (m) | 1300 |
| Depth of cavern top (m) | 1315 |
| Comprehensive insoluble content ()(%) | 30 |
| SWV Cavern | TWRH Cavern | I–Shaped Cavern | |
|---|---|---|---|
| Neck height (m) | 15 | 15 | 15 |
| Vertical cavern radius (m) | 35 | 0 | 35 |
| Vertical cavern height (m) | 80 | 0 | 80 |
| Horizontal cavern height (m) | / | 42 | 42 |
| Horizontal cavern length (m) | / | 400 | 400 |
| Total volume () (104 m3) | 20 | 48 | 69.5 |
| Effective volume () (104 m3) | 10.4 | 24.9 | 36.14 |
| Drilling and completion investment | CNY 14 Million | CNY 32 Million | CNY 40 Million |
| Cavern formation investment | CNY 12 Million | CNY 30 Million | CNY 41.7 Million |
| Total investment cost per m3 | CNY 250 | CNY 243 | CNY 226 |
| Rock Type | Elastic Modulus (GPa) | Poisson’s Ratio | Cohesion (MPa) | Internal Friction Angle (°) | Tensile Strength (MPa) | A [(MPa)h−1] | n |
|---|---|---|---|---|---|---|---|
| Salt Rock | 6.8 | 0.26 | 5.77 | 34 | 1.34 | 1.02 × 10⁻⁷ | 3 |
| Mudstone | 11.2 | 0.24 | 7.74 | 26.5 | 3.22 | 2.4 × 10⁻⁸ | 1.7 |
Disclaimer/Publisher’s Note: The statements, opinions and data contained in all publications are solely those of the individual author(s) and contributor(s) and not of MDPI and/or the editor(s). MDPI and/or the editor(s) disclaim responsibility for any injury to people or property resulting from any ideas, methods, instructions or products referred to in the content. |
© 2024 by the authors. Licensee MDPI, Basel, Switzerland. This article is an open access article distributed under the terms and conditions of the Creative Commons Attribution (CC BY) license (https://creativecommons.org/licenses/by/4.0/).
Share and Cite
Xie, K.; Chen, W.; Xie, D.; Cao, D.; Wang, W.; Zhu, G.; Wang, J. Feasibility Evaluation of I–Shaped Horizontal Salt Cavern for Underground Natural Gas Storage. Processes 2024, 12, 2676. https://doi.org/10.3390/pr12122676
Xie K, Chen W, Xie D, Cao D, Wang W, Zhu G, Wang J. Feasibility Evaluation of I–Shaped Horizontal Salt Cavern for Underground Natural Gas Storage. Processes. 2024; 12(12):2676. https://doi.org/10.3390/pr12122676
Chicago/Turabian StyleXie, Kai, Wei Chen, Dongzhou Xie, Donglin Cao, Wenquan Wang, Guanghai Zhu, and Junwei Wang. 2024. "Feasibility Evaluation of I–Shaped Horizontal Salt Cavern for Underground Natural Gas Storage" Processes 12, no. 12: 2676. https://doi.org/10.3390/pr12122676
APA StyleXie, K., Chen, W., Xie, D., Cao, D., Wang, W., Zhu, G., & Wang, J. (2024). Feasibility Evaluation of I–Shaped Horizontal Salt Cavern for Underground Natural Gas Storage. Processes, 12(12), 2676. https://doi.org/10.3390/pr12122676