1. Introduction
In response to the growing global energy demand and the increasingly tense energy situation, unconventional oil and gas resources are now considered an essential component of the future energy structure. As traditional oil reserves become progressively depleted, the development of low-permeability and other unconventional reservoirs is becoming critical to maintaining a stable energy supply [
1,
2,
3,
4]. Low-permeability reservoirs hold a significant position in global oil resources, especially in developing unconventional oil and gas resources, where their importance is increasingly recognized [
5,
6,
7,
8]. However, creating these reservoirs poses several challenges, particularly during water flooding. Establishing an effective oil displacement system is critical to efficient development. Yet, due to their complex pore structures and low permeability, injected water struggles to diffuse effectively within the reservoir, leading to a high injection–production ratio and difficulty maintaining reservoir pressure, significantly hindering development efficiency [
9,
10,
11,
12].
Recent studies have highlighted the significant role of barrier and intercalated layers in influencing waterflooding efficiency in low-permeability reservoirs. Typical lithologies for these layers include mudstone, silty mudstone, and muddy siltstone, which, although unsuitable as reservoirs, possess some permeability and porosity [
13,
14,
15,
16,
17]. These layers absorb part of the injected water during water injection, reducing injection efficiency and hampering pressure recovery. Traditional waterflooding research has primarily focused on the properties of the reservoir itself [
18,
19,
20,
21,
22], often overlooking the presence of intercalated layers. This oversight has made it difficult to explain certain phenomena observed while developing low-permeability reservoirs, such as a high injection–production ratio and slow energy recovery [
23,
24].
Research has shown that intercalated layers cannot be ignored in waterflooding operations [
25,
26,
27]. For example, Ji et al. [
28] found that geological heterogeneity in low-permeability reservoirs with intercalated layers significantly affects waterflooding performance. The layers change the flow path of the injected water, causing it to deviate from high-permeability zones and infiltrate the intercalated layers, leading to lower-than-expected waterflooding efficiency. Fang et al. [
29] conducted laboratory experiments simulating reservoir conditions to measure how different lithologies absorb water over time, clarifying that different lithologies have varying water absorption capacities. They quantified each lithology’s ability to absorb water, which helps understand how it impacts overall reservoir dynamics.
In response to these challenges, Li et al. [
30] proposed a method to optimize water injection by adjusting the distribution of injected water across different reservoir layers to minimize the amount infiltrating intercalated layers, thereby improving overall recovery. Bai et al. [
31] evaluated the effectiveness of layered water injection in low-permeability reservoirs and emphasized the positive correlation between uneven water absorption and the properties of intercalated layers. Liu et al. [
32] developed a reservoir pressure prediction model for ultra-low permeability reservoirs, incorporating mudstone’s water absorption characteristics to more accurately predict pressure changes during water flooding. Ji et al. [
33] discussed how water absorption in intercalated layers leads to uneven pressure distribution within the reservoir. This uneven pressure presents significant challenges for maintaining consistent reservoir pressure. Yu et al. [
34] developed a method to evaluate water injection efficiency in low-permeability reservoirs, determining the direction of injected water and identifying ineffective water injection ratios. Li et al. [
35] also discussed how the micro-heterogeneity of the reservoir exacerbates these effects, as variations in permeability between reservoir rocks and intercalated layers cause irregular water flow, further lowering injection efficiency. Kuzmina et al. [
36] emphasized that water absorption by intercalated layers alters the local pressure conditions within the reservoir, changing the stress field and affecting the direction and propagation of hydraulic fractures. These changes make it more challenging to maintain controlled fracturing that effectively reaches the target oil layers.
Despite increasing research on intercalated layers in low-permeability reservoirs, several gaps remain. Most studies focus on qualitative analyses, with few offering quantitative assessments of water absorption capacities [
37]. The differences in absorption capacities across various lithologies remain underexplored, and no systematic understanding has been established [
38]. Furthermore, existing research typically only examines the early stages of development, lacking long-term observation and simulation of how water absorption in intercalated layers affects the entire reservoir life cycle [
39]. Given the long development cycles of low-permeability reservoirs, the water absorption effects of intercalated layers may change over time, and this dynamic process has not been fully reflected in current studies [
40]. Finally, the relationship between water absorption in intercalated layers and the injection–production ratio needs further exploration, as the injection–production ratio is a crucial indicator of water flooding effectiveness [
41].
To address these issues, this study selected the Chaoyangou Oilfield, a typical low-permeability reservoir with complex geological structures and numerous intercalated layers. The high injection–production ratio observed during its development makes it an ideal candidate for studying the effects of water absorption in intercalated layers. By constructing a comprehensive lithological geological model and using numerical simulation, the study systematically analyzes the evolution of the injection–production ratio at different stages of development. Additionally, it investigates the water absorption characteristics of intercalated layers and quantifies their impact on reservoir pressure distribution and water injection efficiency.
The study’s findings will deepen our understanding of the role of intercalated layers in developing low-permeability reservoirs and provide theoretical support for optimizing water injection strategies. By quantifying the water absorption effects of intercalated layers, the research will clarify the relationship between water absorption, the injection–production ratio, and reservoir pressure recovery. This will ultimately propose optimization strategies to balance the injection–production ratio, reservoir pressure, and water absorption. This will have significant practical implications for improving recovery rates in low-permeability reservoirs.
2. Variation Characteristics of the Injection–Production Ratio
The Chaoyanggou Oilfield, located on the periphery of the Changyuan area of Daqing, is a typical low-permeability reservoir (
Figure 1a), with the main production layer being the Fuyu reservoir. The main reservoir consists of sandstone, interbedded with mudstone and siltstone as a barrier and interlayered strata, forming a complex geological structure (
Figure 1b). Despite the injection–production ratio consistently exceeding three, the production rate and pressure have not improved significantly, and the water cut has continued to rise. Recent core analysis from good operations further revealed the phenomenon of water channeling into the interlayer non-reservoir lithologies. This water channeling exacerbates reservoir pressure loss, weakening the effectiveness of waterflooding and presenting new challenges for managing low-permeability reservoirs.
The injection–production ratio and cumulative injection–production ratio, respectively, represent the underground annual injection–production surplus or deficit and the overall injection–production balance during the waterflooding development of oilfields. These ratios are intuitive indicators of the reservoir’s water absorption characteristics. During oilfield waterflooding development, the common practice when calculating the injection–production ratio or cumulative injection–production ratio is to use the ratio of surface water injection volume to surface liquid production volume or cumulative surface water injection volume to cumulative surface liquid production volume. However, this method is inaccurate. The correct approach should be to use the ratio of underground water injection volume to underground liquid production volume or cumulative underground water injection volume to cumulative underground liquid production volume, as shown in Equations (1) and (2).
where
IPR is the injection–production ratio,
CIPR is the cumulative injection–production ratio,
Bw is the formation water volume factor, set to 1, and
Bo is the formation oil volume factor, set to 1.15, and
ρo is surface crude oil density, set to 0.86 t/m
3.
By substituting the above parameters into formulas (1) and (2), the calculation formulas for the injection–production ratio and cumulative injection–production ratio under formation conditions are derived, as shown in Equations (1) and (2).
Based on the differences in physical properties, the Chaoyanggou Oilfield is divided into three types of blocks (Type I, Type II, and Type III). According to the actual production data from the Chaoyanggou Oilfield and the comprehensive water-cut rate for each block, the development stages are classified into five stages: low water-cut stage (fw ≤ 30%), medium–low water-cut stage (30% < fw ≤ 50%), medium–high water-cut stage (50% < fw ≤ 70%), high water-cut stage (70% < fw ≤ 90%), and ultra-high water-cut stage (fw > 90%). Formulas (3) and (4) are applied to calculate and summarize each development stage’s injection–production ratio and cumulative injection–production ratio. The variations in the injection–production ratio, cumulative injection–production ratio, reservoir pressure, and subsurface surplus water at different stages are analyzed.
Figure 2 shows that the injection–production ratio (IPR) and cumulative injection–production ratio (CIPR) in the Type I blocks of the Chaoyanggou Oilfield undergo notable changes across several development stages. The IPR ranges from 2 to 3 in the low water-cut stage, and the CIPR rises sharply. During this phase, water injection was initially delayed by one year, leading to a gradual decline in reservoir pressure around oil wells. Once water injection began, pressure around the water wells increased rapidly as the pressure gradient exceeded the initiation threshold, allowing the injected water to move further into the reservoir. The process was unique to low-permeability oilfields, where barrier and intercalated layers, such as argillaceous siltstone and mudstone, stored water and helped maintain high formation pressure. Numerical simulations show that after three years of water injection, significant pressure recovery began after six years in Block 45.
In the medium–low water-cut stage, the IPR decreased, and CIPR continued to rise at a slower rate. The well pattern was adjusted to a linear east–west injection system, and the oil-to-water well ratio decreased from 3:1 to 2:1. This adjustment stabilized water and oil well pressures, with the oil well pressure reaching 8.86 MPa, indicating that an effective drive system had been established.
During the medium–high water-cut stage, the IPR decreased further, and the CIPR increased more slowly, nearing stability. Infill drilling reduced well spacing to 210 × 210 m, targeting secondary and tertiary reservoirs with lower permeability and poor connectivity. These reservoirs required higher pressure gradients for fluid flow, and the new injection wells had water pressures 1.3 times higher than the older wells. Although the IPR remained stable, the subsurface annual surplus water volume gradually decreased, reflecting challenges in maintaining high production rates.
3. Comprehensive Lithology Modeling and Numerical Simulation
3.1. Full Lithology Geological Modeling
Conventional geological modeling typically focuses only on oil and water movement within sandstone reservoirs without considering the effect of injected water on other vertical lithologies [
43,
44]. To quantitatively study fluid flow in transitional lithologies (such as silty mudstone and argillaceous siltstone) and mudstone, this paper, based on geological data from the Fuyang Reservoir in the Chaoyanggou Oilfield, combined with micro-electrical log curve data, undertook a vertical refinement of the formation beyond the current layer divisions. The formation was divided into mudstone, silty mudstone, argillaceous siltstone, and sandstone. A full lithology geological model was constructed to reflect the characteristics of the Chaoyanggou Oilfield formations, as shown in
Figure 3.
A reservoir model was established using the deterministic modeling method in Petrel 2022.1 software. The acceptable geological model constructed in Petrel utilized non-equidistant corner point grids on the plane. The modeling area covered 3.83 km
2, with 25 oil and water wells, and vertically divided into 268 simulation layers based on lithological distribution. To meet the requirements of detailed reservoir studies, the horizontal grid spacing was set to 10 × 10 m, as shown in
Figure 4.
Based on laboratory experimental studies and field data statistical results, it was determined that argillaceous siltstone and silty mudstone contain dry pores and a certain degree of gas saturation. Combining these findings with well-logging statistical results established the method for assigning physical property parameters to argillaceous siltstone, silty mudstone, and pure mudstone, and a comprehensive lithological property model was constructed. The property parameter assignment for all lithologies in the block models (sandstone, argillaceous siltstone, silty mudstone, and mudstone) is detailed in
Table 1.
3.2. Full Lithology Numerical Simulation
A comprehensive lithological numerical model was established based on the black oil model and ECLIPSE 2021.1 numerical simulation software, combined with a full lithological geological model. The lithological mathematical model defines distinct equilibrium zones for different lithologies, including mudstone, argillaceous siltstone, silty mudstone, and sandstone. In the simulation process, each grid block, both vertically and horizontally, was assigned a specific zone number, with each zone corresponding to different compressibility coefficients and relative permeability curves to accurately simulate fluid flow in the barrier and intercalated layers.
Taking a 5 × 5 × 7 grid model as an example, the equilibrium zone numbering is initially set according to the vertical small-layer sequence. For instance, when k = 1, the equilibrium zone is 1; when k = 7, it is 7. According to the full lithological model, layers k = 1 and k = 7 consist of mudstone, layers k = 2 and k = 6 consist of silty mudstone, layers k = 3 and k = 5 are argillaceous siltstone, and layer k = 4 is sandstone.
Subsequently, the planar equilibrium zones for the reservoir are configured. The sandstone layer (k = 4) has two lithologies: pure sandstone and pure mudstone. The pure mudstone retains the equilibrium zone number of 4, while the pure sandstone is assigned a new number, continuing from the previous highest value, and is set to 8.
Figure 5 illustrates the detailed equilibrium zone assignments for pure mudstone, silty mudstone, argillaceous siltstone, and sandstone.
In reservoir numerical simulation, conventional methods typically apply Darcy’s law to allocate flow based on formation coefficients without fully considering the impact of the threshold pressure gradient in low-permeability layers [
45,
46,
47]. As a result, the allocated flow for sub-layers often deviates from actual production data, leading to lower historical matching accuracy. Therefore, it is essential to conduct critical technical research on threshold pressure gradient equivalent simulation to improve the accuracy of history matching.
In the simulation, each grid block is treated as an independent equilibrium zone, and its number represents the corresponding zone. When applying an “S-shaped” zoning method, if the number of grids in one direction is X, the number of threshold pressure setting records is calculated as 6X−4. For example, if X = 5, the threshold pressure-setting records would be 26. In contrast, using a “square zoning” method requires only two equilibrium zones, and the number of threshold pressure setting records is reduced to 4, as shown in
Figure 6.
Four permeability levels are examples of zoning pure mudstone in the reservoir (k = 8). Zones 8 and 9 are assigned to layers with permeability between 1 and 2 mD, zones 10 and 11 for permeability between 2 and 5 mD, zones 12 and 13 for permeability between 5 and 10 mD, and zones 14 and 15 for permeability between 10 and 50 mD, as detailed in
Figure 7.
It is important to note that the fewer the equilibrium zone numbers, the lower the computational load. This zoning method is simple, significantly enhances the computational speed of the model, and helps avoid potential software calculation errors. By optimizing the zoning strategy, not only is simulation efficiency improved, but computational inaccuracies are also minimized.
3.3. Model Validation
To validate the accuracy of the model, this study uses the injection–production historical data from the Chaoyanggou Oilfield research area for history matching, comparing the model’s simulation results with actual production data to evaluate the model’s effectiveness in describing reservoir pressure changes and fluid flow patterns. Specifically, by adjusting model parameters to align simulated results with the field’s water injection rate, production rate, and water cut, the model is ensured to accurately reflect the reservoir’s dynamic behavior. The fitting results demonstrate a high degree of accuracy, providing theoretical support for subsequent water injection optimization and development plan design. The fitting results are shown in
Figure 8.
4. Results
During the development of low-permeability reservoirs, common issues include a high injection–production ratio, insufficient water absorption capacity of the reservoir, and difficulty in establishing an effective drive system between oil and water wells, all of which contradict the principles of material balance. Based on laboratory experiment results [
29] and reservoir numerical simulation data, this study, through reservoir engineering analysis, identifies the following critical reasons for the high injection–production ratio in the low-permeability reservoir:
Elastic water storage in the reservoir [
48,
49]: besides overcoming the threshold pressure gradient, the reservoir must also store sufficient water to provide adequate displacement energy, increasing the demand for water injection.
Water absorption in barrier and intercalated layers [
50,
51]: during elastic water storage in the reservoir, significant water absorption occurs in the surrounding barrier and intercalated layers (vertically and horizontally), further affecting the reservoir’s ability to drive fluids efficiently.
Block Non-Sealed Water Outflow: poor sealing at block boundaries, faults, and cement sheaths leads to crossflow between injection wells, causing water spillover. In addition, measurement errors also contribute to the high injection–production ratio.
In summary, the high injection–production ratio in the low-permeability reservoir is primarily due to elastic water storage, water absorption in the barrier and intercalated layers, and inadequate sealing. These findings provide a theoretical basis for optimizing water injection strategies in low-permeability reservoirs.
4.1. Elastic Water Storage in the Reservoir
During waterflood development in oilfields, the water injected into the reservoir is typically divided into four parts [
52,
53]:
Water for displacing oil: This portion displaces the oil in the reservoir, filling the underground pores vacated by the extracted oil. Its volume is equal to the underground volume of the extracted oil.
Produced water: This is the amount of water produced along with the extracted oil, and its volume corresponds to the water content in the produced fluids. The sum of the displaced water and the produced water equals the underground volume of the produced fluids.
Water-filling fractures: In low-permeability reservoirs, long-term water injection often creates numerous artificial fractures through repeated fracturing operations. At the same time, sustained high-pressure water injection promotes the widening and opening of natural microfractures. Some injected water escapes through these microfractures into barrier and intercalated layers, affecting water injection and fluid flow efficiency.
Elastic Water Storage in the Reservoir: this portion of water primarily stores energy, increasing reservoir pressure and establishing an effective drive system, thereby enhancing the reservoir’s production potential.
In low-permeability reservoirs, fracture systems (including artificial fractures and natural microfractures) complicate the pathways and distribution of injected water. This is especially evident during prolonged high-pressure water injection, where the influence of fractures becomes more pronounced. As a result, the injected water is not only used for displacement and production but also for filling the fracture system and improving reservoir pressure through elastic water storage, providing the driving energy needed for production.
4.1.1. Low Water-Cut Stage: Results for Reservoirs
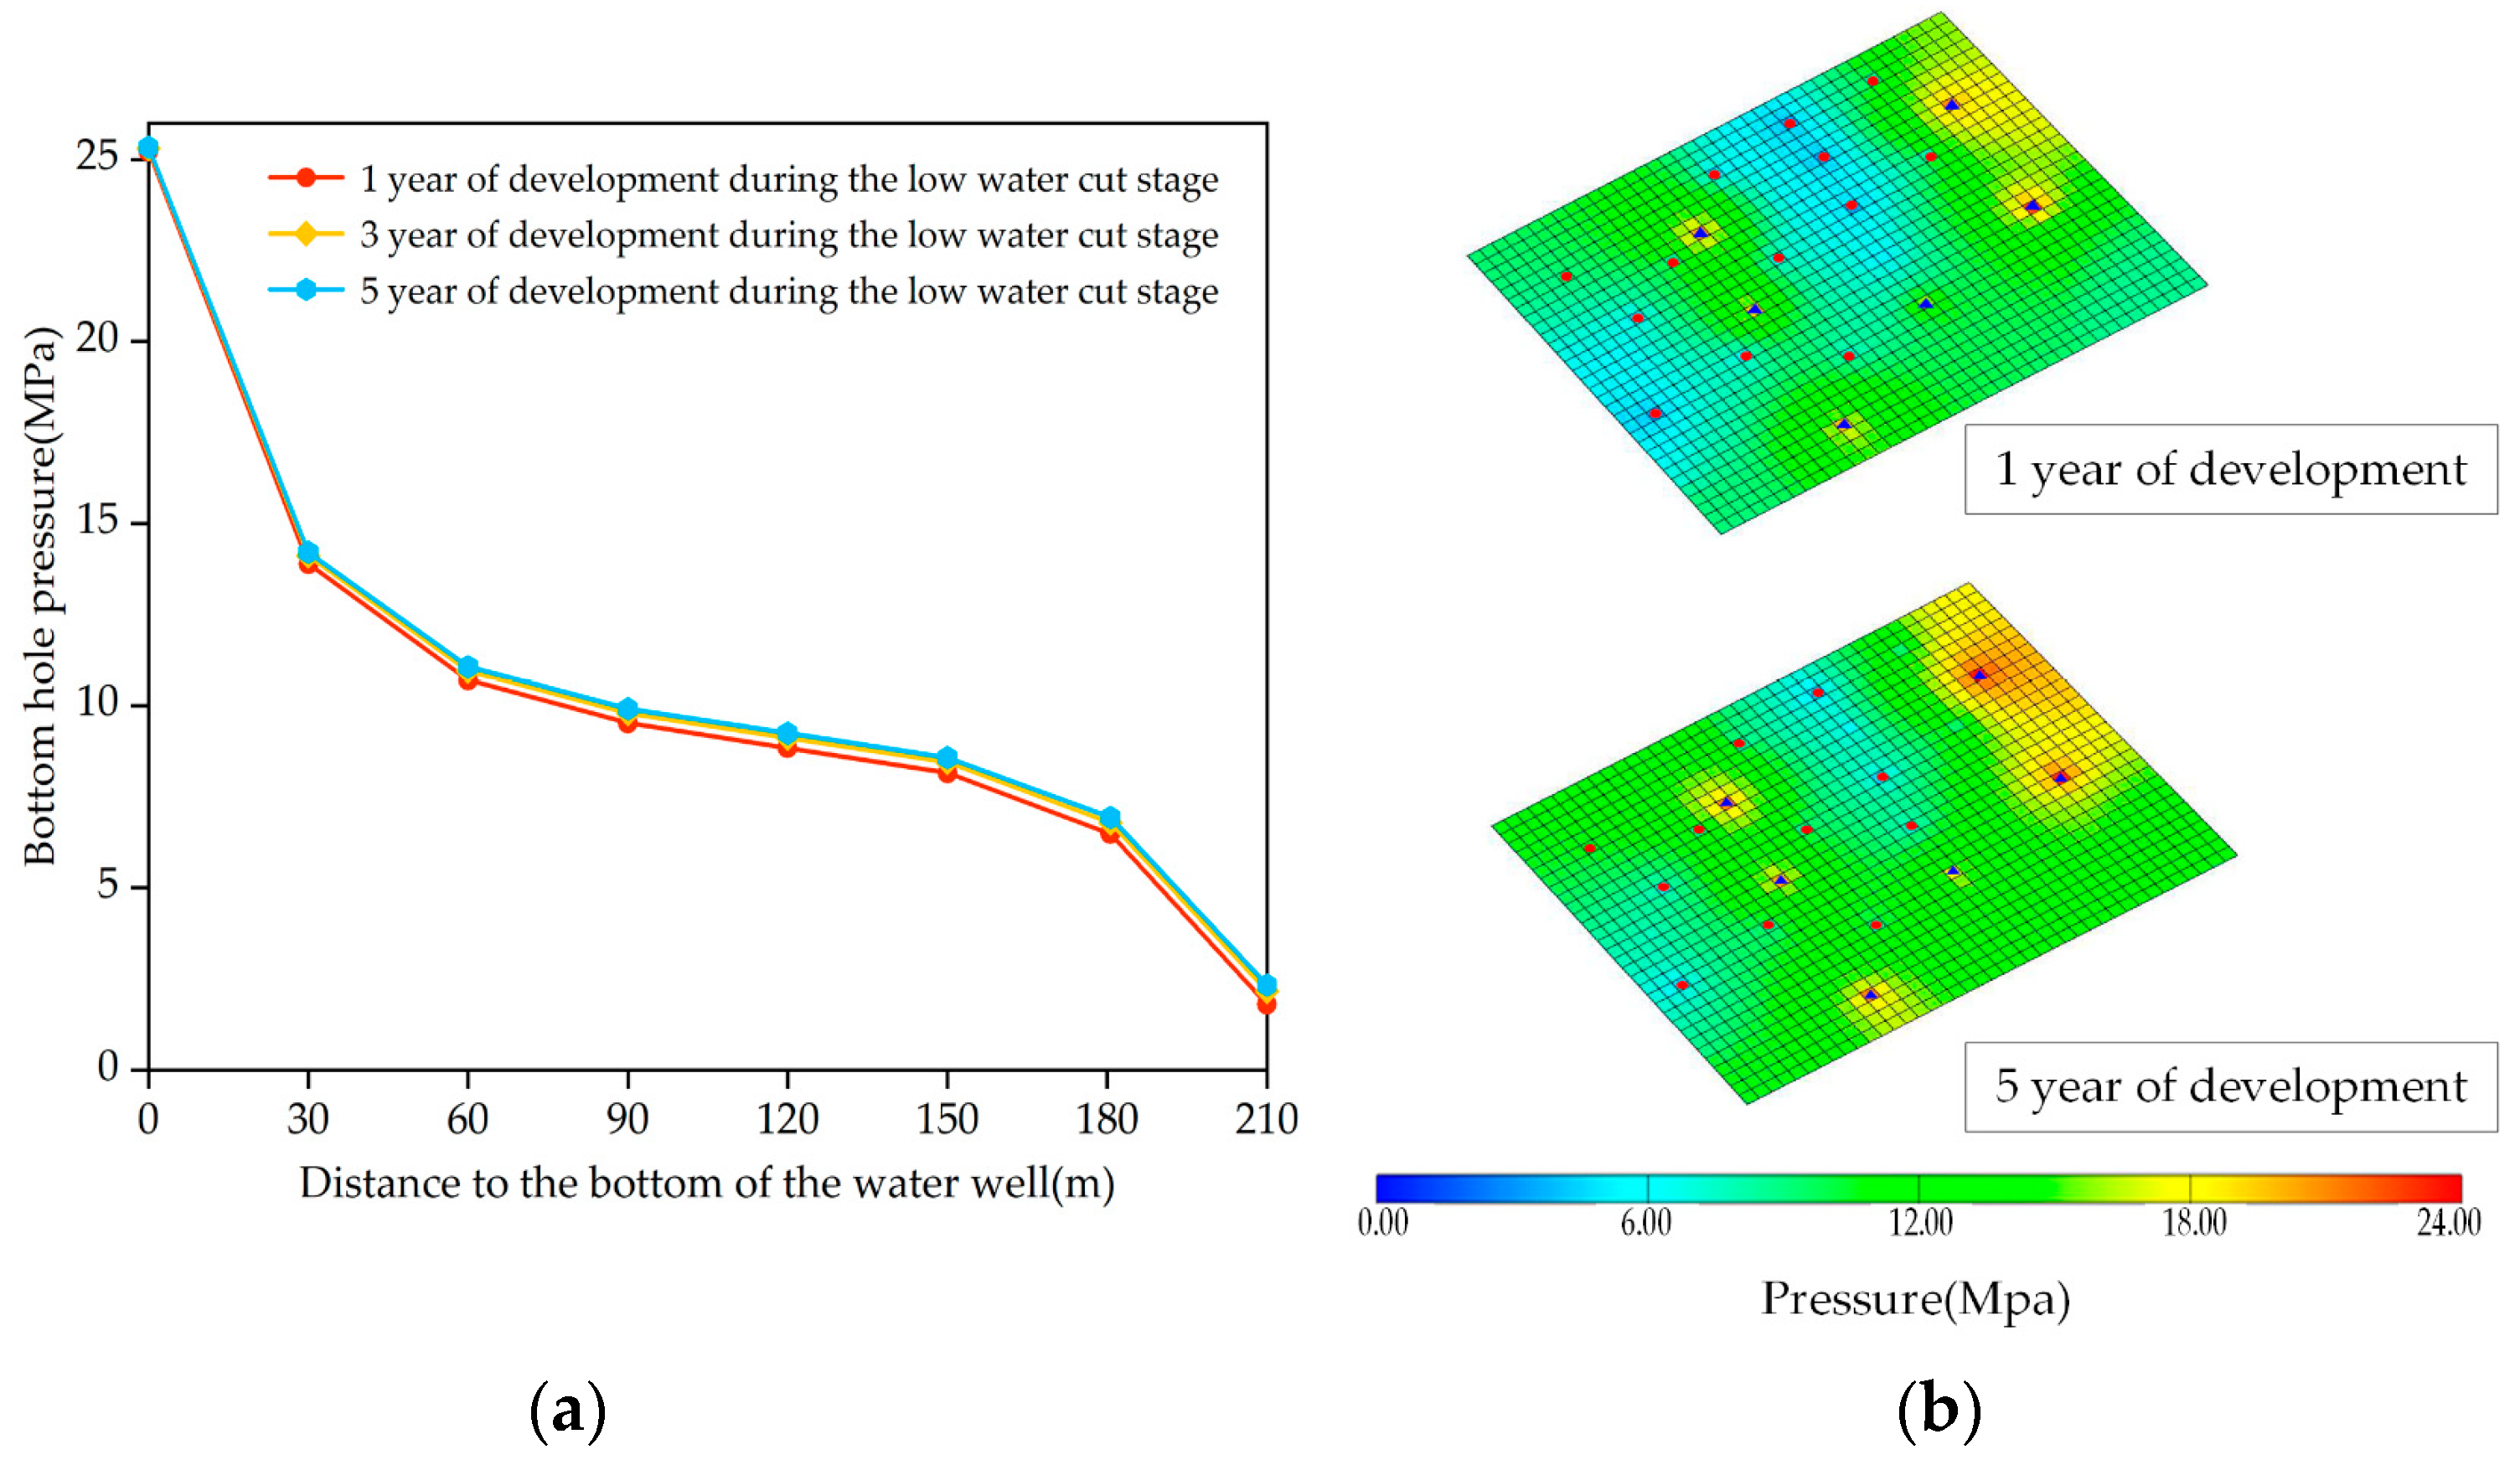
Figure 9 shows that the reservoir has not yet established an effective drive system after one year of development. The pressure at the injection well begins to rise continuously while the pressure at the oil well continues to decrease.
After five years of development, an effective drive system is partially established in the reservoir. The pressure at the injection well continues to build up, and a small portion of production wells are affected by the pressure wave from the injection well. However, most production wells still do not receive energy supplementation from the injection well, indicating that this phase primarily represents the energy storage period caused by a high injection–production ratio.
As development progresses, the pressure at the injection well during the low water-cut phase gradually increases, although the rate of increase slows down. After 1, 3, and 5 years of development, the pressure at the injection well reaches 19.87 MPa, 21.08 MPa, and 22.02 MPa, respectively. Conversely, the pressure at the oil well gradually decreases, with the rate of decrease also slowing down, reaching 4.20 MPa, 3.22 MPa, and 2.48 MPa for the same periods. As development time extends, the pressure drop funnel between oil and water wells expands, indicating that the water injection drive capacity continues to strengthen, though regional pressure differences remain.
4.1.2. Medium–Low Water-Cut Stage: Results for Reservoirs
Figure 10 shows that after entering the mid-to-low water-cut stage, the pressure at the injection well continues to increase while the pressure at the oil well steadily decreases. The average reservoir pressure also rises, indicating a period of continuous energy accumulation in the reservoir.
As development progresses, coupled with the optimization of the injection–production well pattern, the pressure at the injection well during the mid-to-low water-cut stage slightly increases. After 1, 3, and 5 years of development, the pressure at the injection well reaches 24.62 MPa, 24.83 MPa, and 24.92 MPa, respectively, indicating that the rate of pressure increase is slowing. Similarly, the pressure at the oil well decreases slightly, reaching 1.80 MPa, 1.73 MPa, and 1.67 MPa for the same periods. Compared to the low water-cut stage, the magnitude of pressure changes is smaller, with the average reservoir pressure increasing slightly, marking the transition to the elastic water-retention phase.
This phenomenon reflects the characteristics of waterflooding during the mid-to-low water-cut period, where injection wells gradually maintain higher pressure while the rate of pressure decline at the oil well slows down. This indicates that the reservoir is now primarily driven by elastic water retention. During this phase, the effect of water injection becomes less pronounced than in earlier stages, and the overall driving force of the reservoir stabilizes, with energy replenishment increasingly relying on the reservoir’s elastic water.
4.1.3. Medium–High Water-Cut Stage: Results for Reservoirs
Figure 11 shows that after entering the mid-to-high water-cut phase, the pressure at the injection well continues to rise while the pressure at the oil well steadily decreases. The average reservoir pressure also increases, indicating that the reservoir is in a continuous energy storage phase.
As development progresses, combined with the optimization of the injection–production well pattern, the pressure at the injection well during the mid-to-high water-cut stage slightly increases. After 1, 3, and 5 years of development, the pressure at the injection well reaches 25.23 MPa, 25.30 MPa, and 25.34 MPa, respectively. At the same time, the pressure at the oil well also increases slightly, reaching 1.80 MPa, 2.17 MPa, and 2.33 MPa. Compared to the mid-to-low water-cut stage, the pressure at the injection well remains almost unchanged. In contrast, the oil well pressure increases slightly, indicating that an effective drive system between the oil and water wells has been established, and the oil well is beginning to benefit from this effect.
This trend suggests that during the mid-to-high water-cut stage, the efficiency of the waterflood drive system is significantly enhanced. As pressure transmission stabilizes, the increase in oil well pressure reflects the gradual transfer of energy from the injection well to the production well, with the drive effect becoming more evident, further boosting the reservoir’s production capacity.
4.2. Water Absorption in Barrier and Intercalated Layers
The water absorption in barrier and intercalated layers primarily occurs in two ways:
Vertical water absorption in barrier and intercalated layers refers to the water absorption from layers in vertical contact with the reservoir. Due to the depositional characteristics of fluvial reservoirs, there is significant vertical heterogeneity, with mud-rich siltstone or silty mudstone interbedded within the reservoir. Although these interlayers have poor or no oil-bearing properties, they possess specific permeability and porosity. Under high-pressure water injection conditions, vertical crossflow can occur through this contact. Additionally, during injection, artificial fractures may extend into the barrier and intercalated layers, or high-pressure water injection may cause natural fractures to propagate into the barrier layers, further increasing the flow of injected water into these layers and enhancing water absorption.
Lateral water absorption in reservoir sandbody depletion zones: Laterally, water absorption is associated with the depletion zones of reservoir sandbodies. Non-mainpay sandbodies are small in scale and highly variable laterally. Silty mudstone and pure mudstone, which are in contact with the reservoir, exhibit some permeability. In particular, some sandbodies experience “injection without production” or “more injection, less production” scenarios, exacerbating the water absorption in the lateral depletion zones.
Overall, vertical and lateral water absorption in barrier and intercalated layers is influenced by the reservoir’s depositional characteristics and the propagation of fractures during high-pressure water injection. This phenomenon increases injected water flow into the barrier layers, impacting the overall efficiency and effectiveness of waterflood development.
4.2.1. Low Water-Cut Stage: Results for Barrier and Intercalated Layers
Vertically, reservoir pressure changes are influenced by water absorption and pressure buildup at the injection well and pressure depletion at the production well. At the injection well, there is a positive pressure differential between the reservoir and the overlying and underlying formations. When this pressure differential exceeds the threshold pressure between the reservoir and the silty mudstone, the argillaceous siltstone begins to absorb water, causing its pressure to increase gradually. Similarly, when the pressure differential between the argillaceous siltstone and the silty mudstone exceeds its threshold pressure, it absorbs water, further increasing its pressure. Finally, when the pressure differential between the silty mudstone and the mudstone exceeds the threshold pressure, the pure mudstone at the injection well also begins to absorb water, leading to a continued rise in pressure. From a vertical profile perspective, the pressure in the argillaceous siltstone, silty mudstone, and mudstone changes sequentially, with pressure and affected areas decreasing progressively, while the pressure in the barrier and intercalated layers at the production well remains unchanged mainly during the low water-cut stage, as shown in
Figure 12.
Horizontally, non-mainpay sand bodies, such as small-scale river channel sands and beach-bar sands, are typically small, with large contact areas between the sand bodies and the barrier layers. In some cases, sandbodies experience injection without production or one injection, one production scenario. When water injection begins in non-mainpay sand bodies, small river channels and beach-bar sands are the first to absorb water, causing the sand body pressure to rise. Once the pressure differential between the sand body and the barrier layers exceeds the threshold pressure, the barrier layers on the plane start to absorb water, and pressure gradually increases. However, no significant pressure changes are observed for the barrier layers near the production well during the low water-cut stage, as shown in
Figure 13.
As shown in
Figure 14, the pressure in the non-main production layer decreased from approximately 10 MPa after one year to around 9.5 MPa after five years, indicating that continued production over time gradually lowered the formation pressure in this layer. In contrast, the pressure in the mudstone, silty mudstone, and argillaceous siltstone layers increased after five years, reaching approximately 12.3 MPa, 11 MPa, and 10.8 MPa, respectively. This pressure increase suggests that injected water migrated into these non-production layers through interlayer or micro-fracture pathways, causing a rise in pressure within the barrier and interlayered strata.
4.2.2. Medium–Low Water-Cut Stage: Results for Barrier and Intercalated Layers
Figure 15 shows that adjustments to the injection–production well pattern system were gradually implemented after entering the mid-to-low water-cut stage. With the densification of the well pattern, the initial inverted nine-spot well pattern was progressively transitioned to a linear water injection well pattern. The oil-to-water well ratio in various blocks was adjusted from 3:1 in the early development stage to approximately 2:1. As the number of water injection wells increased, the volume of high-pressure zones in the reservoir expanded, and the water absorption area of barrier and intercalated layers in vertical contact with the reservoir also increased. The pressure wave gradually propagated to about half the distance between the oil and water wells, resulting in a consistently high injection–production ratio.
Figure 16 shows that in non-main pay layers, after the well pattern was densified, the number of water injection wells slightly increased, leading to an expansion of high-pressure zones in the reservoir. This, in turn, increased the water absorption area of the planar barrier and intercalated layers. Compared to the low water-cut stage, the pressure in these layers gradually increased and remained relatively high.
Figure 17 shows the pressure variations in different layers (non-main layers, mudstone, silty mudstone, and argillaceous siltstone) after one year and five years of development under medium-to-low water-cut conditions. As observed, the pressure in the non-main layers decreased from approximately 9.5 MPa after one year to around 7.8 MPa after five years, indicating a gradual reduction in formation pressure due to ongoing production. This pressure decline reflects the impact of continuous production in the main layers on the non-main layers, resulting in gradual depressurization. In contrast, the pressures in the barrier and interlayered strata, including mudstone, silty mudstone, and argillaceous siltstone, all increased after five years. The pressures in mudstone, silty mudstone, and argillaceous siltstone rose from 10.8 MPa, 11 MPa, and 12.3 MPa to 11.2 MPa, 11.5 MPa, and 13.6 MPa, respectively. Compared to the pressure variations observed during the low water-cut period, it can be seen that water channeling has a more pronounced impact on the barrier and interlayered strata during the medium water-cut period.
4.2.3. Medium–High Water-Cut Stage: Results for Barrier and Intercalated Layers
Figure 18 shows that after entering the mid-to-high water-cut stage, fine-tuned layered water injection was implemented in the study area, applying differentiated injection strategies for different layers. Water injection in the main layers was controlled, while injection intensity in the non-main layers was increased. The results showed that water absorption in barrier and intercalated layers adjacent to the main layers decreased, while absorption in layers adjacent to the non-main layers increased. The pressure wave affected more than half the distance between oil and water wells, and the overall injection–production ratio showed a downward trend.
Figure 19 shows that the water injection intensity in the non-main layers significantly increased on the horizontal plane, resulting in an expanded water absorption area in the barrier layers. Compared to the mid-to-low water-cut stage, there is still room for further pressure increases in the barrier layers. Meanwhile, although water injection in the main layers has been effectively controlled due to reservoir properties, the injection well end continues to experience pressure buildup, leading to a slight pressure increase.
As shown in
Figure 20, the pressure in the non-main production layers remained at a relatively low level after one and five years, decreasing from approximately 6.7 MPa to 5.8 MPa. This indicates that in the high water-cut period, continued production further reduced the formation pressure in the non-main layers. In contrast, the pressures in the barrier and interlayer strata, such as mudstone, silty mudstone, and argillaceous siltstone, increased after five years. Specifically, the pressure in the mudstone and silty mudstone increased from about 10.8 MPa and 11 MPa after one year to 12.6 MPa and 13.5 MPa, respectively. The pressure increase in argillaceous siltstone was even more significant, rising from 13.6 MPa to 16.2 MPa. Compared to the pressure changes observed during the low and medium water-cut periods, water channeling appears more pronounced in the high water-cut period, with a greater impact on the pressure increase in the barrier and interlayer strata.
4.3. Block Non-Sealed Water Outflow
4.3.1. Unsealed Block Periphery
In the study area, due to the lack of effective fault barriers around the block or poor sealing by caprock, part of the injected water leaks from the reservoir at the block boundaries or into the barrier and intercalated layers in contact with the reservoir. This water spillover is greatly influenced by geological development and is difficult to avoid altogether. The specific distribution is shown in
Figure 21.
4.3.2. Fault Non-Sealing
The study area is characterized by well-developed faulting, with numerous minor faults and relatively short fault displacements between the hanging wall and footwall. Due to the lack of effective sealing at the block boundaries, water injected through the injection wells migrates along the faults into large fault-fractured zones, leading to spillover. This phenomenon has been confirmed through infill wells drilled near the faults in later stages.
4.3.3. Cement Sheath Non-Sealing
Due to casing deformation and poor cementing quality, especially inadequate sealing at the second interface, part of the injected water channels into non-producing layers. Historically, oilfield cementing typically extended 150 m above the top of the Fuyang oil layer. Still, there was no effective isolation between the casing and the formation from the surface casing to the cement top. In cases of substandard cementing quality or damage to the cement sheath due to frequent reservoir fracturing operations, casing damage can occur, allowing some injected water to migrate into the upper non-producing layers. This situation poses significant challenges to water injection development and reservoir management efficiency.
4.3.4. Measurement Error
There are specific measurement errors in both water injection and produced fluid volumes, which can be summarized as follows:
Water injection measurement errors: Low accuracy in water meter readings results in discrepancies between the recorded and actual injected water volumes. Errors also arise from leaks, spills, and losses in the surface pipeline network.
Produced fluid volume errors: During oil and water well operations, the discharge volumes are often inaccurately measured and, in some cases, not measured, leading to an underestimation of the produced volume.
Due to limitations in available data, it is difficult to conduct a precise quantitative analysis of these errors. However, based on a review of relevant literature and internal data, these errors are estimated to account for approximately 24.55% to 27.68% of the injected water.
5. Discussion
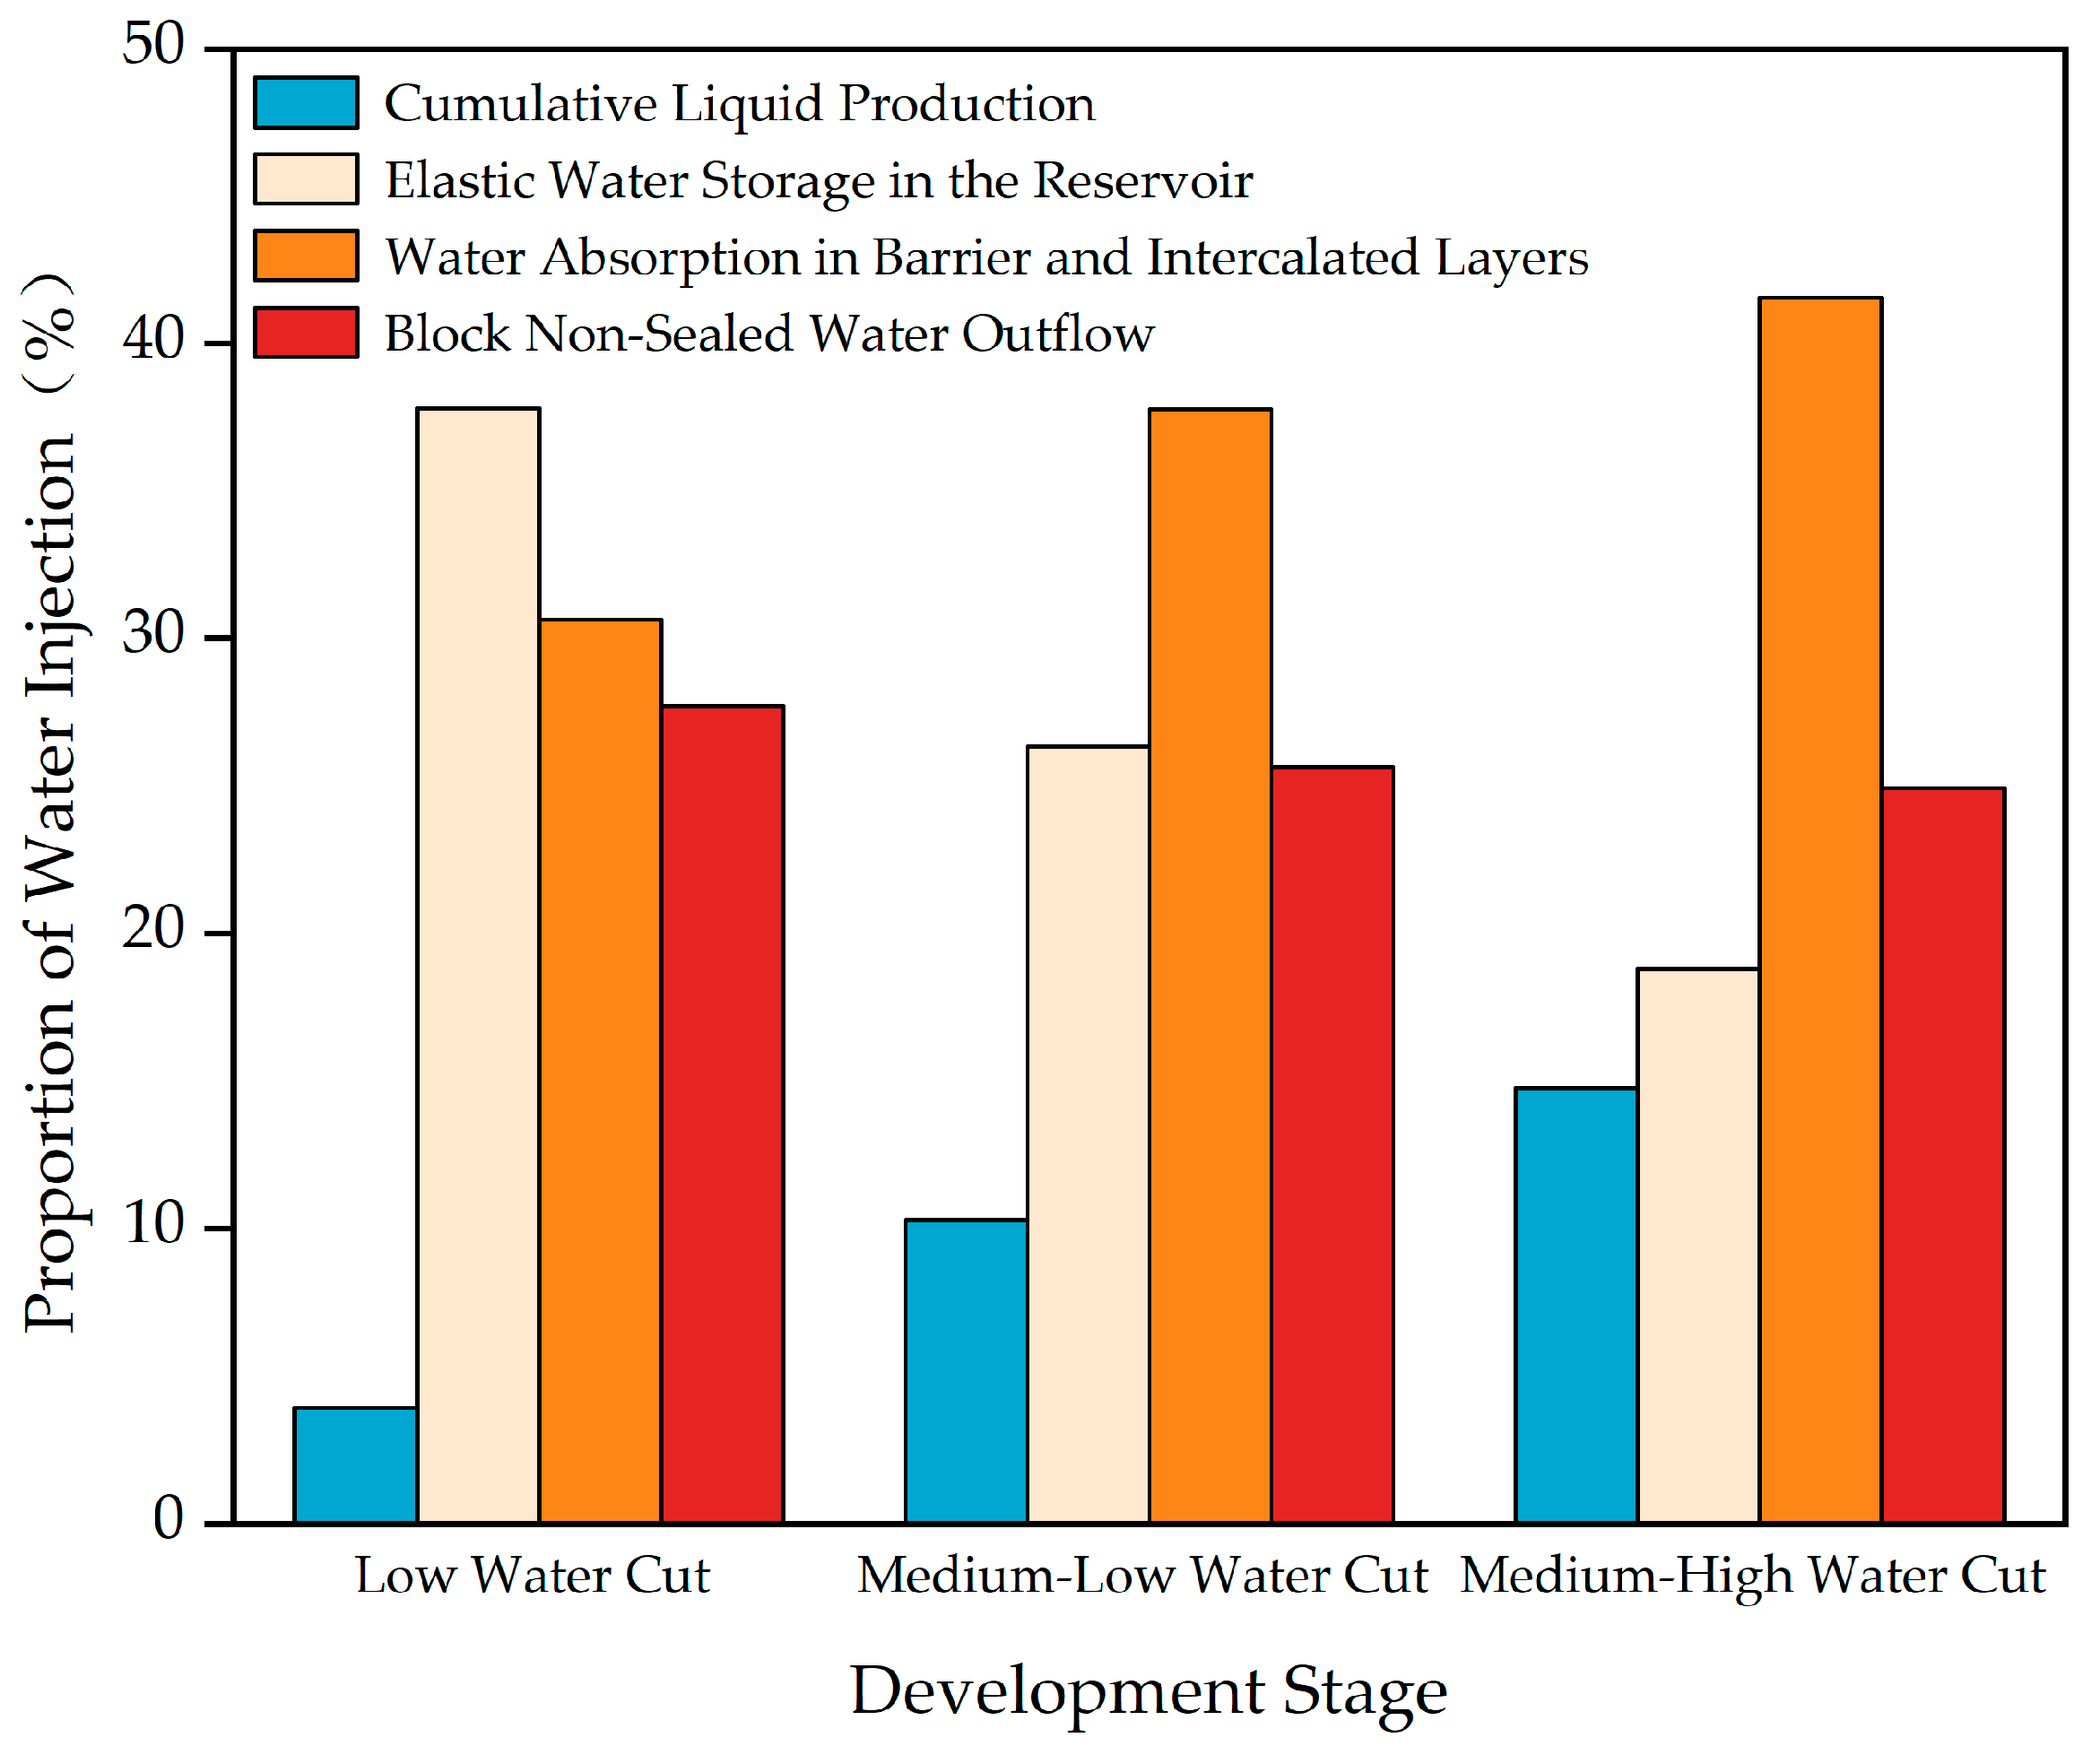
Based on the above analysis, numerical simulation methods are employed to calculate the cumulative water injection, cumulative liquid production, underground cumulative water storage, and cumulative water overflow at different water-cut stages. By fitting the overflow water data, a balanced partition model is established to compute the fluid mass in the reservoir and barrier and intercalated layers for each block at various development stages. Comparative calculations determine the proportions of cumulative liquid production, underground cumulative water storage, and cumulative water overflow at different stages, as shown in
Figure 22.
The figure shows that as the water cut increases, the development stage transitions from the low water-cut stage to the medium–low water-cut stage and then to the medium–high water-cut stage. During this process, the proportion of cumulative liquid production to cumulative water injection gradually increases, while the proportions of underground cumulative water storage and cumulative water overflow decrease progressively. Specifically, the proportion of reservoir water storage shows a decreasing trend. In contrast, the proportion of water absorption by the barrier and intercalated layers increases, although the growth rate slows down.
When the reservoir has not yet established an effective drive system, the proportion of liquid production is noticeably lower. In contrast, the reservoir’s elastic water storage and absorption by barrier and intercalated layers are significantly higher. This indicates that most injected water is used to build an effective drive system for reservoir energy storage. Additionally, microfractures caused by reservoir pressure buildup result in some water migrating into the barrier and intercalated layers.
In general, although a high injection–production ratio in low-permeability reservoirs appears to violate the material balance principle, the excess water can be used to store energy in the reservoir to establish an effective drive system. However, the water migration into the barrier and intercalated layers should not be overlooked. Therefore, it is crucial to consider both portions of the water and, based on different development stages and the conditions between oil and water wells, balance the relationship between formation pressure, injection–production ratio, and underground cumulative water storage. This will help determine the optimal injection–production parameters to ensure efficient development of low-permeability reservoirs.
6. Future Work
Based on the general principles related to optimizing the injection–production ratio, future work can focus on the following areas to balance the injection–production ratio, reservoir pressure, and water absorption in barrier and intercalated layers:
Improving Numerical Simulation Accuracy: Future efforts can focus on refining the numerical simulation models used to calculate reservoir dynamics, particularly accurately simulating water migration into barrier and intercalated layers. By improving model precision, especially in accounting for water absorption and pressure distribution in both the vertical and horizontal directions, it will be possible to predict the effects of water injection strategies over time.
Tailoring Water Injection Strategies: Establishing an effective water drive system is critical in low-permeability reservoirs. Future work can explore more tailored water injection schemes that adjust the injection rates based on real-time reservoir pressure monitoring and water absorption rates in barrier layers. This can help maintain an optimal injection–production ratio and ensure efficient pressure distribution throughout the reservoir.
Experimental Studies on Water Absorption: Conducting further laboratory experiments to understand the water absorption properties of different lithologies, especially in the context of varying permeability and porosity, can provide better inputs for reservoir simulations. These studies would help quantify the water absorption capacity of non-reservoir layers, providing critical data to refine water injection strategies.
Sealing and Well Integrity Improvements: Another critical area of focus is ensuring better sealing at block boundaries, faults, and wellbore cementing to prevent water from migrating uncontrollably into non-producing layers. Future work should investigate advanced wellbore integrity techniques, such as improved cementing methods, to reduce crossflow and water losses.
Integrated Monitoring and Data Analytics: Implementing real-time pressure and flow monitoring systems and advanced data analytics can help detect early signs of water migration into non-reservoir lithologies and adjust water injection parameters accordingly. Machine learning and AI could analyze patterns and optimize water injection in real time.
7. Conclusions
This study focuses on the Chaoyanggou Oilfield, a typical low-permeability reservoir, where a full lithology geological model was established by dividing its complex lithological distribution. Combined with numerical simulation methods, the study analyzes the causes and evolution of high injection–production ratios at different development stages. It examines the absorption and distribution of water in the reservoir and barrier and intercalated layers, providing a detailed characterization of the composition of injected water. The main conclusions are as follows:
The injection–production ratio (IPR) and cumulative injection–production ratio (CIPR) show significant variation across different development stages. In the early stages, IPR is relatively high, indicating that much of the injected water is used for energy storage rather than immediate production, particularly in low-permeability reservoirs.
The absorption of injected water into the barrier and intercalated layers is a critical factor influencing reservoir dynamics. Vertical and lateral water absorption pathways, mainly through fractures, affect water injection efficiency and the reservoir’s overall pressure distribution.
As development progresses through different water-cut stages, the contribution of water production increases while underground water storage and overflow decrease. This reflects the transition from water storage to more effective water-driven output as the drive system becomes fully established.
Low-permeability reservoirs’ ability to store elastic water is essential for building and maintaining an effective drive system. However, managing water migration into barrier and intercalated layers remains a crucial challenge for optimizing injection–production balance and ensuring long-term reservoir productivity.
These findings highlight the importance of adapting water injection strategies to account for the complex interactions between reservoir layers and barrier and intercalated layers, particularly in low-permeability reservoirs.


 ,
, 


