
Automatic History Matching Method and Application of Artificial Intelligence for Fractured-Porous Carbonate Reservoirs


Abstract
1. Introduction
2. Methodology
2.1. Mathematical Model of Artificial Intelligence Automatic History Matching for Fractured-Porous Reservoir
2.2. Automated History Matching Method for Artificial Intelligence in Fracture-Porous Carbonate Reservoirs
- (1)
- The fluid is mainly oil, gas, and water in three phases;
- (2)
- The fluids flow simultaneously in the matrix rock mass and the fracture grid and satisfy Darcy’s law;
- (3)
- The reservoir temperature is a constant condition;
- (4)
- Rock compressibility is not considered and pore penetration evolution is neglected;
- (5)
- Neglect the effect of gravity.
3. Case Applications
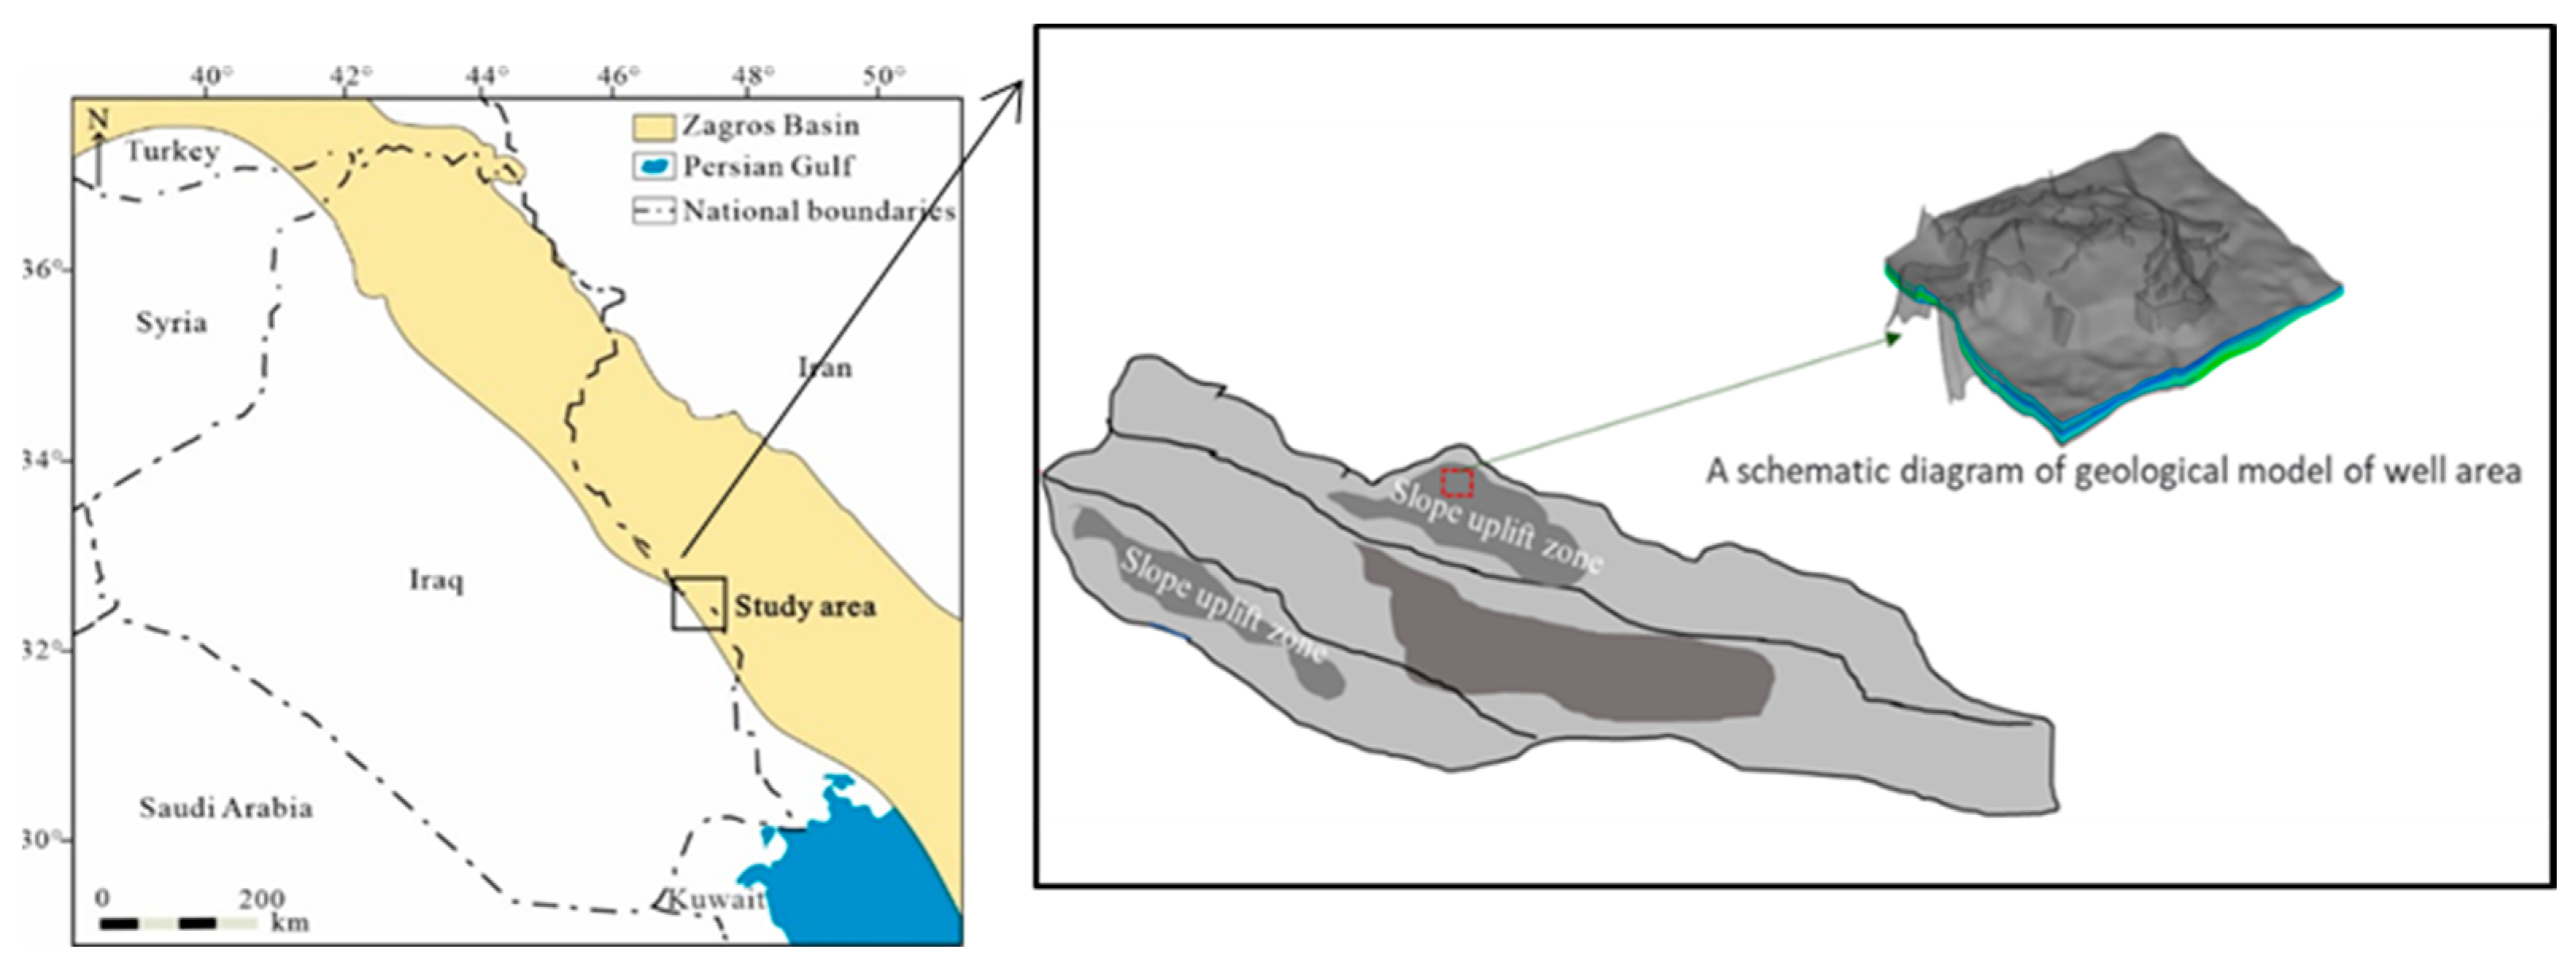
3.1. Overview of Reservoir
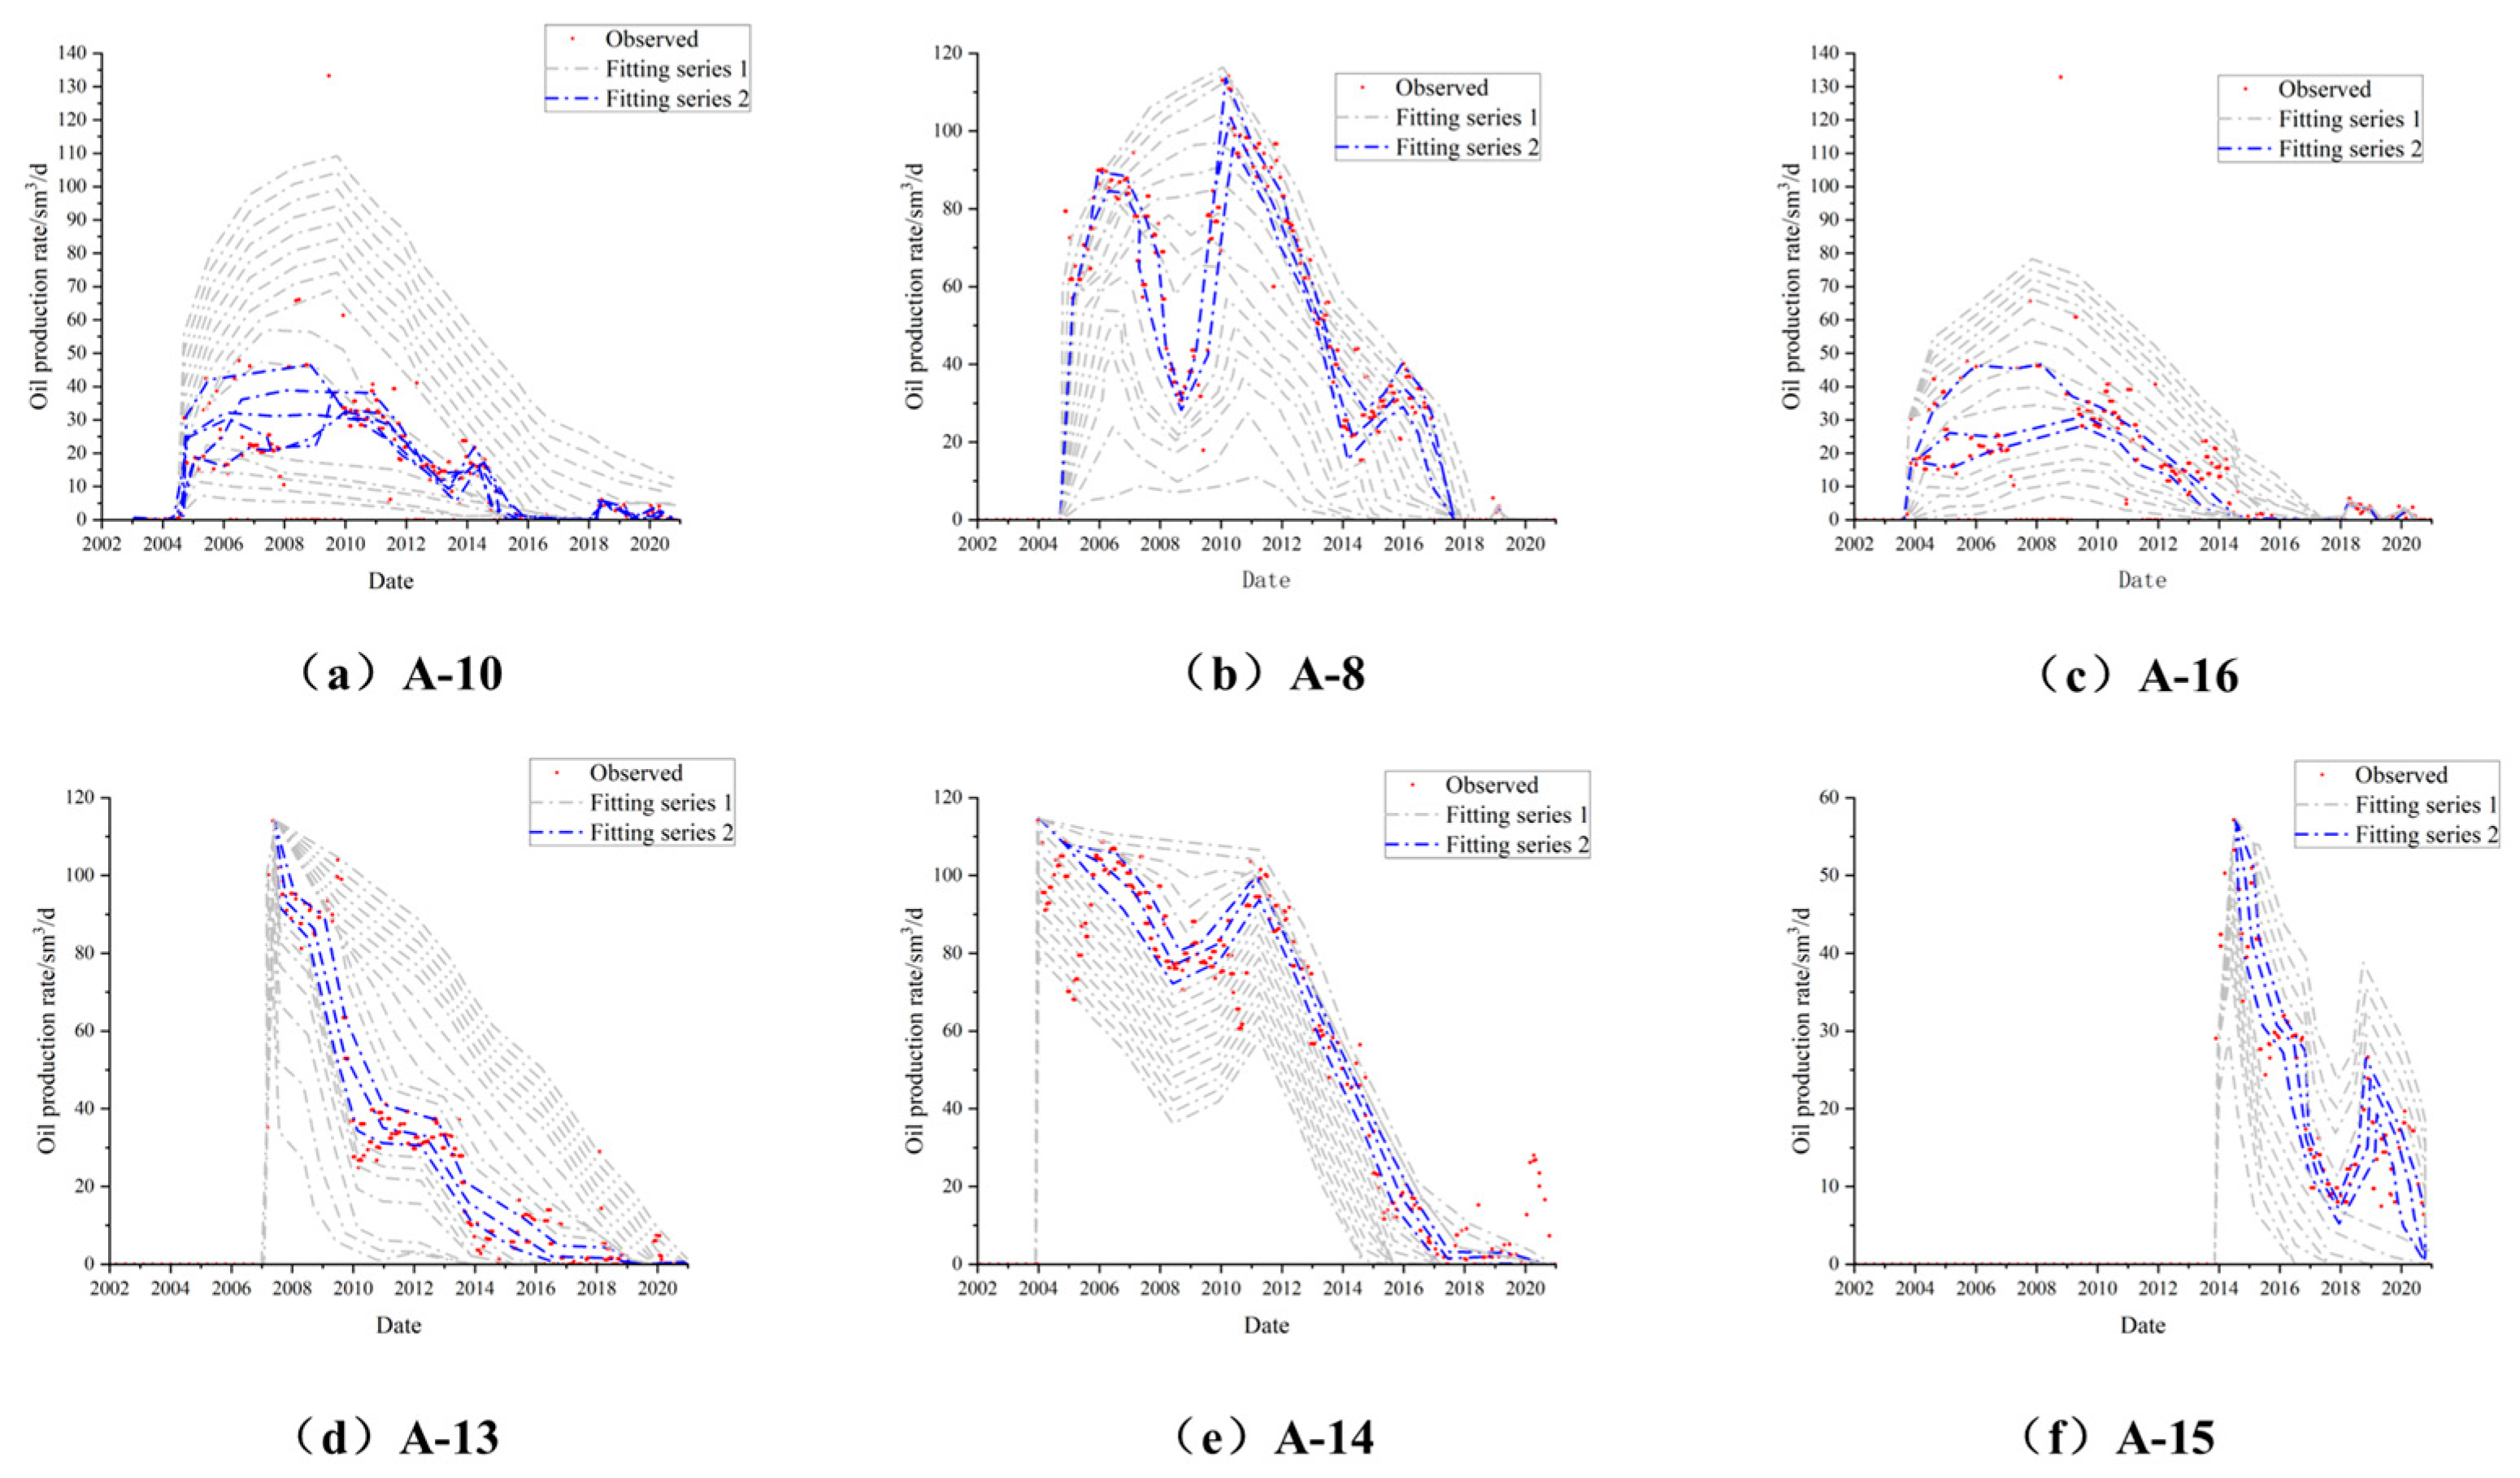
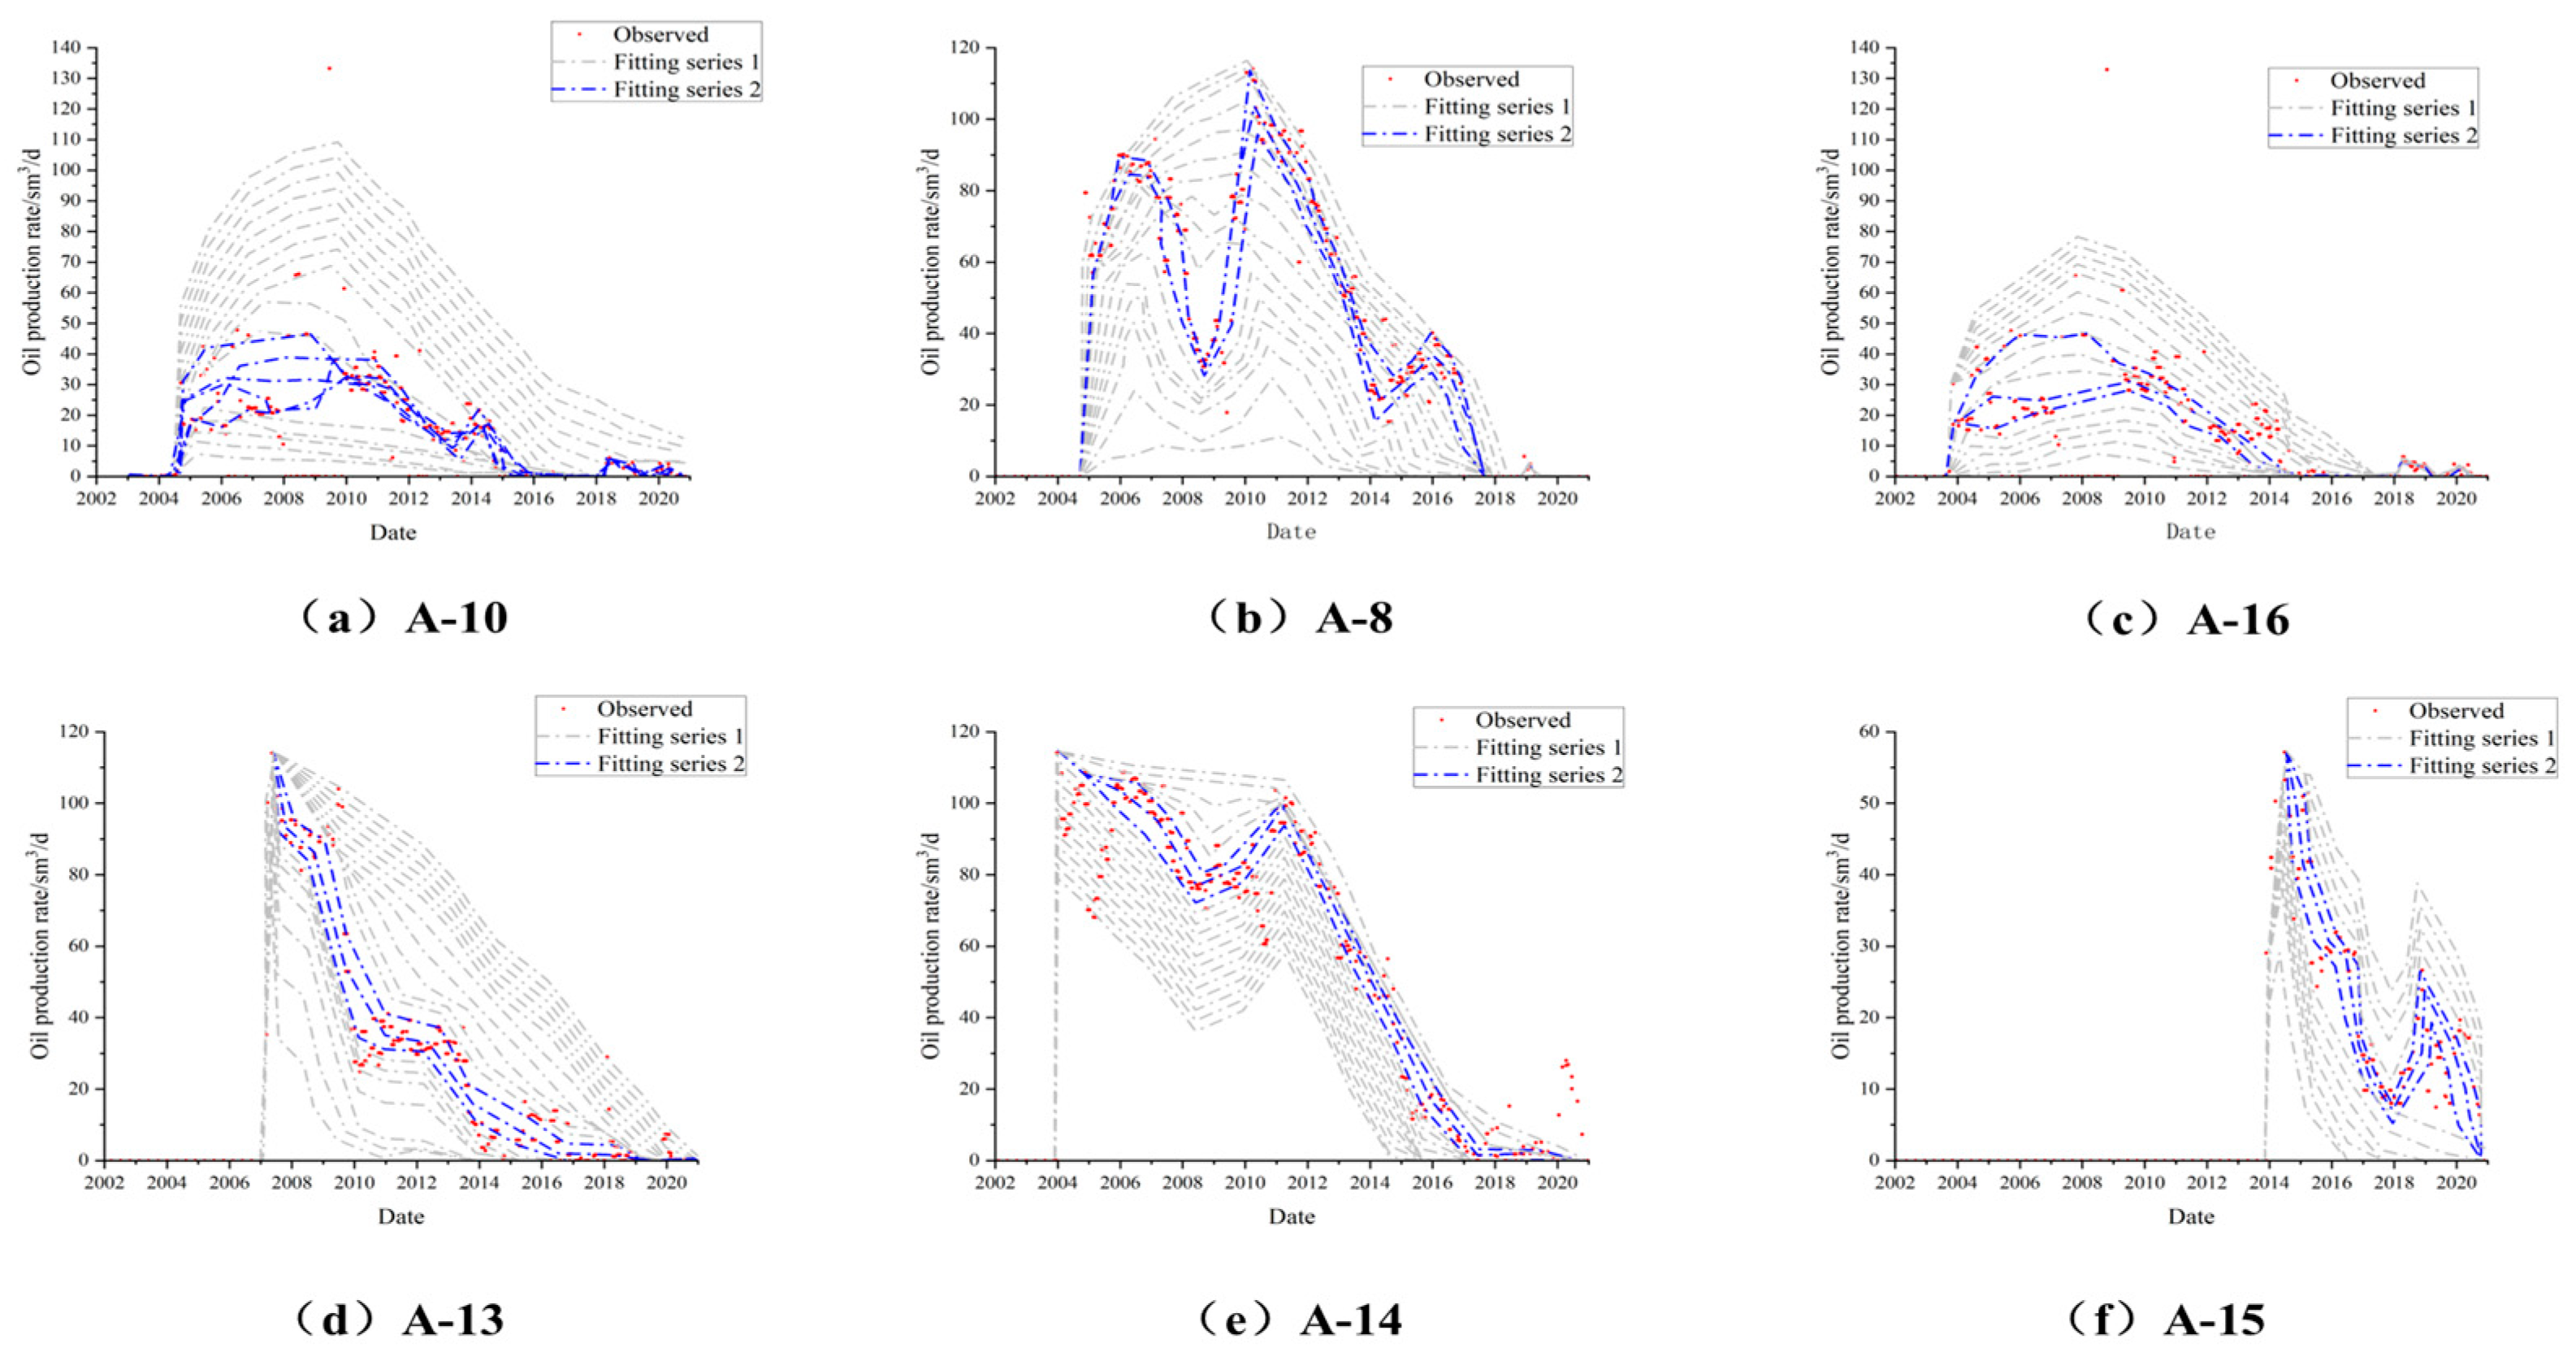
3.2. Cases Studied
4. Conclusions
- (1)
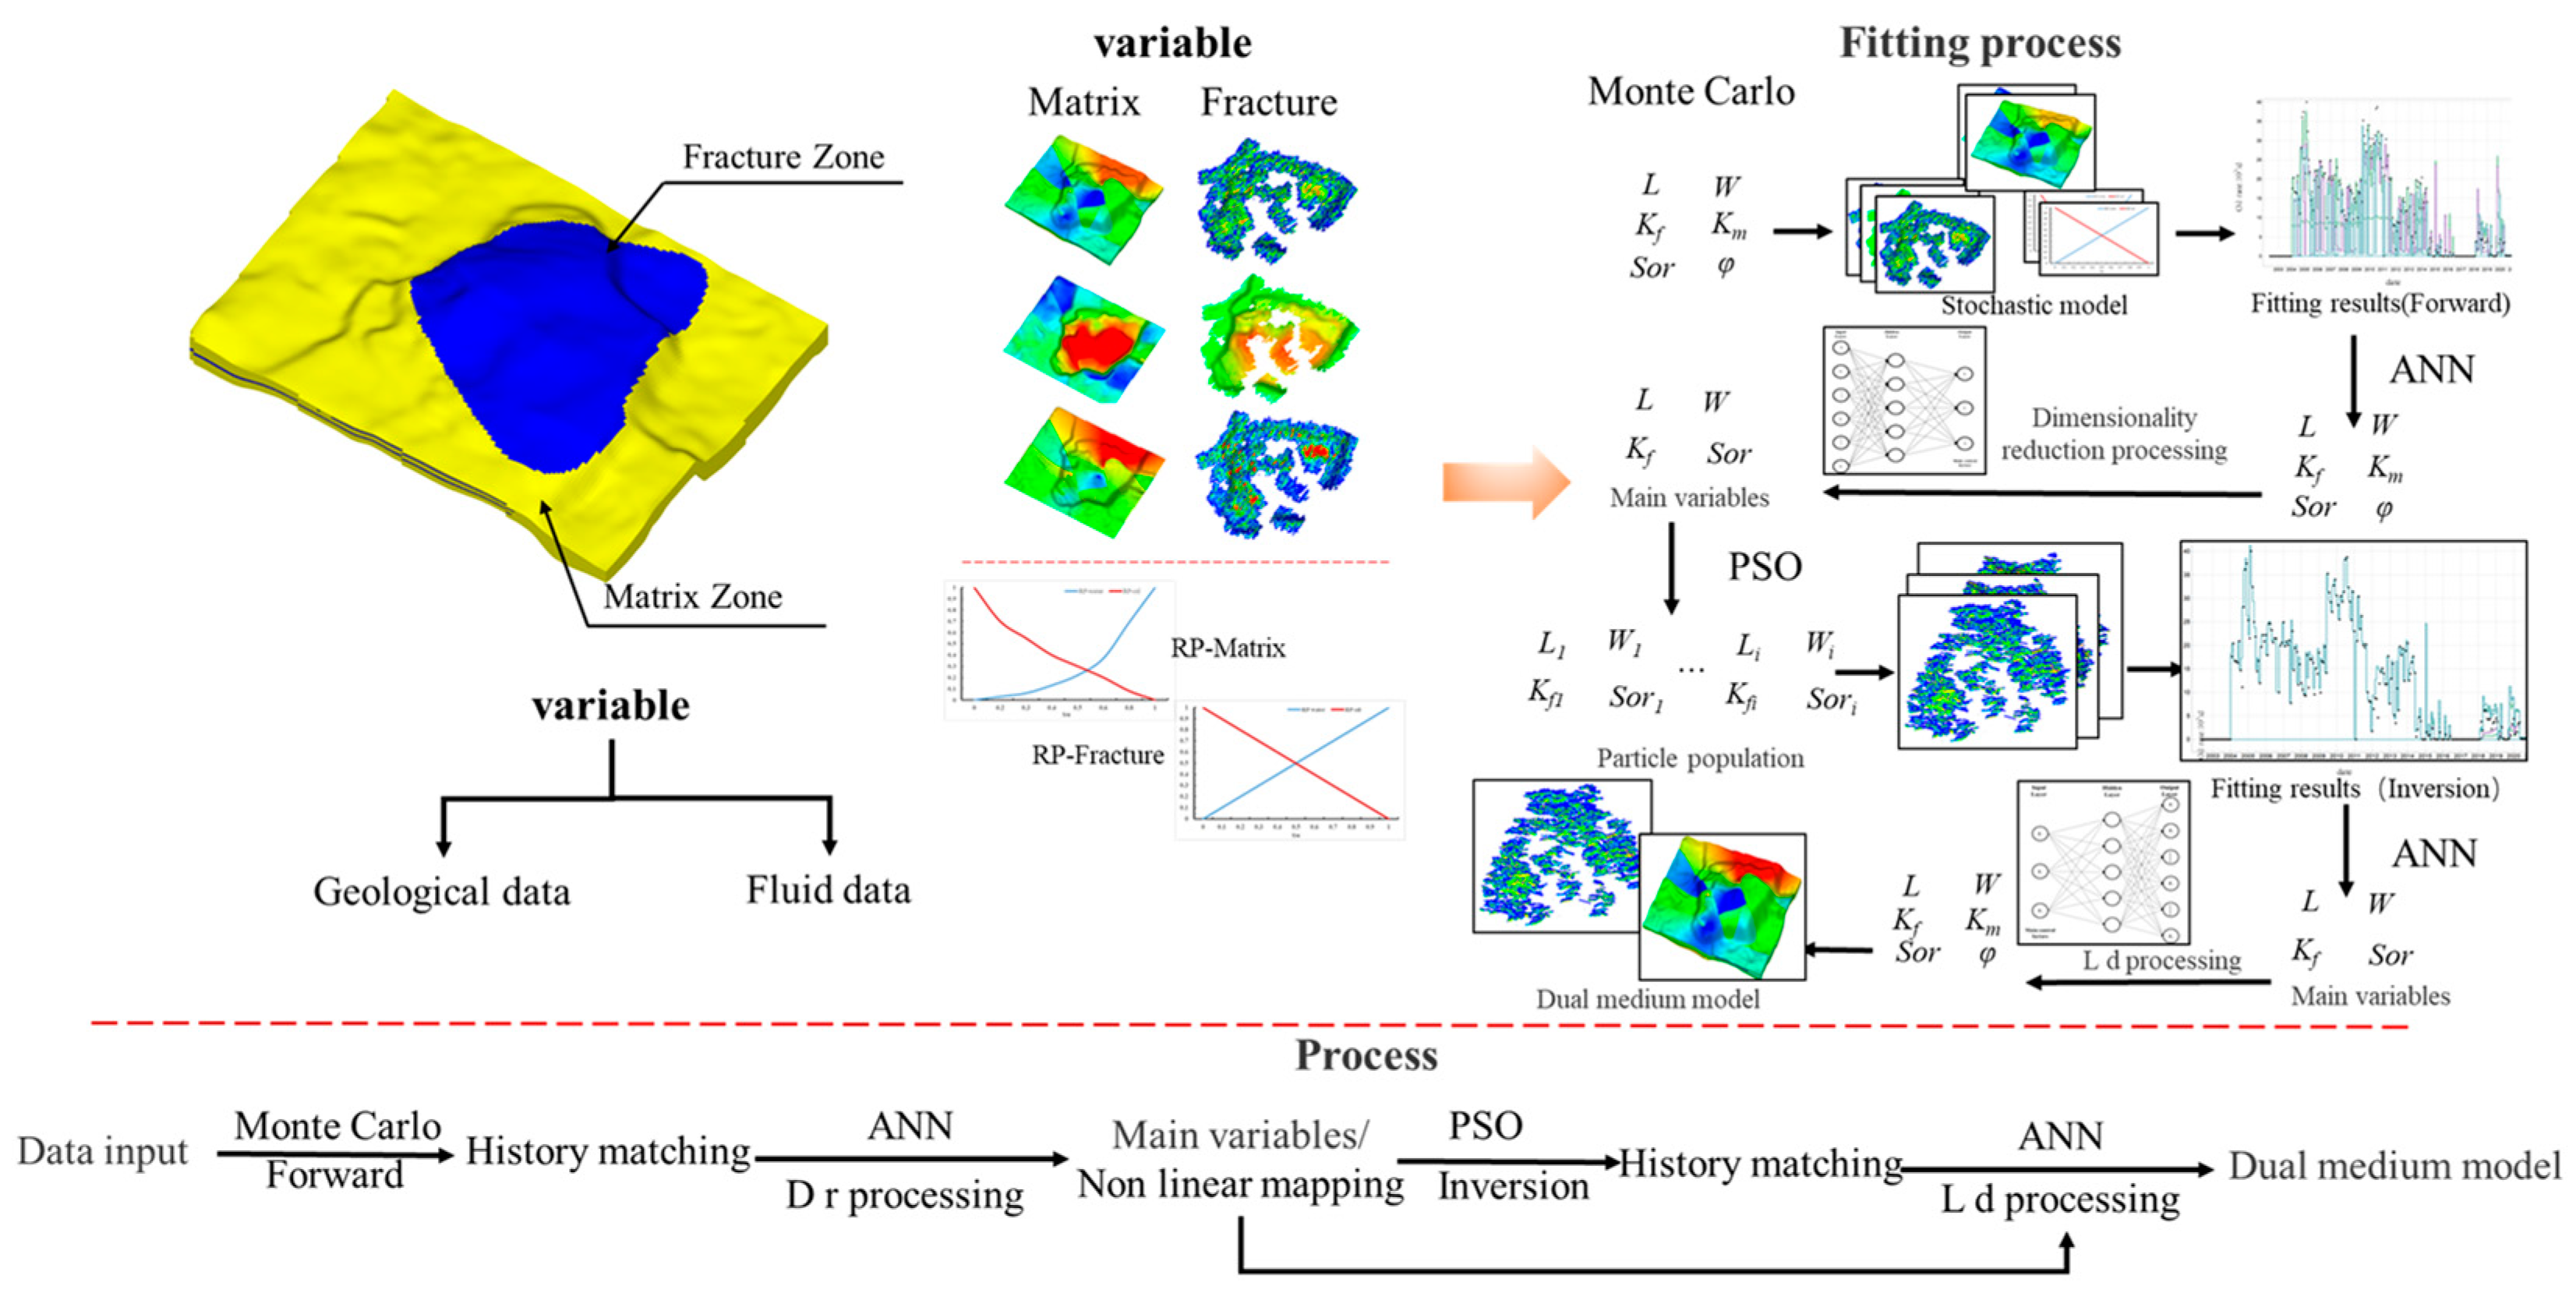
- In this paper, a multi-overlapping AI history method based on the Monte Carlo experimental planning method, combined with an artificial neural network and a particle swarm optimization algorithm was proposed. By this method, the automatic matching of AI history for complex fractured reservoirs was realized and engineering technical problems such as the difficulty in matching such reservoirs and the low matching accuracy were solved.
- (2)
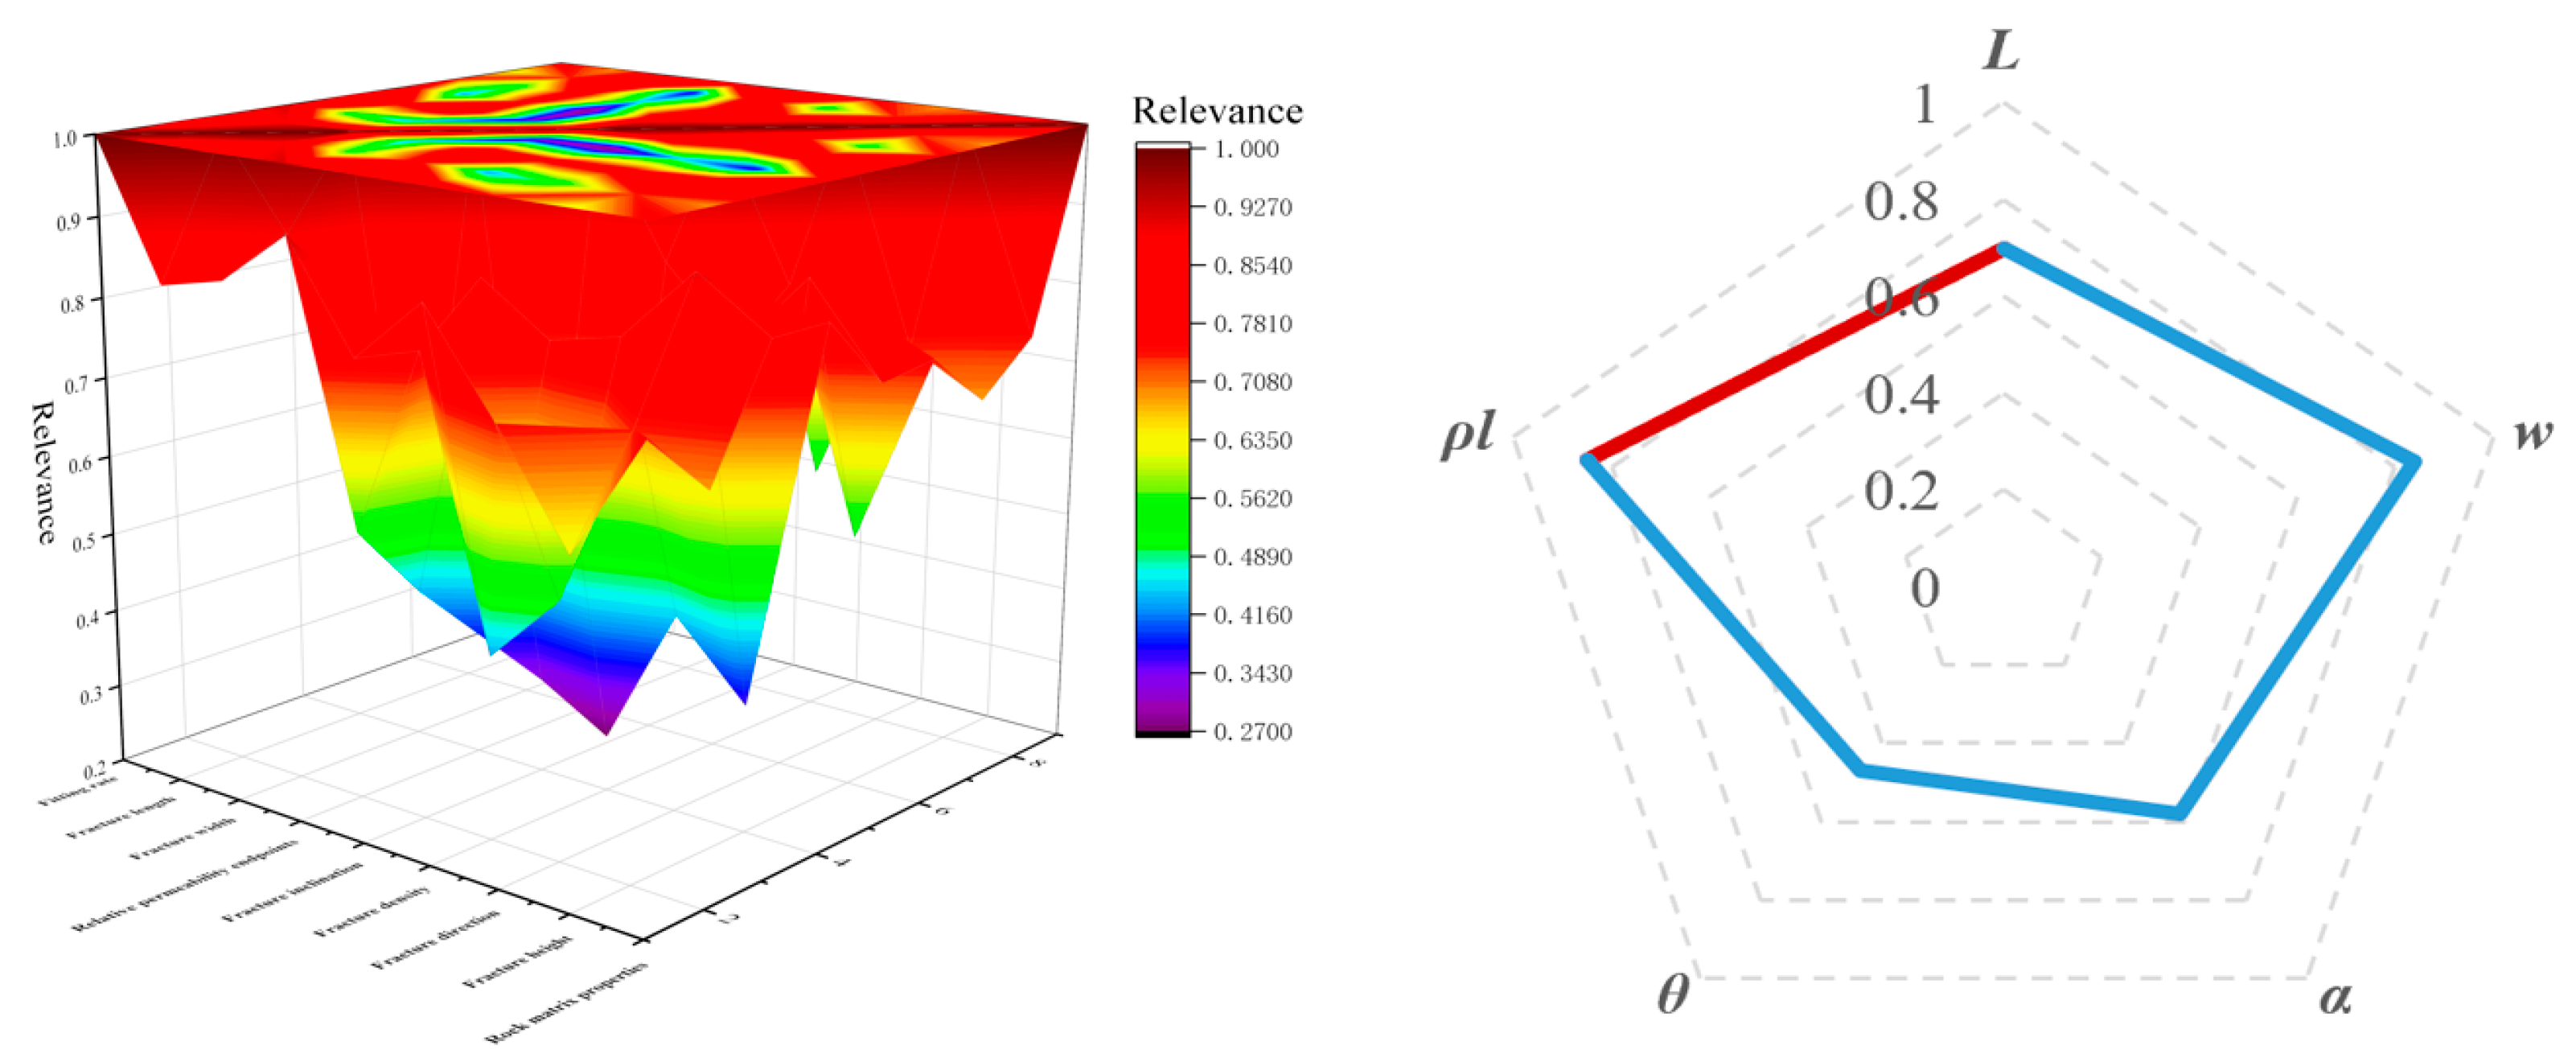
- Based on the method, the influence of uncertain parameters on the history matching of fractured reservoirs during most seismic and drilling logging processes was discussed. Combined with the actual production data, the nonlinear mapping relationship between the parameters and production data was obtained, and the parameters with higher correlation were selected so as to realize the identification and analysis of the main control factors of fractured reservoir history matching.
- (3)
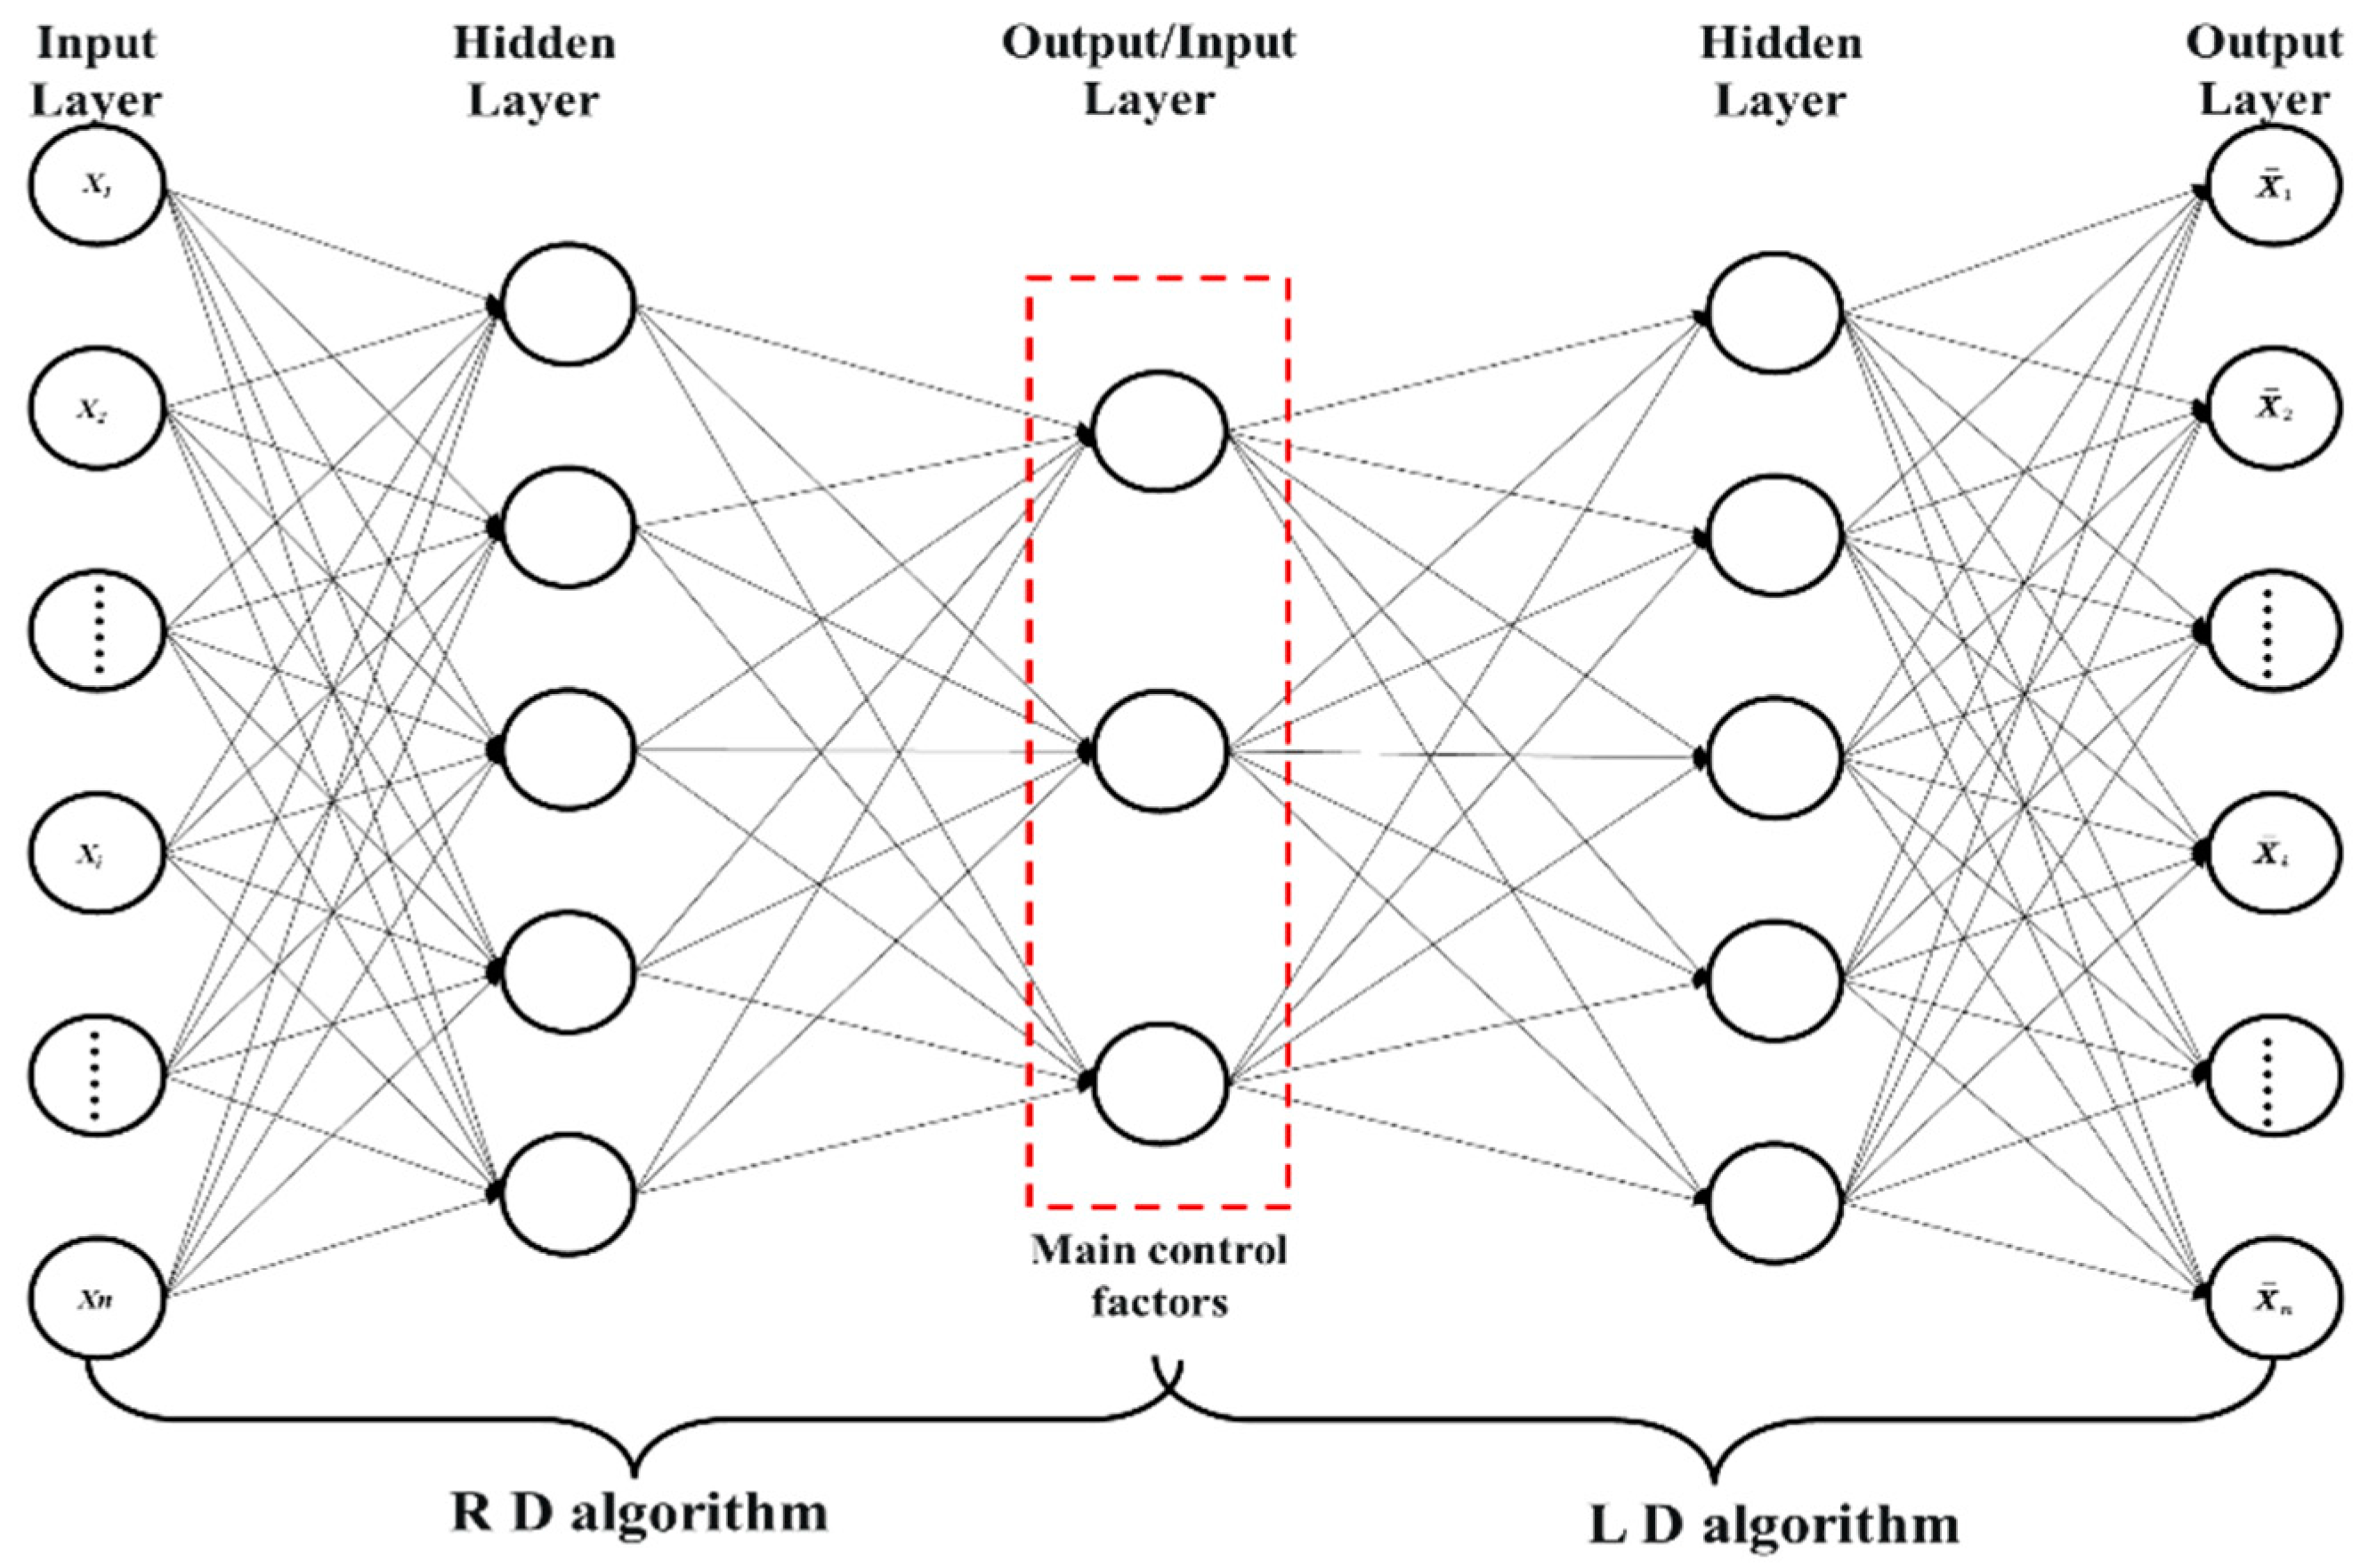
- In addition, for the massive data in high-precision history matching, this paper proposed the method of gradually reducing the parameter dimension and increasing the parameter dimension. This alleviated the shortcomings of artificial intelligence such as parameter redundancy in the process of automatic history matching to a certain extent. The feasibility of the program was verified with examples. However, the method was constrained by well data, and there was some difficulty in history matching for large oil and gas reservoirs. Finally, this thesis provided some technical guidance and solutions for the study of high-precision history matching in submerged fractured reservoirs.
Author Contributions
Funding
Data Availability Statement
Acknowledgments
Conflicts of Interest
References
- Allan, J.; Sun, S.Q. Fractured Reservoir Recovery: Lessons Learned from 100 Examples of Fractured Fields. Pet. Explor. Dev. 2003, 6, 51–52. [Google Scholar]
- Bratton, T.; Canh, D.V.; Van Que, N.; Gillespie, P.; Hunt, D.; Li, B.; Marcinew, R.; Ray, S.; Montaron, B.; Nelson, R.; et al. The nature of naturally fractured reservoirs. Oilfield Rev. 2006, 18, 4–23. [Google Scholar]
- Nelson, R.A.; Moldovanyi, E.P.; Matcek, C.C.; Azpiritxaga, I.; Bueno, E. Production characteristics of the fractured reservoirs of the Paz Field, Maracaibo Basin, Venezuela. AAPG Bull. 2000, 84, 1791–1809. [Google Scholar]
- Chai, Z.; Yan, B.; Killough, J.E.; Wang, Y. An efficient method for fractured shale reservoir history matching: The embedded discrete fracture multi-continuum approach. J. Pet. Sci. Eng. 2018, 160, 170–181. [Google Scholar] [CrossRef]
- Jirasek, M.; Zimmermann, T. Embedded crack model. Part II: Combination with smeared cracks. Int. J. Numer. Methods Eng. 2001, 50, 1291–1305. [Google Scholar] [CrossRef]
- Jo, H.; Jung, H.; Ahn, J.; Lee, K.; Choe, J. History matching of channel reservoirs using ensemble Kalman filter with continuous update of channel information. Energy Explor. Exploit. 2017, 35, 3–23. [Google Scholar] [CrossRef]
- Shaoqun, D.; Lianbo, Z. Lithofacies identification in carbonate reservoirs by multiple kernel Fisher discriminant analysis using conventional well logs: A case study in A oilfield, Zagros Basin, Iraq. J. Pet. Sci. Eng. 2022, 210, 110081. [Google Scholar]
- Canchumuni, S.W.A.; Castro, J.D.B.; Potratz, J.; Emerick, A.A.; Pacheco, M.A.C. Recent developments combining ensemble smoother and deep generative networks for facies history matching. Comput. Geosci. 2021, 25, 433–466. [Google Scholar] [CrossRef]
- Chen, G.; Zhang, K.; Xue, X.; Zhang, L.; Yao, J.; Sun, H.; Fan, L.; Yang, Y. Surrogate-assisted evolutionary algorithm with dimensionality reduction method for water flooding production optimization. J. Pet. Sci. Eng. 2020, 185, 106633. [Google Scholar] [CrossRef]
- Sun, Z.; Yang, X.; Wang, X.; Tan, T.; Feng, J. Identification method of karst pore channels in seam-hole type reservoirs based on frequency domain analysis. Oil Gas Geol. Recovery 2021, 28, 57–63+136. [Google Scholar]
- Sircar, A.; Yadav, K.; Rayavarapu, K.; Bist, N. Genetic-based Monte Carlo Modeling of geothermal prospects: Indian examples. Model. Earth Syst. Environ. 2022, 8, 2331–2346. [Google Scholar] [CrossRef]
- Zhang, X.S.; Hou, J.; Wang, D.G.; Mu, T.H.; Wu, J.T.; Lu, X.J. An Automatic History Matching Method of Reservoir Numerical Simulation Based on Improved Genetic Algorithm. Procedia Eng. 2012, 29, 3924–3928. [Google Scholar]
- Abdideh, M.; Ameri, A. Cluster analysis of petrophysical and geological parameters for separating the electrofacies of a gas carbonate reservoir sequence. Nat. Resour. Res. 2020, 29, 1843–1856. [Google Scholar] [CrossRef]
- Ouenes, A. Practical application of fuzzy logic and neural networks to fractured reservoir characterization. Comput. Geosci. 2000, 26, 953–962. [Google Scholar] [CrossRef]
- Thomas, L.K.; Dixon, T.N.; Pierson, R.G. Fractured reservoir simulation. SPE J. 1983, 23, 42–54. [Google Scholar] [CrossRef]
- Attias, H. Inferring Parameters and Structure of Latent Variable Models by Variational Bayes. In Proceedings of the 15th Annual Conference on Uncertainty in Artificial Intelligence, Stockholm, Sweden, 30 July–1 August 1999; pp. 21–30. [Google Scholar]
- Sarkka, S.; Nummenmaa, A. Recursive noise adaptive Kalman filtering via variational Bayesian approximation. IEEE Trans. Autom. Control 2009, 54, 596–600. [Google Scholar] [CrossRef]
- Chen, J.; Li, J.; Gao, X.B. Dual recursive variational Bayesian adaptive Kalman filtering algorithm. J. Univ. Electron. Sci. Technol. China 2012, 41, 359–363. [Google Scholar]
- Mehra, R. Adaptive filtering methods. IEEE Trans. Autom. Control 1972, 17, 693–698. [Google Scholar] [CrossRef]
- Kazemi, A.; Stephen, K.D. Schemes for automatic history matching of reservoir modelling: A case of Nelson oilfield in UK. Pet. Explor. Dev. 2012, 39, 349–361. [Google Scholar] [CrossRef]
- Avansi, G.D.; Schiozer, D.J. A New Approach to History Matching Using Reservoir Characterization and Reservoir Simulation Integrated Studies. In Proceedings of the Offshore Technology Conference, Houston, TX, USA, 4–7 May 2015. [Google Scholar]
- Ching, W.K.; Zhang, S.; Ng, M.K.; Akutsu, T. An approximation method for solving the steady-state probability distribution of probabilistic Boolean networks. Bioinformatics 2007, 23, 1511–1518. [Google Scholar] [CrossRef]
- Saputelli, L.; Nikolaou, M.; Economides, M.J. Real-time reservoir management: A multiscale adaptive optimization and control approach. Comput. Geosci. 2006, 10, 61–96. [Google Scholar] [CrossRef]
- Brouwer, D.R.; Jansen, J.-D. Dynamic Optimization of Waterflooding with Smart Wells Using Optimal Control Theory. SPE J. 2004, 9, 391–402. [Google Scholar] [CrossRef]
- Alguliyev, R.; Aliguliyev, R.; Imamverdiyev, Y.; Sukhostat, L. History matching of petroleum reservoirs using deep neural networks. Intell. Syst. Appl. 2022, 16, 200128. [Google Scholar] [CrossRef]
- Lian, W.; Yuedong, Y.; Xiaodong, L. A critical review on intelligent optimization algorithms and surrogate models for conventional and unconventional reservoir production optimization. Fuel 2023, 350, 128826. [Google Scholar]
- Lijun, W. Research on Automatic Reservoir History Matching Method Based on Neural Network; Xi’an Petroleum University: Xi’an, China, 2023. [Google Scholar]
- Reichstein, M.; Camps-Valls, G.; Stevens, B.; Jung, M.; Denzler, J.; Carvalhais, N.; Prabhat, F. Deep learning and process understanding for data-driven Earth system science. Nature 2019, 566, 195–204. [Google Scholar] [CrossRef] [PubMed]
- Kennedy, J.; Eberhart, R. Particle Swarm Optimization. In Proceedings of the ICNN’95-International Conference on Neural Networks, Perth, WA, Australia, 27 November–1 December 1995; Volume 4, pp. 1942–1948. [Google Scholar]
- Kennedy, J.; Eberhart, R.C. A Discrete Binary Version of the particle Swarm Algorithm. In Proceedings of the 1997 IEEE International Conference on Systems, Man, and Cybernetics. Computational Cybernetics and Simulation, Orlando, FL, USA, 12–15 October 1997; Volume 5, pp. 4104–4108. [Google Scholar]
- Bakyani, A.E.; Sahebi, H.; Ghiasi, M.M.; Mirjordavi, N.; Esmaeilzadeh, F.; Lee, M.; Bahadori, A. Prediction of CO2–oil molecular diffusion using adaptive neuro-fuzzy inference system and particle swarm optimization technique. Fuel 2016, 181, 178–187. [Google Scholar] [CrossRef]
- Eberhart, R.C.; Yin, S. Comparison Between Genetic Algorithms and Particle Swarm Optimization. In Proceedings of the Evolutionary Programming VII, 7th International Conference, EP98, San Diego, CA, USA, 25–27 March 1998; Springer: Berlin/Heidelberg, Germany, 1998. [Google Scholar]
- Zhan, Z.H.; Zhang, J.; Li, Y.; Chung, H.S.H. Adaptive Particle Swarm Optimization (PDF). IEEE Trans. Syst. Man Cybern. 2009, 39, 1362–1381. [Google Scholar] [CrossRef]
- Urang, J.G.; Ebong, E.D.; Akpan, A.E.; Akaerue, E.I. A new approach for porosity and permeability prediction from well logs using artificial neural network and curve matching techniques: A case study of Niger Delta, Nigeria. J. Appl. Geophys. 2020, 183, 104207. [Google Scholar] [CrossRef]
- Huang, Z.; Shimeld, J.; Williamson, M.; Katsube, J. Permeability prediction with artificial neural network modeling in the Venture gas field, offshore eastern Canada. Geophysics 1996, 61, 422–436. [Google Scholar] [CrossRef]
- Liu, Y. Application of multi-resolution comprehensive evaluation of fracture logging to Asmari Formation carbonate reservoir in A oilfield, southeastern Iraq. Mineral. Petrol. 2022, 42, 101–111. [Google Scholar]
- Li, C.; Zhao, L.; Liu, B.; Li, J.; Chen, Y.; Zhang, Y. Research status and development trend of fracture in carbonate reservoir. Bull. Geol. Sci. Technol. 2021, 40, 31–48. [Google Scholar]
- Hao, S.U.; Zhengdong, L.E.I.; Zhang, D.; Junchao, L.I.; Zhang, Z.; Binshan, J.U.; Zhiping, L.I. Dynamic and static comprehensive prediction method of natural fractures in fractured oil reservoirs: A case study of Triassic Chang 63 reservoirs in Huaqing Oilfield, Ordos Basin, NW China. Pet. Explor. Dev. 2017, 44, 919–929. [Google Scholar]


| Reservoir Physical Parameters | Value |
|---|---|
| Well area | 12.9 km2 |
| Crude oil reserves | 6.93 × 10⁶ m3 |
| Porosity (matrix system) | 0.59~7.32% |
| Permeability (matrix system) | 0.3~3.6 mD |
| Porosity (fracture system) | 5.6~27.8% |
| Permeability (fracture system) | 0~2204.4 mD |
| Fracture density | 0.53~2.26 pieces/m2 |
| Fracture length | 0.5~72.6 m |
| Reservoir Physical Parameters | Value |
|---|---|
| Well area | 0.38 km2 |
| Crude oil reserves | 6.48 × 10⁵ m3 |
| Porosity (matrix system) | 1.3~3.9% |
| Permeability (matrix system) | 0.4~3.6 mD |
| Permeability (fracture system) | 0~2035.7 mD |
| Fracture density | 0.62~1.85 pieces/m2 |
| Fracture length | 0.5~72.6 m |
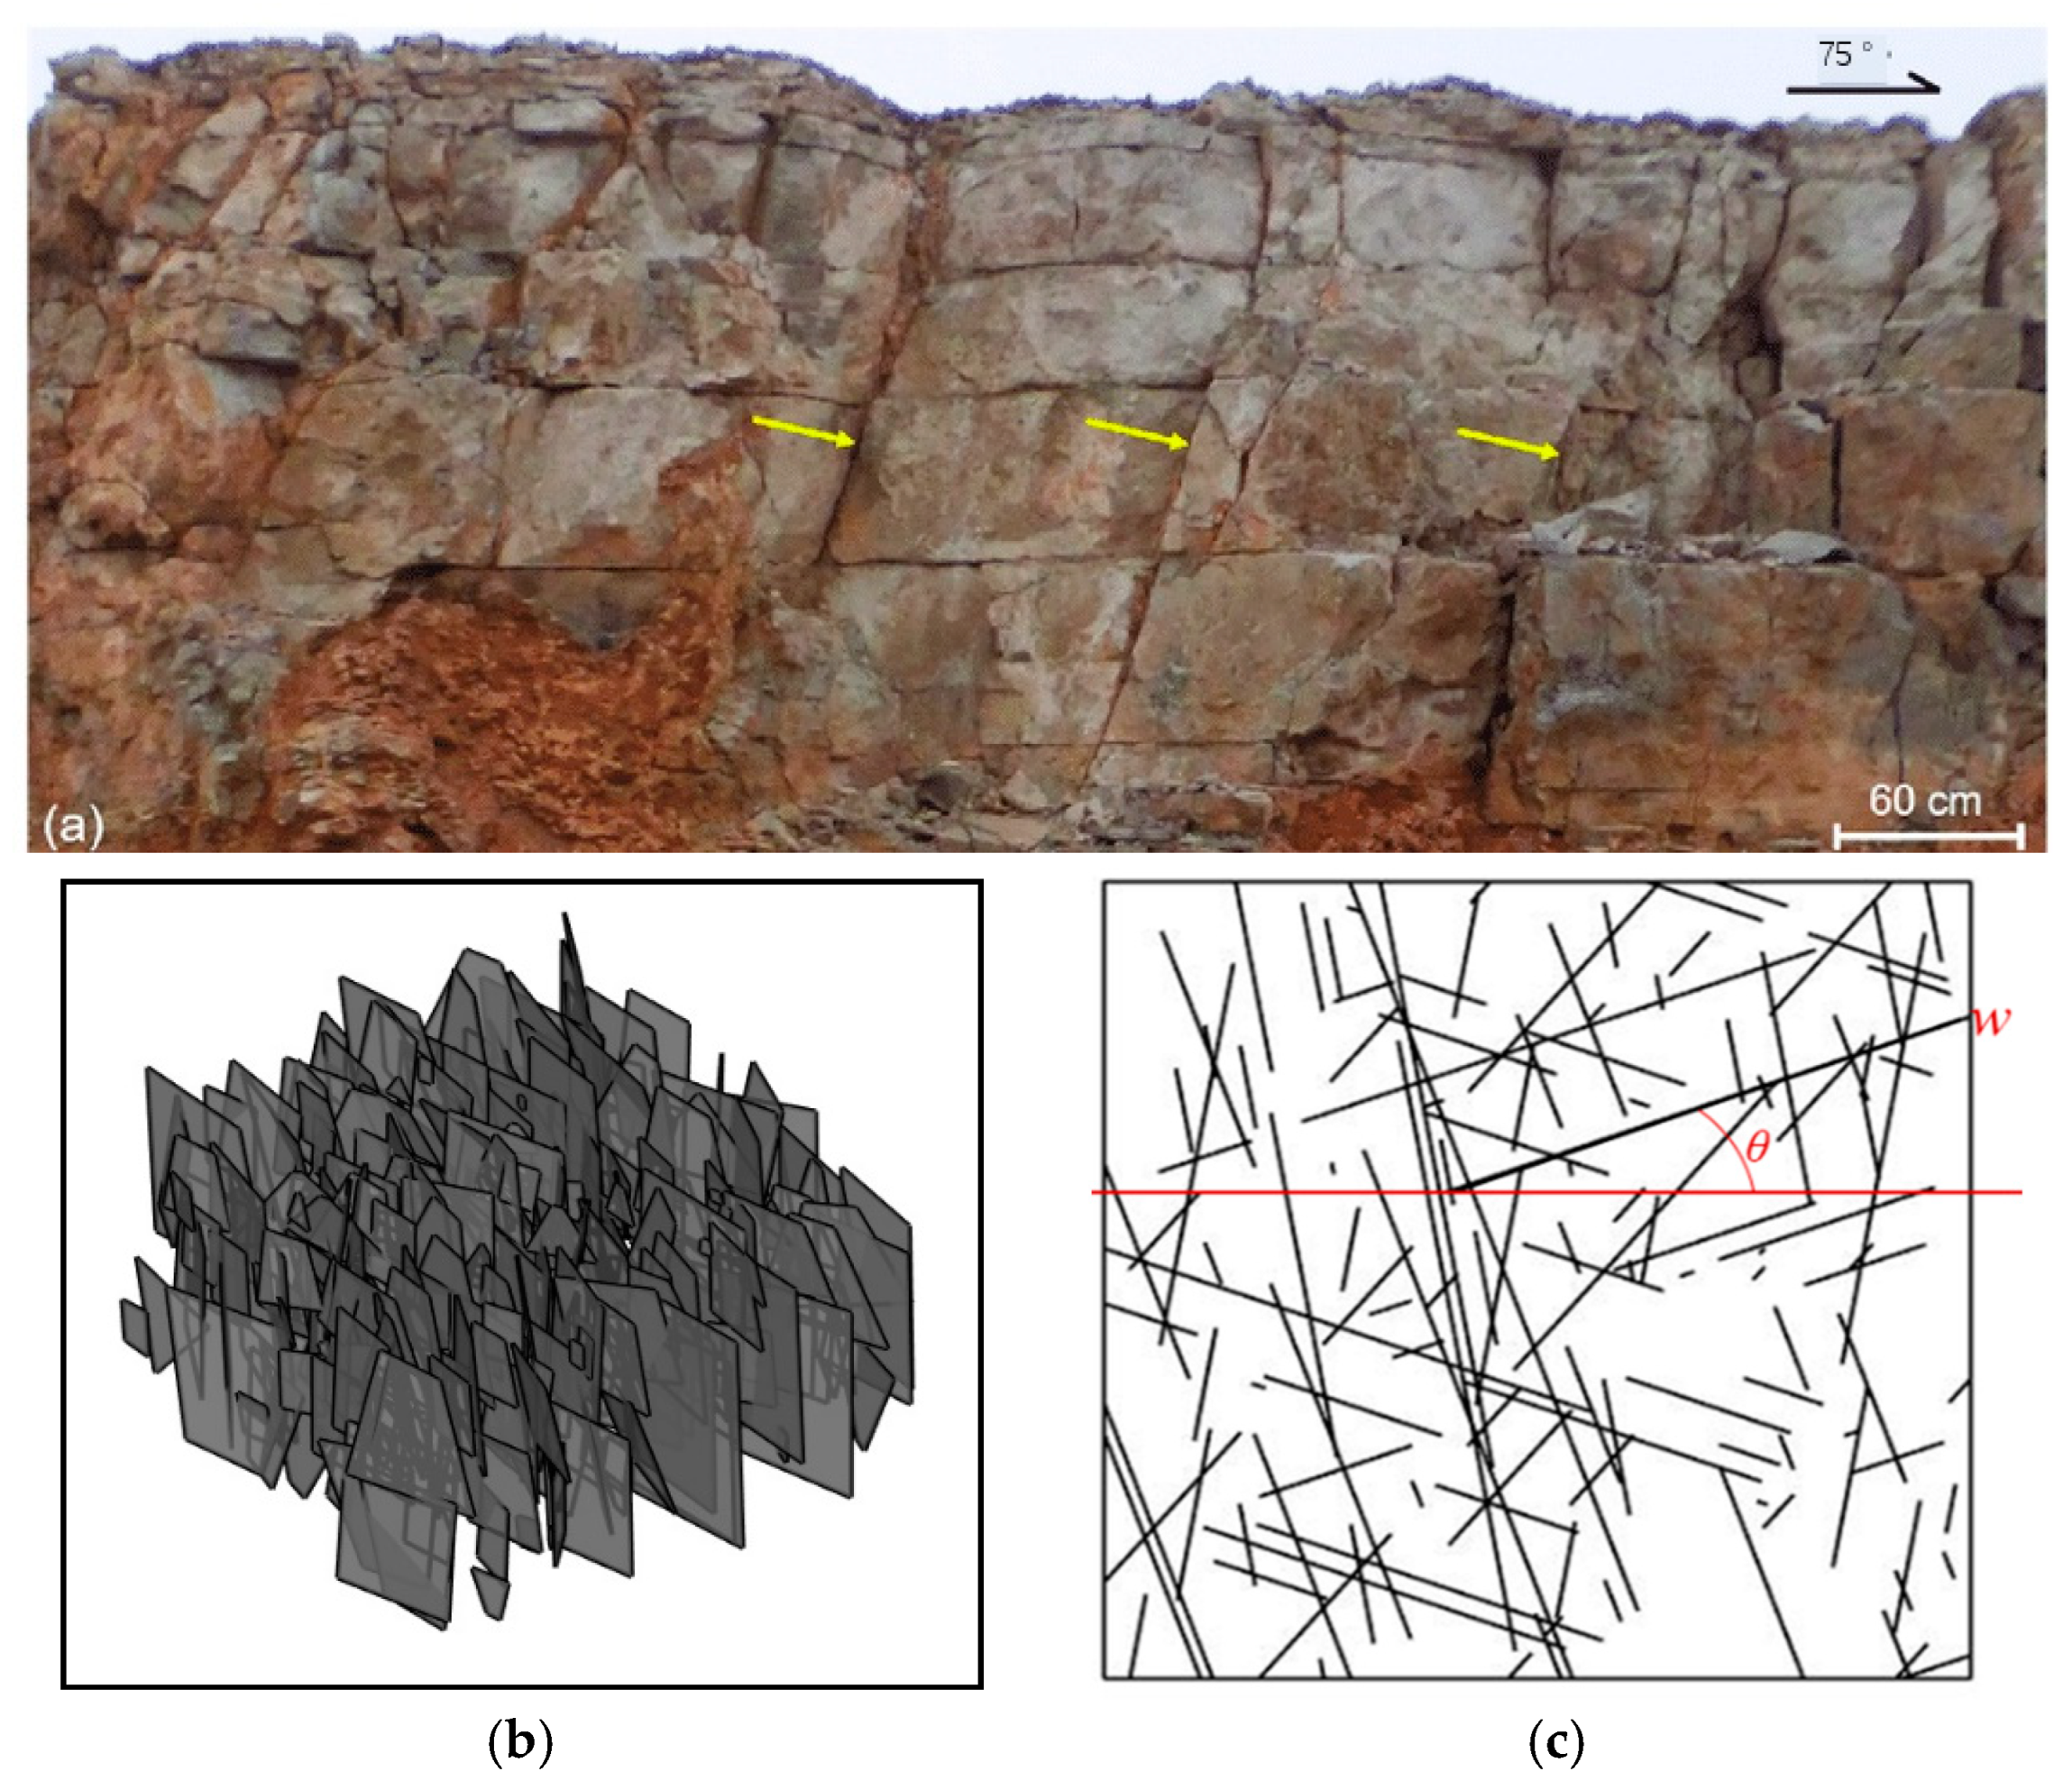
| Fracture Length /m | Fracture Opening /μm | Fracture Dip Angle/° | Fracture Density /Pieces/m2 | Fracture Azimuth /° |
|---|---|---|---|---|
| 3–50 | 58–149 | 69–75 | 0.6~1.2 | 0~150 |
Disclaimer/Publisher’s Note: The statements, opinions and data contained in all publications are solely those of the individual author(s) and contributor(s) and not of MDPI and/or the editor(s). MDPI and/or the editor(s) disclaim responsibility for any injury to people or property resulting from any ideas, methods, instructions or products referred to in the content. |
© 2024 by the authors. Licensee MDPI, Basel, Switzerland. This article is an open access article distributed under the terms and conditions of the Creative Commons Attribution (CC BY) license (https://creativecommons.org/licenses/by/4.0/).
Share and Cite
Tong, K.; Song, W.; Chen, H.; Guo, S.; Li, X.; Sun, Z. Automatic History Matching Method and Application of Artificial Intelligence for Fractured-Porous Carbonate Reservoirs. Processes 2024, 12, 2634. https://doi.org/10.3390/pr12122634
Tong K, Song W, Chen H, Guo S, Li X, Sun Z. Automatic History Matching Method and Application of Artificial Intelligence for Fractured-Porous Carbonate Reservoirs. Processes. 2024; 12(12):2634. https://doi.org/10.3390/pr12122634
Chicago/Turabian StyleTong, Kaijun, Wentong Song, Han Chen, Sheng Guo, Xueyuan Li, and Zhixue Sun. 2024. "Automatic History Matching Method and Application of Artificial Intelligence for Fractured-Porous Carbonate Reservoirs" Processes 12, no. 12: 2634. https://doi.org/10.3390/pr12122634
APA StyleTong, K., Song, W., Chen, H., Guo, S., Li, X., & Sun, Z. (2024). Automatic History Matching Method and Application of Artificial Intelligence for Fractured-Porous Carbonate Reservoirs. Processes, 12(12), 2634. https://doi.org/10.3390/pr12122634