Article

A Novel Approach to Predicting Critical Alternating Stall in a Centrifugal Pump Impeller with Even Blades Under Transient Conditions

1
Zhejiang Key Laboratory of Multiflow and Fluid Machinery, Zhejiang Sci-Tech University, Hangzhou 310018, China
2
Zhejiang Testing & Inspection Institute for Mechanical and Electrical Products Quality Co., Ltd., Hangzhou 310051, China
*
Author to whom correspondence should be addressed.
Processes 2024, 12(12), 2635; https://doi.org/10.3390/pr12122635
Submission received: 6 November 2024 / Revised: 18 November 2024 / Accepted: 20 November 2024 / Published: 22 November 2024
(This article belongs to the Section Process Control and Monitoring)

Abstract

:
A novel approach is proposed to predict alternating stall in a centrifugal pump impeller with even blades by introducing a low-pressure ratio, which is defined as the ratio of the deviation of the low-pressure zones of adjacent impeller passages. The threshold of 2/3 is shown to be a good quantity with which to accurately and quantitatively predict alternating stall and even critical alternating stall (CAS). The effectiveness of this new approach is validated by comparison with previous findings obtained under quasi-steady conditions. Large eddy simulation data for a six-blade centrifugal pump impeller are used to predict the CAS under transient conditions, with the transient conditions corresponding to a sinusoidal flow rate with an equilibrium value of 0.5Qd (where Qd is the design load) and an initial phase of zero combined with different oscillation amplitudes. The low-pressure ratio frequency equals the flow rate frequency, approximately 2 Hz. The phase of the low-pressure ratio lags behind the flow rate. When the oscillation amplitude is larger than 0.15Qd, a non-stall state occurs during the dropping stage of the flow rate. The flow rates corresponding to the CAS during the dropping and rising stages, respectively, increase and decrease as the oscillation amplitude increases.

1. Introduction

Alternating stall in centrifugal pumps with even blades is a key issue associated with the unstable flow phenomenon, which often occurs under low flow rates (typically when the flow rate is below 0.7Qd [1,2,3]). This phenomenon usually leads to pump instability, low efficiency, high vibration, and strong noise and could potentially result in significant damage to the entire pump system. Therefore, a detailed understanding of alternating stall can not only help reveal the internal flow mechanism of centrifugal pumps [4,5] but can also help with the pump design [6,7].
Pedersen et al. [8] and Byskov et al. [9] observed a two-channel phenomenon in a centrifugal pump impeller with six blades operating at a quarter load. Subsequently, a volute was added to the centrifugal pump impeller, and the velocity distributions were measured using laser Doppler velocimetry by Johnson et al. [10]. Their findings revealed that the reduced flow rate experienced significant changes, exhibiting alternating stable patterns of stationary stall and non-stall passages, which aligned with the results obtained for a centrifugal pump impeller. Ran and Wang [11] observed alternating stall in an investigation of flow streamlines, whose pressure fluctuations were lower in amplitude and higher in frequency than those seen in rotating stall [12,13]. Cheah et al. [14] simulated the complex internal flow in a centrifugal pump impeller with six twisted blades and identified the alternating stall at a low flow rate. Zhou et al. [15] investigated the unsteady flow structures and evolution under alternating stall and rotating stall in centrifugal pump impellers. According to the characteristics of stall cells in a compressor [16] or a centrifugal pump [17], alternating stall means that the stall cells and non-stall cells are alternately distributed in the impeller passages, forming a periodic symmetry, and the circumferential propagation speed is zero. Although the stall cells play an important role in the process of alternating stall, the definition of alternating stall has not yet been unified. Stall cells can often be represented by a significant pressure drop region in the impeller passage [18], a large back-flow region caused by the increase in the attack angle at the inlet guide vane [19], a low-speed region in the inlet impeller close to the suction side [14], and stall vortex structures in the impeller identified using the Q-criterion [1].
Although existing stall prediction methods helped with understanding the mechanism behind alternating stall, they have mainly involved qualitative analyses, and quantitative predictions are more difficult. Therefore, a major goal of the current study is to propose a novel approach to quantitatively predict alternating stall in centrifugal pump impellers.
Centrifugal pumps often operate under transient conditions wherein the flow parameters dramatically change over time, potentially leading to negative effects from pressure fluctuation [20]. Many investigations have been performed on the conditions of pump startup/shutdown [21,22,23,24,25,26] and rapid valve adjustments [27,28,29]. Considering transient conditions with a sinusoidal flow rate, Kuang et al. [30] investigated the pressure fluctuation characteristics in stall and non-stall passages and compared the results with the corresponding results under quasi-steady conditions. Subsequently, Kuang et al. [31] and Li et al. [32], respectively, discussed the influence of the oscillation frequency and oscillation amplitude on the internal flow characteristics. They found that the impeller may be in a stall state and was in a non-stall state at different moments. The critical alternating stall (CAS) under transient conditions is not yet known. Therefore, another main purpose of this study is to determine the CAS under such conditions.
This manuscript is organized as follows: An introduction of the geometric models and numerical methods is given in Section 2. An introduction and validation of the novel approach are presented in Section 3. In Section 4, the novel approach is applied to the transient conditions. The main conclusions are summarized in Section 5.

2. Geometric Models and Numerical Methods

2.1. Physical Model

The physical model of the centrifugal pump impeller used in this work represents a low-specific speed centrifugal pump operating with water as the working medium, which is an experimental model at the Technical University of Denmark [8]. The centrifugal pump impeller inlet radius measures 35.5 mm, and the outlet radius is 95 mm. The main parameters of the impeller are summarized in Table 1. The structural layout of the impeller domain features six blades that are both swept back and vertical, along with inlet and outlet pipes, as shown in Figure 1. The specific impeller parameters are as follows: a design flow rate of Qd = 3.06 kg/s, a design head of Hd = 1.75 m, and a design rotational speed of n = 725 rev/min.

2.2. Governing Equations

Advancements in computational fluid dynamics have led to the extensive application of numerical simulations in the investigations of centrifugal pump impellers. In this study, steady turbulence is simulated using the Shear Stress Transport k-ω model. Following this, the steady-state results serve as the initial flow field for large eddy simulations, which are employed to capture the unsteady turbulence characteristics of the centrifugal pump impeller.
(1)
Shear Stress Transport k-ω model
The governing equation of the Shear Stress Transport k-ω equation can be expressed as follows [33]:
t ρ k + x j ρ u j k = x j μ + μ t σ k 3 k x j + P k β ρ k ω ,
t ( ρ ω ) + x j ( ρ u j ω ) = x j μ + μ t σ ω 3 ω x j + ( 1 F 1 ) 2 ρ × 1 σ ω 2 ω k x j ω x j + α 3 ω k P k β 3 ρ ω 2 ,
where t and x denote the time and spatial coordinates, respectively; u denotes the velocity; ρ denotes the density; p denotes the pressure; k denotes turbulent kinetic energy; ω denotes specific dissipation rate; μ denotes dynamic viscosity; and μt denotes turbulent viscosity. β is an empirical constant, with a value of 0.09. α 3 , β 3 , σ k 3 , and σ ω 3 denote the turbulent coefficients. F1 denotes the blending function, and Pk denotes the generation term of turbulent kinetic energy, which are written as follows [34]:
F 1 = tanh ( a r g 1 4 ) ,
a r g 1 = min max k β ω y , 500 υ y 2 ω , 4 ρ k C D k ω σ ω 2 y 2 ,
C D k ω = max ( 2 ρ 1 σ ω 2 ω k x j ω x j , 1 × 10 10 ) ,
P k = μ t u i x j + u j x i u i x j .
where y is the distance to the grid center away from the wall.
The coefficients are a linear combination of the corresponding coefficients of the underlying models, as follows:
ϕ 3 = F 1 ϕ 1 + ( 1 F 1 ) ϕ 2 .
The coefficients of the underlying models are listed for completeness: α 1 = 5/9, β 1 = 0.075, σ k 1 = 1.176, σ ω 1 = 2, α 2 = 0.44, β 2 = 0.0828, σ k 2 = 1, σ ω 2 = 1/0.856.
Moreover, the specific turbulence dissipation rate is calculated using the following:
ω inlet = ρ k inlet μ t ,
k inlet = 3 2 I 2 u inlet 2 ,
I = U inlet u inlet ,
μ t = C I μ , C = 1000 .
where U denotes fluctuating velocity. The turbulence intensity is set to 5%, and the corresponding turbulent viscosity ratio is 50.
(2)
Dynamic Smagorinsky model
The turbulence scales that can be directly computed are referred to as solvable or resolvable turbulence scales, and those that cannot be directly computed are termed non-resolvable or subgrid-scale turbulence. The subgrid-scale stress tensor resulting from the filtering process remains unknown and requires a modeling approach. The specific formulations employed in this modeling are detailed below:
τ i j 1 3 δ i j τ k ¯ k = 2 v T S i j ,
S ij = 1 2 u i x j + u j x i
ν T = ( C s Δ ) 2 ( 2 S ij S i j ) 1 / 2
Germano et al. [35] introduced the dynamic Smagorinsky model, which was an improvement based on the model proposed by Lilly [36]. The core concept of this dynamic approach is to incorporate local turbulence structure information into the subgrid-scale stress through a pair of filtering steps, allowing for the adjustment of model coefficients during the computation. The stress tensor can be represented as follows:
L ij = u i ˜ u j ˜ u i u i ˜ = T i j τ ij
L i j 1 3 δ i j L k k = ( C D ) 2 M i j
M i j = 2 ( Δ ˜ ) 2 | S i j ˜ | S i j ˜ 2 ( Δ ) 2 | S ij | S ij ˜
The tilde represents the filtering operation with scale, and ui is the resolved velocity component:
C D = L i j M i j M i j M i j

2.3. Numerical Methods and Boundary Conditions

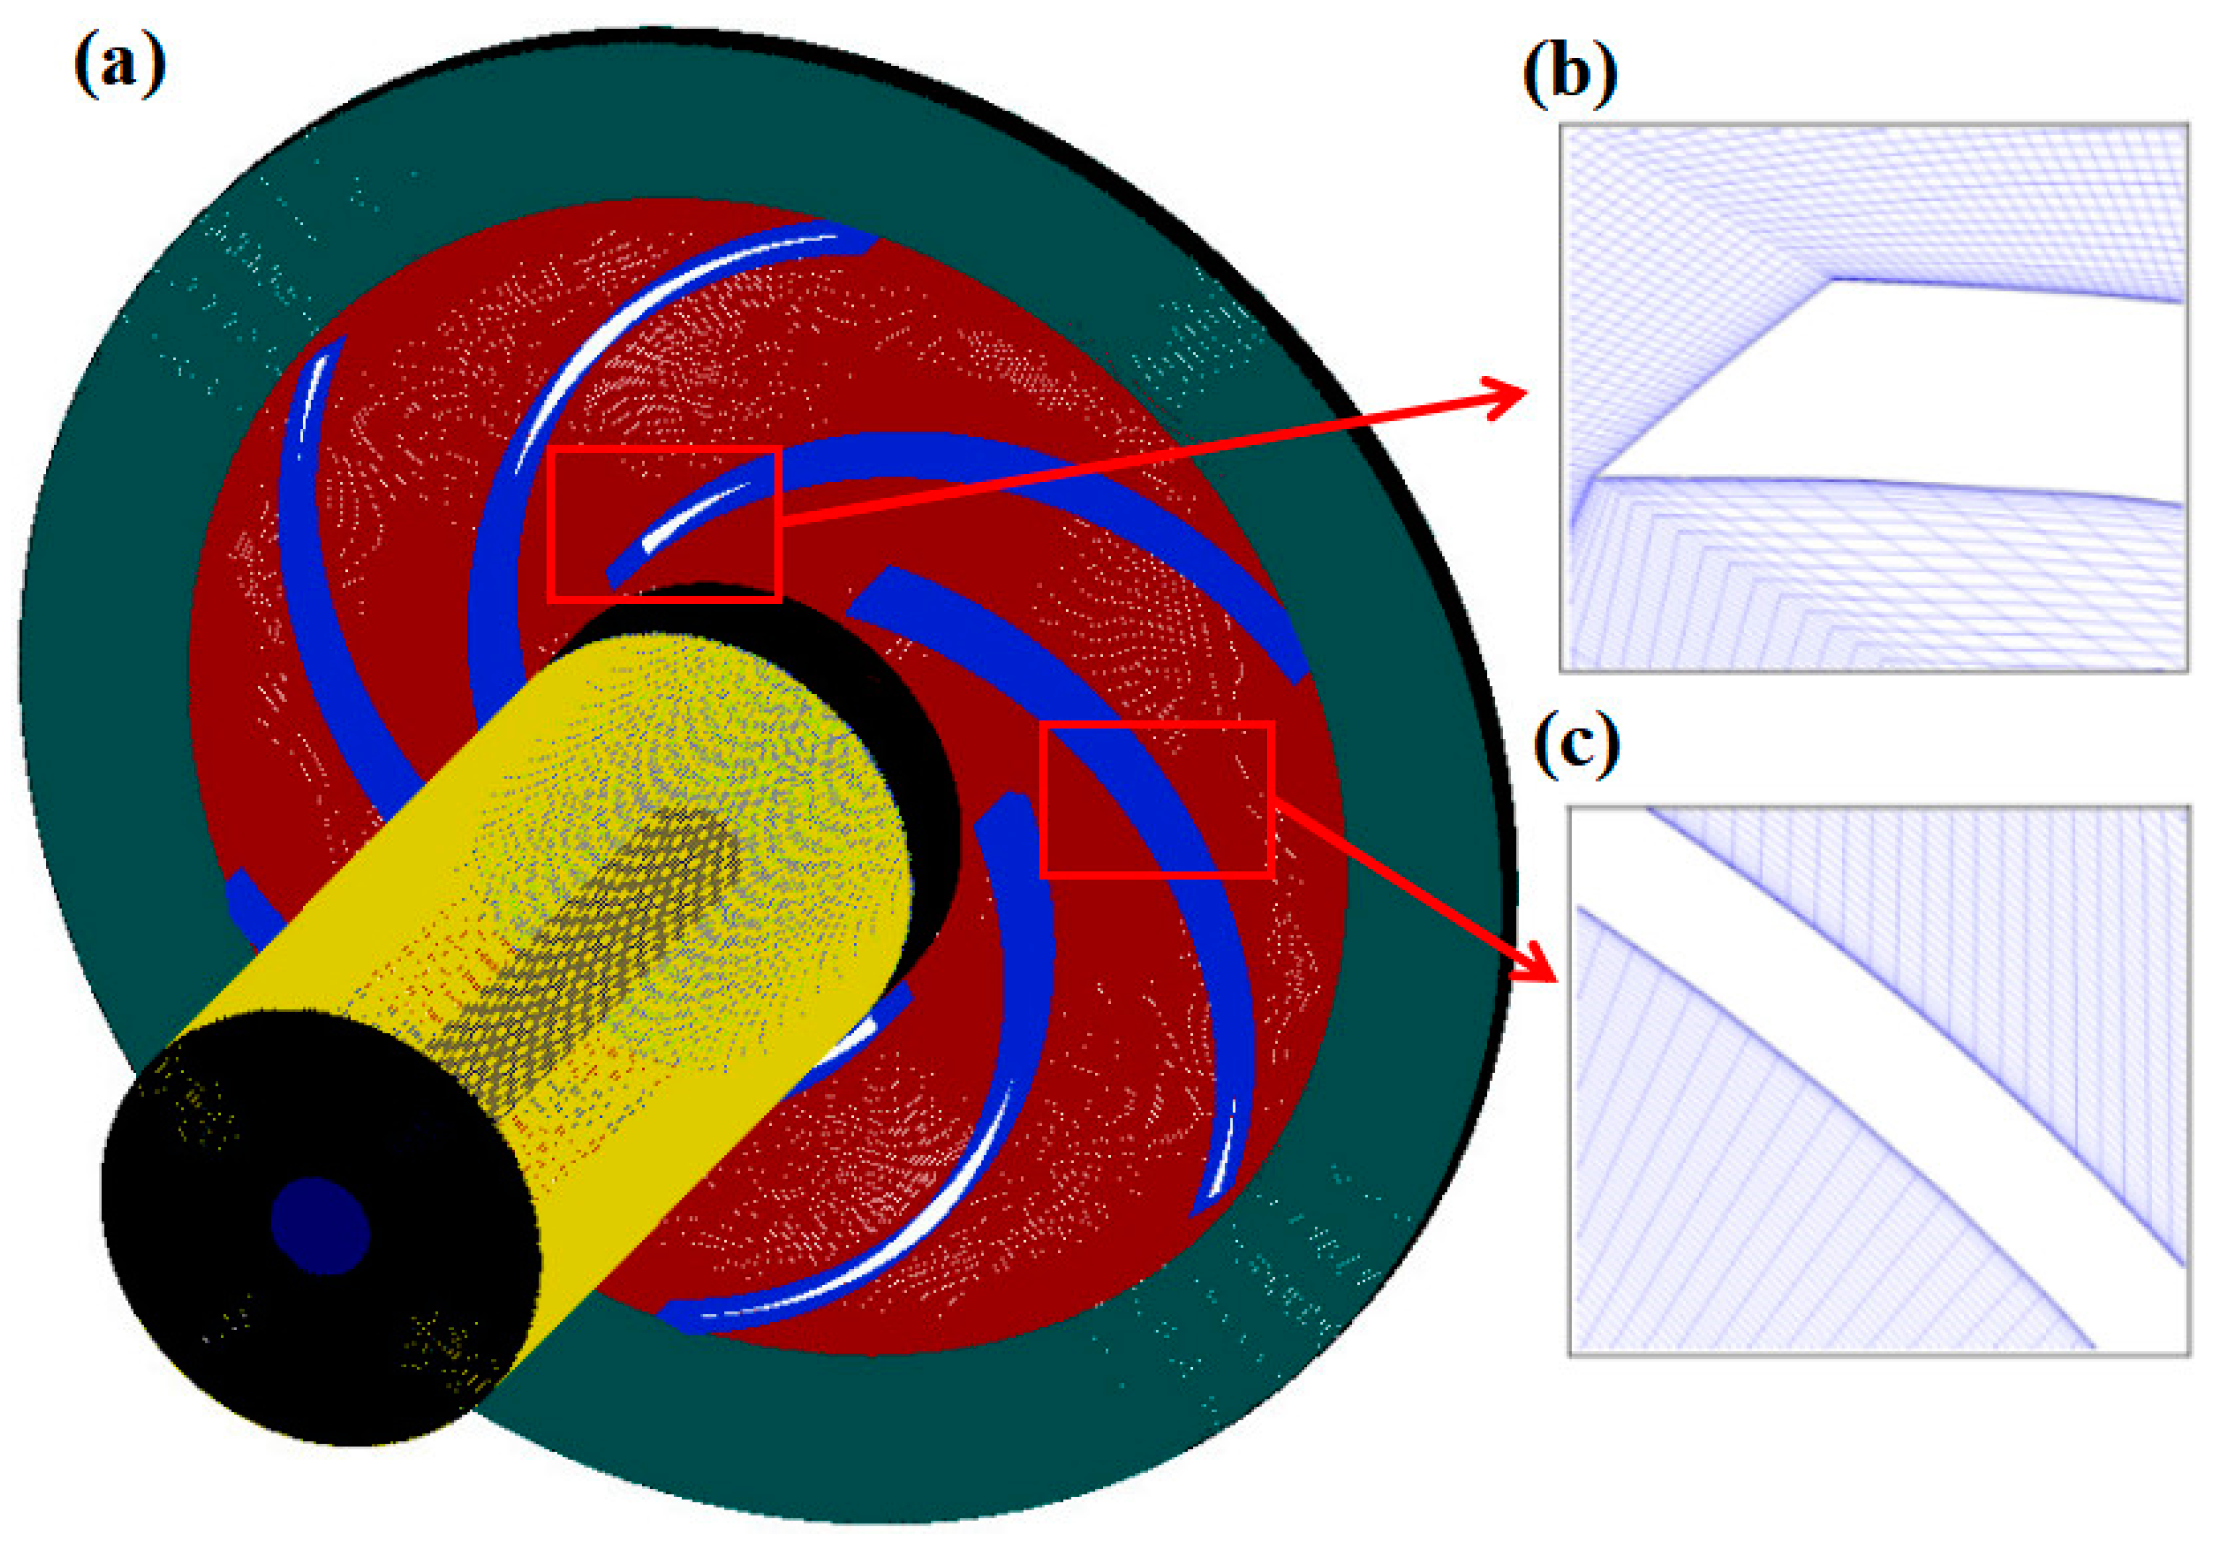
ANSYS ICEM 18.0 was employed to discretize the computational domain into structured grids, with a finer mesh specifically applied to the near-wall regions that exhibit significant pressure and velocity gradients. Figure 2 illustrates the grid layout for the centrifugal pump impeller. The total cell count for the centrifugal pump impeller system amounts to 11 million, comprising 7.67 million cells for the impeller, 2.55 million for the inlet pipeline, and 0.78 million for the outlet pipeline.
The simulations were conducted using ANSYS CFX 20.0, with consistent boundary conditions applied across the centrifugal pump impeller. The finite volume method was employed to resolve the system, utilizing the SIMPLE algorithm for the coupling of velocity and pressure. High-resolution techniques were implemented to enhance the overall accuracy, while the second-order backward Euler method was applied to address the unsteady components. For the transient calculations, a transient rotor–stator interface was utilized. At the inlet duct, a velocity boundary condition was enforced, while a Neumann boundary condition was chosen for the outlet regarding velocity, with pressure specified at the outlet. All walls were subject to defined boundary conditions of no-slip and zero penetration velocity. The time step is set at Δt = 2.3 × 10⁻⁴ s, with a sampling frequency of 4.35 kHz, ensuring that the accuracy requirements for subsequent data analysis are met. The absolute residual criterion is defined as 10−6, ensuring a high level of convergence accuracy. As several experimental measurements and numerical simulations have already been reported for quasi-steady conditions, data verification is based on these conditions. The specific validation results of the numerical simulations are detailed in previous articles, particularly in the studies by Kuang et al. [30].

2.4. Flow Rate Conditions

Numerical simulations are performed under both quasi-steady and transient conditions. Firstly, under quasi-steady conditions, three flow rates (0.25Qd, 0.5Qd, and 0.75Qd) are selected to analyze. The transient conditions are considered to be a sinusoidal flow rate with an initial phase in the present study, whose mathematical expression is as follows:
Q = 0.5 Q d + A sin ( π n 3 t )
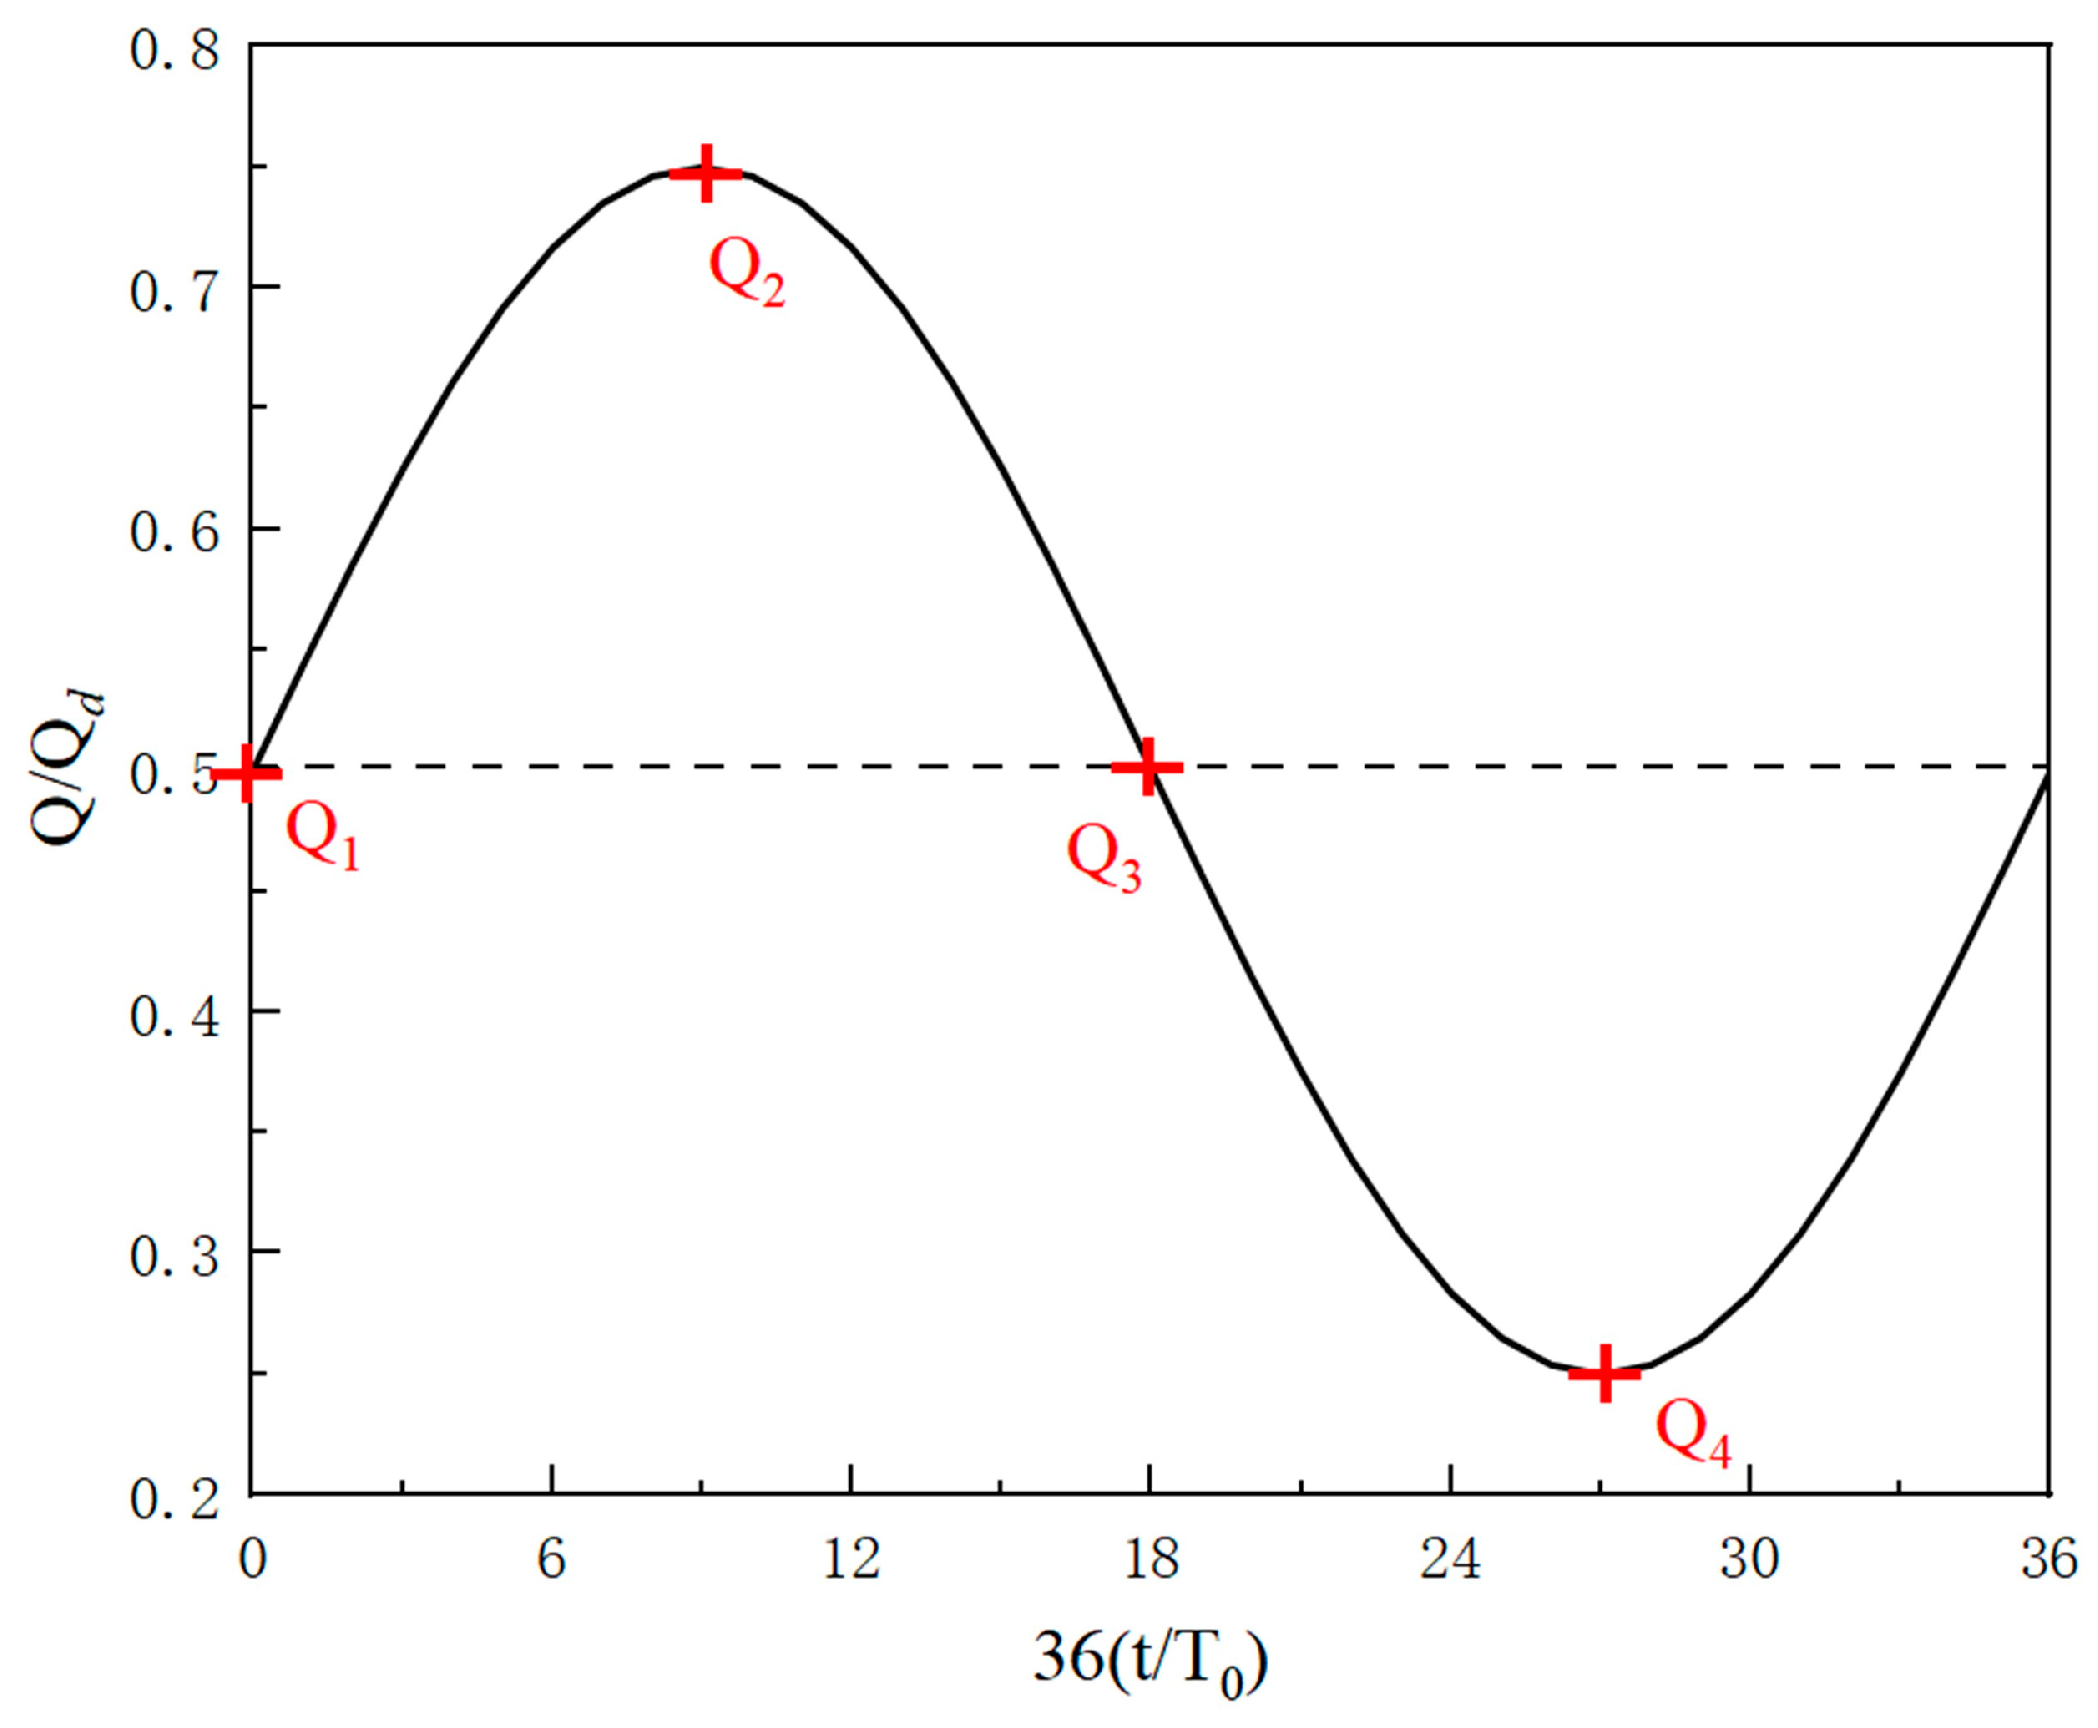
where 0.5Qd is the equilibrium flow rate. The frequency in an oscillation period is n/6. The oscillation amplitudes A for the five different schemes are set to 0.1Qd, 0.15Qd, 0.2Qd, 0.25Qd, and 0.3Qd, respectively. Additionally, the duration of each cycle for the inlet boundary conditions across all schemes is standardized to span six complete rotations of the impeller. When the oscillation amplitude is 0.25Qd, respectively, the relationship between the flow rate and time is as shown in Figure 3. Under transient conditions, four instantaneous flow conditions were selected: Q2 represents the maximum flow of 0.75Qd, Q4 represents the minimum flow of 0.25Qd, and Q1 and Q3 represent 0.5Qd during the rising and dropping stage, respectively.

3. Introduction and Validation of the Novel Approach

3.1. Detailed Approach Descriptions

Alternating stall is a common phenomenon in centrifugal pump impellers with even blades at low flow rates. During alternating stall, there is a significant difference in the low-pressure zones of adjacent passages. Such a phenomenon can be used to intuitively predict alternating stall, but its accuracy is relatively weak.
The low-pressure zone refers to a static pressure region with a pressure value of less than a certain critical value. It can be better reflected by the pressure coefficient, which is defined as follows:
C p = p p 2 0 . 5 ρ u 2 2
The subscript “2” indicates an impeller outlet condition. The low-pressure zone is observed in the geometric model of the present study under quasi-steady conditions at 0.25Qd, as shown in Figure 4.
A novel parameter, called the low-pressure ratio, is proposed to quantitatively predict the alternating stall. The parameter is expressed as follows:
C S = S a S b 1 2 ( S a + S b ) + ε
where S is the area of the low-pressure zone, and ε is a small positive number used to avoid division by zero, which is suggested to be 10ࢤ6. A value of 0.0 indicates that Sa equals Sb, and all other values indicate that Sa is larger than Sb. Moreover, Cs ≥ 2/3, which indicates that Sa is at least twice Sb, is adopted to show that the impeller is in a stall state.
The steps used to obtain the Cs based on numerical results are as follows:
Step 1: The pressure coefficient is calculated using Equation (20). The region in which the pressure coefficient is less than −0.75 is considered the low-pressure zone. The low-pressure zone is obtained for each impeller passage.
Step 2: The Cs is calculated using Equation (21). The number of Cs is equal to the number of impeller blades.
Step 3: The six values are averaged to obtain the instantaneous coefficient.
It should be noted that, when analyzing unsteady numerical results, the ensemble average should also be considered.

3.2. Approach Validation Under Quasi-Steady Conditions

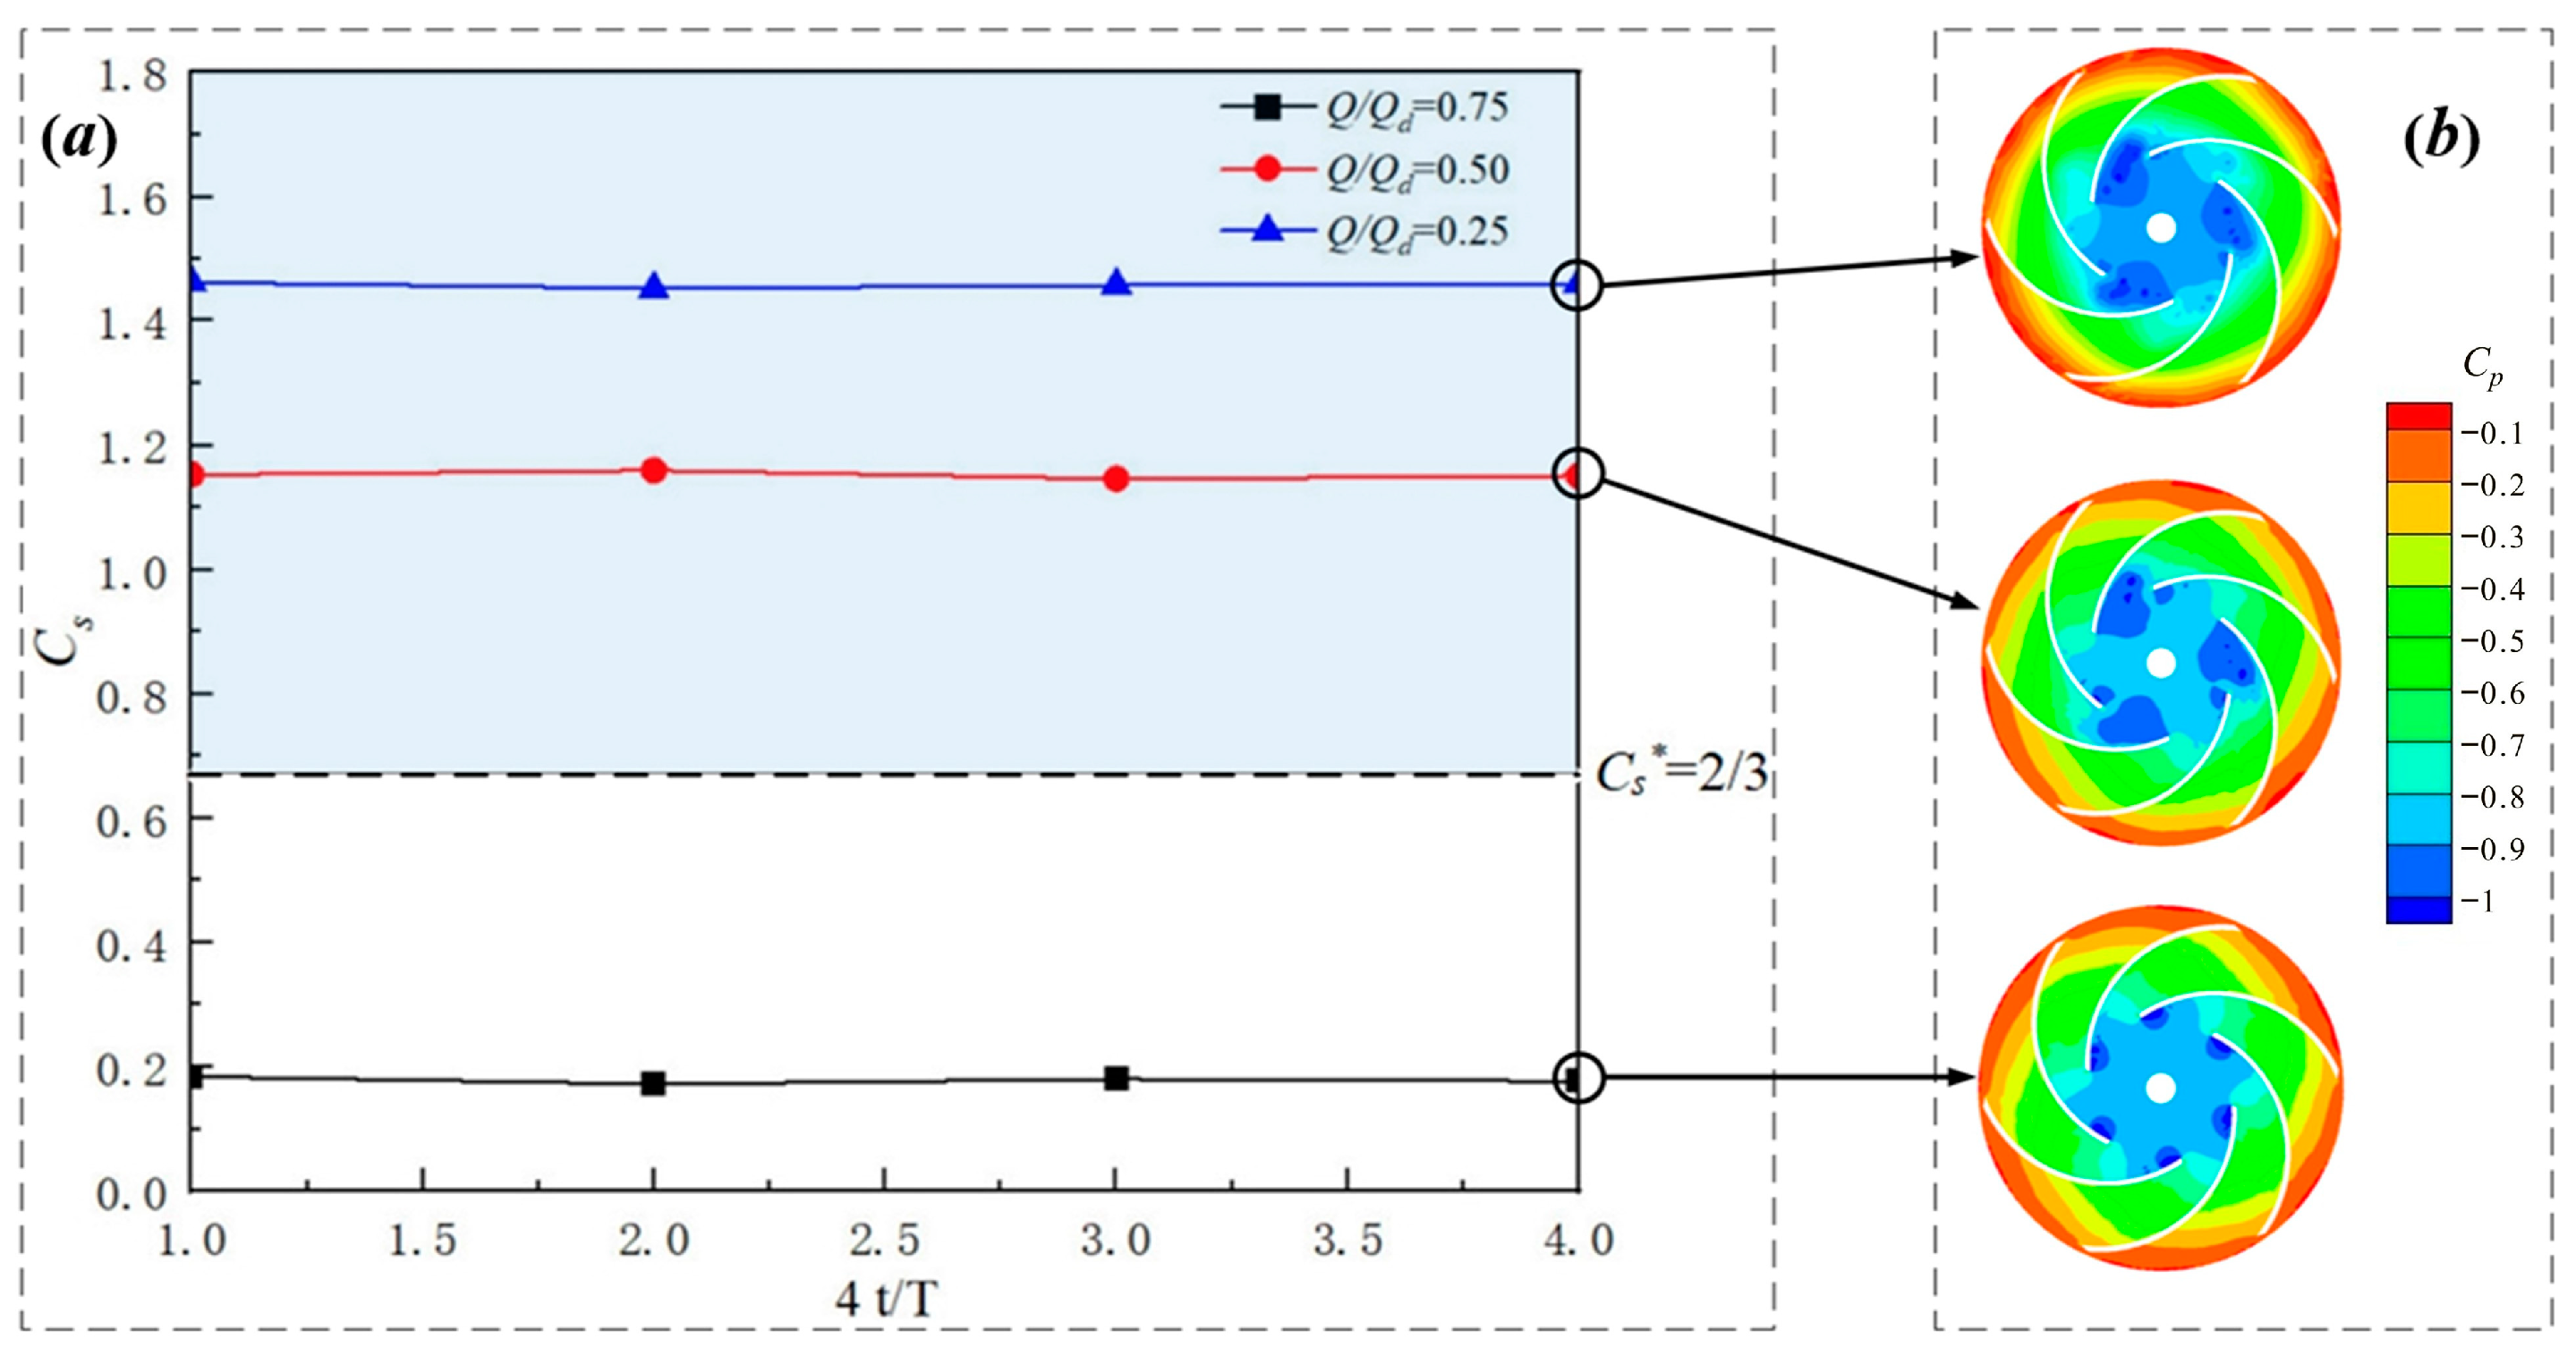
Figure 5a shows that the Cs is obviously affected by the flow rate. The Cs is approximately 0.18 at 0.75Qd, which is smaller than 2/3. This indicates that the impeller is in the non-stall state. However, the Cs is approximately 1.47 at 0.25Qd and 1.15 at 0.5Qd, which means that the impeller is in the stall state.
The stall and non-stall states can also be investigated through the distributions of the pressure coefficient in the impeller mid-height plane (z/b2 = 0.5), as shown in Figure 5b. It is shown that a low-pressure zone can be observed in the suction front edge of the impeller passages for all flow rates. When the flow rate is 0.25Qd or 0.5Qd, there is a significant difference in the low-pressure zones of adjacent passages. These differences are not obvious when the flow rate is 0.75Qd. A similar conclusion was reached by Zhou et al. [29].
Although the distributions of the low-pressure zones have a certain relationship with the rotational time, Cs is relatively insensitive to the rotational time, as shown in Figure 6. The fluctuation difference of the Cs at different rotational times is within 3.2%. Therefore, the accuracy of this novel approach is very high under quasi-steady conditions.

4. Application of the Novel Approach to Transient Conditions

4.1. Determination of the Critical Alternating Stall

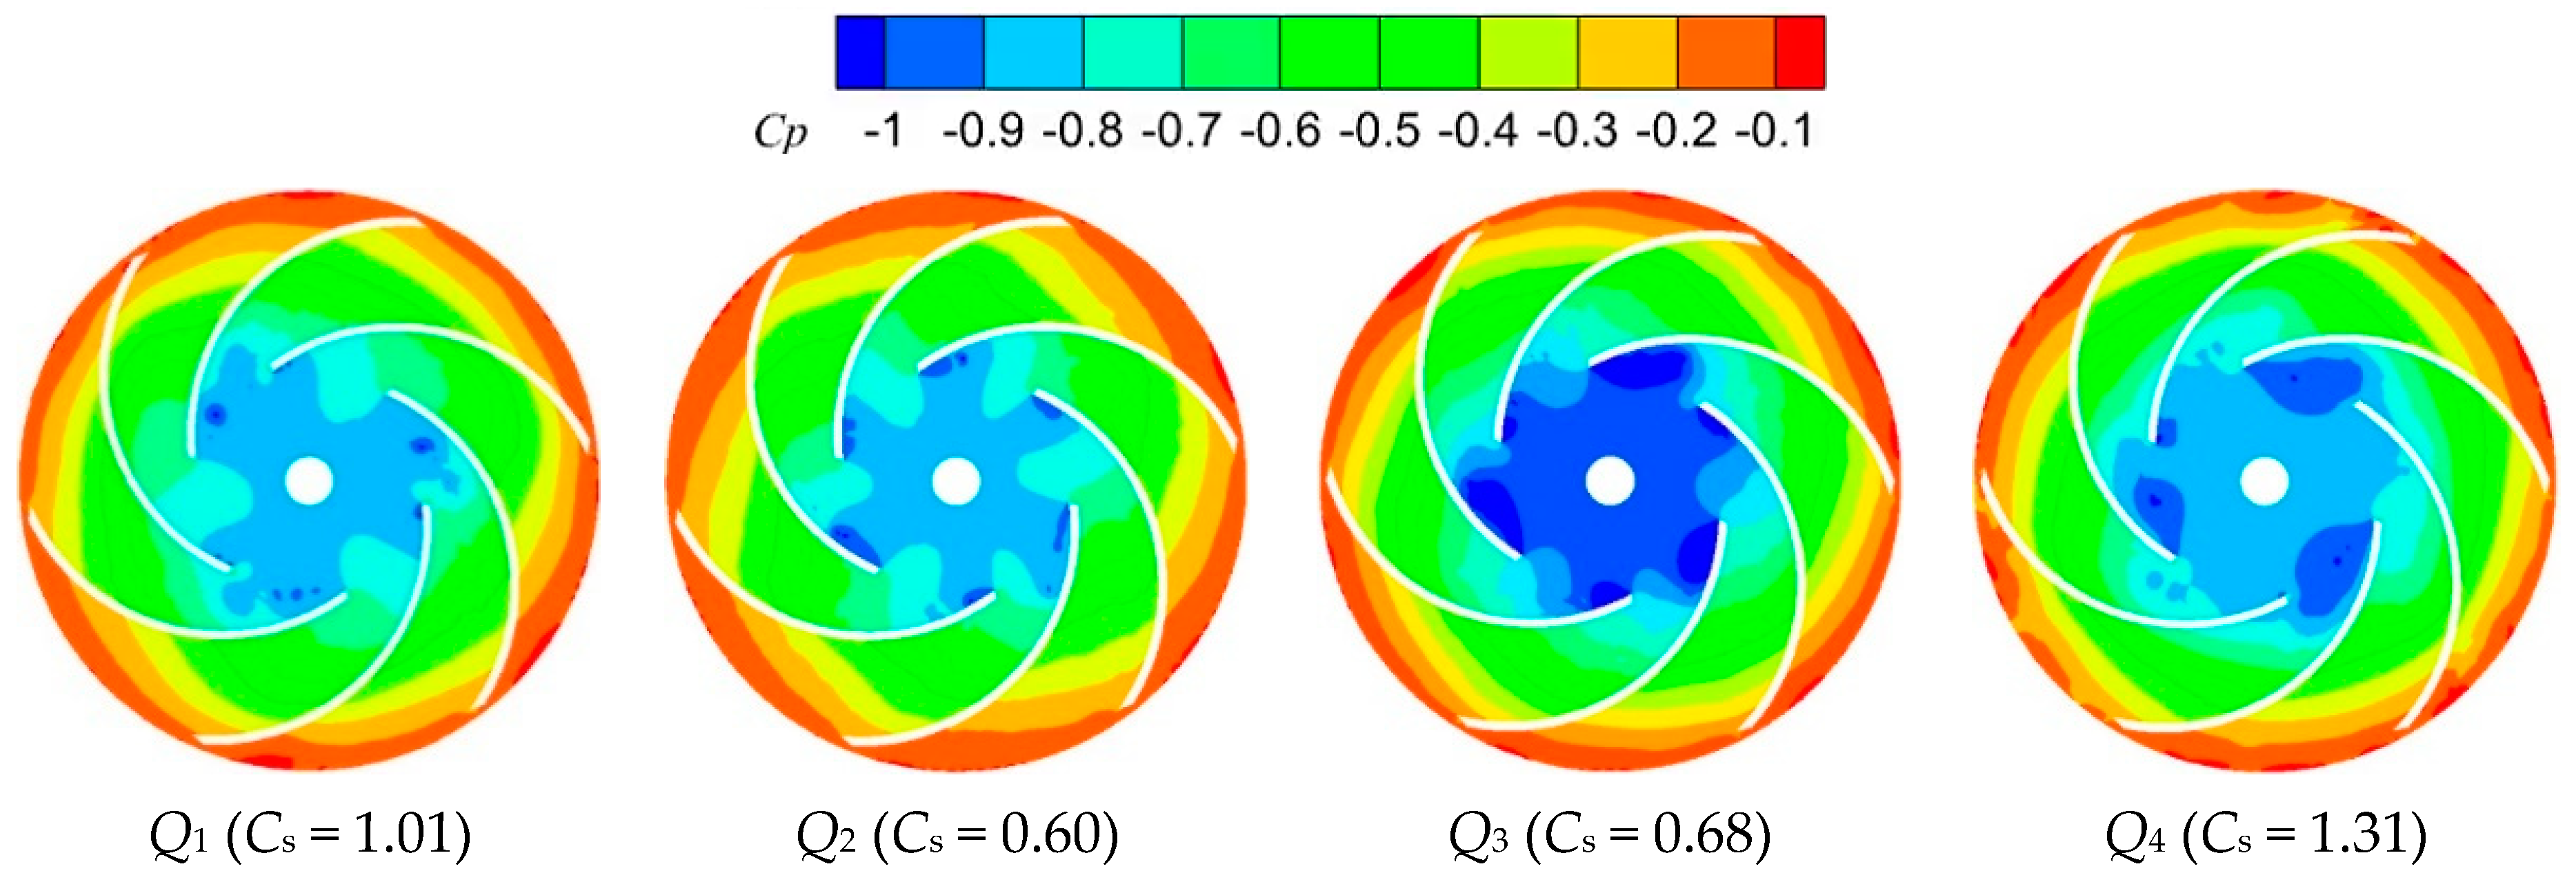
Figure 7 shows the distributions of the pressure coefficient at four instantaneous flow rates—the maximum (Q2), minimum (Q4), and equilibrium (Q1 and Q3) flow rates. The low-pressure zones of adjacent passages are similar and different at the instantaneous flow rates of 0.75Qd and 0.25Qd, respectively. For the instantaneous flow rate of 0.5Qd, the low-pressure zones of adjacent passages vary during the rising and dropping stages. These phenomena cause Cs to deviate significantly from the corresponding flow rates under quasi-steady conditions. For example, the Cs during the rising and dropping stages are 1.01 and 0.68 for the instantaneous flow rate of 0.5Qd, respectively.
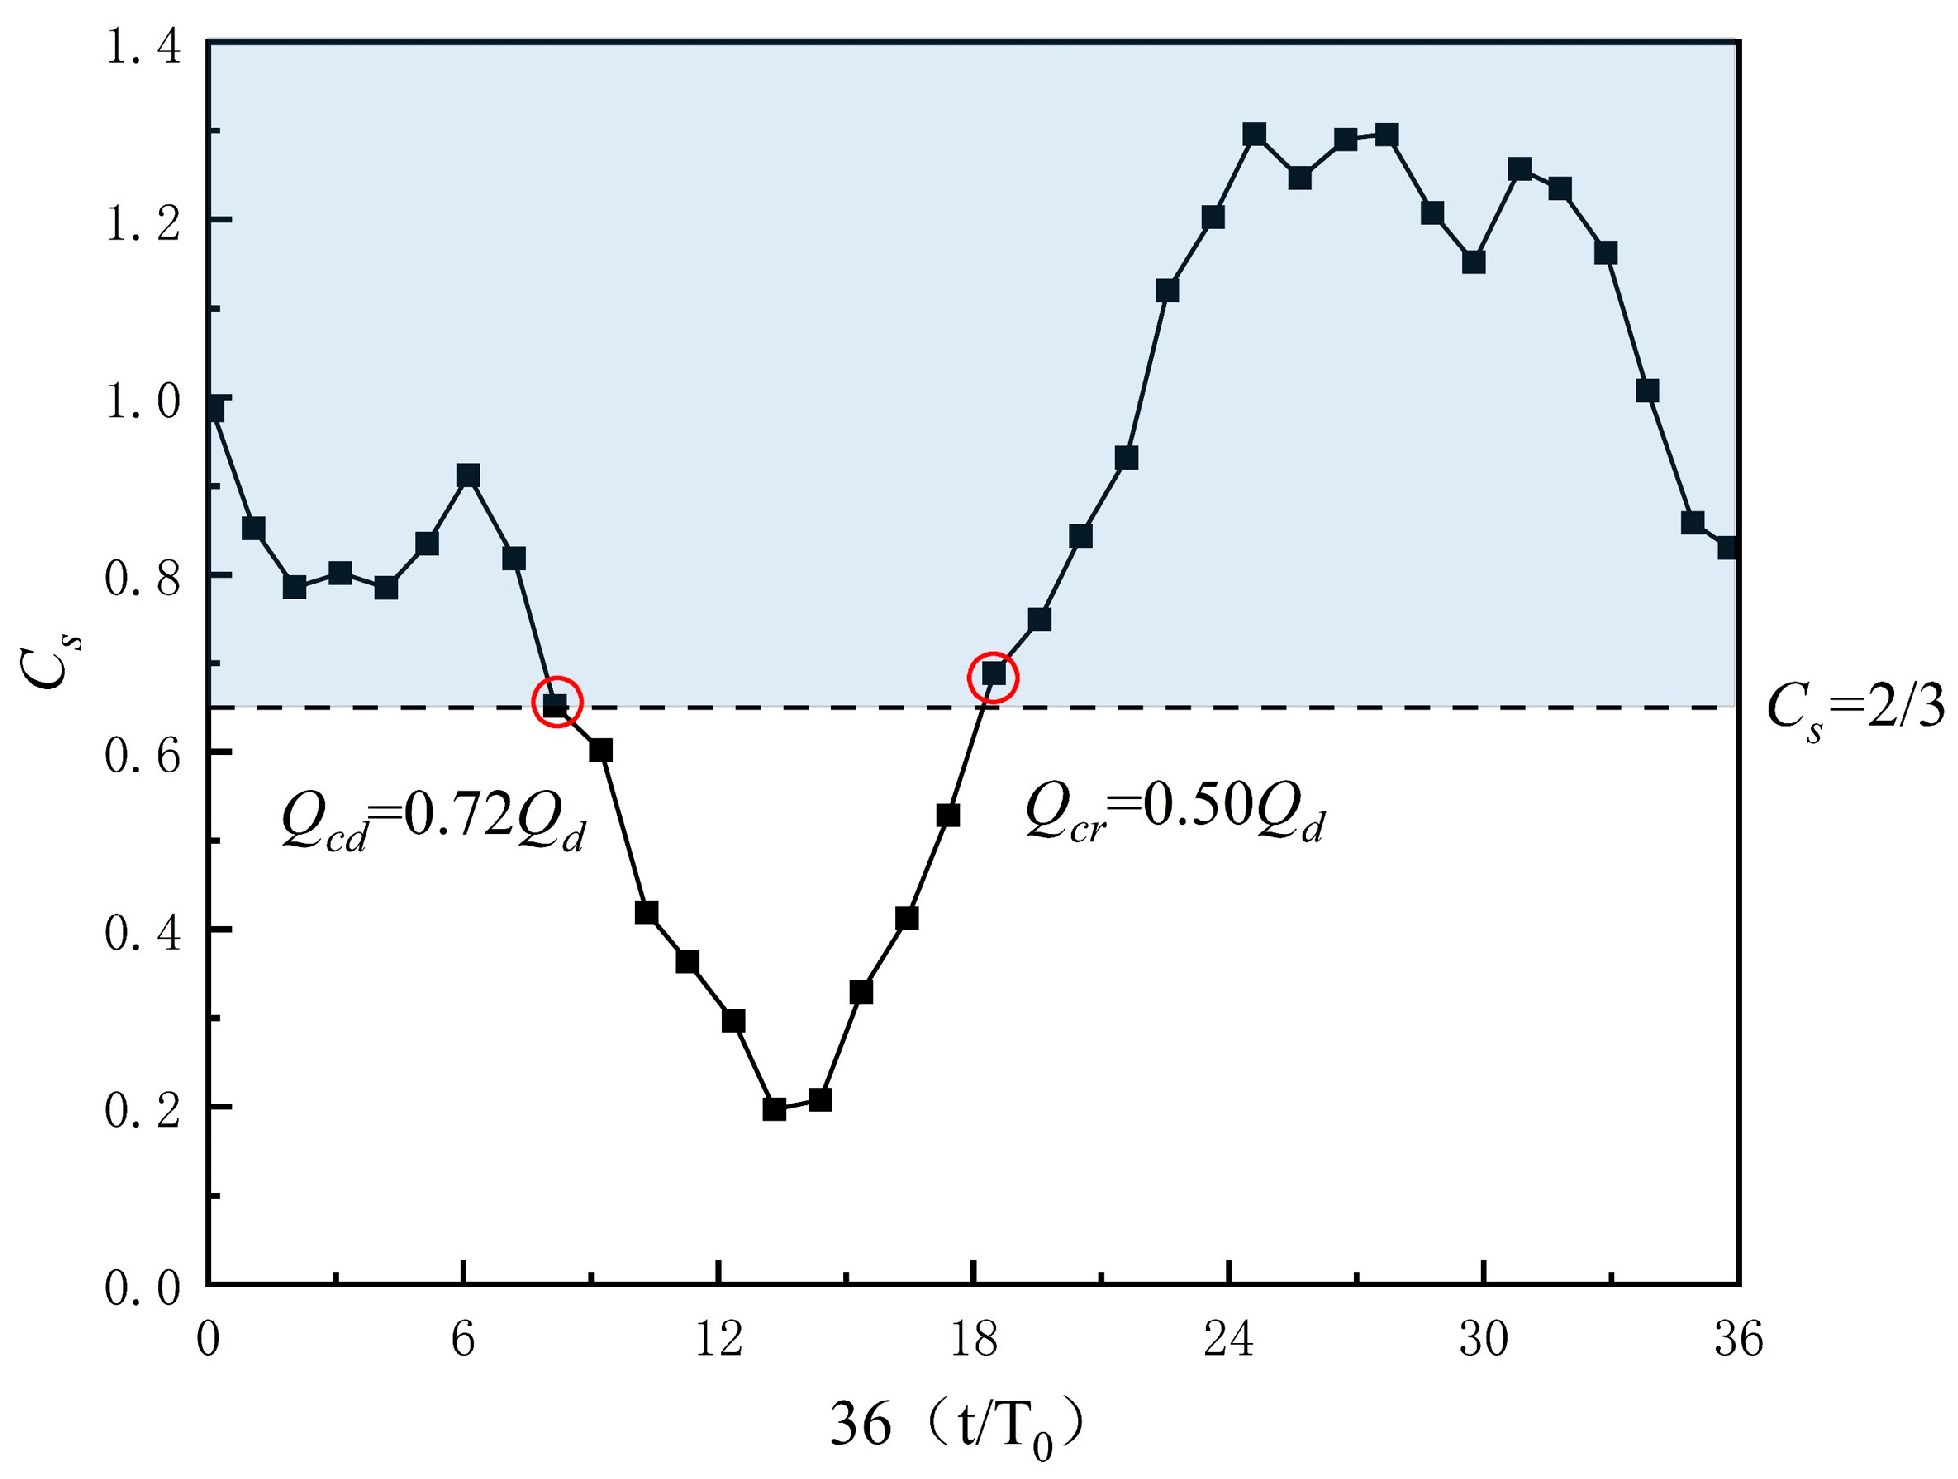
To further investigate the evolution of Cs with the rotational time, thirty-six instantaneous times are chosen in an oscillation period. Two adjacent instantaneous times are separated by 0.0138 s, corresponding to a blade rotation of 60 degrees. The frequency of the low-pressure ratio is equal to the frequency of the flow rate, which is approximately 2 Hz. Figure 8 shows that Cs cannot be represented by a value and that it shows obvious periodicity. The maximum and minimum values are approximately 1.31 and 0.20, respectively, which are smaller and larger than those under the quasi-steady conditions at 0.75Qd and 0.25Qd. The phase of the low-pressure ratio lags behind the flow rate by fifteen thirty-sixths of a period. Moreover, the stall and non-stall states alternate in a transient period of the flow rate. The flow rate corresponding to the CAS during the dropping and rising stages, named Qcd and Qcr, are approximately 0.72Qd and 0.5Qd, respectively.
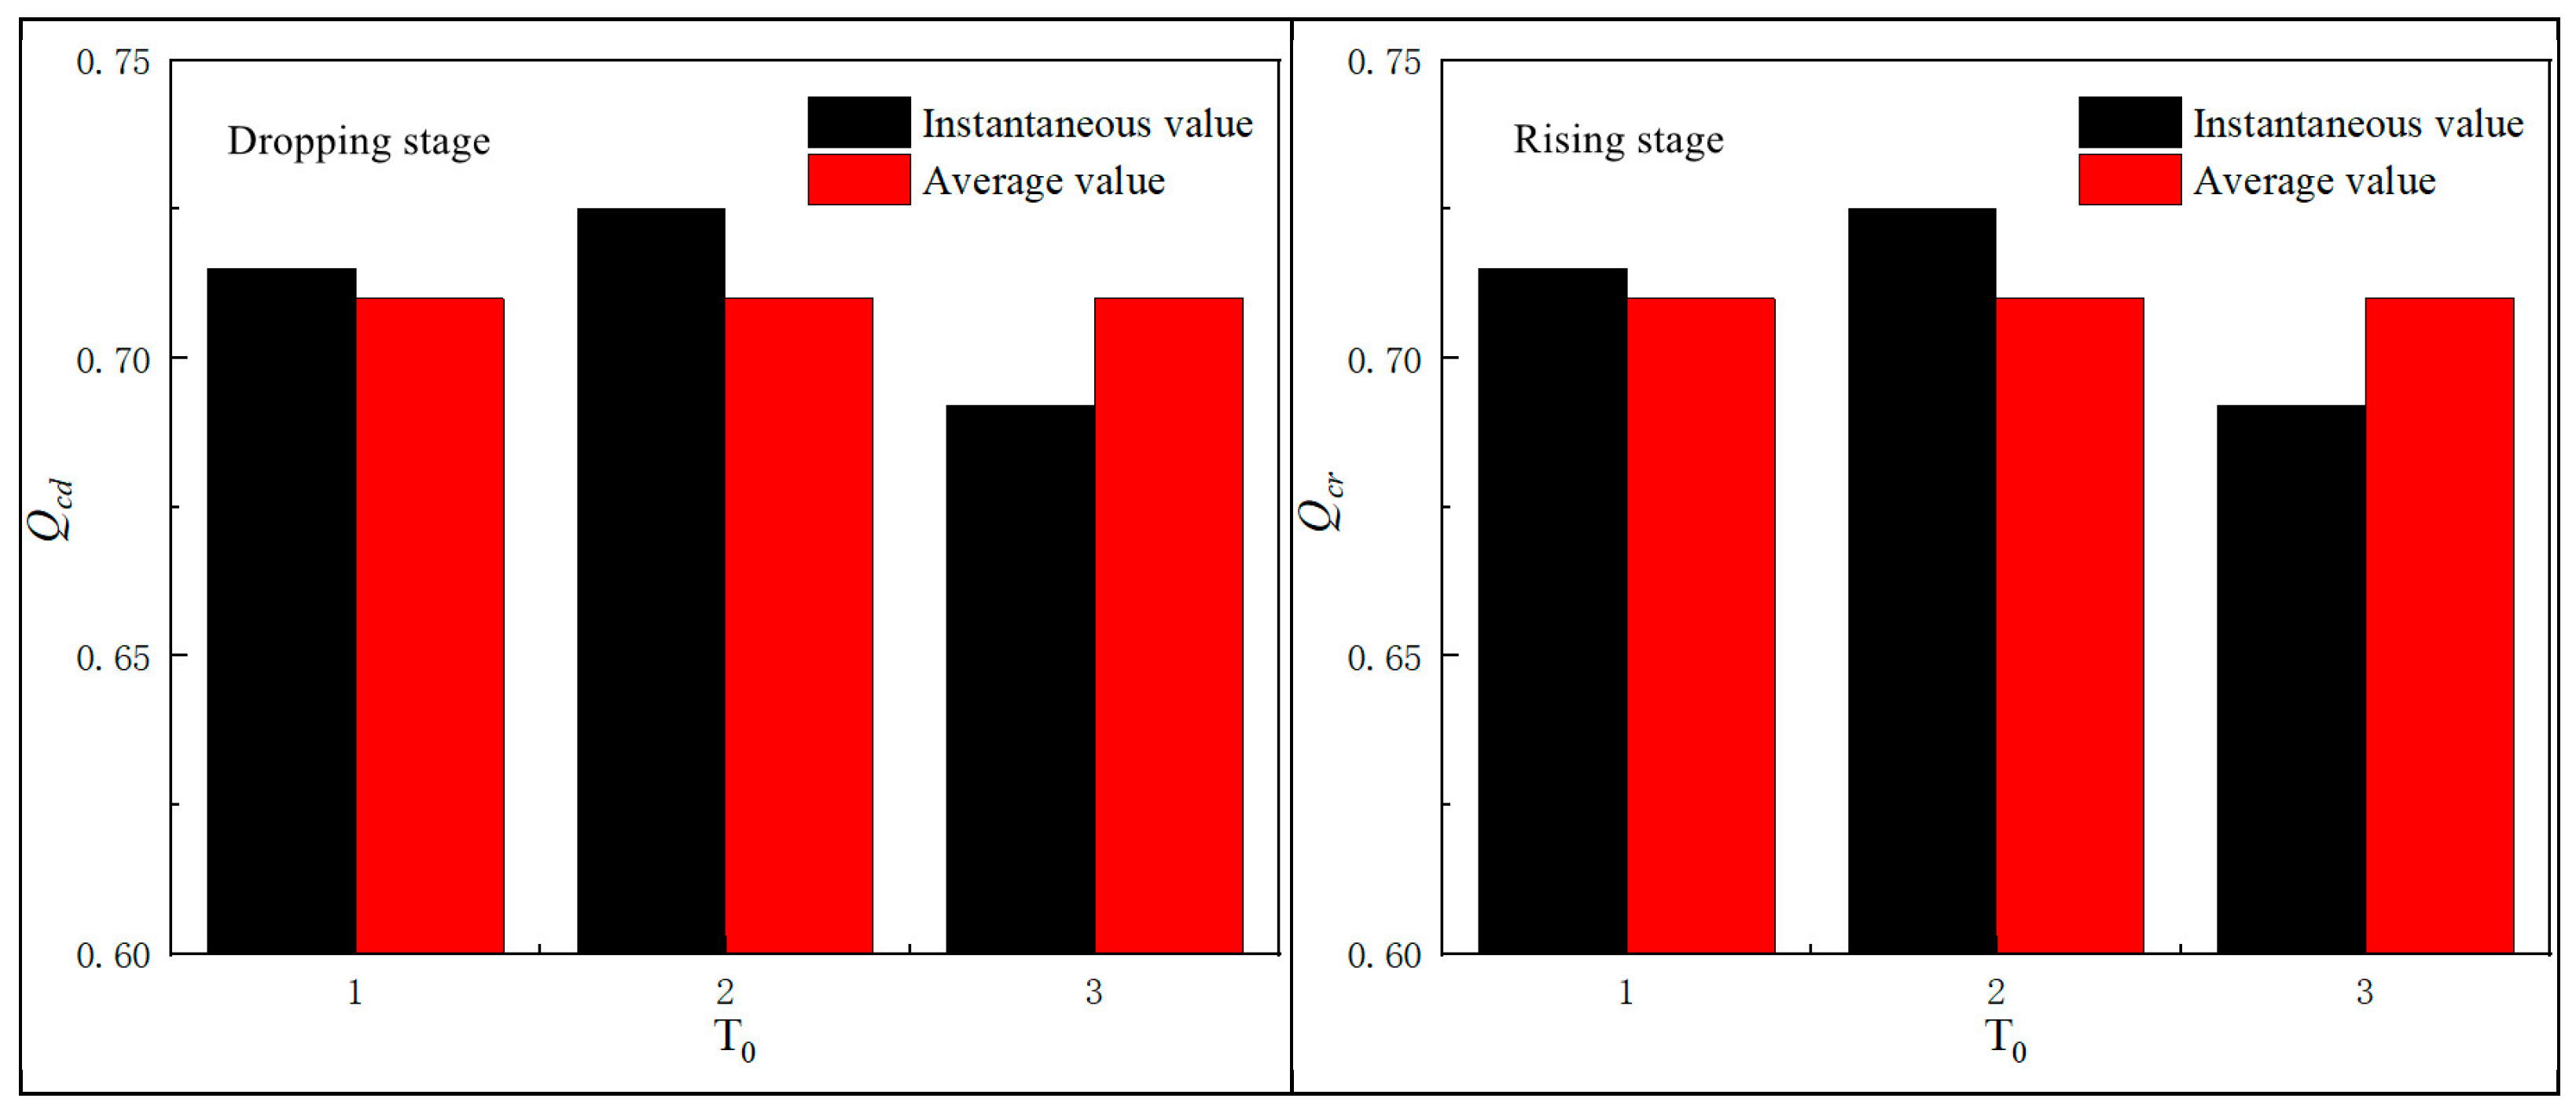
Fluctuating characteristics play an important role in LES results. For a fully developed turbulent flow, the internal flow field exhibits a certain similarity for different flow rate periods. Three oscillation periods are considered in this study, as shown in Figure 9. It can be seen that the mean Qcd and Qcr, respectively, are 0.71Qd and 0.49Qd. Although the fluctuating CAS during the dropping stage is larger than that during the rising stage, it is still within 4%.
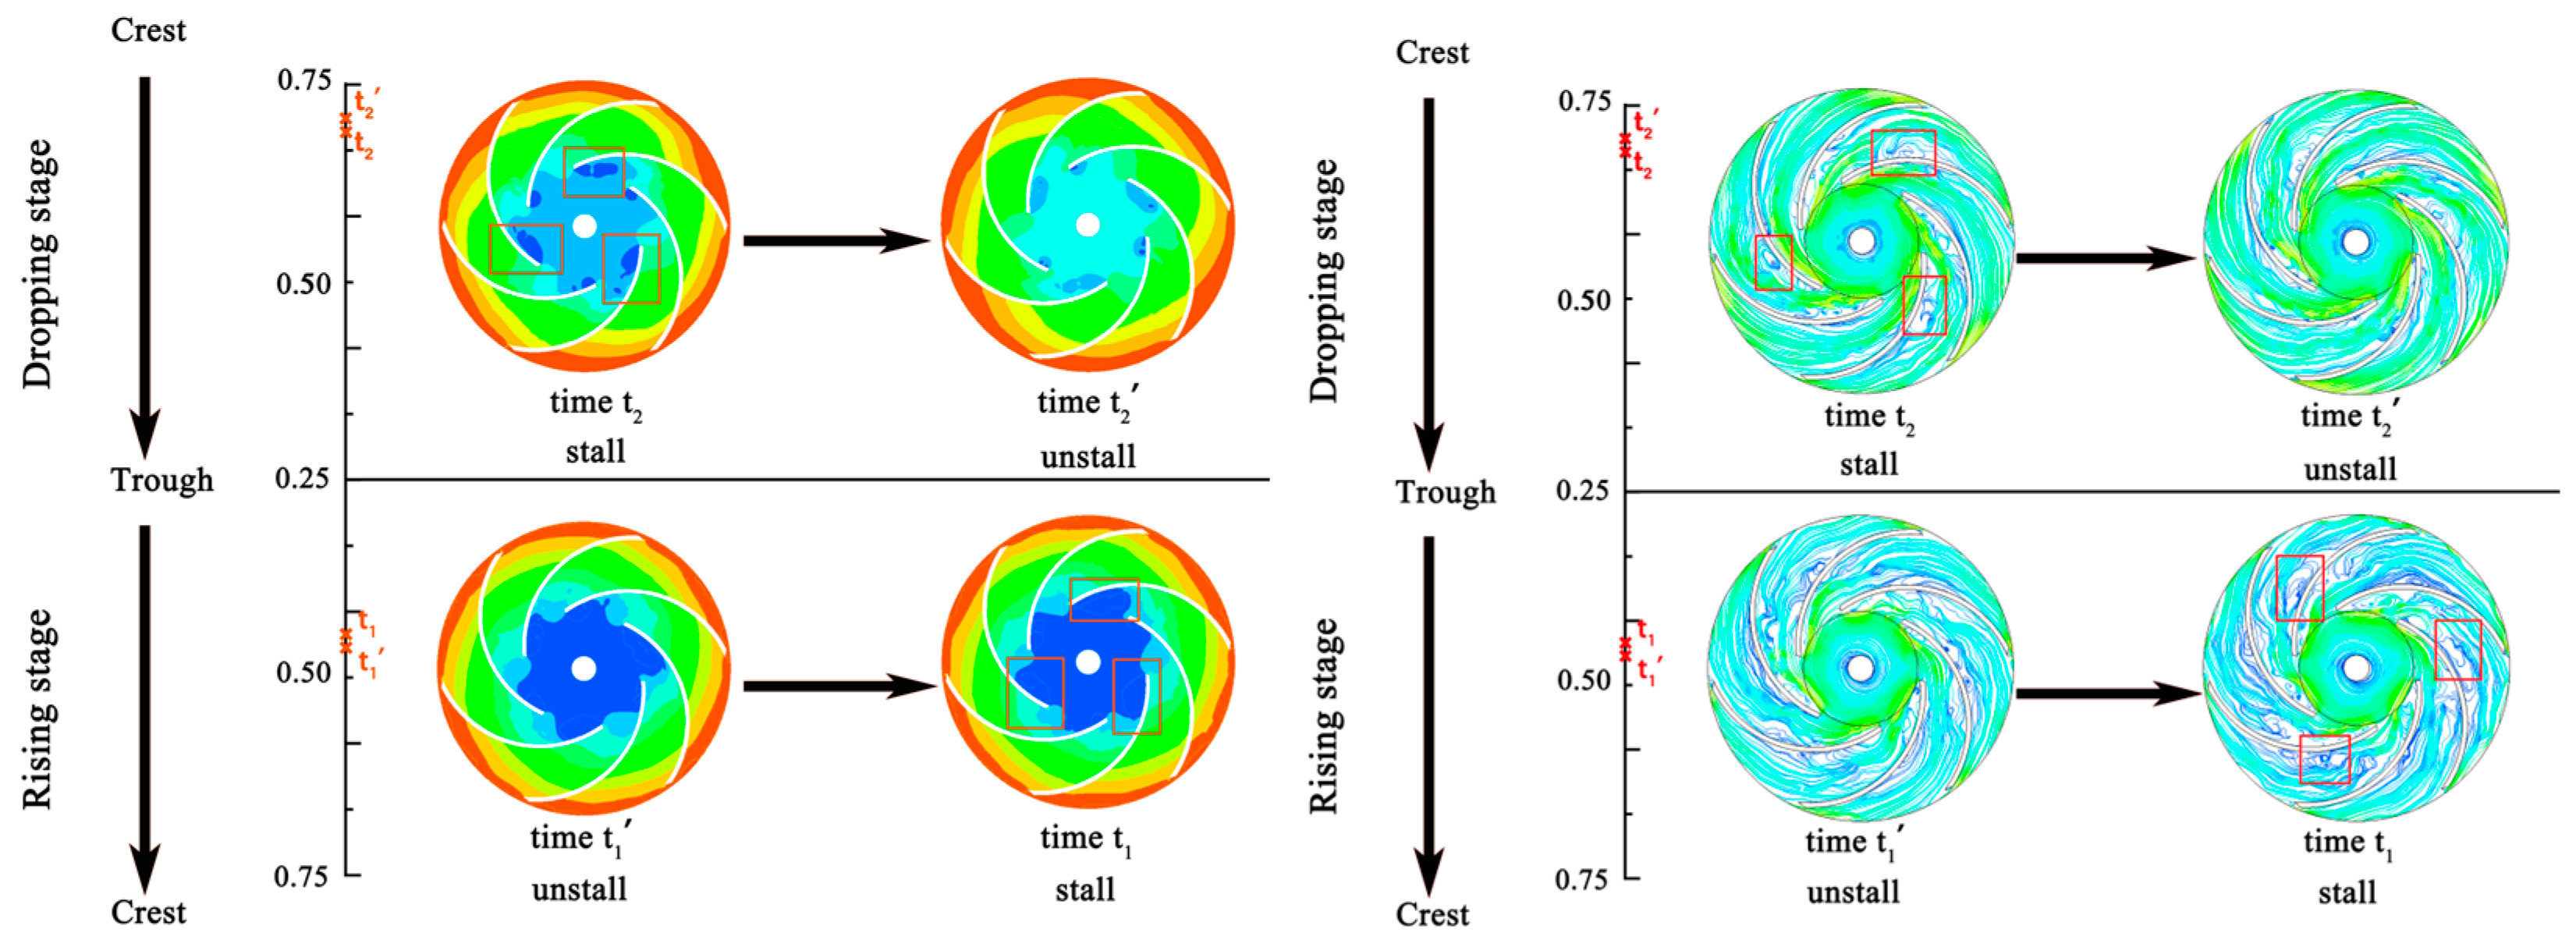
Regardless of whether the instantaneous flow rate equals Qcd or Qcr, a significant double channel phenomenon can be observed in the distributions of the pressure coefficient and streamlines, as shown in Figure 10. However, when the instantaneous flow rate is slightly increased, the double channel phenomenon weakens sharply until it disappears.
It is indicated that the novel approach presented here can be used to quantitatively predict the CAS, which reduces subjective factors compared to using cloud image prediction. Moreover, its deviation is small, the results are accurate, and it is suitable for various conditions.

4.2. Oscillation Amplitude Effects

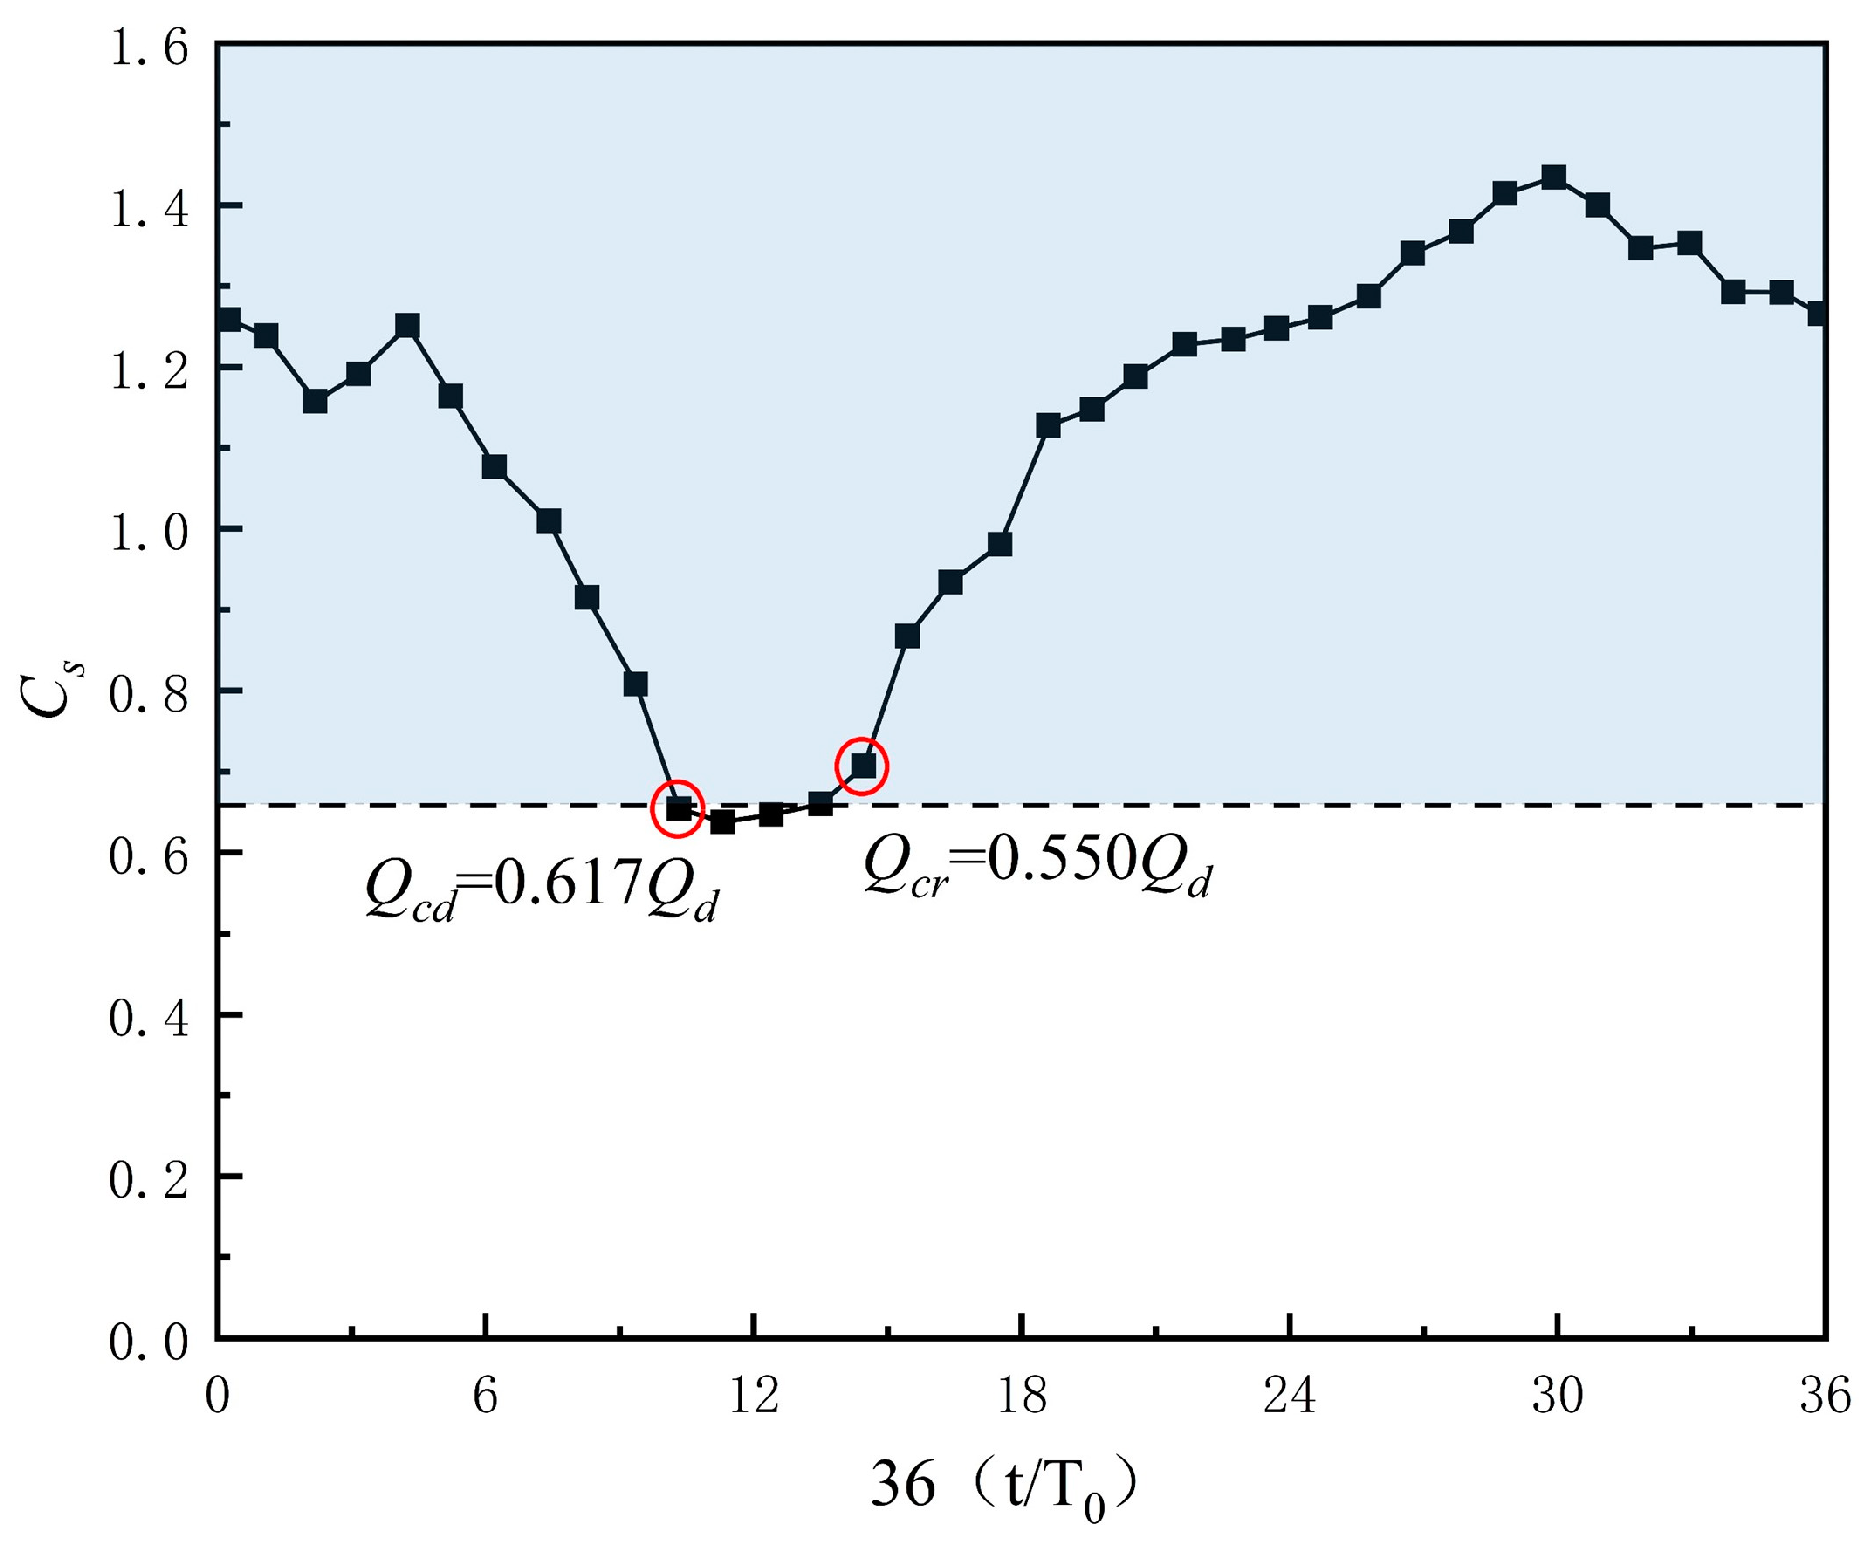
Figure 11 shows the data with an oscillation amplitude of 0.15Qd. A periodic distribution can be observed, which is similar to that for A = 0.25Qd. However, many different characteristics require further investigation. Compared to A = 0.25Qd, the phase lag of the low-pressure ratio is greater when A = 0.15Qd, being twenty-one thirty-sixths of a period.
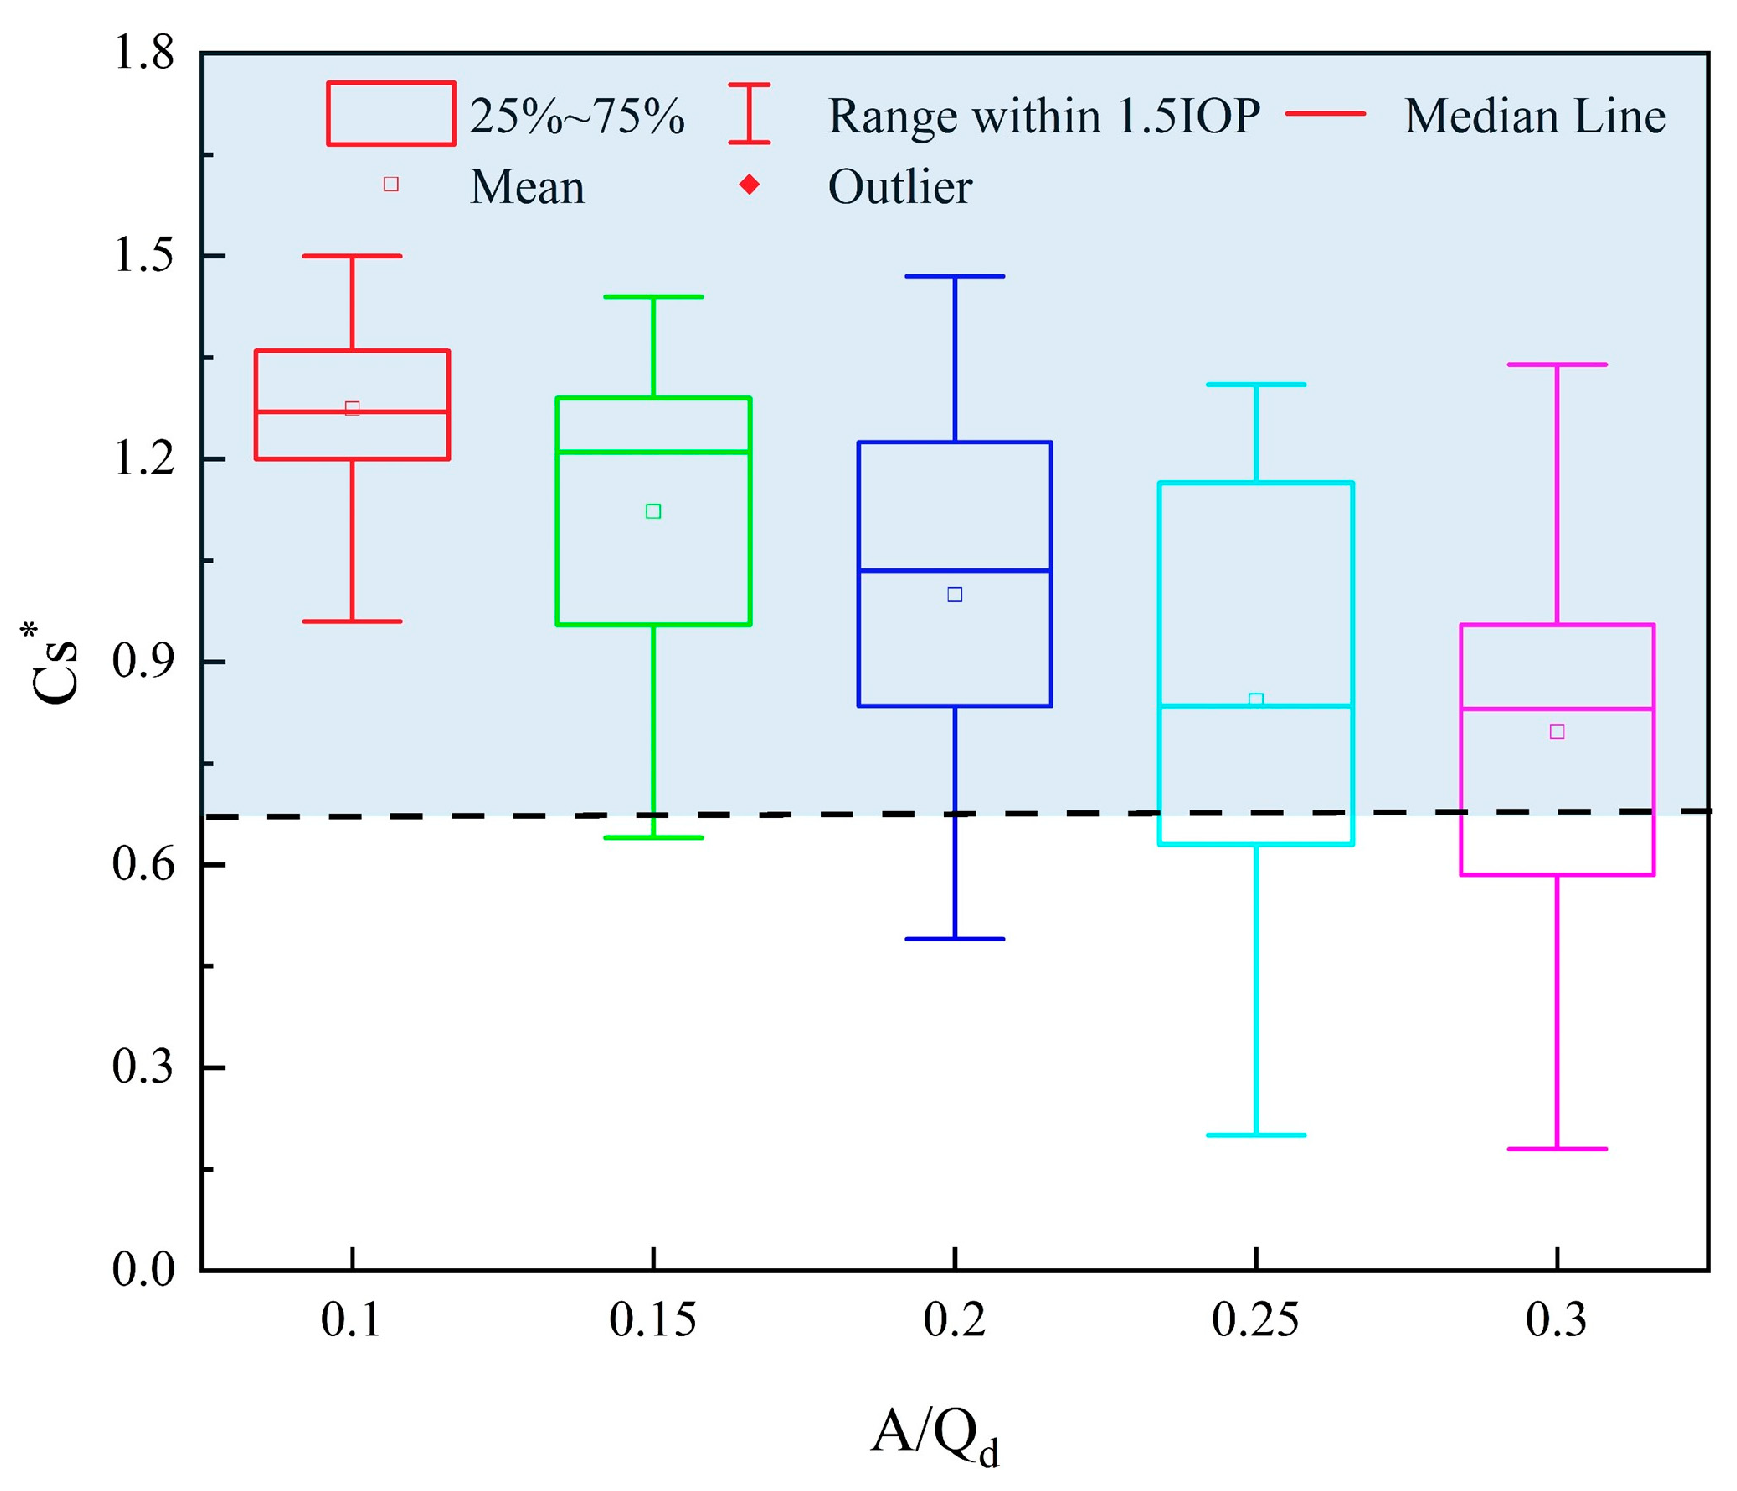
Figure 12 shows that the three characteristics of Cs, including the average, maximum, and minimum values, are all significantly affected by the oscillation amplitude. As the oscillation amplitude increases, the mean and median values, respectively, decrease and increase. The maximum value is larger than 2/3 for all cases. The minimum value is approximately 0.96 for A = 0.1Qd, indicating that the impeller is always in a stall state. The minimum value decreases overall as the oscillation amplitude increases and is smaller than 2/3 for the other four oscillation amplitudes. Therefore, the impeller is not only in the stall state, and part of the period is also in the non-stall state.
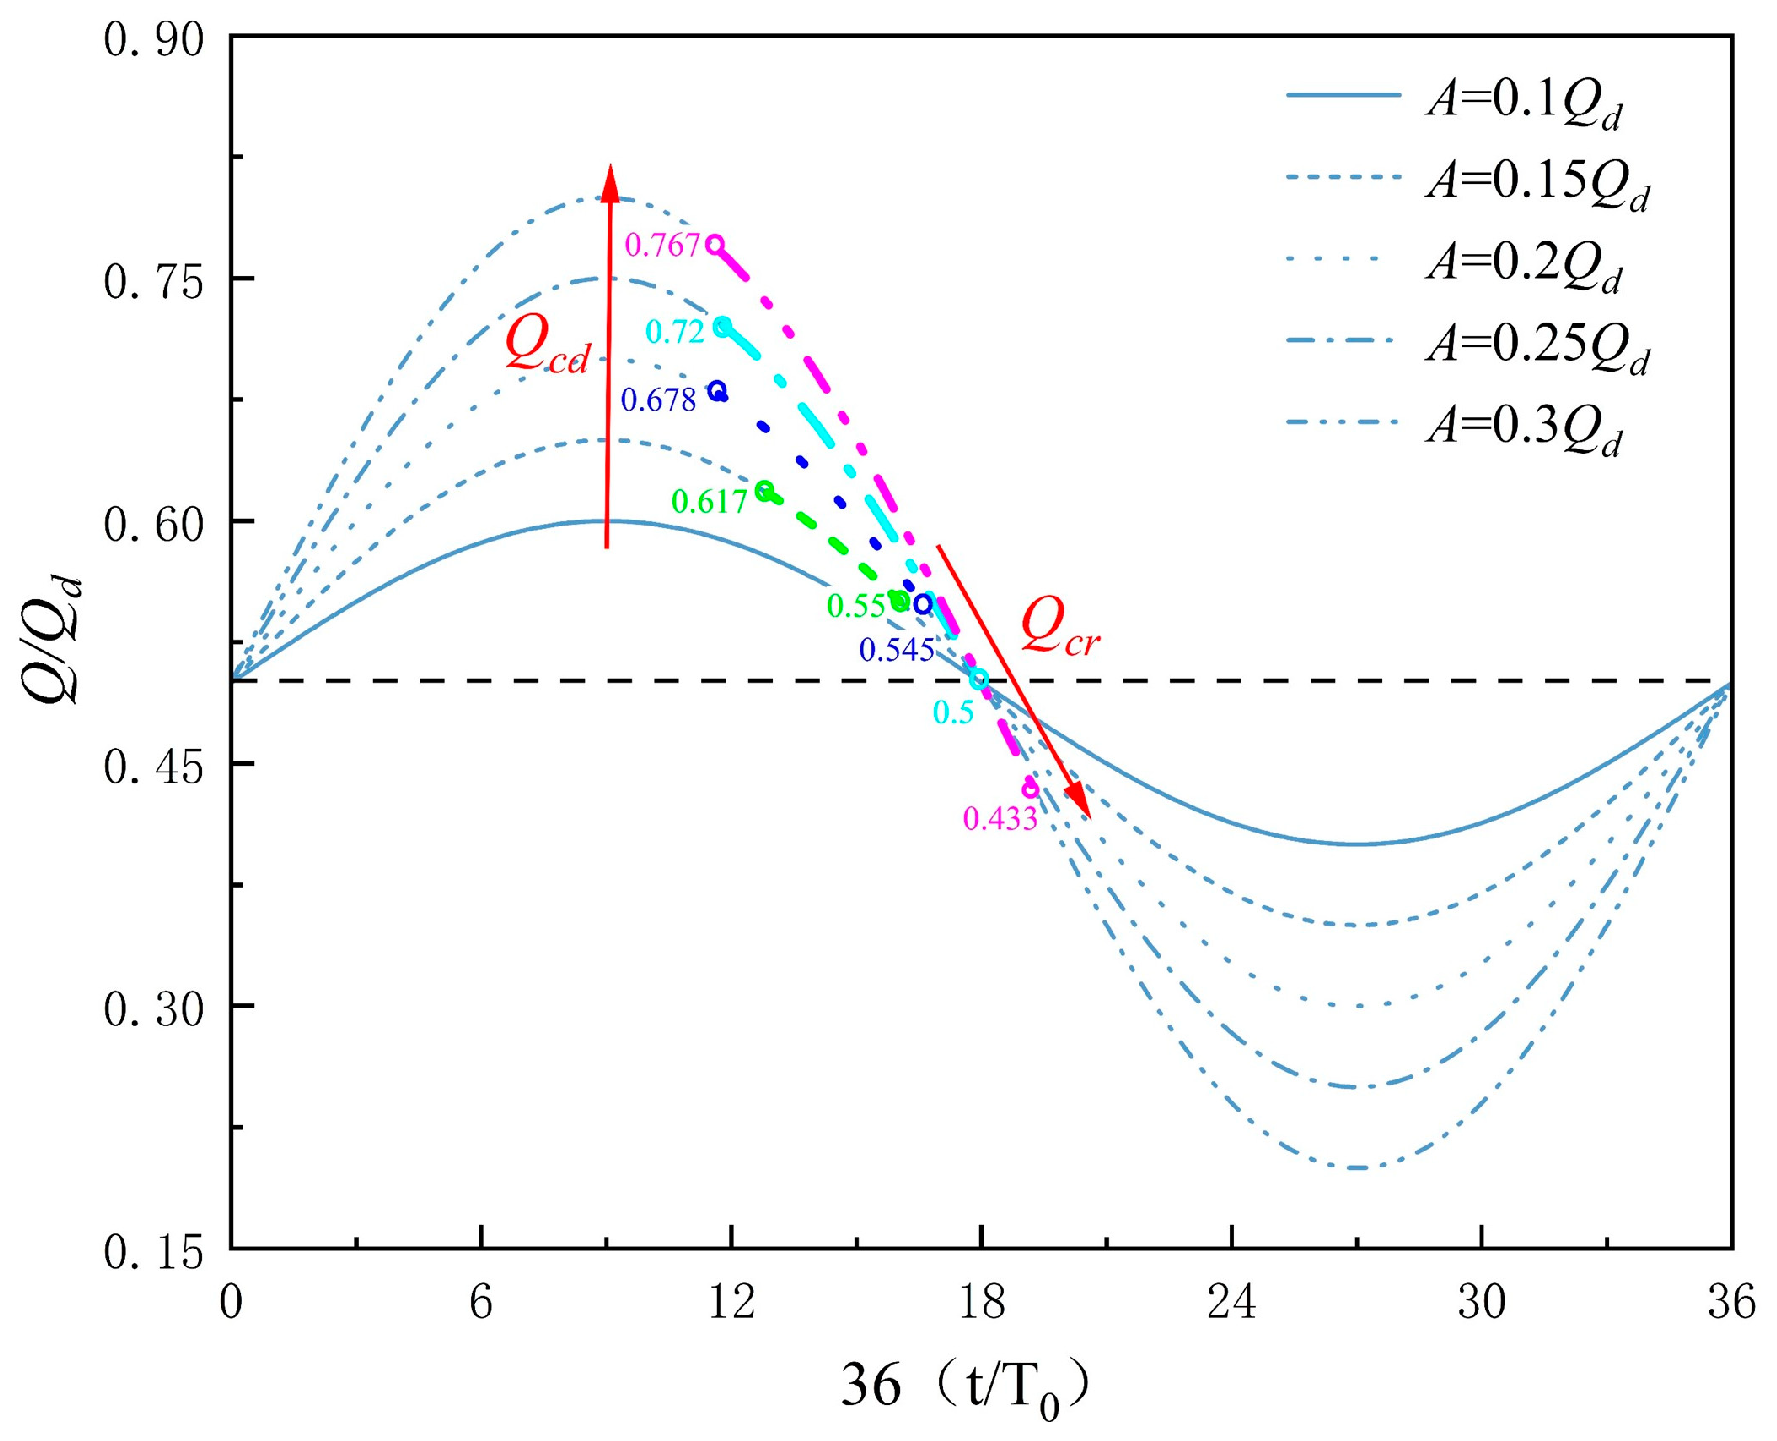
Figure 8 and Figure 11 show that the phase of Cs lags behind that of the flow rate and has a certain relationship with the amplitude. The relationship between the CAS and oscillation amplitude is shown in Figure 13. The non-stall state occurs only during the dropping stage of the flow rate, at least under the working conditions of this study. For oscillation amplitudes from 0.15Qd to 0.3Qd, Qcd increases from 0.617Qd to 0.767Qd and Qcr decreases from 0.550Qd to 0.433Qd. The phase of the former is insensitive to the oscillation amplitude, especially when the oscillation amplitude is larger than 0.2Qd. The phase of the latter lags as the oscillation amplitude increases.

5. Conclusions

When the number of blades is even, alternating stall often occurs in centrifugal pump impellers under low flow rates. A novel approach involving the introduction of the low-pressure ratio (Cs), has been proposed in this work to accurately and quantitatively predict alternating stall, including the critical alternating stall (CAS). The Cs is defined as the ratio of the deviations in the low-pressure zones of adjacent impeller passages. When the difference in the low-pressure zones is a factor of two or more, that is, Cs is equal to or greater than 2/3, the internal flow of the impeller can be considered to be in a stall state.
This novel approach was validated for a centrifugal pump impeller under quasi-steady conditions. The Cs was approximately 1.47 at 0.25Qd (where Qd is the design load), 1.15 at 0.5Qd, and 0.18 at 0.75Qd, respectively, indicating that the first two and the latter were in a stall state and were in a non-stall state. This aligns well with the results of Zhou et al. [15].
This novel approach has also been applied to the centrifugal pump impeller under transition conditions, conditions of which mean a sinusoidal flow rate with an equilibrium value of 0.5Qd and an initial phase of zero. A periodic pulsation of Cs is observed, whose frequency and phase are the same as and lag behind that of the flow rate, respectively. The fluctuating flow rate corresponding to the CAS is within 4%.
Cs is significantly affected by the oscillation amplitude. The impeller is always in a stall state for an oscillation amplitude of 0.1Qd, and part of the period is in a non-stall state for an oscillation amplitude of 0.15Qd or larger during the dropping stage of the flow rate. The flow rate corresponding to the CAS during the dropping and rising stages of the Cs, respectively, increases and decreases with increasing oscillation amplitude.
Therefore, Cs is useful for revealing the internal flow characteristics in a centrifugal pump impeller. The threshold value of 2/3 is a good quantity with which to quantitatively predict alternating stall and even CAS. In the future, this approach will be extended to the study of the alternating stall of a centrifugal pump to verify its universality.

Author Contributions

Conceptualization, X.Z. and X.C. (Xiaoping Chen); methodology, X.C. (Xiaoping Chen); software, X.Z. and Y.L; validation, Y.L., X.Z. and X.C. (Xiaoping Chen).; formal analysis, X.Z.; investigation, X.C. (Xiaoping Chen); resources, X.C. (Xiaoping Chen); data curation, X.Z.; writing—original draft preparation, X.Z.; writing—review and editing, X.C. (Xiaoping Chen); visualization, X.Z. and Y.L.; supervision, X.C. (Xulai Chen) and D.Y.; project administration, X.C. (Xulai Chen) and D.Y.; funding acquisition, X.C. (Xiaoping Chen). All authors have read and agreed to the published version of the manuscript.

Funding

This work was financially supported by the National Natural Science Foundation of China (Grant No. 51976198).

Data Availability Statement

Data are contained within the article.

Conflicts of Interest

Author Xulai Chen was employed by the company Zhejiang Testing & Inspection Institute for Mechanical and Electrical Products Quality Co., Ltd. The remaining authors declare that the research was conducted in the absence of any commercial or financial relationships that could be construed as a potential conflict of interest.

References

  1. Zhao, Z.Z.; Song, W.W.; Jin, Y.X.; He, L. Numerical study on flow stall and kinetic energy conversion of low-specific-speed centrifugal pump. Phys. Fluids 2023, 35, 044104. [Google Scholar] [CrossRef]
  2. Shi, L.; Liu, Z.Q.; Yang, W.; Li, Y.J.; Liu, X.D.; Tao, R. Prediction model of stall evolution stages in a centrifugal impeller based on characteristic analysis of the hydraulic torque of blades and support vector machine. J. Mech. Sci. Technol. 2023, 37, 5185–5198. [Google Scholar] [CrossRef]
  3. Liu, B.Q.; Yang, W.; Cheng, L.; Huang, X.B.; Jiao, W.X. Numerical study on jet-wake flow and its evolution in a centrifugal pump with alternating stall. Phys. Fluids 2023, 35, 115105. [Google Scholar] [CrossRef]
  4. Zhang, N.; Zheng, F.K.; Liu, X.K.; Gao, B.; Li, G.P. Unsteady flow fluctuations in a centrifugal pump measured by laser doppler anemometry and pressure pulsation. Phys. Fluids 2020, 32, 125108. [Google Scholar] [CrossRef]
  5. Mousmoulis, G.; Kassanos, I.; Aggidis, G.; Anagnostopoulos, I. Numerical simulation of the performance of a centrifugal pump with a semi-open impeller under normal and cavitating conditions. Appl. Math. Model. 2021, 89, 1814–1834. [Google Scholar] [CrossRef]
  6. Salehi, S.; Raisee, M.; Cervantes, M.J.; Nourbakhsh, A. On the flow field and performance of a centrifugal pump under operational and geometrical uncertainties. Appl. Math. Model. 2018, 61, 540–560. [Google Scholar] [CrossRef]
  7. Gülich, J.F. Centrifugal Pumps; Springer: Berlin/Heidelberg, Germany, 2010. [Google Scholar]
  8. Pedersen, N.; Larsen, P.S.; Jacobsen, C.B. Flow in a centrifugal pump impeller at design and off-design conditions-part I: Particle image velocimetry (PIV) and laser doppler velocimetry (LDV) measurements. J. Fluids Eng. 2003, 125, 61–72. [Google Scholar] [CrossRef]
  9. Byskov, R.K.; Jacobsen, C.B.; Pedersen, N. Flow in a centrifugal pump impeller at design and off-design conditions-Part II: Large eddy simulations. J. Fluids Eng. 2003, 125, 73–83. [Google Scholar] [CrossRef]
  10. Johnson, D.A.; Pedersen, N.; Jacobsen, C.B. Measurements of rotating stall inside a centrifugal pump impeller. In Proceedings of the ASME 2005 Fluids Engineering Division Summer Meeting, Houston, TX, USA, 19–23 June 2005. [Google Scholar]
  11. Tao, R.; Wang, Z. Comparative modeling and analysis of the flow asymmetricity in a centrifugal pump impeller at partial load. Proc. Inst. Mech. Eng. Part A J. Power Energy 2019, 234, 237–247. [Google Scholar] [CrossRef]
  12. Zhou, R.Z.; Liu, H.L.; Dong, L.; Ooi, T.K.; Dai, C.; Hua, R.N. Study on the stall vortex and vibration characteristics in multi-stage pump under natural flow condition. Phys. Fluids 2023, 35, 084117. [Google Scholar] [CrossRef]
  13. Li, W.; Ji, L.L.; Li, E.D.; Shi, W.D.; Agarwal, R.; Zhou, L. Numerical investigation of energy loss mechanism of mixed-flow pump under stall condition. Renew. Energy 2021, 167, 740–760. [Google Scholar] [CrossRef]
  14. Cheah, K.W.; Lee, T.S.; Winoto, S.H.; Zhao, Z.M. Numerical flow simulation in a centrifugal pump at design and off-design conditions. Int. J. Rotating Mach. 2007, 11, 83641–83648. [Google Scholar] [CrossRef]
  15. Zhou, P.J.; Dai, J.C.; Li, Y.F.; Chen, T.; Mou, J.G. Unsteady flow structures in centrifugal pump under two types of stall conditions. J. Hydrodyn. 2018, 30, 1038–1044. [Google Scholar] [CrossRef]
  16. Kline, S.J. On the nature of stall. J. Basic Eng. 1959, 81, 305–319. [Google Scholar] [CrossRef]
  17. Sano, T.; Nakamura, Y.; Yoshida, Y. Alternate blade stall and rotating stall in a vaned diffuser. JSME Int. J. Ser. B Fluids Therm. Eng. 2002, 45, 810–819. [Google Scholar] [CrossRef]
  18. Giannissis, G.L.; Mckenzie, A.B.; Elder, R.L. Experimental Investigation of Rotating Stall in a Mismatched Three-Stage Axial Flow Compressor. J. Turbomach. 1989, 111, 418–425. [Google Scholar] [CrossRef]
  19. Olivier, P.; Chisachi, K.; Guo, Y.; Yamade, Y.; Frangois, A. Large eddy simulation of the rotating stall in a pump-turbine operated in pumping Mode at a Part-Load Condition. J. Fluids Eng. 2016, 138, 111102. [Google Scholar] [CrossRef]
  20. Stosiak, M.; Karpenko, M.; Deptula, A.; Urbanowicz, K.; Skackauskas, P.; Deptula, A.M.; Danilevicius, A.; Sukevicius, S.; Lapka, M. Research of Vibration Effects on a Hydraulic Valve in the Pressure Pulsation Spectrum Analysis. J. Mar. Sci. Eng. 2023, 11, 301. [Google Scholar] [CrossRef]
  21. Zhang, B.W.; Li, C.; Jiao, W.X.; Zhang, D. Experimental and statistical analysis of the flap gate energy loss and pressure fluctuation spatiotemporal characteristics of a mixed-flow pump device. Energy 2023, 272, 127117. [Google Scholar] [CrossRef]
  22. Li, Z.F.; Wu, D.Z.; Wang, L.Q.; Huang, B. Numerical simulation of the transient flow in a centrifugal pump during starting period. J. Fluids Eng. 2010, 132, 081102. [Google Scholar] [CrossRef]
  23. Long, Y.; Lin, B.; Fang, J.; Zhu, R.S.; Fu, Q. Research on the transient hydraulic characteristics of multistage centrifugal pump during start-up process. Front. Energy Res. 2020, 8, 76. [Google Scholar] [CrossRef]
  24. Li, Z.F.; Wu, P.; Wu, D.Z.; Wang, L.Q. Experimental and numerical study of transient flow in a centrifugal pump during startup. J. Mech. Sci. Technol. 2011, 25, 749–757. [Google Scholar] [CrossRef]
  25. Tanaka, T.; Tsukamoto, H. Transient behaviour of a cavitating centrifugal pump at rapid change in operating conditions-part II;: Transient phenomena at pump start-up/sutdown. J. Fluids Eng. 1999, 121, 850–856. [Google Scholar] [CrossRef]
  26. Liu, J.; Li, Z.; Wang, L.; Jiao, L. Numerical simulation of the transient flow in a radial flow pump during stopping period. J. Fluids Eng. 2011, 133, 111101. [Google Scholar] [CrossRef]
  27. Tsukamoto, H.; Ohashi, H. Transient characteristics of a centrifugal pump during starting period. J. Fluids Eng. 1982, 104, 6–13. [Google Scholar] [CrossRef]
  28. Ohashi, H. Analytical and experimental study of dynamic characteristics of turbopumps: 2nd Report, Analytical Study of Dynamic Characteristics. Trans. Jpn. Soc. Jpn. Soc. Mech. Eng. 1967, 33, 1779–1788. [Google Scholar] [CrossRef]
  29. Tsukamoto, H.; Yoneda, H.; Sagara, K. The response of a centrifugal pump to fluctuating rotational speed. J. Fluids Eng. 1995, 117, 479–484. [Google Scholar] [CrossRef]
  30. Kuang, R.F.; Chen, X.P.; Zhang, Z.M.; Zhu, Z.C.; Li, Y. Large eddy simulation of periodic transient pressure fluctuation in a centrifugal pump impeller at low flow rate. Symmetry 2021, 13, 311. [Google Scholar] [CrossRef]
  31. Kuang, R.F.; Li, Y.; Chen, X.P. Effects of oscillation frequency on the flow characteristics in a centrifugal pump impeller with sinusoidal flow rate. Proc. Inst. Mech. Eng. Part C J. Mech. Eng. Sci. 2023, 237, 4246–4255. [Google Scholar] [CrossRef]
  32. Li, Y.; Zhang, W.J.; Chen, X.P. Numerical investigation of flow characteristics in a centrifugal pump impeller with sinusoidal flow rates of different oscillation amplitudes. J. Appl. Fluid Mech. 2022, 15, 1869–1879. [Google Scholar] [CrossRef]
  33. Menter, F.R. Two-equation eddy-viscosity turbulence models for engineering applications. AIAA J. 1994, 32, 1598–1605. [Google Scholar] [CrossRef]
  34. C.F.X. ANSYS, Inc. Theory Guide; ANSYS, Inc.: Canonsburg, PA, USA, 2016. [Google Scholar]
  35. Germano, M.; Piomelli, U.; Moin, P.; Cabot, W.H. A dynamic subgrid-scale eddy viscosity model. Phys. Fluids A 1991, 3, 1760–1765. [Google Scholar] [CrossRef]
  36. Lilly, D.K. A proposed modification of the Germano subgrid-scale closure method. Phys. Fluids 1992, 4, 633–635. [Google Scholar] [CrossRef]
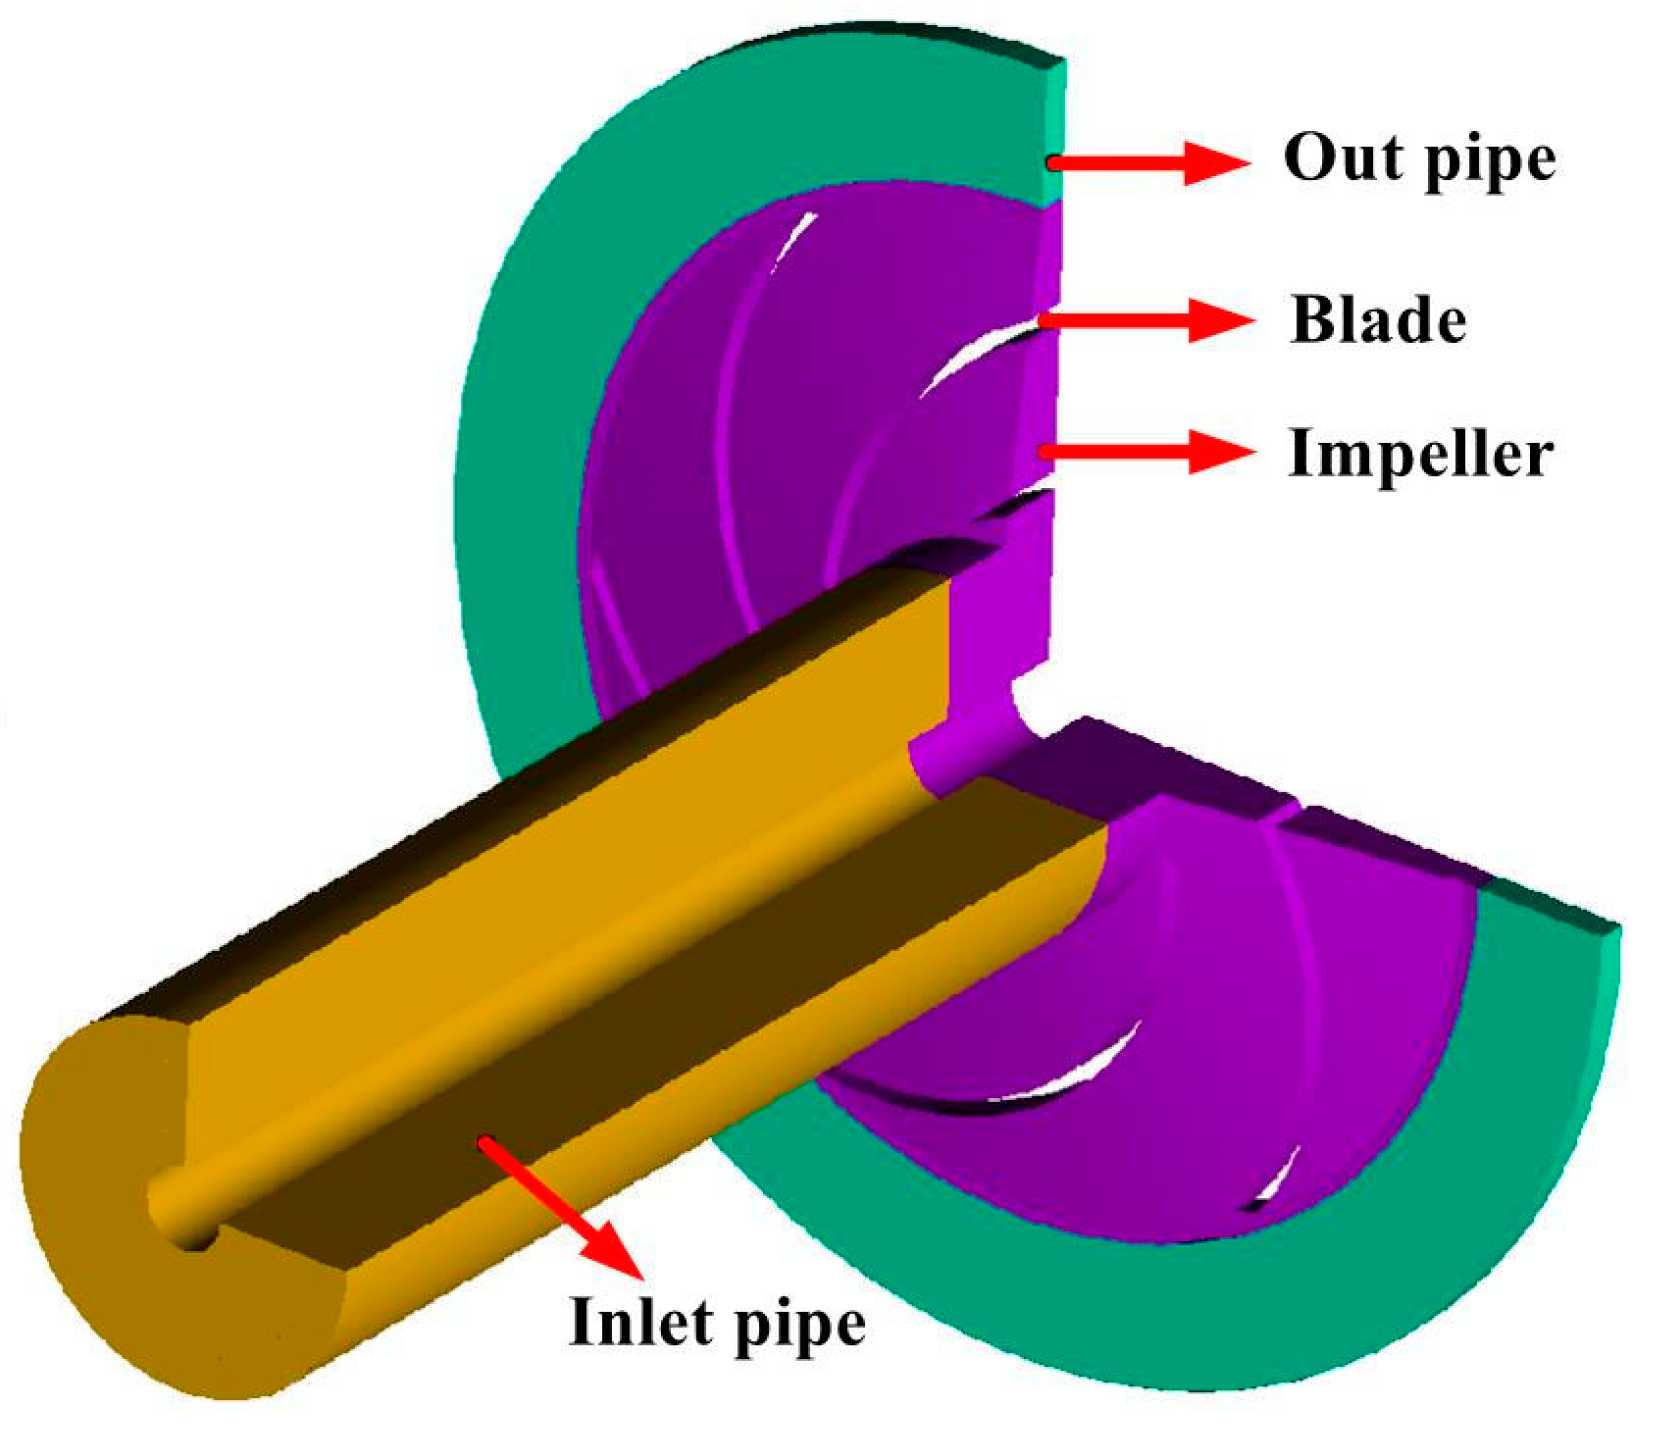
Figure 1. Geometric structure of the centrifugal pump impeller.
Processes 12 02635 g001
Figure 2. Grids of centrifugal pump impeller: (a) view of centrifugal pump impeller, (b) blade front view, (c) blade middle view.
Processes 12 02635 g002
Figure 3. Relationship between the flow rate and rotational time under transient conditions. T0 represents the time of the flow rate for one period.
Processes 12 02635 g003
Figure 4. Pressure coefficient nephogram in the impeller mid-height plane under quasi-steady conditions at 0.25Qd. The “a” and “b” represent the impeller passage in the stall state and non-stall state, respectively.
Processes 12 02635 g004
Figure 5. (a) Relationship between low-pressure ratio and rotational time (the light blue and white ranges represent the stall and non-stall states, respectively) and (b) the pressure coefficient nephogram in the impeller mid-height plane under quasi-steady conditions.
Processes 12 02635 g005
Figure 6. Pressure coefficient nephogram in the impeller mid-height plane at different rotational times at 0.25Qd. T represents the time taken for the impeller to rotate 360 degrees.
Processes 12 02635 g006
Figure 7. Distributions of the pressure coefficients in the impeller mid-height plane at different instantaneous flow rates under transient conditions.
Processes 12 02635 g007
Figure 8. Distributions of the low-pressure ratio in an oscillation period. The light blue and white ranges represent stall and non-stall states, respectively.
Processes 12 02635 g008
Figure 9. Flow rates corresponding to critical alternating stall during the dropping stage (left) and rising stage (right).
Processes 12 02635 g009
Figure 10. Distributions of the pressure coefficient (left) and streamline (right) in the impeller mid-height plane approaching alternate stall. t1 denotes the time corresponding to Qcd, and t1 equals t1 − T0/36. t2 denotes the time corresponding to Qcr, and t2′ equals t2 + T0/36.
Processes 12 02635 g010
Figure 11. Distributions of the low-pressure ratio with an oscillation amplitude of 0.15Qd. The light blue and white ranges represent the stall and non-stall states, respectively.
Processes 12 02635 g011
Figure 12. Statistical data of low-pressure ratio for different oscillation amplitude.
Processes 12 02635 g012
Figure 13. Flow rate corresponding to the critical alternating stall for different oscillation amplitudes.
Processes 12 02635 g013
Table 1. Geometric parameters of the centrifugal pump impeller.
ParameterSymbolNumerical ValueUnits
Specific speedns26.3rev/min
Blade radius of curvatureRb70mm
Inlet placement angleλ119.7deg
Outlet placement angleλ218.4deg
Number of bladesZ6
Blade thicknessd3mm
Inlet radiusR135.5mm
Outlet radiusR295mm
Inlet heightb113.8mm
Outlet heightb25.8mm
Disclaimer/Publisher’s Note: The statements, opinions and data contained in all publications are solely those of the individual author(s) and contributor(s) and not of MDPI and/or the editor(s). MDPI and/or the editor(s) disclaim responsibility for any injury to people or property resulting from any ideas, methods, instructions or products referred to in the content.