Article

Evaluation of the Compatibility Between Formation and Injection Water in Ultra-Low Permeability Reservoirs

by
Zhaobo Gong
1,2,
Leilei Zhang
1,2,
Tingting Zhang
1,2,
Zhong Yan
1,2,
Shuping Cong
1,2,
Zhenyu Zhou
3 and
Debin Kong
3,*
1
Research Institute of Experiment and Detection, PetroChina Xinjiang Oilfield Company, Karamay 834000, China
2
Xinjiang Energy Conservation and Environmental Protection Engineering Research Center of Oil and Gas Field, Karamay 834000, China
3
School of Civil and Resource Engineering, University of Science and Technology Beijing, Beijing 100083, China
*
Author to whom correspondence should be addressed.
Processes 2024, 12(11), 2475; https://doi.org/10.3390/pr12112475
Submission received: 10 October 2024 / Revised: 4 November 2024 / Accepted: 5 November 2024 / Published: 7 November 2024

Abstract

:
This study focuses on the reservoir scaling and the under-injection issues of the water injection well during the water injection development of an ultra-low permeability reservoir in Xinjiang due to the complex composition of injected water. Microfluidic experiments were applied to visualize the flow channel changes during water flooding, indoor core flooding experiments were employed to analyze the permeability and ion concentration, and nuclear magnetic resonance (NMR) was used to evaluate the pore structure damage. Together, these experiments were used to clarify the scaling and precipitation characteristics as the injected water met the formation water in porous media and the effects on reservoir damage. The research results showed that the poor compatibility of the injected water with the formation water could easily produce calcium carbonate scaling. The scaling products exhibited a unique network structure of blocks and a radial distribution, mainly composed of calcium carbonate and aluminosilicate. The scaling in the porous media exhibited the characteristics of unstable crystal precipitation, migration, and repeated scaling following water mixing, while the scale crystal growth occurred in the pores and the throats. According to the scaling characteristics, the damage to the reservoir permeability by scaling can be divided into the induction, damage, and stabilization stages. The filling and clogging of the scale crystals enhanced the pore structure heterogeneity, with the median pore radius reduced by 21.61% and the permeability reduced by 50%.

1. Introduction

The development of ultra-low permeability reservoirs has emerged in global oil and gas exploration due to their abundant reserves and huge potential for future recovery. At present, water injection development remains a vital method for ultra-low permeability reservoir development [1,2]. However, the complex composition of the injected water may lead to incompatibility issues with the formation water, often producing CaCO3, MgCO3, and MgSO4 precipitates. Such precipitations irreversibly damage the reservoir by clogging the reservoir pores, thus reducing the reservoir permeability and increasing water injection costs [3,4,5,6]. Reservoirs in the Xinjiang W ultra-low permeability block have low porosities, low permeabilities, complex pore-throat structures, and diversified clay minerals, bringing numerous challenges to water injection development [7,8]. The reservoirs are primarily composed of three lithologies: sandy conglomerate, fine-grained conglomerate, and poorly sorted conglomerate. A core analysis indicated that the average reservoir porosity was 11.4%, and the permeability averaged out at 0.45 mD. The current situation is characterized by a low rate of well activation, which can be attributed to a number of factors, including the well conditions, water quality, reservoir contamination, and other factors. These have resulted in a low reservoir injection/production ratio, a low degree of pressure retention, and a high natural decline rate. Specifically, the severe scaling in the water injector well has increased the oil pressure, making it impossible to inject water, and well washing has been ineffective. Therefore, studying the compatibility of injected water with formation water and the mechanism of reservoir damage is important for the efficient development of ultra-low permeability reservoirs [5,9].
The scaling due to the interactions between the injected water and the formation water is a complex process, encompassing the precipitation of salts with concentrations exceeding their solubility products in water, the precipitated molecules combining into microcrystal grains, the scale deposition due to grain accumulation and growth, the environmental influence, and the mixing of various impurities into the precipitates. The research methods for these problems mainly include theoretical calculation simulations [4,9,10,11], static experiments [4], and dynamic experiments [3]. Theoretical calculation simulation methods take the ion composition of injected water and formation water as the input to calculate the saturation of each ion under different temperatures, pressures, ionic strength, pH, and other conditions. These results are compared with the concentrations in the mixed liquid of injected water and formation water in different mixing ratios to predict the scaling trend and characteristics [4,9,10,11]. By integrating the scaling prediction model with geochemical reactions and the multiphase flow model, it is possible to forecast the distribution of scaling and scaling products within the pore media as different injected waters enter the reservoir [11,12,13,14]. Yet, these methods are not effective for obtaining accurate calculations in complex reservoir conditions. With static experimental methods, the injected water and the formation water are mixed in different proportions in a container, and precipitation is observed at either room temperature or the formation temperature [4,10]. However, these methods neglect factors such as the fluid flow rate and can only qualitatively evaluate whether precipitates are generated. The dynamic experimental method for this research field is the core displacement experiment. Specifically, water is continuously injected into the core saturated with formation water under the formation temperature and pressure, and the scaling pattern and characteristics are studied by observing the permeability changes of different parts of the core and the ion concentration changes of the effluent water [15,16,17]. However, it is not possible to directly observe the scaling process in the reservoir through the dynamic experimental method. By combining nuclear magnetic resonance (NMR) with scanning and displacement experiments, the pore damage can be evaluated by comparing the T2 spectral curves before and after water injection [3,8,18]. Microfluidic experiments can visually reproduce the flow channel changes during water flooding, and the evolution of pore damage during water flooding can be observed in real time [19,20,21,22]. Merdhah et al. used Berea cores to study the permeability reduction caused by scale formation, and the variation of scale solubility with salinity and temperature [23]. Moghadasi et al. injected two incompatible solutions of calcium and carbonate ions into a porous medium and reported that a large degree of supersaturation, the presence of impurities, changes in temperature, and rate of mixing affected the scaling process [24]. Haghtalab et al. proposed a new model for predicting scale formation to optimize the composition of injected water [25]. Wang et al. suggested that an increase in the downhole temperature or/and fluid residence time can result in a higher scaling risk [26]. Merdhah et al. indicated that increasing the temperature, concentration of brine, and pressure difference can relieve the permeability reduction [27].
With the low-permeability tight oil reservoirs increasingly at the forefront of oil and gas exploration [28], it is crucial to investigate the alterations in their physical properties throughout the development period. Therefore, this study selected the injected water and formation water in the Xinjiang W ultra-low permeability block as the research object. Static experiments, NMR scanning, displacement experiments, and microfluidic experiments were all combined to evaluate the scaling pattern of injected water and formation water in porous media. The effects of reservoir scaling on the physical properties and micropore structure of the core were analyzed. The mechanism by which the scaling damages ultra-low permeability reservoirs was revealed. These research results offer a certain reference value.

2. Experimental

2.1. Experimental Materials

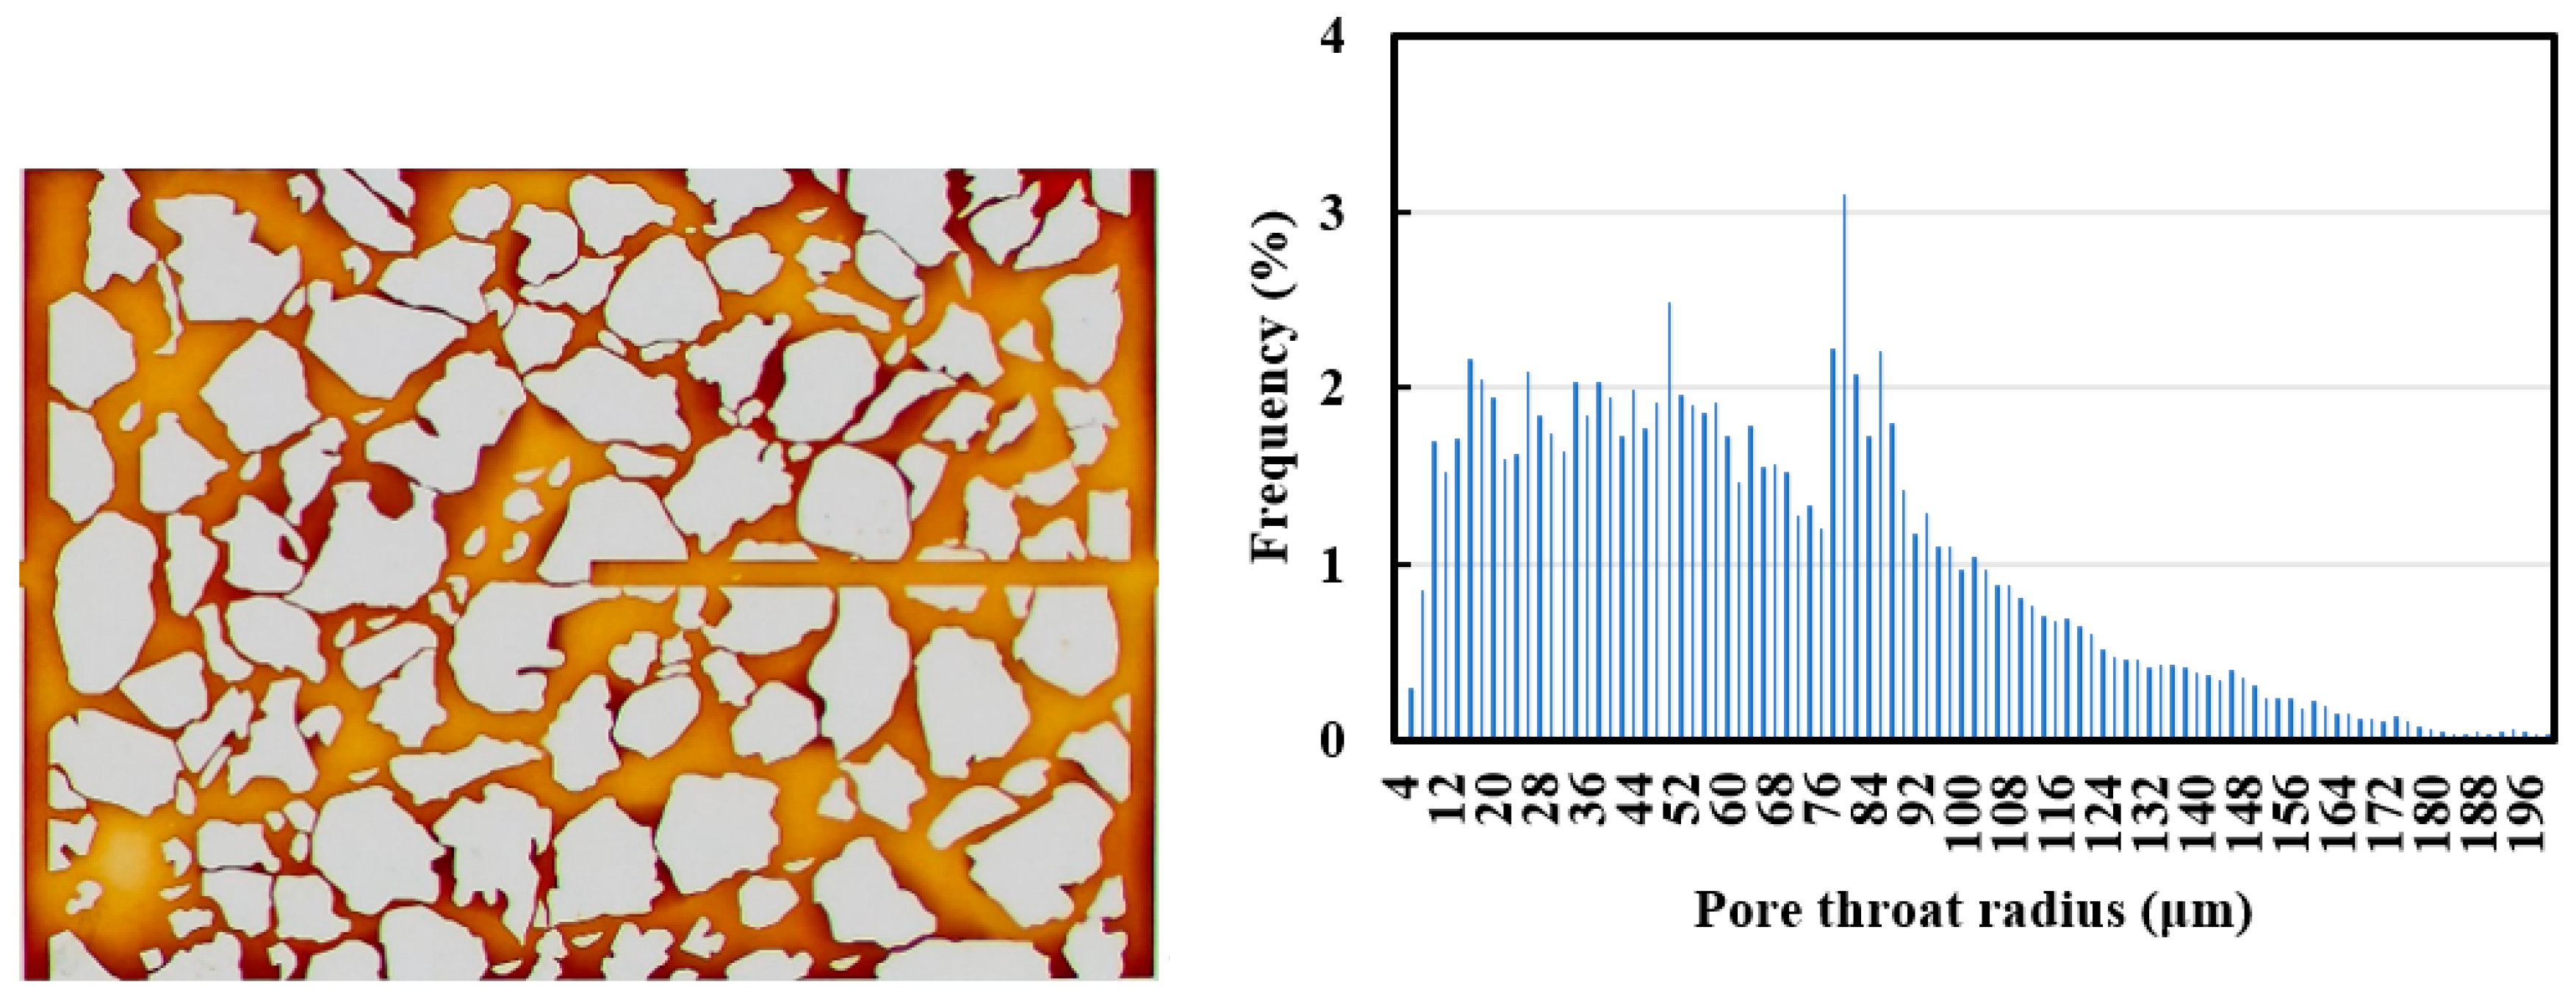
2.1.1. Core and Microfluidic Physical Properties

An ultra-low permeability reservoir core was selected for the experiment. Its casting sheet (Figure 1) showed that the pore type was mainly residual intergranular pores (32%), followed by intracrystalline dissolution pores (25%), and intragranular (dissolution) pores (16%). The clay content averaged out at 2.9%. Clay minerals were dominated by chlorite-smectite mixed layers, with an average relative content of 54.4%, followed by illite, with an average content of 21.5%. The core sensitivity test results showed that it had a moderate to strong rate sensitivity and a moderate to strong water sensitivity.
The visual microfluidic chip for microfluidic experiments was a simulated pore network model designed and fabricated using polydimethylsiloxane (PDMS) materials based on the rock casting sheet images. Its length and width were 8.68 mm × 6.20 mm, and its depth was 3 μm. The chip had a half-width crack on the right side, and the pore distribution pattern was approximately the same as the real core (Figure 2).

2.1.2. Experimental Water

An outlet water sample from well P in a low permeability reservoir was used as the formation water, and an outlet water sample from injection well I was used as the injected water. To distinguish between the flow channel and the white matrix portions in microfluidic experiments, the injected water and formation water were dyed with water-soluble pigments at a concentration of 20,000 ppm.
Thus, the injected water was of the sodium bicarbonate type, while the formation water was of the calcium chloride type, resulting in weak alkalinity and high salinity. Of these, the scaling ion HCO3 content in the injected water was high, with a mass concentration of 1836 mg/L. In contrast, the contents of Ca2+ and HCO3 in the formation water were higher and lower, reaching 1043 mg/L and 714.8 mg/L, respectively (Table 1). Therefore, the water quality was unstable under certain conditions, with a possible trend of carbonate self-scaling.

2.2. Experimental Setup and Procedures

2.2.1. Static Stability Experiments

The injected water and formation water were mixed according to the 9:1, 5:1, 1:1, 1:5, and 1:9 mixing ratios to conduct the compatibility stability experiments, and self-scaling trend experiments were conducted on the two water samples. The injected water and formation water were mixed in a beaker according to the above ratios, and the mixture was heated to the experimental temperature and allowed to settle for over 17 h. Then, the ion concentration and pH level changes were determined. The experimental temperature scheme was 29 °C (room temperature), 49 °C, and 69 °C. A cryo-scanning electron microscopy system was used for the rapid freezing and scanning of the scaling product. The microscopic morphology of the scaling product was examined, and the scale product composition was analyzed based on energy spectra. The cryo-scanning electron microscopy system consisted of a rapid freezing sublimation sample preparation device and a Regulus 8100 scanning electron microscope from Hitachi, Tokyo, Japan.

2.2.2. Microfluidic Displacement Experiments

Under the three experimental conditions in Table 2, the saturated dyed produced water from well P was injected into the microfluidic chip for the displacement experiment at a total flow rate of 100 μL/min until reaching pressure stability (the steady state was achieved when the two water types were injected after mixing according to the flow rate ratio, and the unsteady state occurred after displacement with only the injected water after saturation). The experimental image and pressure curve were recorded [19]. The experimental process is shown in Figure 3.

2.2.3. Core Displacement Experiments

The core displacement experiments were conducted to analyze the degree of reservoir damage caused by the incompatibility between the injected water and the formation water in the formation stage. The degree and scope of reservoir damage were comprehensively evaluated based on segmented core permeability measurements and NMR scans. The MesoMR23-060H-I nuclear magnetic resonance instrument from Newmai, Suzhou, China was used to measure the T2 spectrum. The dried core was first vacuumed in a tank with saturated formation water for 48 h, and NMR scanning was performed to produce the initial T2 spectrum. The core was then placed into the core holder for displacement using the injected water under the reservoir temperature of 69 °C, the confining pressure of 20 MPa, and the injection speed of 0.3 mL/min. The pressure change pattern was recorded in real time. The displacement experiment concluded when the pressure stabilized, and the core was removed for NMR scanning to obtain the T2 spectrum of the core after displacement. The experimental process is shown in Figure 4.
Specifically, the relationship between the T2 value and pore size is depicted by the following equation:
1 T 2 = ρ S V pore
where T2 is the relaxation time (ms), S is the surface area of the pore (μm2), V is the volume of the pore (μm3), and ρ is the surface relaxation rate (μm·s−1) with a value of 0.0154 in this study.

3. Experimental Results and Analysis

3.1. Water Quality Stability Analysis

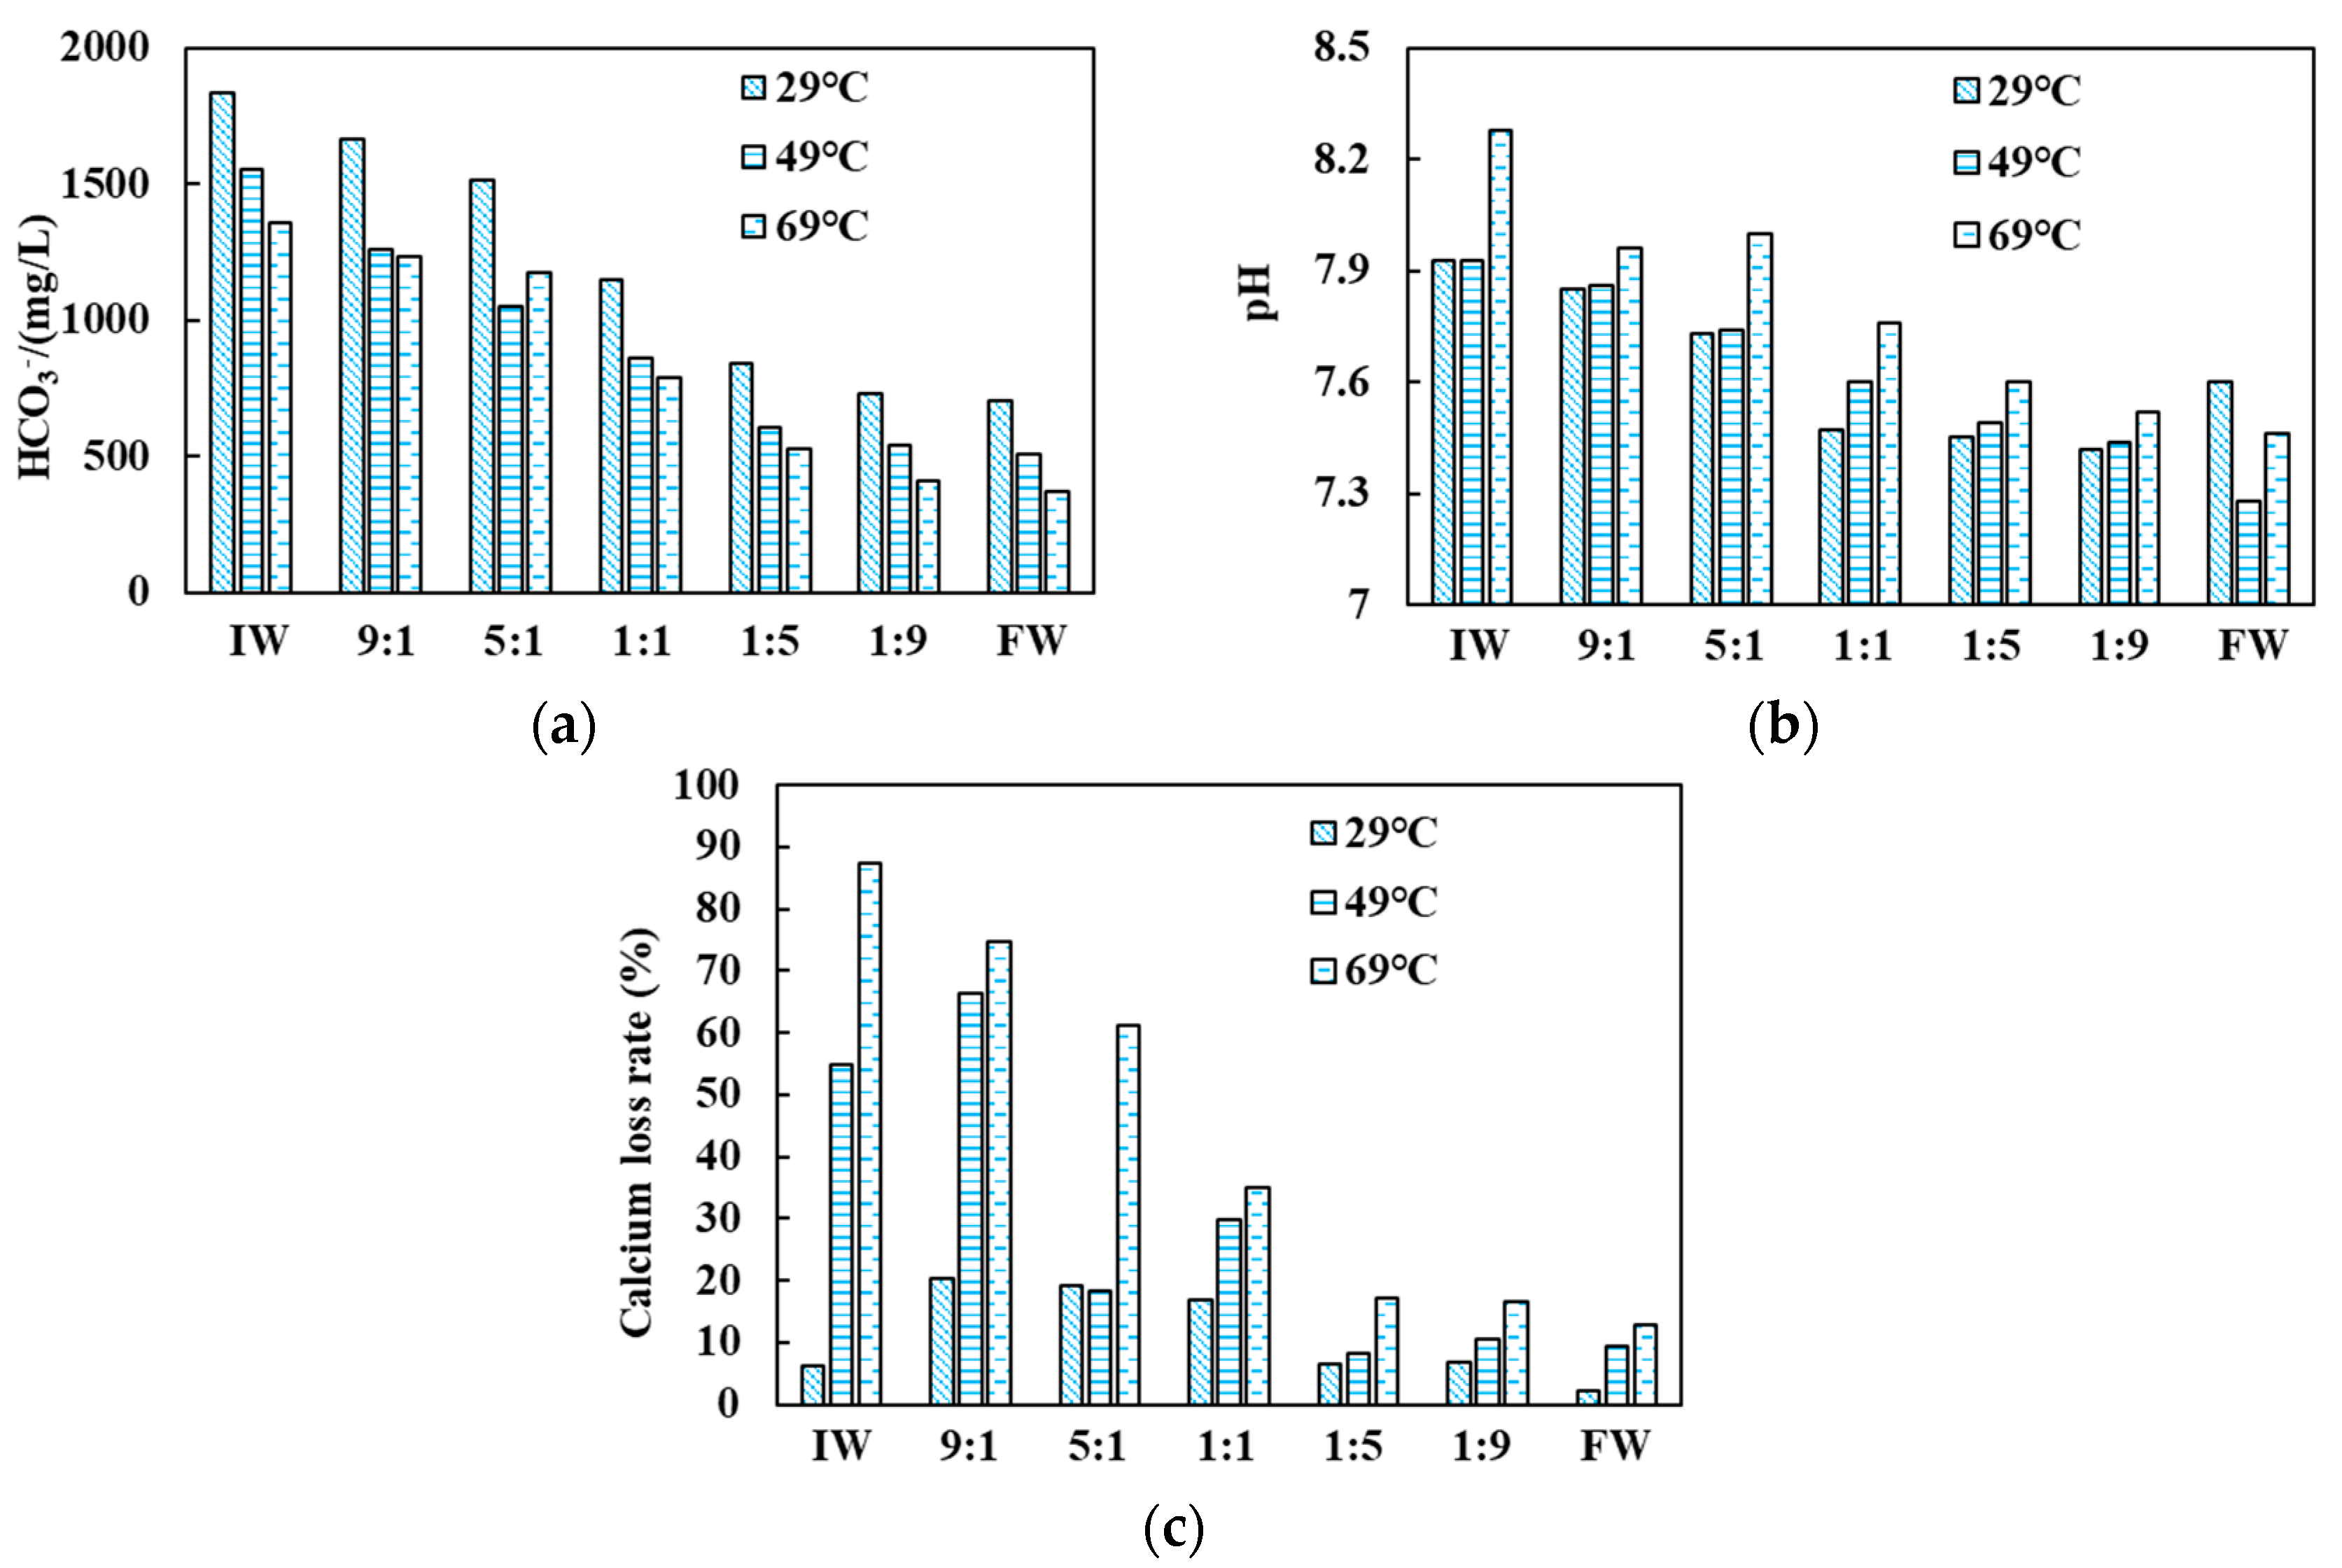
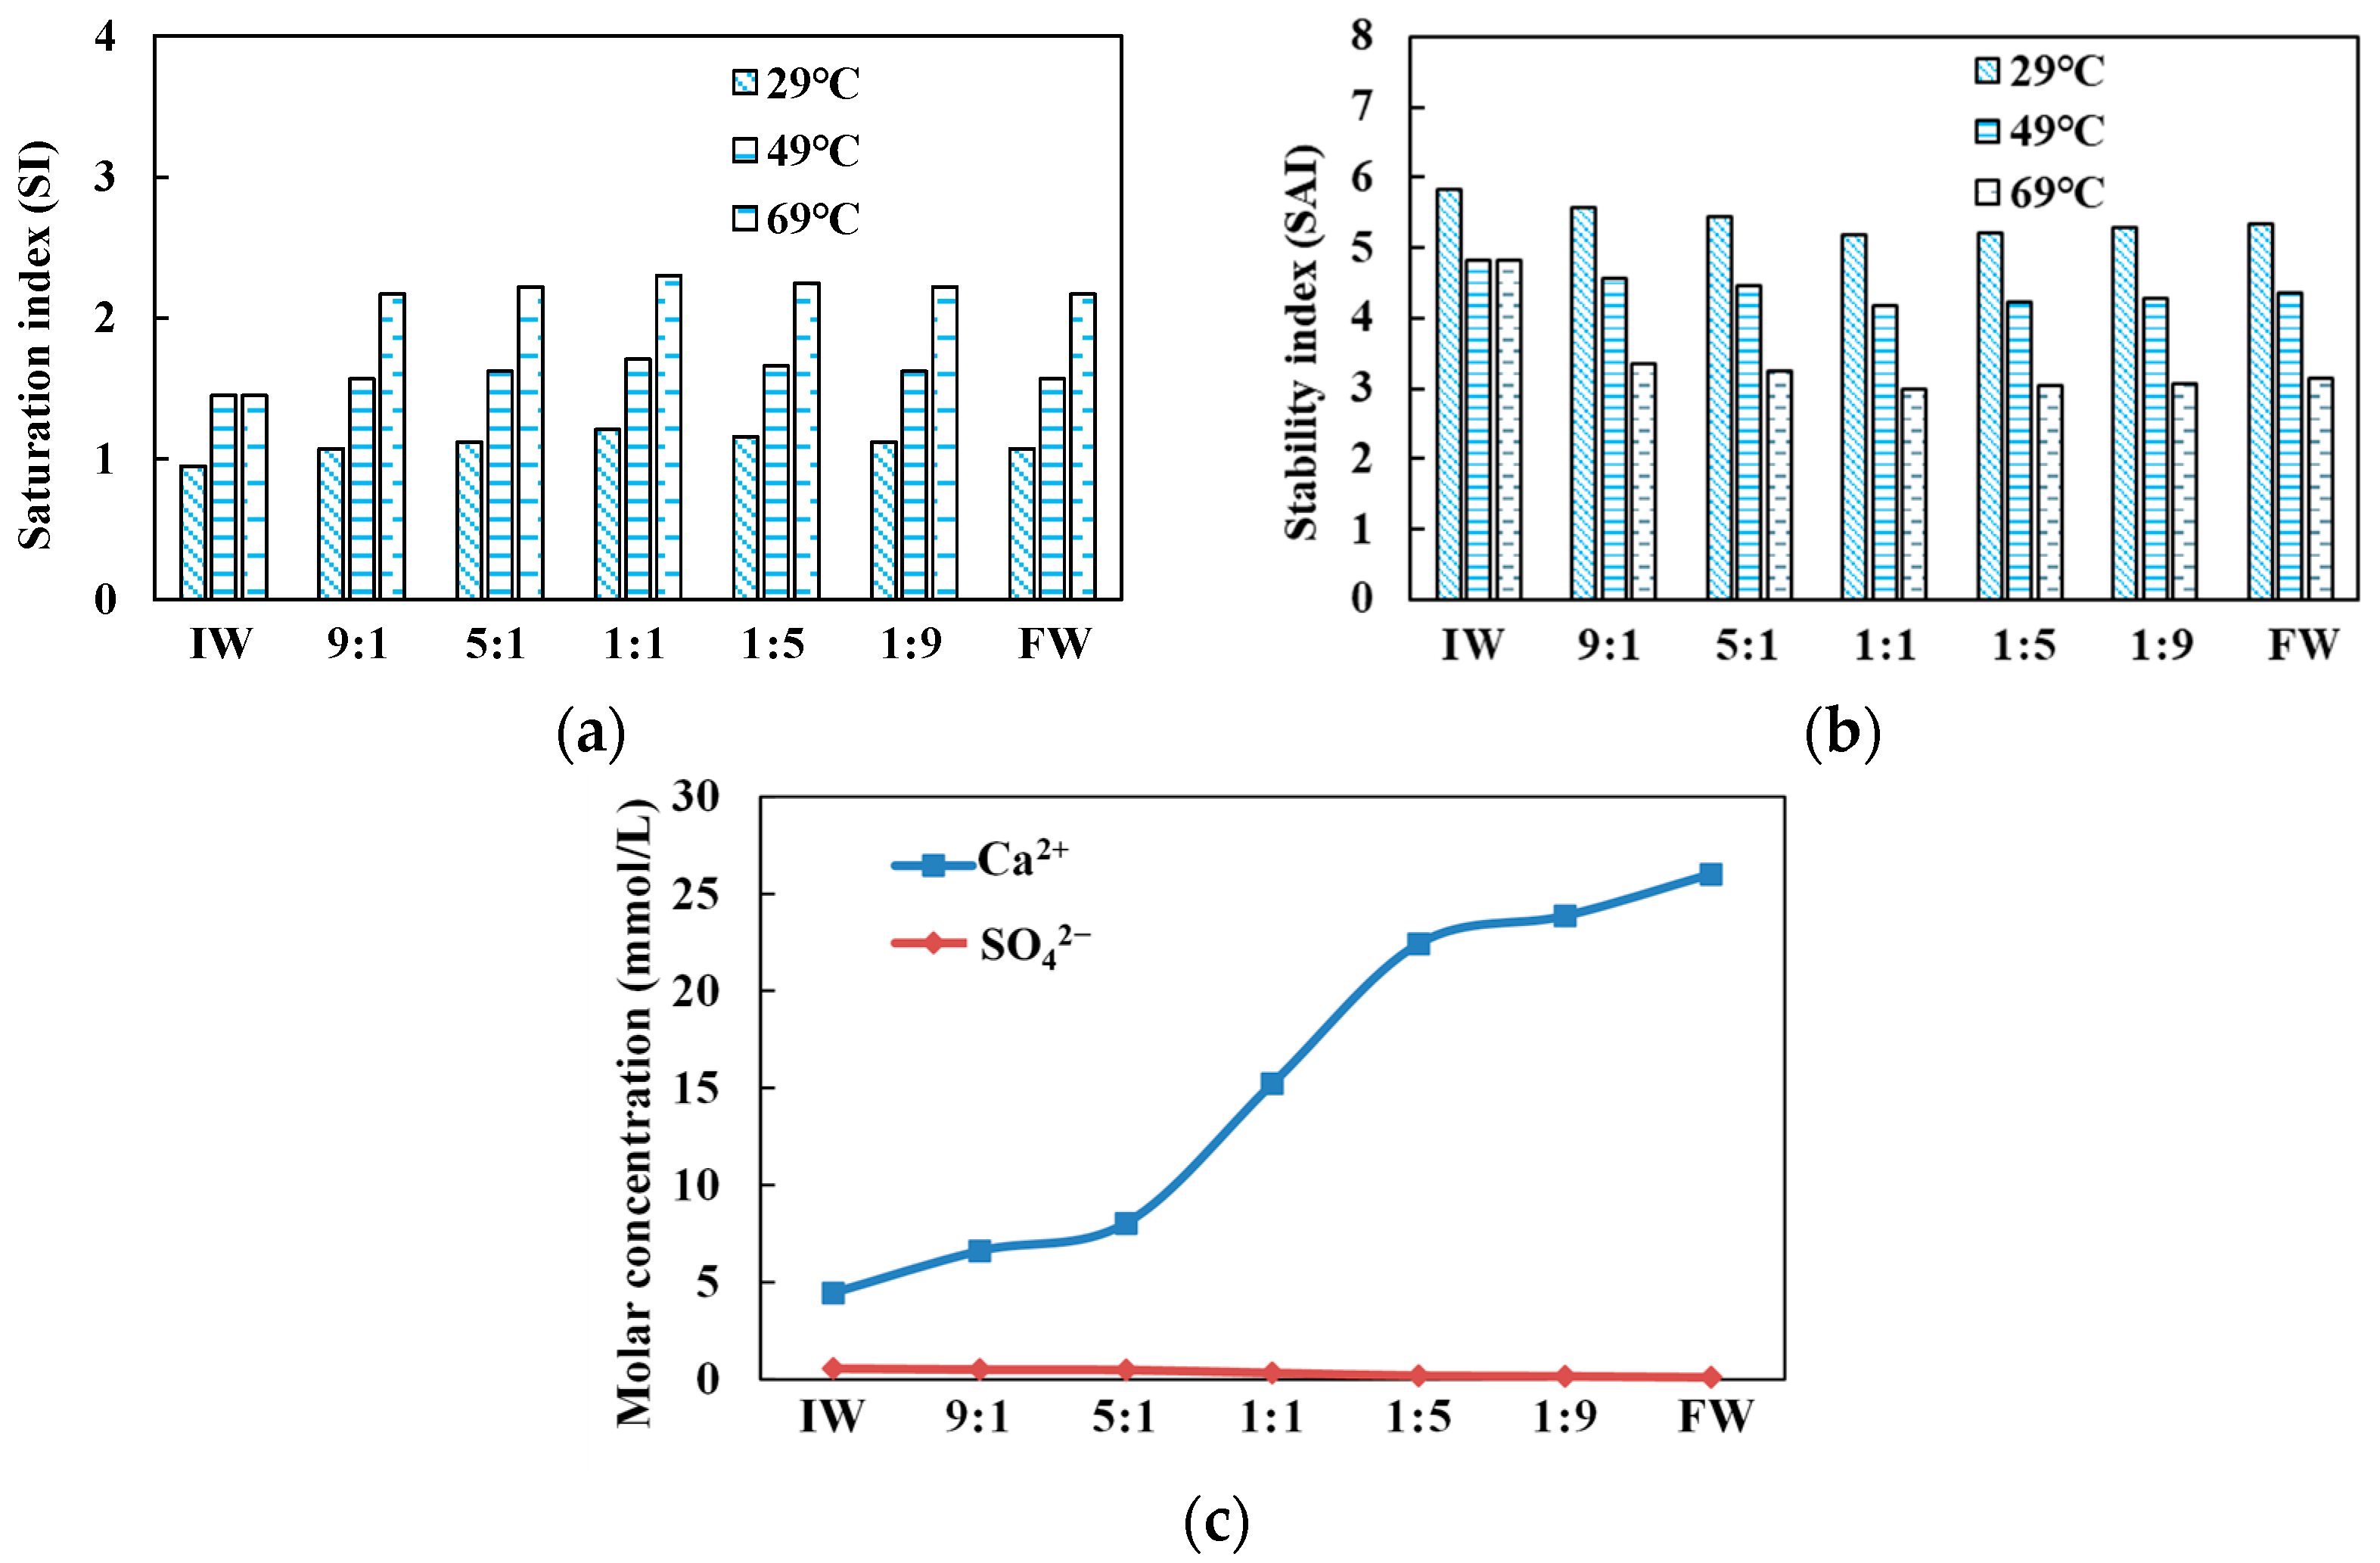
3.1.1. Water Compatibility and Scaling Trends

Figure 5 shows that the CO32− content remained at zero, the overall HCO3 content decreased, and the pH value slightly increased compared to the initial state. For instance, under the condition of 49 °C, the HCO3 content decreased by 15.38%, 26.98%, 36.45%, 32.23%, 32.90%, 34.17%, and 29.10%, respectively, while the pH value increased by 2.75%, 2.11%, 0.81%, 0.12%, 0.67%, 1.05%, and 2.92%. According to the composition proportion analysis, the decreased HCO3 content and the pH value changes were mainly due to the far higher HCO3 content in the injected water than in the formation water. With the increase of the injected water, the HCO3 content and pH values tended to be equalized. In terms of temperature, the HCO3 content decreased, and the pH value slightly increased with the increasing temperature. Due to its instability, HCO3 underwent thermal decomposition under high temperatures to generate CO32− and CO2. The former combined with the enriched Ca2+ to generate precipitates, and the CO2 discharge increased the alkalinity of the solution. Calcium loss was observed in the experiment. The calcium loss rate in injected water was between 6.25% and 87.5%. The most severe calcium loss was observed in the injected water self-scaling group. According to the composition proportion analysis, the increased water injection eased the calcium loss. In terms of temperature, the calcium loss increased with the increase in temperature. With a low water injection, the calcium loss rate varied greatly as the temperature increased. With a high water injection, the calcium loss rate became less sensitive to temperature changes. These calcium loss observations indicated the poor compatibility between the injected water and the formation water, facilitating extensive scaling.
According to the dissolution equilibrium principle of calcium carbonate, the scaling trend was predicted based on the Langelier saturation index method and the Ryznar stability index method. A saturation index SI < 0 indicates an unsaturated calcium carbonate solution and no scaling trend; SI = 0 indicates a solid–liquid equilibrium in the calcium carbonate solution and no scaling trend, and SI > 0 indicates a saturated calcium carbonate solution and a scaling trend. A lower stability index SAI indicates a more significant scaling trend. Stability index values are as follows: SAI = 4.0 to 5.0 indicates severe scaling, SAI = 5.0 to 6.0 indicates mild scaling, and SAI = 6.0 to 7.0 indicates slight scaling. Figure 6 shows that the injected water–formation water mixtures with different mixing ratios have a calcium carbonate scaling trend at 29 °C, 49 °C, and 69 °C under standard atmospheric pressure. Figure 6a indicates that under the conditions of 29 °C, 49 °C, and 69 °C, the SI at a mixing ratio of 1:1 are 1.21, 1.71, and 2.30, respectively, all of which are the highest in the experiment group. Under the same condition, Figure 6b presents the SAI values at a mixing ratio of 1:1 as 5.18, 4.18, and 3.00, respectively, all of which are the smallest. Thus, according to the criteria, the calcium carbonate scaling trend was the most apparent under the mixing ratio of 1:1, showing almost severe scaling. The increase and decrease in water injection also affected the scaling trend. Meanwhile, the calcium carbonate scaling trend was significantly affected by temperature, which became increasingly apparent with the increase in temperature manifesting as severe scaling except under room temperature. Figure 6c shows that the molar concentration of sulfate ions in each group is less than 0.55 mmol/L, and there was no trend of sulfate scaling.

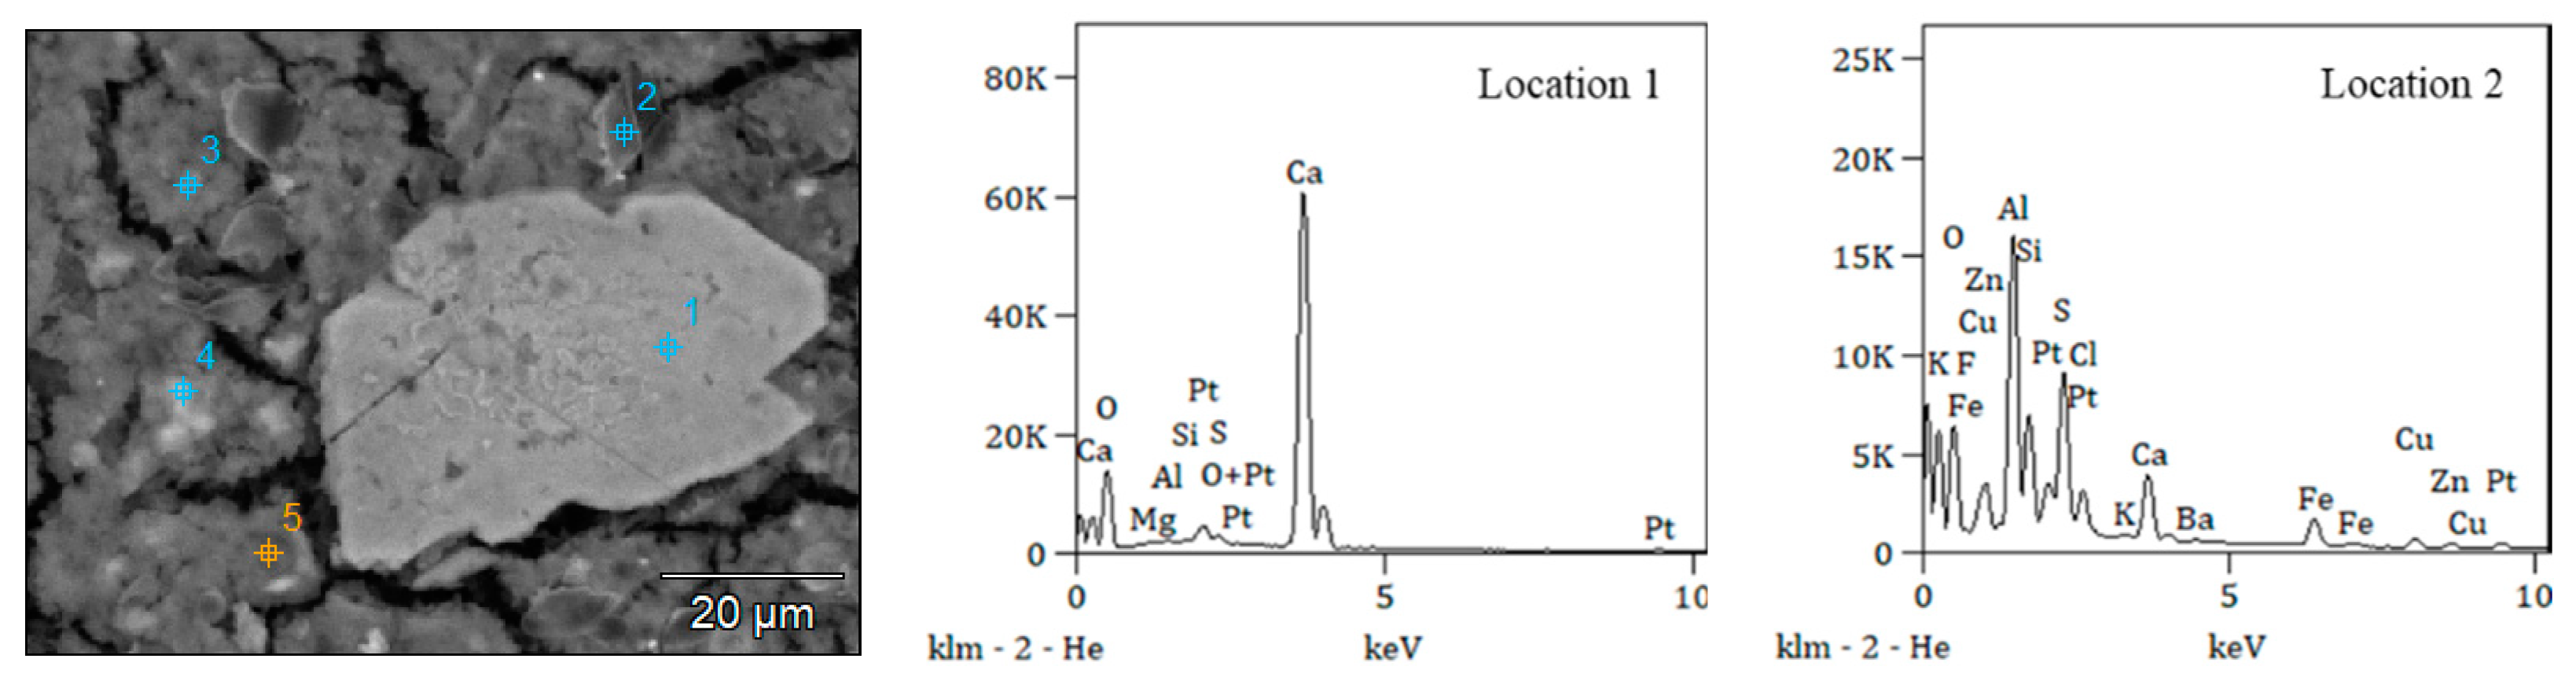
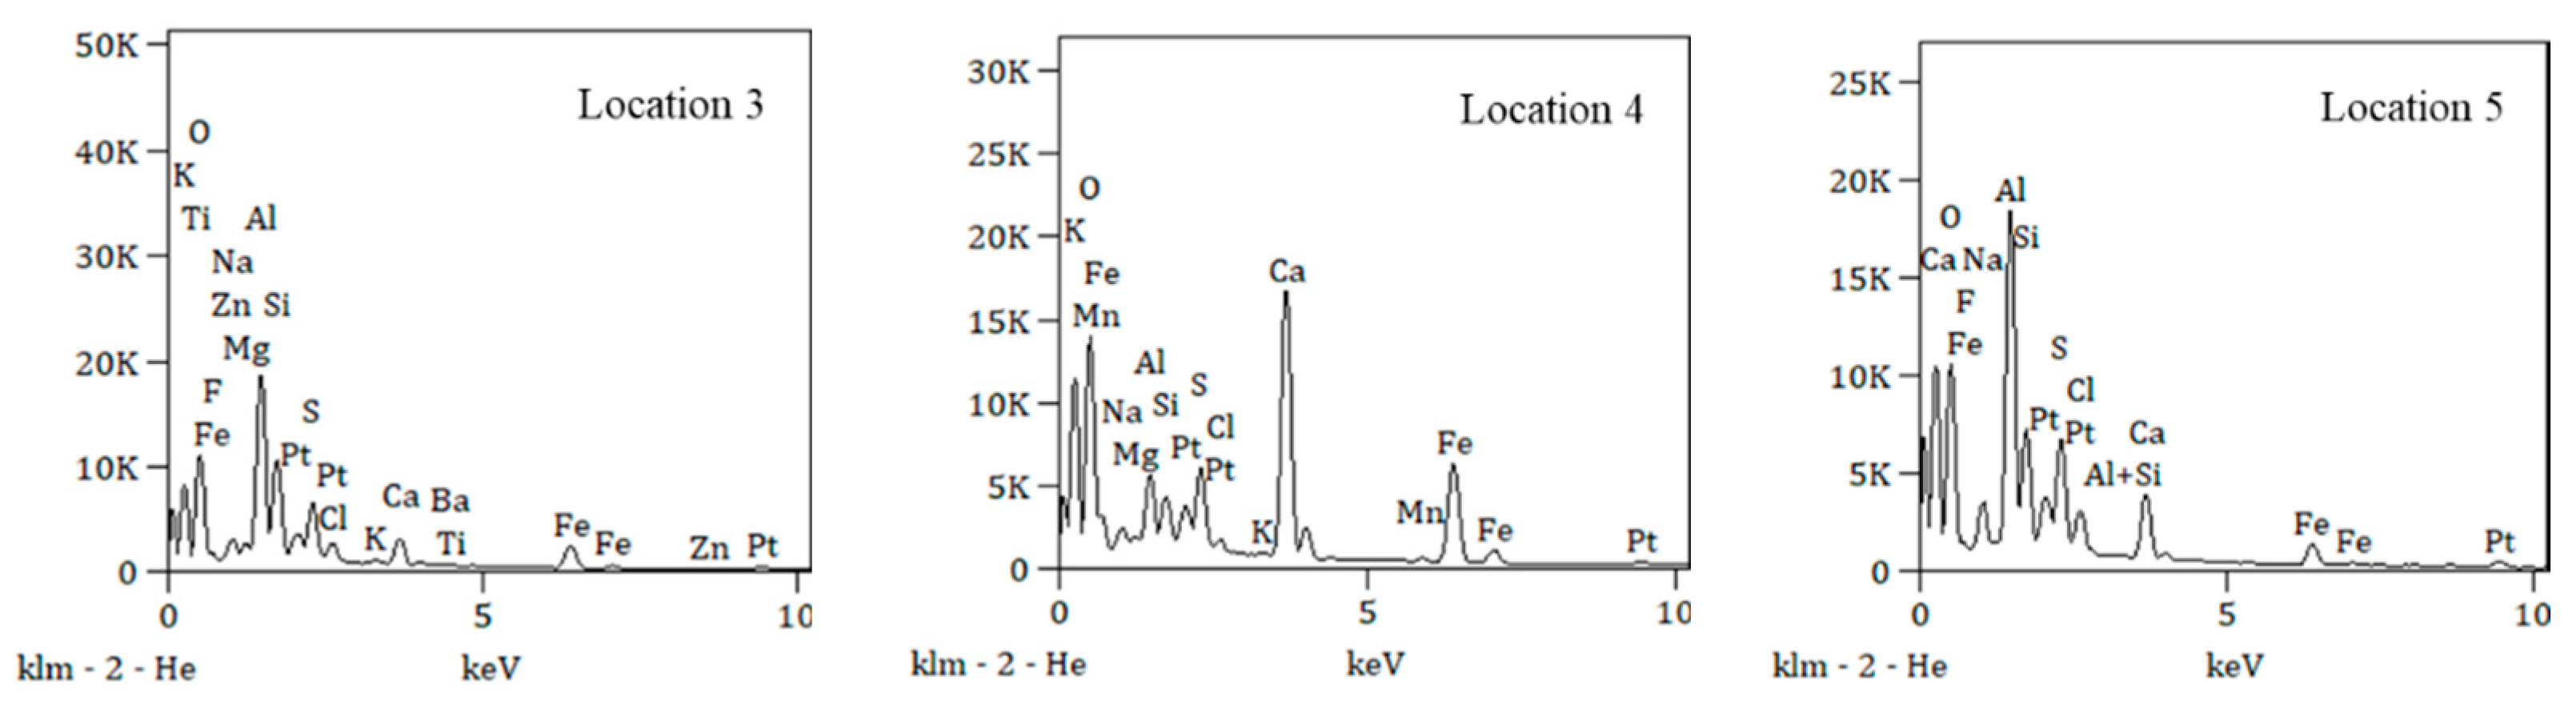
3.1.2. Scale Type and Microscopic Morphology

Under scanning electron microscope observations, the scaling products exhibited a unique network structure of blocks and a radial distribution, and their grains were mostly blocks about 11 to 17 μm in diameter. As the magnification increased, obvious lines were observed on the large flakes, and a large number of spheres were observed between the flakes, constituting the complex microstructure of the scaling products. This scaling product structure may be ascribed to their chemical composition, formation conditions, or external environmental factors. The scaling affected the fluid flow and easily led to clogging in the rock (Figure 7 and Figure 8).
According to the energy spectrum analysis, the scaling products may contain calcium carbonate (CaCO3) and aluminosilicate minerals. The formation of these minerals was closely related to the chemical composition of the water, temperature, pH, pressure, and the interactions between water and the material surface.

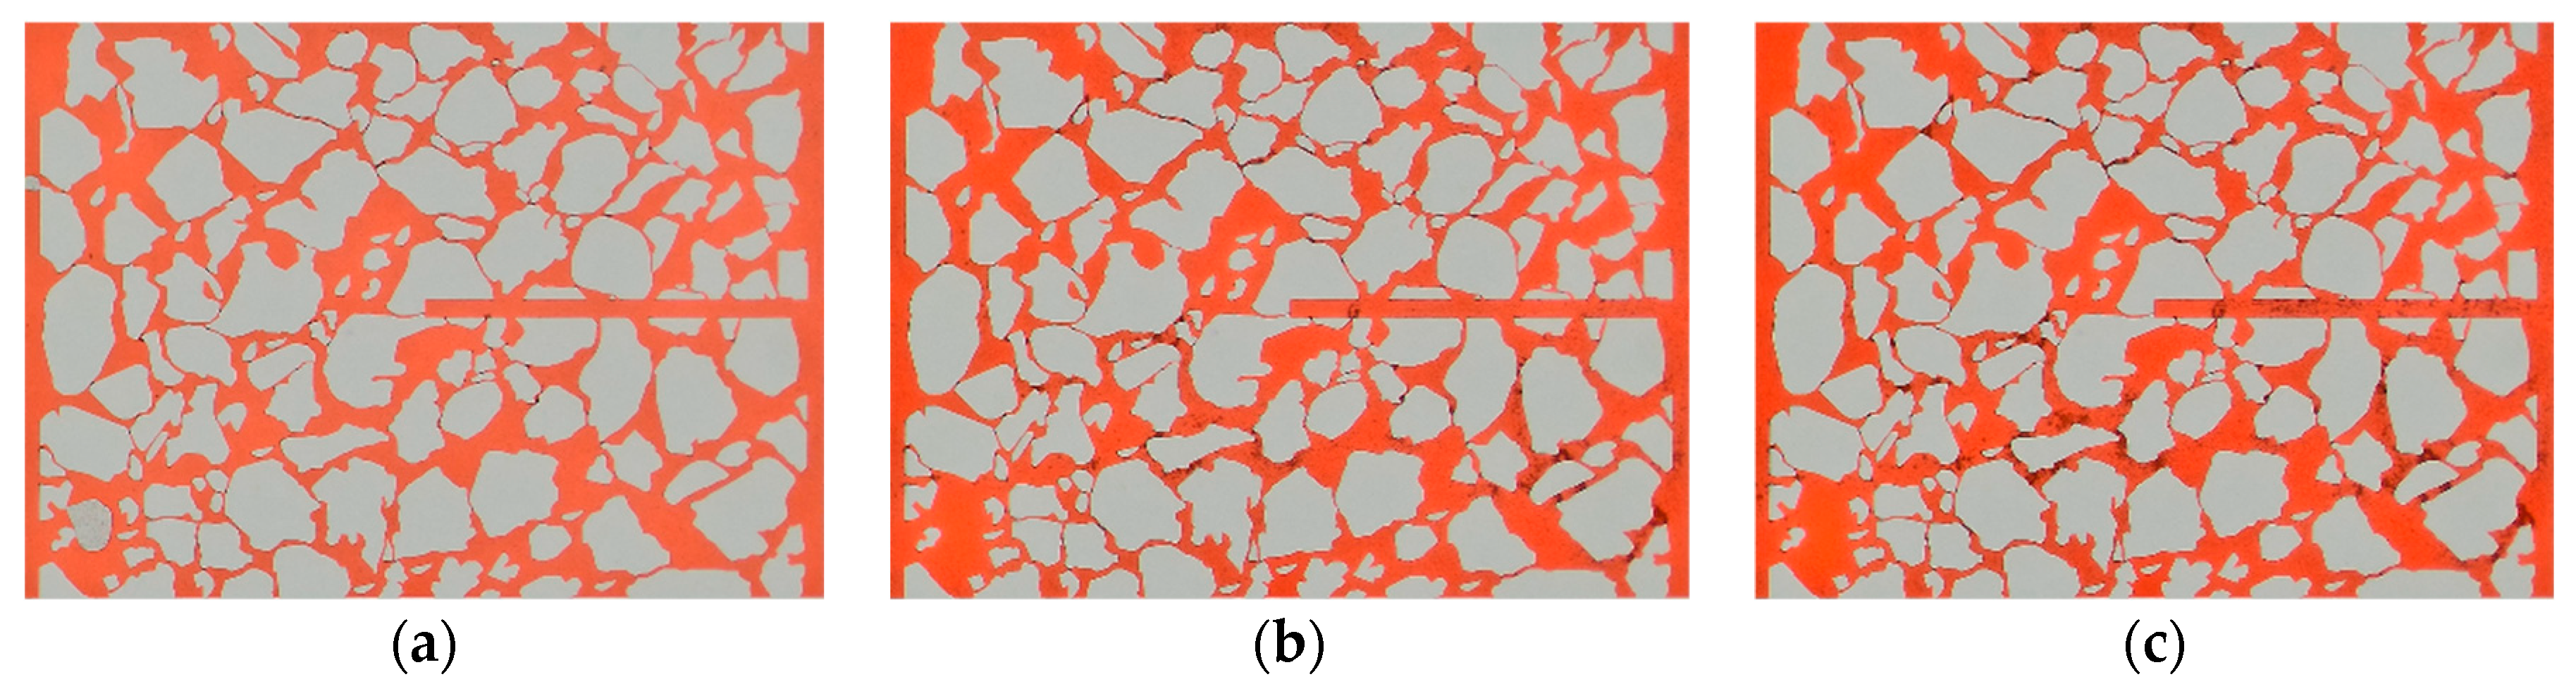
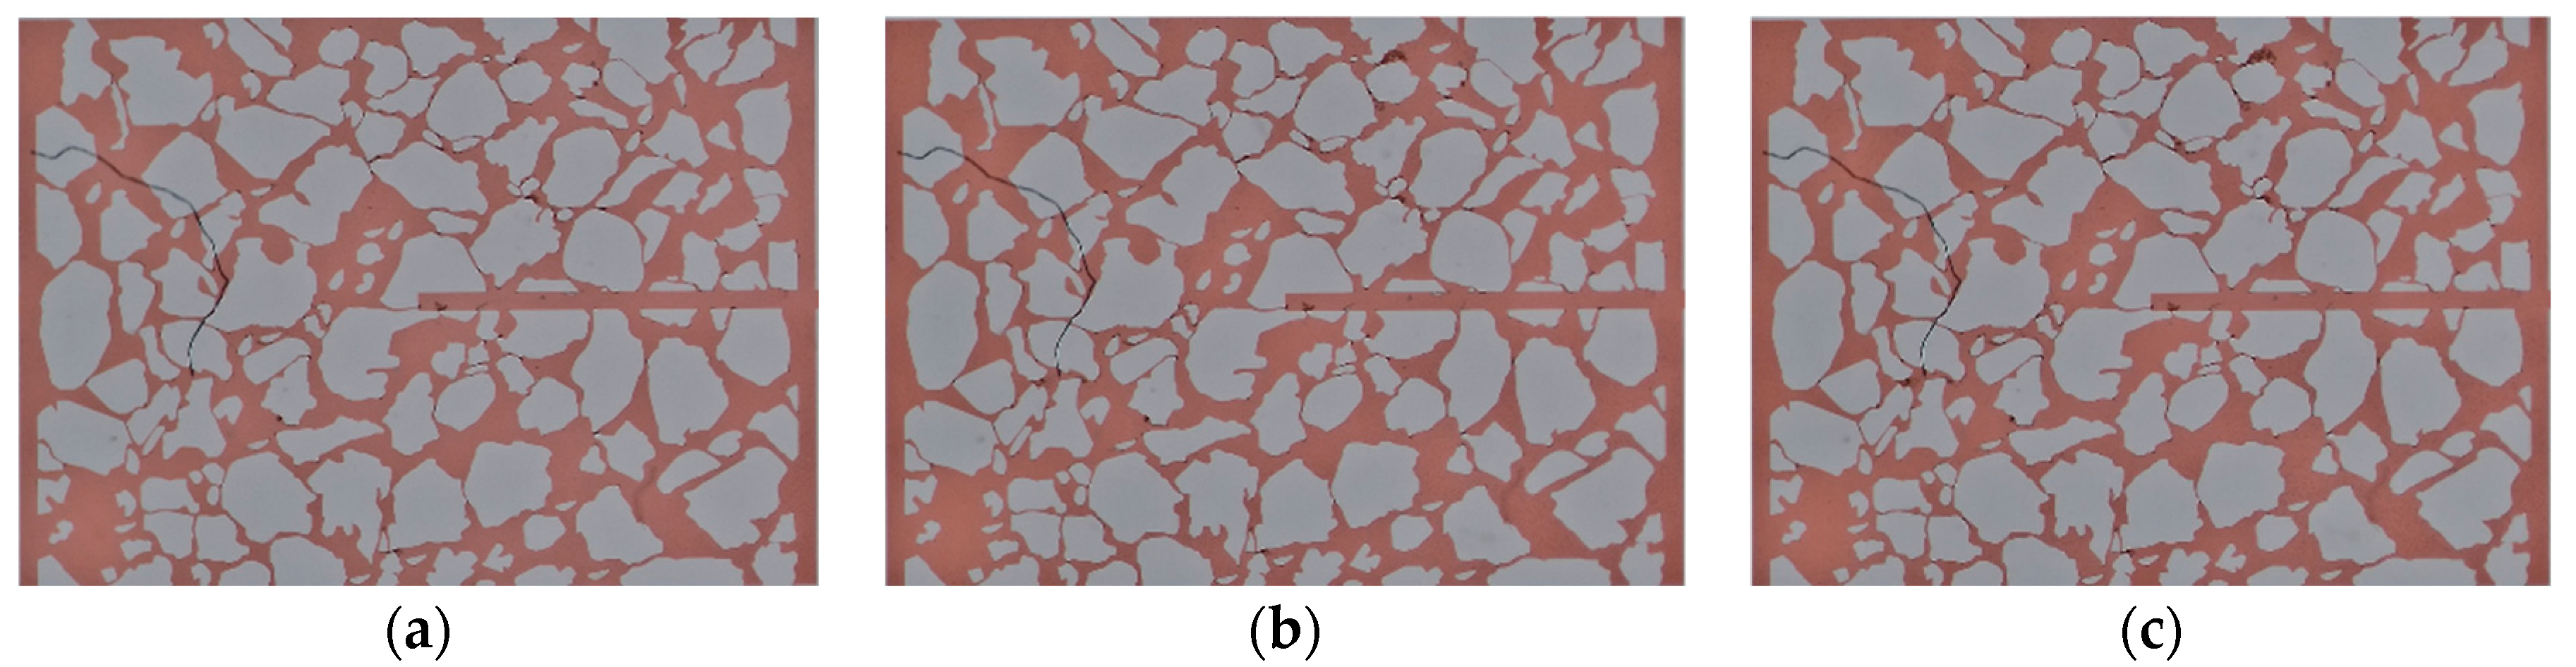
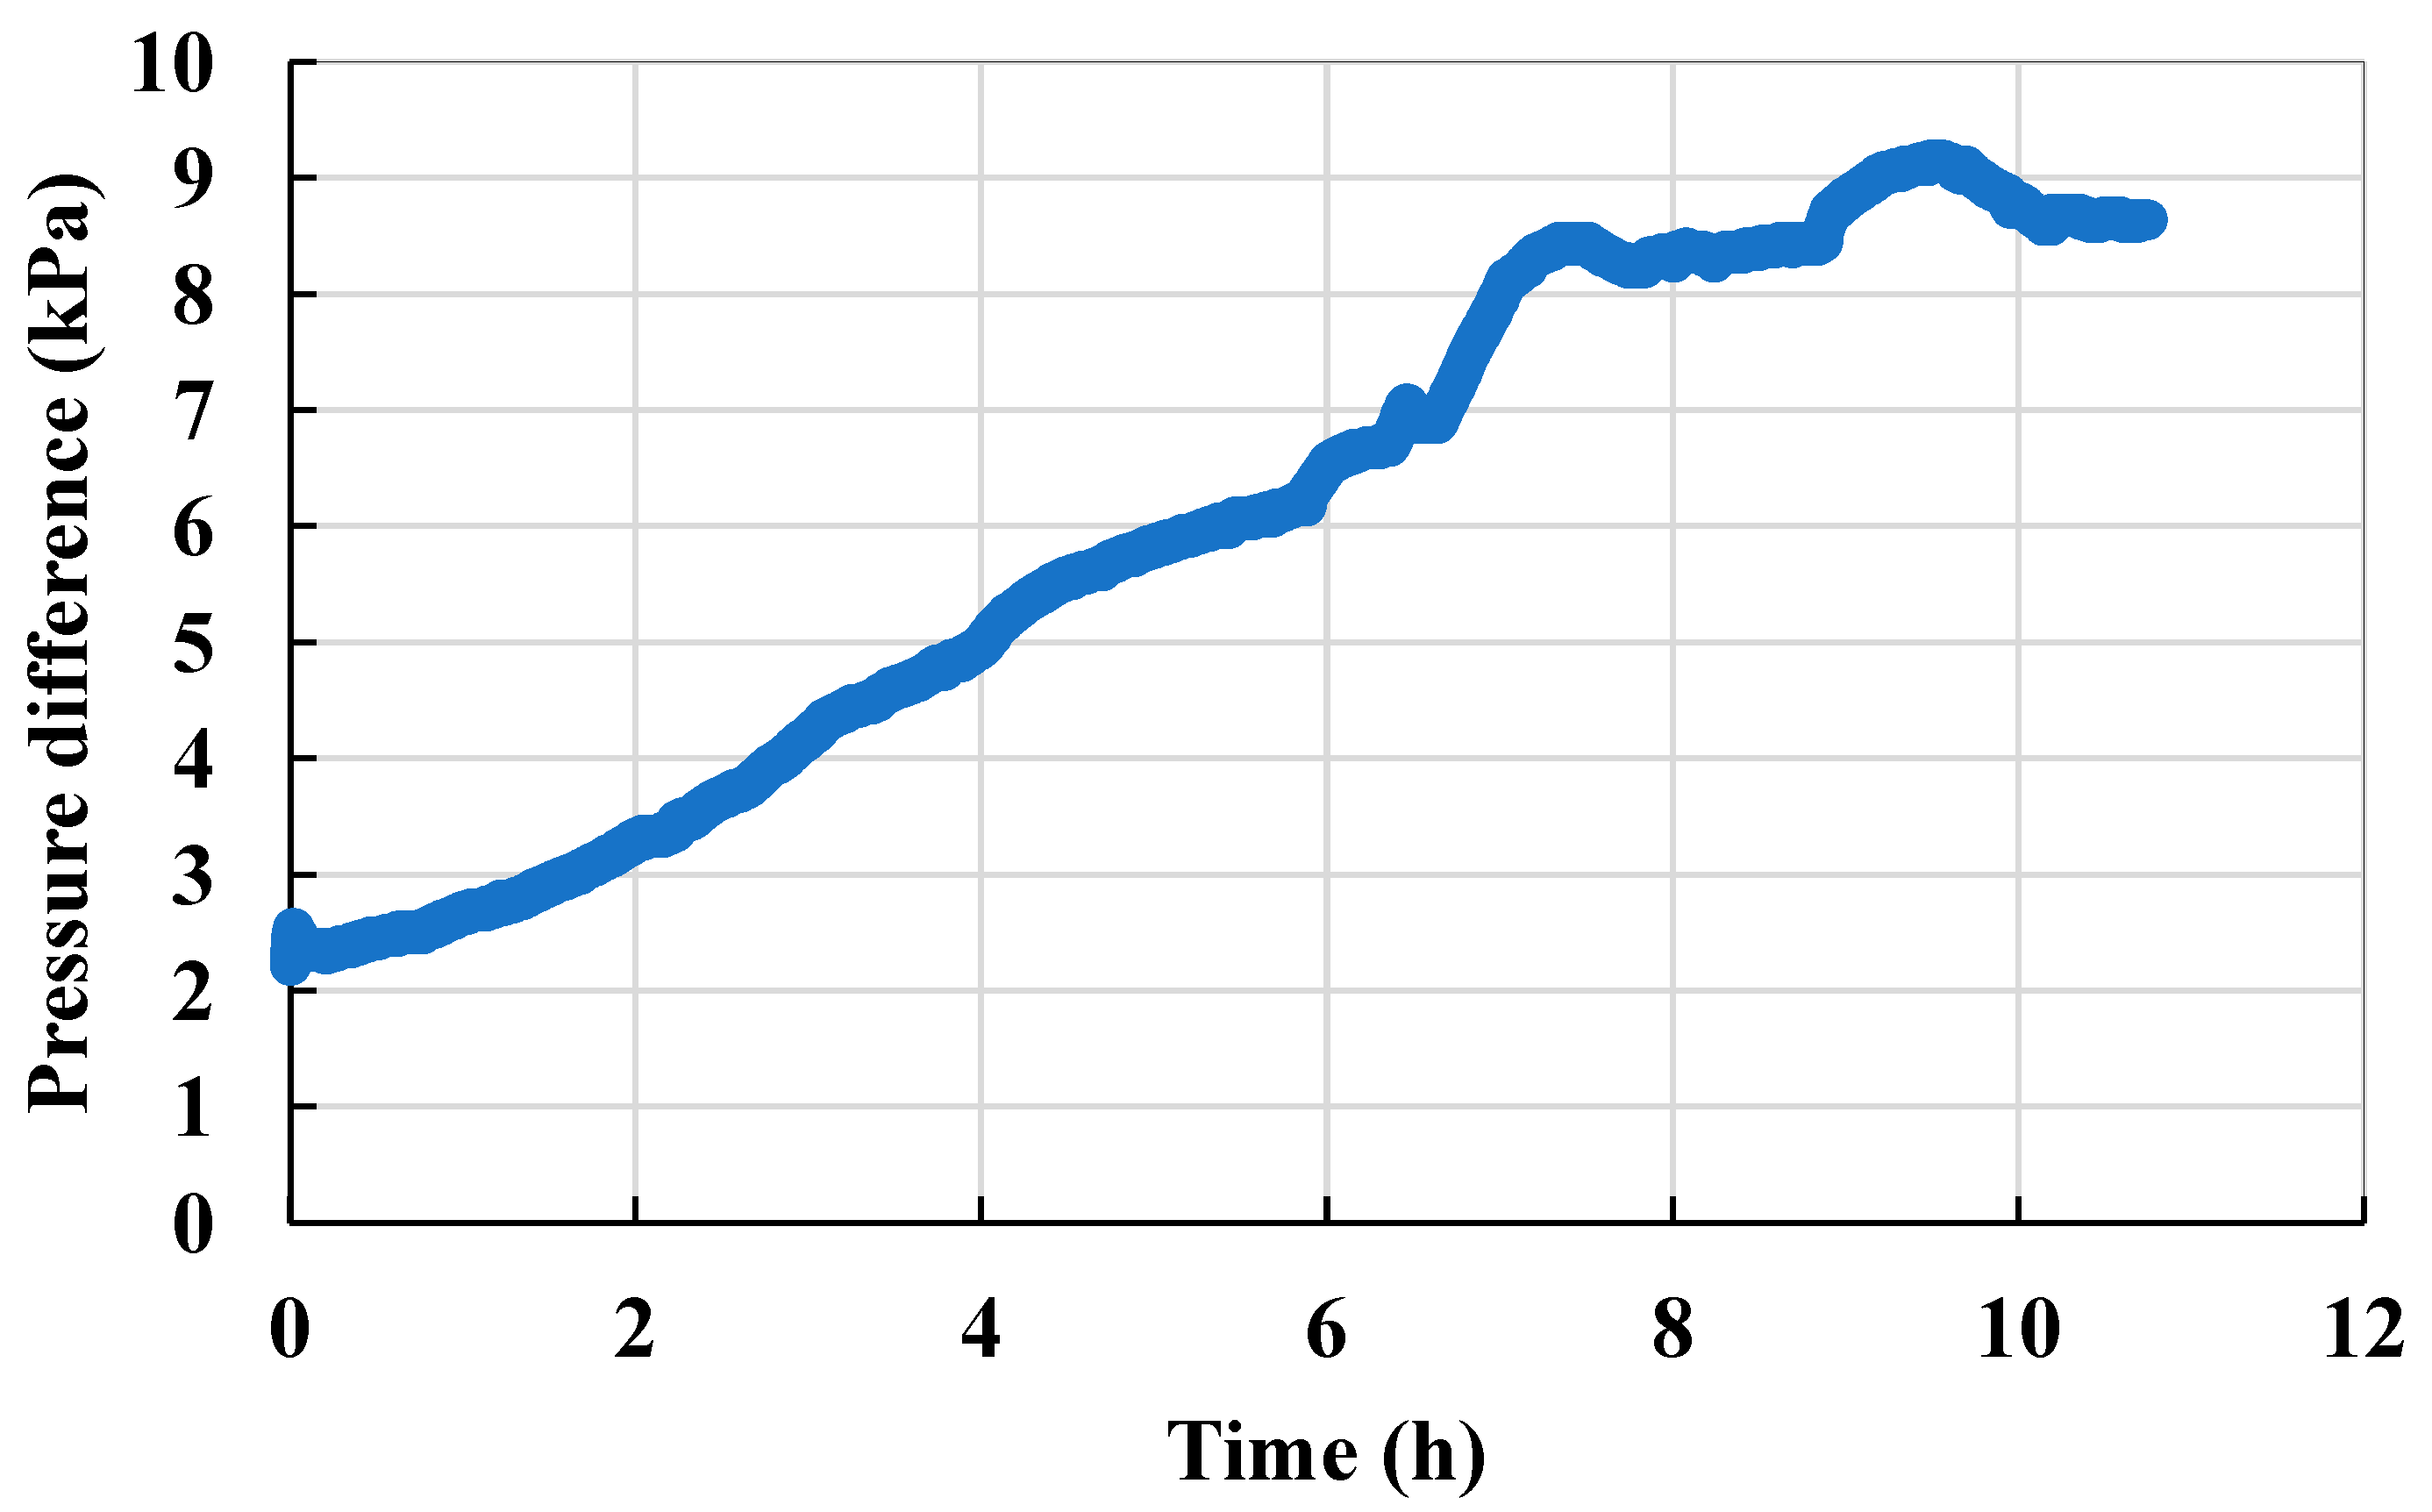
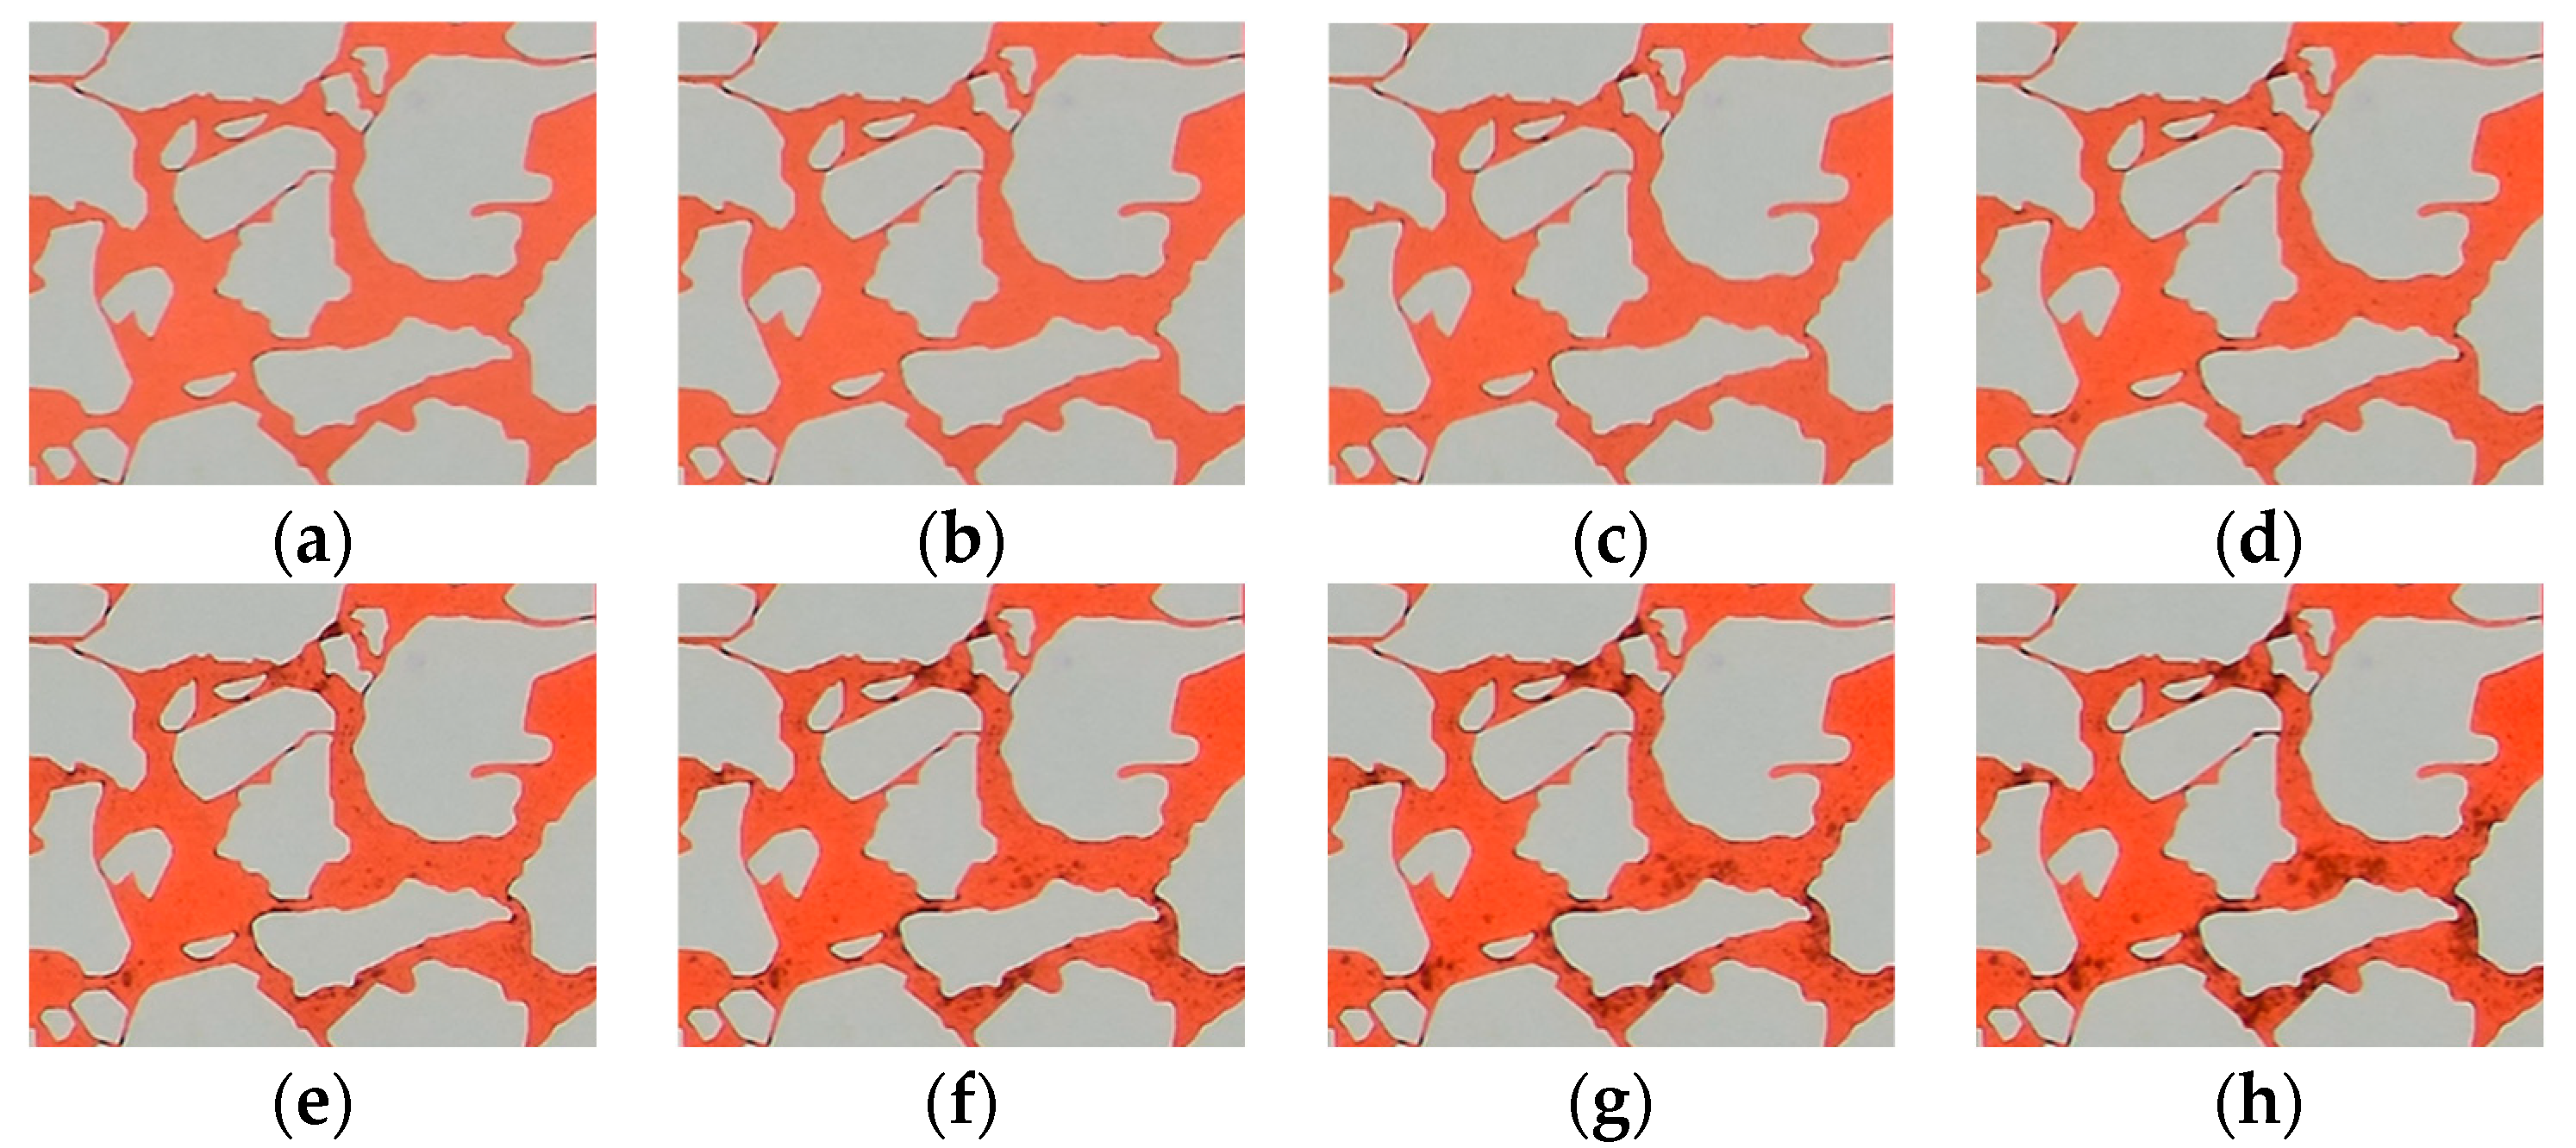
3.2. Scaling Characteristics and Patterns in Porous Media

Due to the high Ca2+ content of the formation water and its incompatibility with the injected water, water injection into the formation water led to significant scaling (Figure 9). As a result, the permeability decreased, the injection pressure increased, and a large amount of red scaling crystals were generated at the half-width crack and the pore throats. Before and after water flooding, the pressure difference increased from 2.2 kPa to 72.0 kPa in Scheme 1, and the permeability of the microscopic model decreased to 3% of the permeability before scaling (Figure 10), which seriously affected the flow capacity of the pore structure.
The scaling after water flooding in Scheme 2 was less severe than that in Scheme 1 (Figure 11), with the pressure difference having increased from 1.8 kPa to 6.59 kPa, and the permeability of the microscopic model decreased to 46% of the permeability before scaling (Figure 12).
The scaling after water flooding in Scheme 3 was between those in Scheme 1 and Scheme 2, with the pressure difference having increased from 2.2 kPa to 8.64 kPa, and the permeability of the microscopic model decreased to 24% of the permeability before scaling (Figure 13 and Figure 14).
As the water was injected into the formation water, obvious red scaling crystals were formed, demonstrating a prominent incompatibility. The scaling crystals underwent unstable precipitation, migration, and repeated scaling in the microfluidics chip (Figure 15). The injected water and the formation water were mixed first at the inlet of the model, and the supersaturated solution produced microcrystals under the stimulation of various nucleations. The microcrystals migrated under the water injection pressure and stopped migrating as they migrated to and clogged the pore throats. Therefore, the obvious red scaling crystals appeared first at the pore throats. With the continuous mixing of the injected water and the formation water, repeated crystallization and scaling occurred, with the previous microcrystals acting as crystal nuclei. With repeated scaling, the scaling crystals adhered and became tightly bound to the pore walls in the model, with most scaling crystals incapable of migrating after clumping and a few single crystals still migrating under the water injection pressure [26]. In the local scaling process of the main flow channel, smaller pore throat radii facilitated clogging by the microcrystals, leading to greater probabilities of producing observable scaling crystals and scale crystal clumps on such pore or throat surfaces.

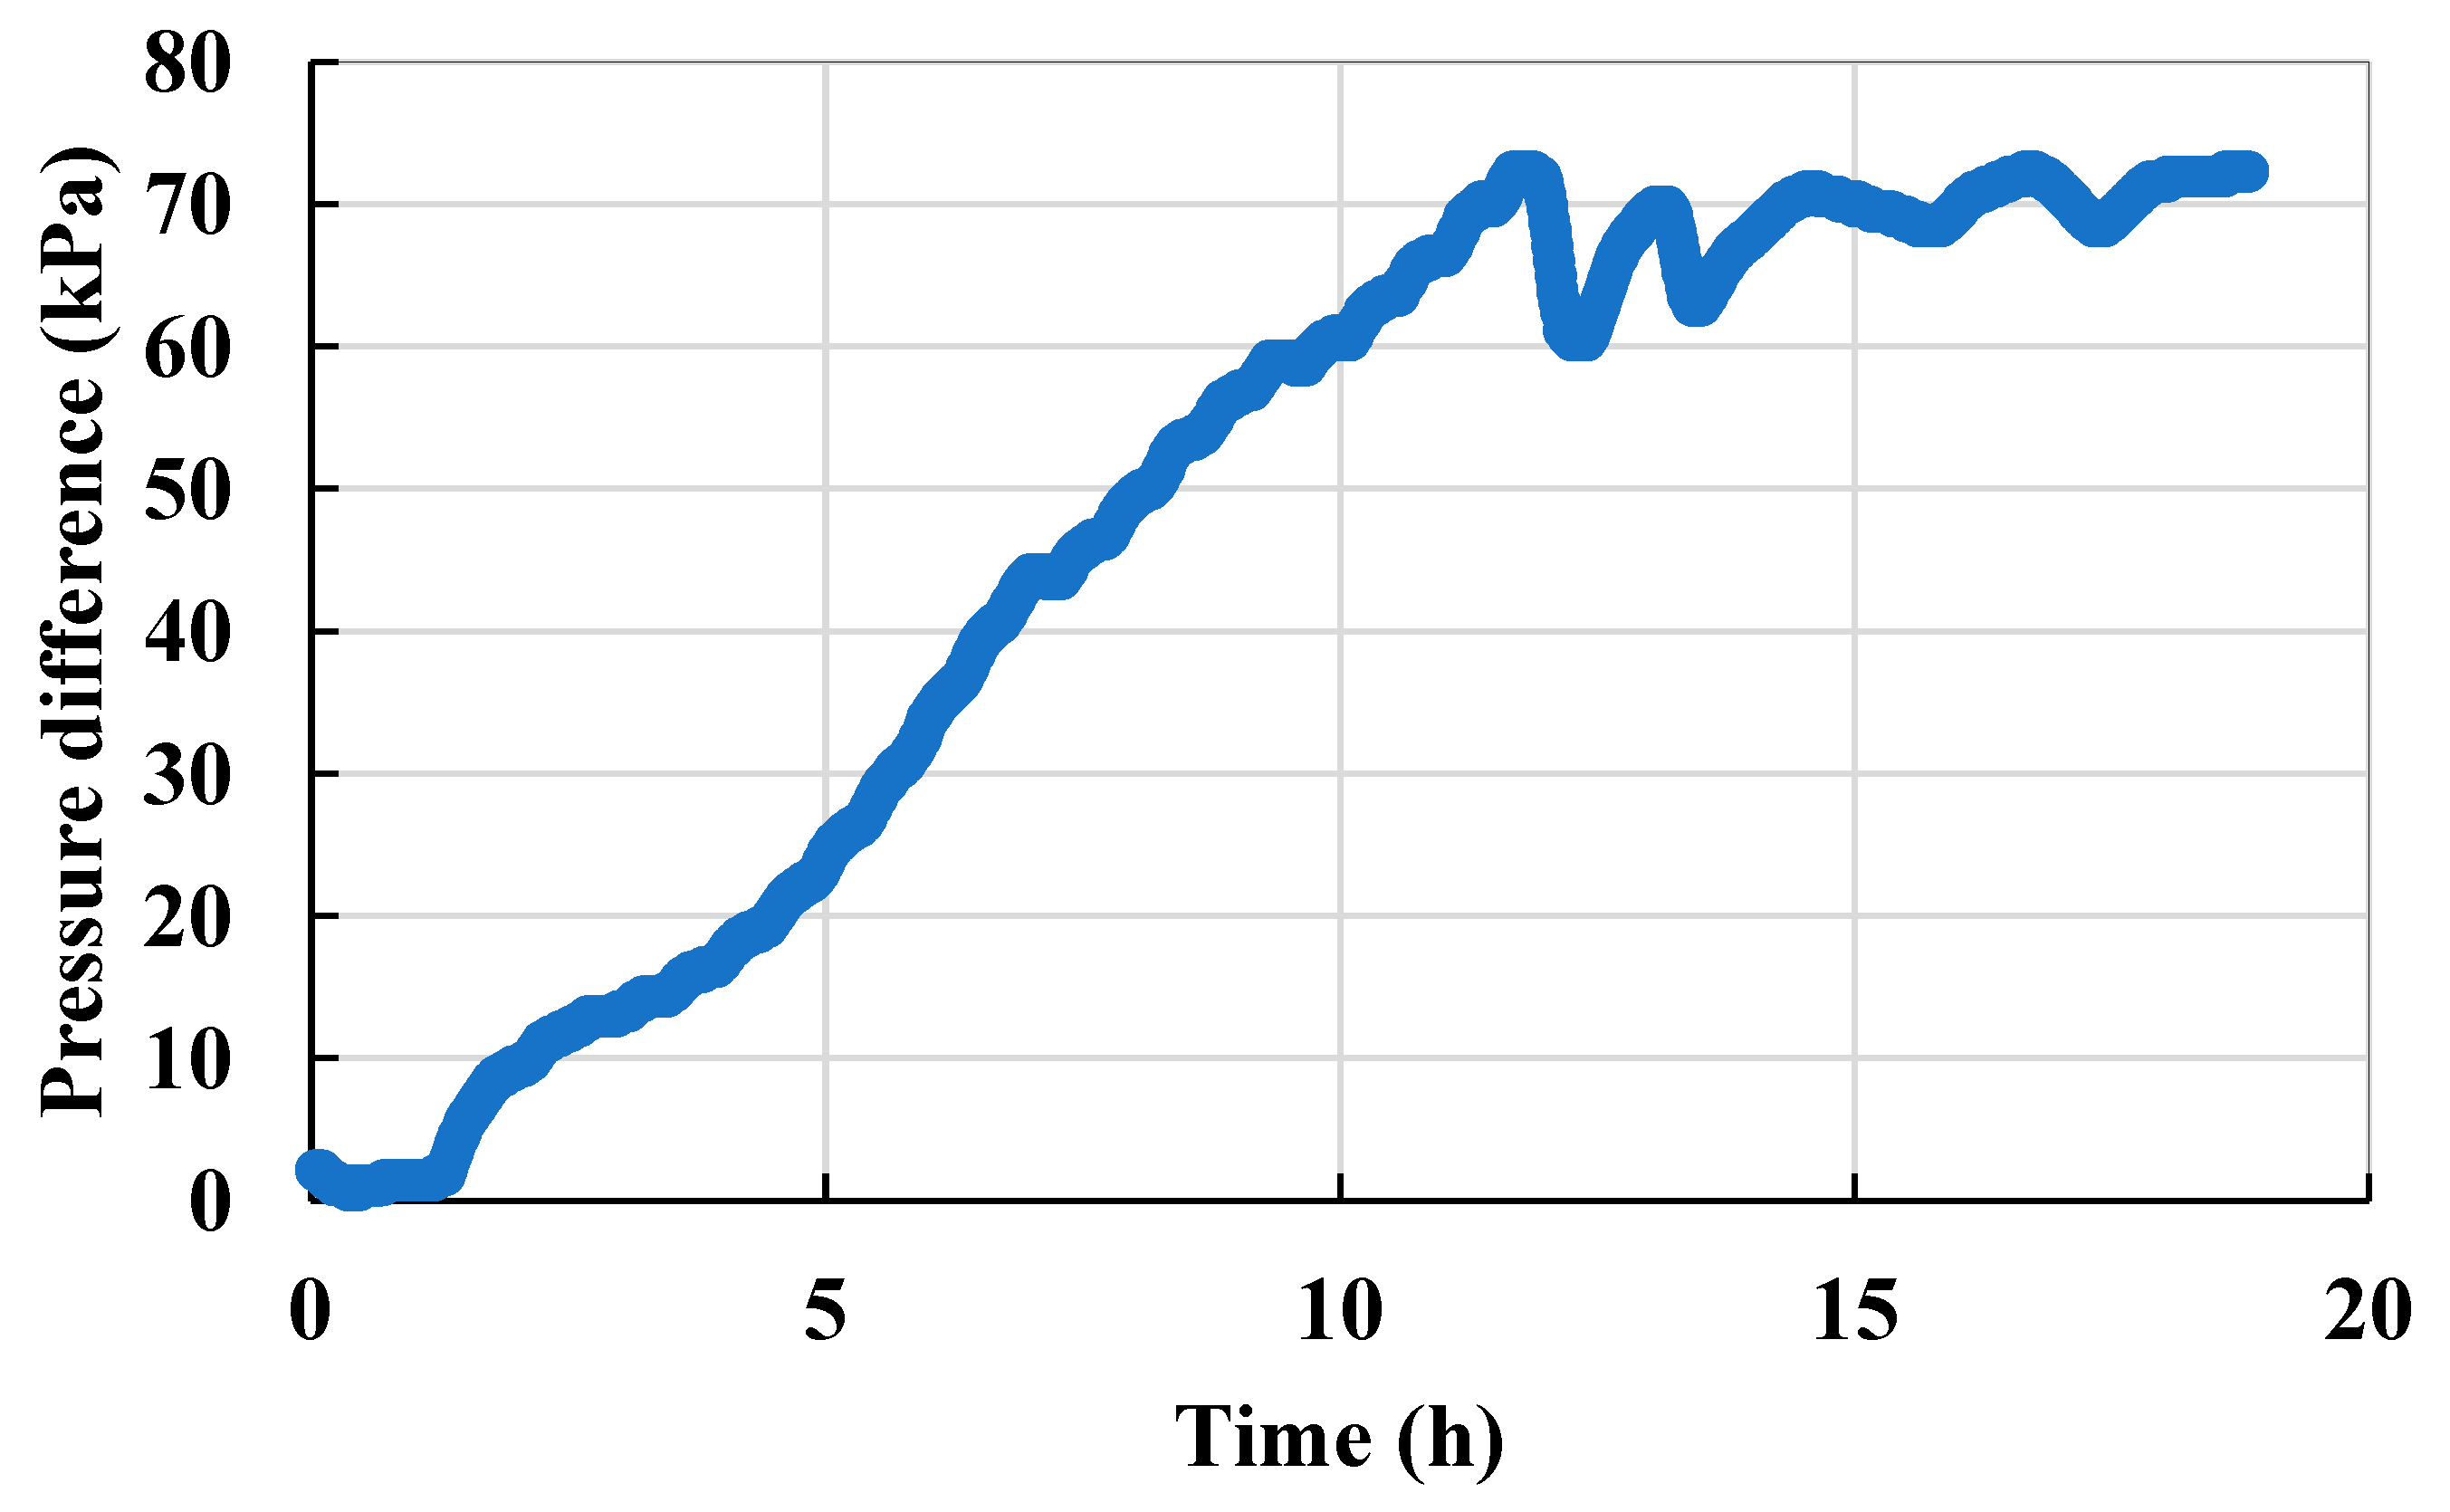
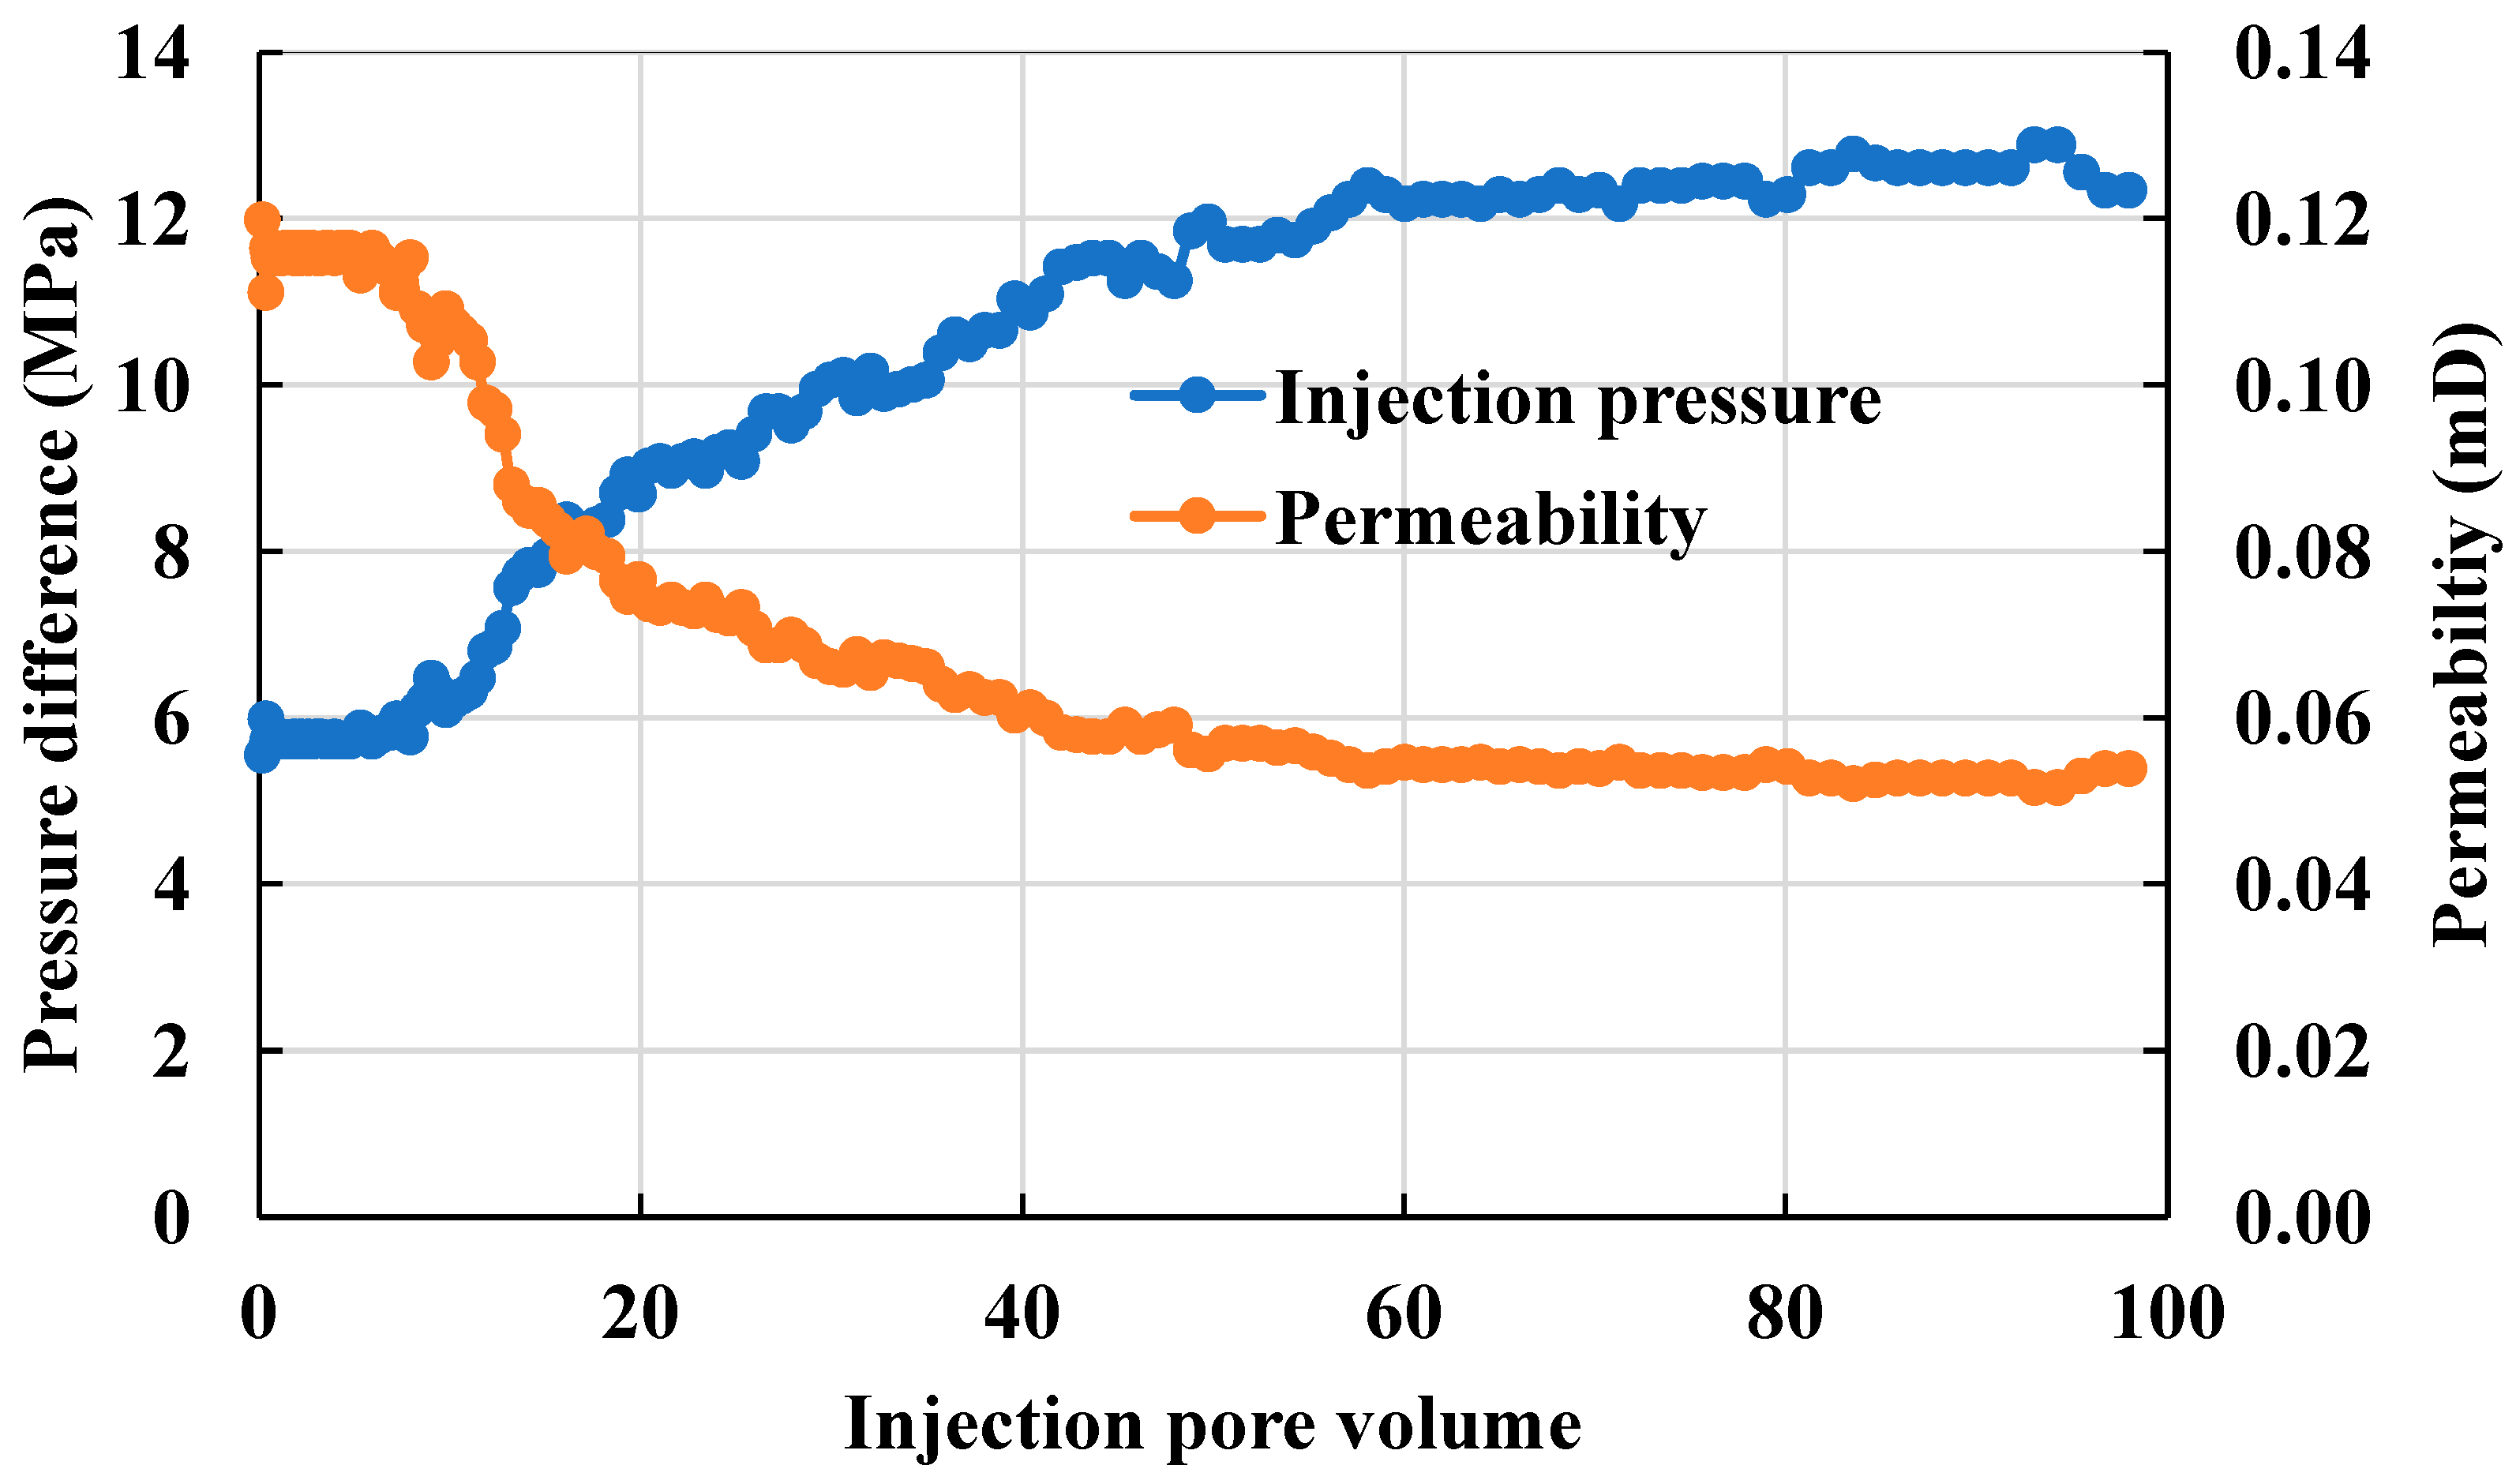
3.3. Core Permeability Variation Characteristics

The recorded changes in injection pressure and permeability in Figure 16 show the injection pressure increment is relatively smooth at the initial injection stage but gradually accelerates and finally stabilizes with the increase of the injection multiplier. As a result, the following three stages were found in the scaling process: the scaling induction stage, scaling damage stage, and scaling stabilization stage. With an 8.5 PV injection, the permeability decreased significantly while the injection pressure increased, indicating the end of the scaling induction stage and the initiation of the scaling damage stage. As the injection increased to 47 PV, the permeability and injection pressure stabilized, indicating the initiation of the scaling stabilization stage. Considering the microfluidic experiments, the scaling process in the reservoir mainly comprised supersaturation, crystal nucleation, crystal aggregation, crystal growth, and final crystal deposition. The scaling crystals deposited in the macropores migrated with the water and eventually clogged the smaller pore throats; pore throats with smaller radii were more likely to be clogged by the microcrystals. The final permeability damage rate reached 55%.

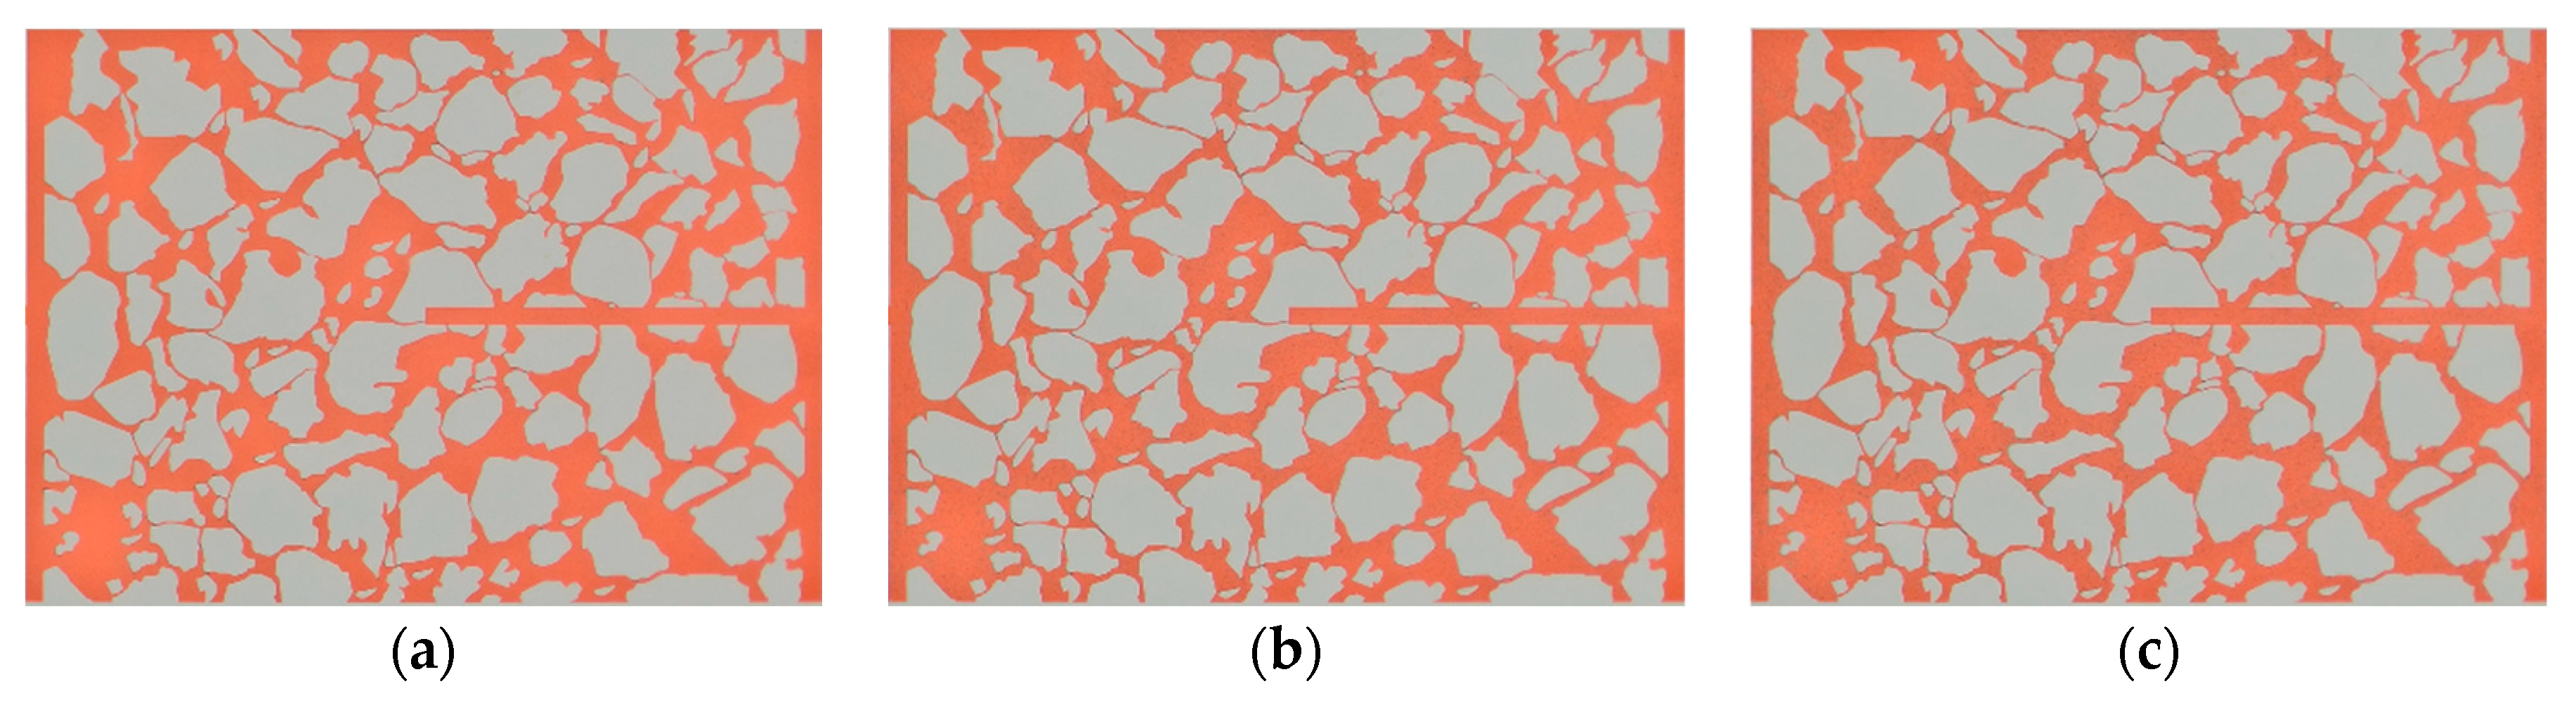
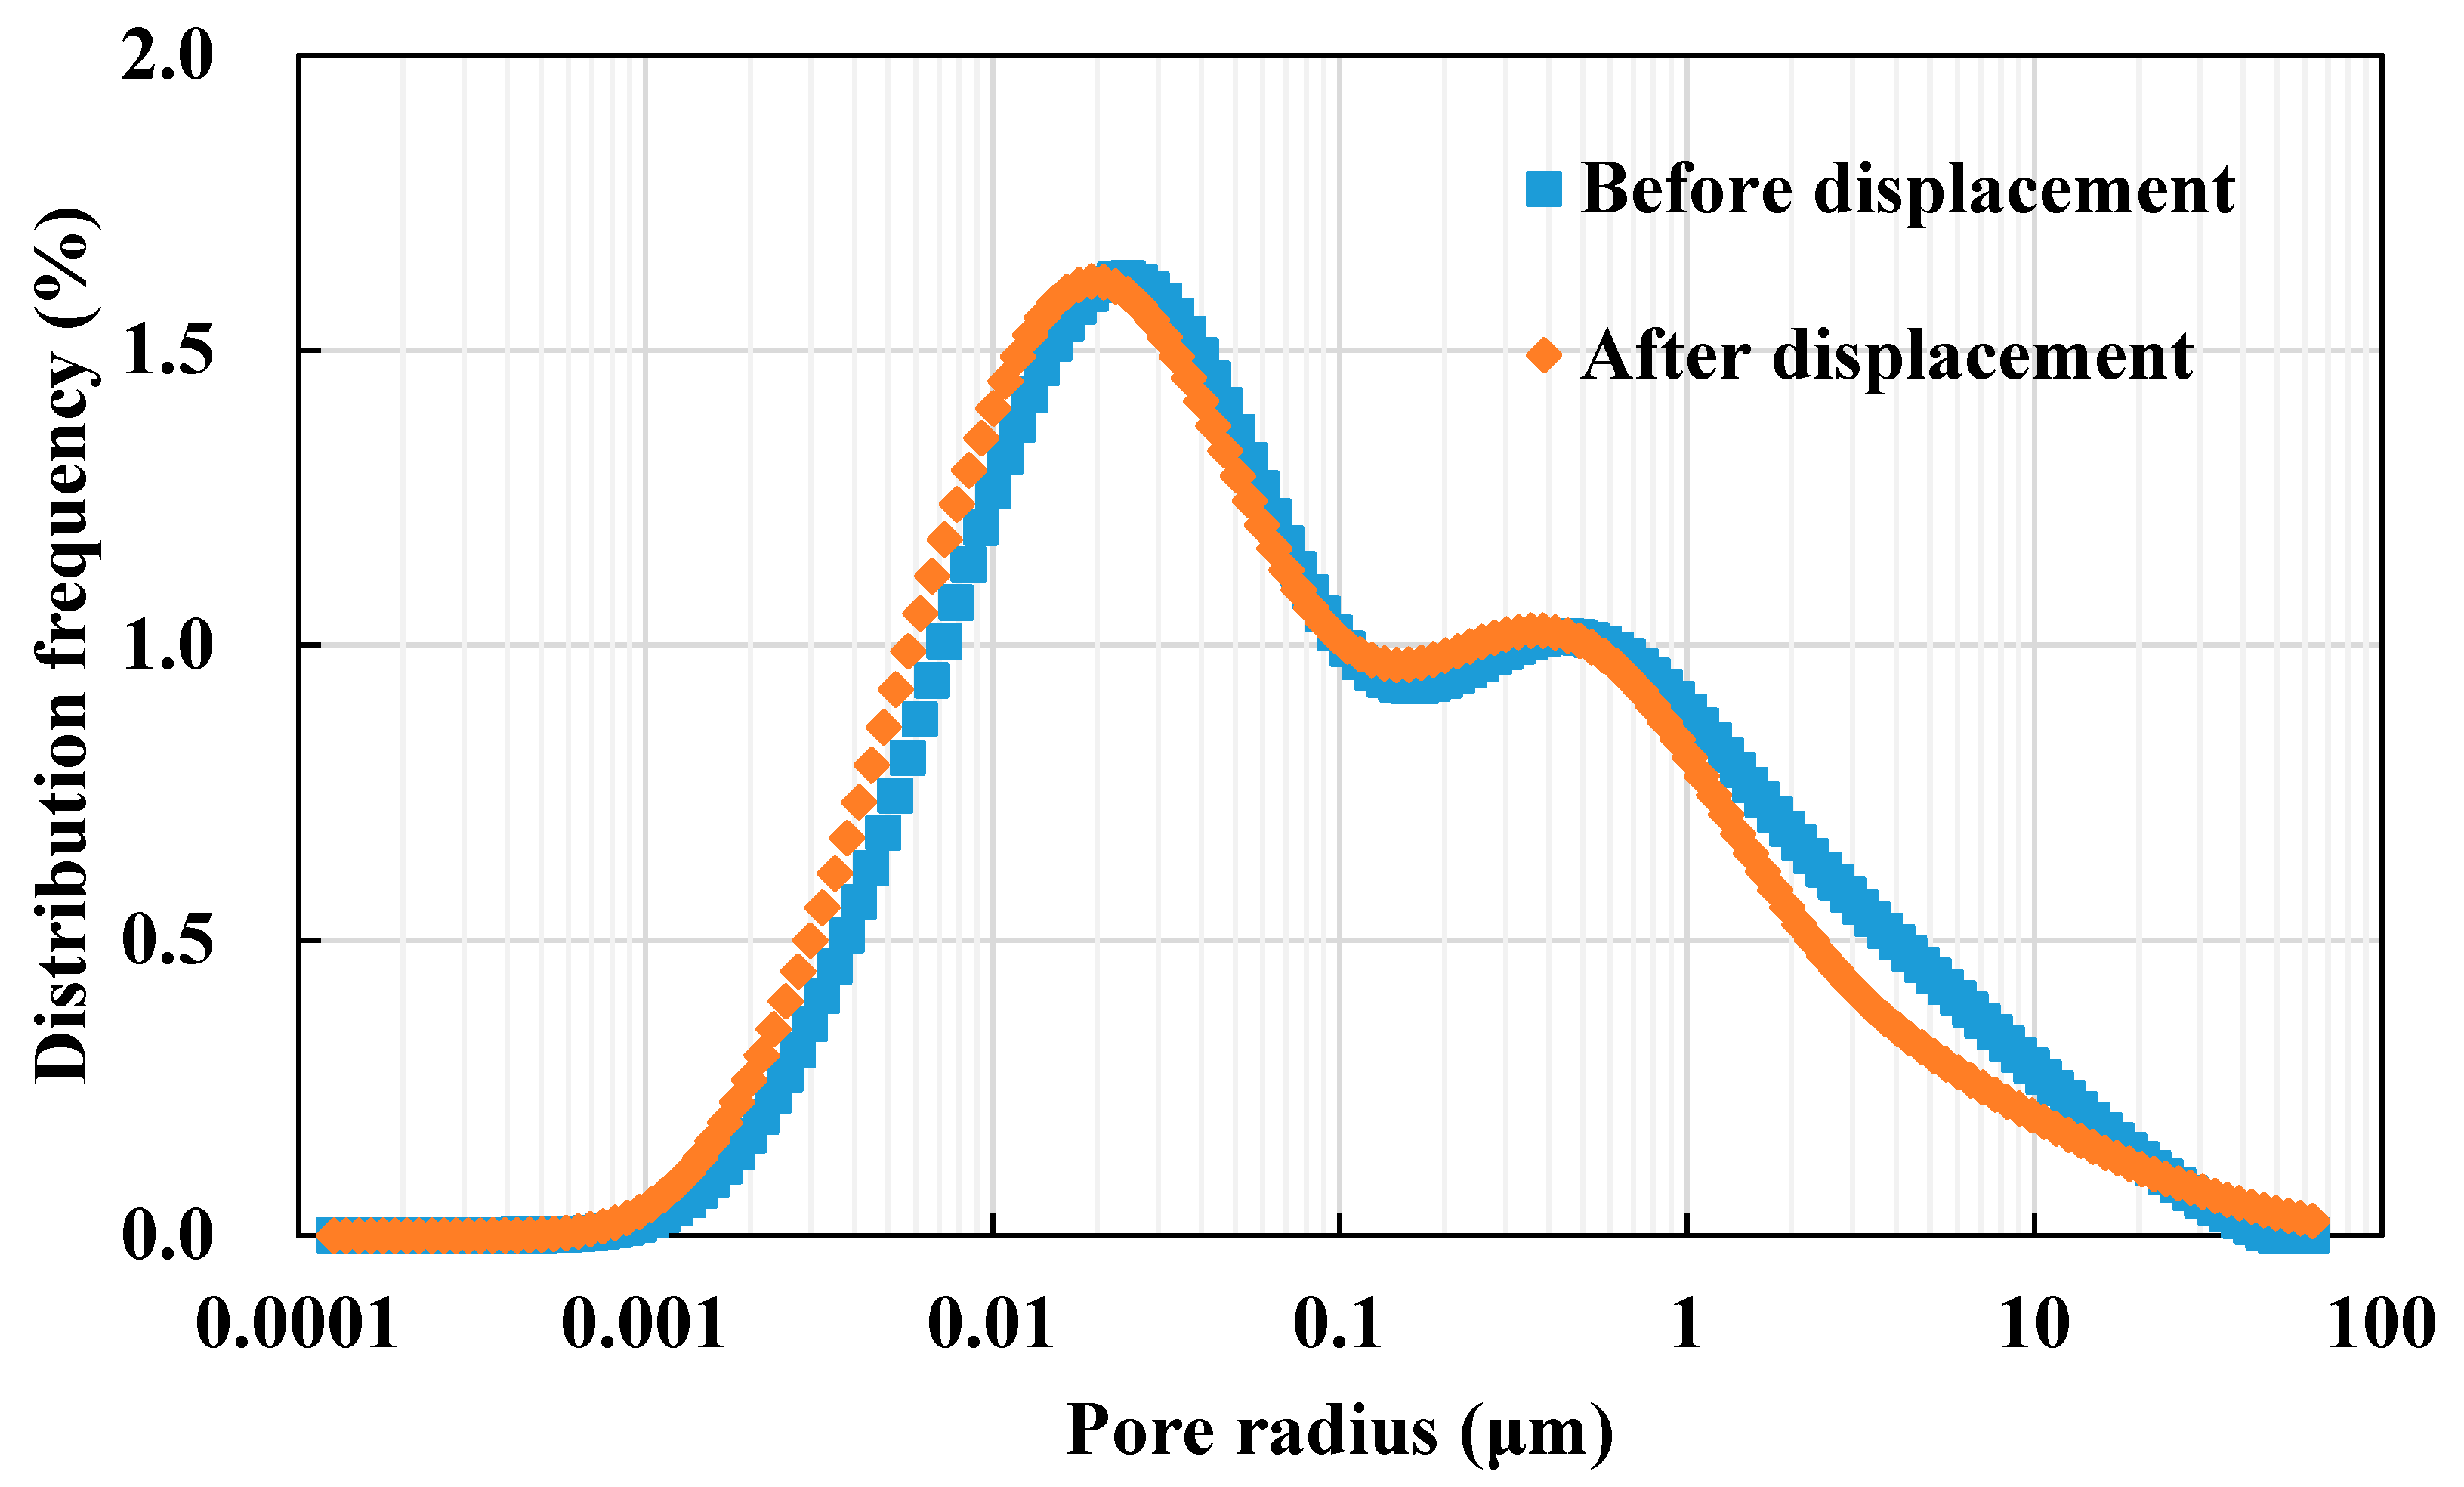
3.4. Pore Structure Variation Characteristics

NMR scanning was performed before and after the experiment to obtain the NMR T2 spectra. According to the relationship between the NMR transverse relaxation time and the pore radius, the NMR T2 spectra can be converted into the pore radius distribution curve, as shown in Figure 17. It can be seen that the injected water and the formation water mixing leads to scaling in the core, which alters the pore structure, manifested as an overall leftward shift of the pore radius distribution curve. Calculations yielded that the median pore radius was reduced from 0.0731 μm before displacement to 0.0573 μm, with a reduction of 21.61%.
According to Table 3, the core mainly comprises minipores. Therefore, the filling and clogging effects of scaling on the pore spaces are significant, especially the micropore and minipore spaces. The filling and clogging by the scaling products increased the proportion of micropore and minipore spaces by 27.23% and 1.47%, respectively, and decreased the proportion of mesopore and macropore spaces by 21.62% and 1.72%, respectively. The migration, clogging, and accumulation of the scaling crystals in the pores, especially in the smaller pores, reduced the pore spaces and clogged the seepage channels, thus reducing the permeability and fluid transmission efficiency.

4. Discussion

The results of this experimental study provide a comprehensive understanding of the scaling process in ultra-low permeability reservoirs, which is a critical issue in the oil and gas industry. The results indicate that the quality of the injected water and formation water in the studied block is unstable, exhibiting a carbonate self-scaling trend. This aligns with the findings of Liu et al. [5] and Zhang et al. [6], who reported similar instability in water quality, leading to scaling issues. The distinctive network configuration of the blocks and the radial distribution of the scaling products, predominantly comprising calcium carbonate and aluminosilicate, are in accordance with the observations made by Merdhah et al. [23,27] and Moghadasi et al. [24]. However, our study provides further insight into the dynamic process of scaling in porous media, which has been less explored in previous research. During the initial phase of water injection, microcrystals are produced as a result of the mixing of injected water and formation water. As a consequence of the microcrystals being of a smaller size than the throat size, a significant decrease in permeability does not occur, which is the scale induction period. An increase in the PV number to 8.5 results in a decrease in permeability of only 0.005 mD. As the injected water and formation water continue to mix, microcrystals continue to be produced and migrate with the water flow. They then stagnate and block at the small pore throats, resulting in a significant decrease in permeability. This is regarded as the scaling damage period. An increase in the PV number from 8.5 to 47 results in a decrease in permeability of 0.048 mD. As the concentration of injected water rises, the formation of larger crystals from microcrystals is observed. The majority of the scale crystals adhere to the throat wall and do not continue to migrate, forming stable blockages and thus entering the scaling stabilization stage. An increase in the PV number from 47 to 98 is accompanied by a decrease in permeability of 0.005 mD. The microfluidic research conducted by Zhu et al. also demonstrated that the scale accumulated at the front of the chip was transported by the water flow to the back of the chip, where it formed large particles that further exacerbated the blockage [3]. This finding is corroborated by the results of our own experiments.
The methodology employed is distinguished by its integrated approach, which combines a number of different techniques, including static experiments, nuclear magnetic resonance (NMR) scanning, displacement experiments, and microfluidic experiments. The aim of this approach is to assess the scaling pattern in porous media. This comprehensive strategy allows for a more detailed analysis of the scaling process and its impact on reservoir damage than is possible with the singular experimental methods used in previous studies. The combination of microfluidic experiments and NMR scanning offers a distinctive opportunity to observe the progression of pore damage during water flooding in real time, a methodology that has not been previously documented in the literature. The scaling damage to the core permeability can be classified into three distinct phases: the induction period, the damage period, and the stabilization period. By monitoring the injection pressure and permeability curves during water flooding, the phases in question have been delineated, thereby offering a clearer understanding of how scaling affects permeability over time. This classification system offers a more detailed and sophisticated understanding of the scaling process and its impact on reservoir permeability, which has not been previously established in the existing literature. The methodology enables a more accurate estimation of the point at which scaling significantly affects permeability, which is crucial for the timing of interventions to mitigate scaling effects.
Incompatibility between the injected water and the formation water can result in formation scaling issues in low-permeability oil fields. The formation of scaling arises from the growth of water-mixed crystals, which can occur both within the pore space and at the throat. Despite the relatively weak degree of scaling, low-permeability oil formation scaling results in more pronounced damage. The damage caused by scaling in an oil reservoir is a complex phenomenon that is influenced by the chemical composition of the water and the permeability of the reservoir, even when only considering the effects of temperature and pressure. In general, an increase in the concentration of the scale-forming ions in water results in a reduction in oil reservoir permeability and an intensification of scaling damage. However, as the concentration of the scale-forming ions in water increases, the impact of oil reservoir permeability on scaling damage becomes less significant. Despite the advantages of the integrated approach, it is constrained by limitations, particularly in light of the inherent complexities of real-world water injection processes. It should be noted that the experiments were conducted under controlled laboratory conditions, which may not fully replicate the heterogeneity of reservoirs, variations in water chemistry, and the impact of multiphase flow. These factors, in conjunction with temperature, pressure and crystal growth processes, have the potential to influence the scaling process; however, they were not fully accounted for in our experimental design. Consequently, the results of the experiment may not be generalizable to all types of oil reservoirs. It is essential that future work addresses these complexities in order to enhance the applicability of their findings to a broader range of oil reservoirs. This is also the direction in which future research will progress.

5. Conclusions

(1) The quality of injected water and formation water in the studied block is unstable, with a carbonate self-scaling trend. The mixing of the two leads to different degrees of calcium loss, and their poor compatibility easily produces extensive scaling. As the temperature increases, the trend of calcium carbonate scaling becomes increasingly apparent. The scaling products exhibit a unique network structure of blocks and radial distribution, mainly composed of calcium carbonate and aluminosilicate.
(2) The scaling crystals undergo unstable precipitation, migration, and repeated scaling in the porous medium. The probability of producing observable scaling crystals and scale crystal clumps is greater with smaller pore throats. The permeability reduction is smaller with higher injected water ratios and less extensive scaling. Scaling at unsteady state injection reduces the permeability to 24% of the permeability before scaling.
(3) The scaling process is divided into the scaling induction stage, scaling damage stage, and scaling stabilization stage. The scaling crystals deposited in the macropores migrate with water and eventually clog smaller pore throats, causing the median pore radius to decrease from 0.0731 μm before displacement to 0.0573 μm, with a reduction of 21.61%. The final permeability damage rate reached 55%.

Author Contributions

Methodology, Z.G., L.Z., Z.Y. and D.K.; Validation, L.Z., T.Z., Z.Y., S.C. and D.K.; Formal analysis, Z.G. and Z.Y.; Investigation, Z.G., L.Z., Z.Z. and D.K.; Writing—original draft, Z.G. and Z.Z.; Writing—review & editing, Z.G., L.Z. and D.K.; Visualization, T.Z., S.C., Z.Z. and D.K.; Project administration, Z.G.; Funding acquisition, D.K. All authors have read and agreed to the published version of the manuscript.

Funding

The financial support of the Natural Sciences Foundation of China (No.42102163).

Data Availability Statement

Data are contained within the article.

Acknowledgments

The authors extend their heartfelt thanks to Wenbin Gao from the Institute of Rock and Soil Mechanics, Chinese Academy of Sciences, for his invaluable guidance and assistance in the analysis of the data.

Conflicts of Interest

Authors Zhaobo Gong, Leilei Zhang, Tingting Zhang, Zhong Yan and Shuping Cong were employed by the PetroChina Xinjiang Oilfield Company. The remaining authors declare that the research was conducted in the absence of any commercial or financial relationships that could be construed as a potential conflict of interest. The PetroChina Xinjiang Oilfield Company had no role in the design of the study; in the collection, analyses, or interpretation of data; in the writing of the manuscript, or in the decision to publish the results.

References

  1. Wang, X.; Dang, H.; Gao, T. Method of moderate water injection and its application in ultra-low permeability oil reservoirs of Yanchang Oilfield, NW China. Pet. Explor. Dev. 2018, 45, 1094–1102. [Google Scholar] [CrossRef]
  2. Hu, W.; Wei, Y.; Bao, J. Development of the theory and technology for low permeability reservoirs in China. Pet. Explor. Dev. 2018, 45, 685–697. [Google Scholar] [CrossRef]
  3. Zhu, J.; Tang, X.; Li, X.; Wen, Y.; Deng, Z.; Rao, D.; Yang, Z.; Liu, C. The Reservoir Injury Rules of Water Injection to an Ultralow Permeability Reservoir: Experimental Research Based on Core-NMR and Microfluidic Technology. Energy Fuels 2024, 38, 15131–15146. [Google Scholar] [CrossRef]
  4. Razavirad, F.; Heidari, S.; Shahrabadi, A. Evaluation of compatibility between formation and Injection water into the Reservoir Rock. Colloids Surf. A Physicochem. Eng. Asp. 2024, 690, 133787. [Google Scholar] [CrossRef]
  5. Liu, Z.; Shi, B.; Ge, T.; Sui, F.; Wang, Y.; Zhang, P.; Chang, X.; Liu, Y.; Wang, Y.; Wang, Z. Tight sandstone reservoir sensitivity and damage mechanism analysis: A case study from Ordos Basin, China and implications for reservoir damage prevention. Energy Geosci. 2022, 3, 394–416. [Google Scholar] [CrossRef]
  6. Zhang, L.; Tice, M.; Hascakir, B. A laboratory study of the impact of reinjecting flowback fluids on formation damage in the Marcellus Shale. SPE J. 2020, 25, 788–799. [Google Scholar] [CrossRef]
  7. Kuang, H.; Jin, G.; Gao, Z. Sedimentary facies and evolution of the lower Urho Formation in the 8th area of Karamay oilfield of Xinjiang, NW China. Cogent Geosci. 2017, 3, 1333667. [Google Scholar] [CrossRef]
  8. Wang, L.; Zhang, H.; Peng, X.; Wang, P.; Zhao, N.; Chu, S.; Wang, X.; Kong, L. Water-sensitive damage mechanism and the injection water source optimization of low permeability sandy conglomerate reservoirs. Pet. Explor. Dev. 2019, 46, 1218–1230. [Google Scholar] [CrossRef]
  9. Zohoorian, A.; Moghadasi, J.; Abbasi, S.; Jamialahmadi, M. Mixed salt scaling in porous media due to water incompatibility: An experimental investigation. In Proceedings of the SPE International Oilfield Scale Conference and Exhibition, Aberdeen, Scotland, 11–12 May 2016. SPE-179915-MS. [Google Scholar]
  10. Prisyazhniuk, V.A. Prognosticating scale-forming properties of water. Appl. Therm. Eng. 2007, 27, 1637–1641. [Google Scholar] [CrossRef]
  11. Nikoo, A.H.; Malayeri, M.R. Interfacial interactions between scale-brine and various reservoir rocks. Colloids Surf. A Physicochem. Eng. Asp. 2021, 611, 125840. [Google Scholar] [CrossRef]
  12. Zhao, R.; Liu, X.; Hu, A.; Fan, C.; Shabani, A. A novel approach for modeling permeability decline due to mineral scaling: Coupling geochemistry and deep bed filtration theory. J. Pet. Sci. Eng. 2021, 205, 108995. [Google Scholar] [CrossRef]
  13. Moghadasi, J.; Müller-Steinhagen, H.; Jamialahmadi, M.; Sharif, A. Model study on the kinetics of oil field formation damage due to salt precipitation from injection. J. Pet. Sci. Eng. 2004, 43, 201–217. [Google Scholar] [CrossRef]
  14. Mackay, E.J.; Graham, G.M. The use of flow models in assessing the risk of scale damage. In Proceedings of the SPE International Conference on Oilfield Chemistry, Houston, TX, USA, 5–7 February 2003. SPE-80252-MS. [Google Scholar]
  15. Haghtalab, A.; Kamali, M.; Shahrabadi, A.; Golghanddashti, H. Investigation of the precipitation of calcium sulfate in porous media: Experimental and mathematical modeling. Chem. Eng. Commun. 2015, 202, 1221–1230. [Google Scholar] [CrossRef]
  16. Le Beulze, A.; Santos De Pera, N.; Levaché, B.; Questel, M.; Panizza, P.; Lequeux, F.; Levant, M.; Passade-Boupat, N. Jams and cakes: A closer look on well clogging mechanisms in microscale produced water ReInjection experiments. Transp. Porous Media 2023, 147, 143–156. [Google Scholar] [CrossRef]
  17. Li, J.; Tu, B.; Li, W.; Li, Y. Quantitative Investigation of the Water-Sensitivity Damage on Ultra-LowPermeability Reservoir. In Proceedings of the Asia Pacific Unconventional Resources Technology Conference, Brisbane, Australia, 18–19 November 2019; pp. 816–832. [Google Scholar]
  18. Gao, H.; Li, H. Determination of movable fluid percentage and movable fluid porosity in ultra-low permeability sandstone using nuclear magnetic resonance (NMR) technique. J. Pet. Sci. Eng. 2015, 133, 258–267. [Google Scholar] [CrossRef]
  19. Nikoo, A.H.; Malayeri, M.R. Impact of hydrodynamic and interfacial interactions on scale formation in a capillary microchannel. Langmuir 2021, 37, 13746–13756. [Google Scholar] [CrossRef] [PubMed]
  20. Mehdizad, A.; Pourafshary, P.; Sedaee, B. Visual investigation of simultaneous clay swelling and migration mechanisms and formation damage consequences using micromodels. J. Pet. Sci. Eng. 2022, 214, 110561. [Google Scholar] [CrossRef]
  21. Gao, J.; Kong, D.; Peng, Y.; Zhou, Y.; Liu, Y.; Zhu, W. Pore-scale mechanisms and hysteresis effect during multi-cycle injection and production process in underground hydrogen storage reservoir. Energy 2023, 283, 129007. [Google Scholar] [CrossRef]
  22. Kong, D.; Peng, Y.; Zhou, Z.; Peng, H.; Chen, Z. Pore-scale mechanism of coupled pressure-driven flow and spontaneous imbibition in porous media during high-pressure water injection processes. Capillarity 2024, 13, 29–36. [Google Scholar] [CrossRef]
  23. Merdhah, A.; Yassin, A. Scale formation due to water injection in Berea sandstone cores. J. Appl. Sci. 2009, 9, 3298–3307. [Google Scholar] [CrossRef]
  24. Moghadasi, J.; Jamialahmadi, M.; Müller-Steinhagen, H.; Sharif, A. Formation damage due to scale formation in porous media resulting from water injection. In Proceedings of the SPE International Symposium and Exhibition on Formation Damage Control, Lafayette, LA, USA, 18–20 February 2004. SPE-86524-MS. [Google Scholar]
  25. Haghtalab, A.; Kamali, M.J.; Shahrabadi, A. Prediction mineral scale formation in oil reservoirs during water injection. Fluid Phase Equilibria 2014, 373, 43–54. [Google Scholar] [CrossRef]
  26. Wang, W.; Wei, W.; Ferrier, N.; Arismendi, N. Scale formation and inhibition study for water injection wells. In Proceedings of the SPE International Oilfield Scale Conference and Exhibition, Aberdeen, Scotland, 20–21 June 2018. SPE-190732-MS. [Google Scholar]
  27. Merdhah, A.B.B.; Yassin, A.A.M. Scale formation in oil reservoir during water injection at high-salinity formation water. J. Appl. Sci. 2007, 7, 3198–3207. [Google Scholar] [CrossRef]
  28. Kokkinos, N.C.; Nkagbu, D.C.; Marmanis, D.I.; Dermentzis, K.I.; Maliaris, G. Evolution of Unconventional Hydrocarbons: Past, Present, Future and Environmental FootPrint. J. Eng. Sci. Technol. Rev. 2022, 15, 15–24. [Google Scholar] [CrossRef]
Figure 1. Ultra-low permeability reservoir core casting sheet.
Processes 12 02475 g001
Figure 2. Schematic diagram of micro-model pore network and pore distribution curve.
Processes 12 02475 g002
Figure 3. Diagram of the microfluidic displacement setup.
Processes 12 02475 g003
Figure 4. Diagram of the core displacement and NMR setup.
Processes 12 02475 g004
Figure 5. Changes in (a) HCO3, (b) pH, and (c) calcium loss rate under different injected water (IW)–formation water (FW) mixing ratios.
Processes 12 02475 g005
Figure 6. Changes in (a) saturation index, (b) stability index, and (c) Ca2+ and SO42− molar concentrations under different injected water–formation water mixing ratios.
Processes 12 02475 g006
Figure 7. Microscopic morphology of scaling products at different magnifications. (a) magnification 300×, (b) magnification 10,000×, and (c) magnification 30,000×.
Processes 12 02475 g007
Figure 8. Energy spectra of scaling products at different locations.
Processes 12 02475 g008aProcesses 12 02475 g008b
Figure 9. Real-time microscopic views of the steady-state experiment (Scheme 1). (a) 4 h injection. (b) 8 h injection. (c) end of injection.
Processes 12 02475 g009
Figure 10. Injection pressure curve of the steady-state experiment (Scheme 1).
Processes 12 02475 g010
Figure 11. Real-time microscopic views of the steady-state experiment (Scheme 2). (a) 4 h injection. (b) 8 h injection. (c) end of injection.
Processes 12 02475 g011
Figure 12. Injection pressure curve of the steady-state experiment (Scheme 2).
Processes 12 02475 g012
Figure 13. Real-time microscopic views of the steady-state experiment (Scheme 3). (a) 4 h injection. (b) 8 h injection. (c) end of injection.
Processes 12 02475 g013
Figure 14. Injection pressure curve of the steady-state experiment (Scheme 3).
Processes 12 02475 g014
Figure 15. The local scaling process is at the main flow channel. (a) 1 h, (b) 2 h, (c) 3 h, (d) 4 h, (e) 5 h, (f) 6 h, (g) 7 h, and (h) 8 h.
Processes 12 02475 g015
Figure 16. Real-time water injection pressure and permeability variation curves.
Processes 12 02475 g016
Figure 17. Pore radius distribution curves before and after displacement.
Processes 12 02475 g017
Table 1. Conventional water quality analysis.
Concentration mg/LNa+ + K+Mg2+Ca2+Cl SO 4 2 HCO 3 pHMineralization DegreeWater Type
Well
I781924.32178.311,33252.5518367.7221,242 NaHCO 3
P684227.02104312,04610.9714.87.520,683 CaCl 2
Table 2. Microfluidic displacement experiment conditions.
Flow Rate Ratio (Formation Water: Injected Water)Injection StateTemperature (°C)Scheme
1:5Steady state691
5:1Steady state692
\Unsteady state693
Table 3. Spatial proportions of different pores.
Macropore
(>10 μm)
Mesopore
(>1 μm, ≤10 μm)
Minipore
(>0.01 μm, ≤1 μm)
Micropore
(≤0.01 μm)
Porosity %
2.3216.5167.9513.22Before displacement
2.2812.9467.9616.82After displacement
Disclaimer/Publisher’s Note: The statements, opinions and data contained in all publications are solely those of the individual author(s) and contributor(s) and not of MDPI and/or the editor(s). MDPI and/or the editor(s) disclaim responsibility for any injury to people or property resulting from any ideas, methods, instructions or products referred to in the content.

