Article

Simulation and Experiment on Hull Lower Welding Deformation Using Heat Source Shape

1
Purpose Built Mobility Group, Korea Institute of Industrial Technology, Gwangju 61012, Republic of Korea
2
Department of Metallurgical Engineering, Jeonbuk National University, Baekje-daero, Deokjin-gu, Jeonju-si 54896, Republic of Korea
*
Author to whom correspondence should be addressed.
Processes 2024, 12(12), 2628; https://doi.org/10.3390/pr12122628
Submission received: 12 August 2024 / Revised: 28 October 2024 / Accepted: 19 November 2024 / Published: 22 November 2024

Abstract

:
To effectively use aluminum, which is inherently weak under heat, as a material for hull construction, it is crucial to precisely predict the thermal deformation in the weld zone. Most studies employing finite element (FE) methods to predict thermal deformation due to welding typically use estimated heat source conditions based on the results of the weld. However, these estimated values can differ significantly from the actual welding conditions. In this study, we investigated whether using the actual shape of the heat source, rather than an estimated value, can serve as a reliable condition for analysis in predicting thermal deformation. This prediction is essential for minimizing deformation in the fillet welds of an aluminum hull. To compare deformation outcomes, Al 5083, commonly used in hull construction, was selected as the base material. The thermal deformation of aluminum hull fillet welds, welded using the Cold Metal Transfer (CMT) welding method, which reduces heat input, was measured. The simulation results demonstrated similar deformation trends, with discrepancies ranging from a minimum of 0.02 mm to a maximum of 1.4 mm when using actual welding conditions and heat source shapes. The results of this study confirm that the actual heat source shape can be utilized as a reliable condition for predicting thermal deformation in aluminum hull welds. The aim is to contribute to the improvement of aluminum hull manufacturing quality by providing essential data for establishing welding conditions and minimizing deformation.

1. Introduction

The increasing global emphasis on environmentally friendly and recyclable solutions has led the marine industry to explore new materials for hull construction. Among various materials, aluminum is gaining significant attention for hull manufacturing due to its recyclability, lightness, excellent durability, and corrosion resistance [1,2,3,4,5]. Despite these advantages, the use of aluminum in hulls presents certain challenges related to welding. Aluminum’s inherent weakness to heat makes it prone to thermal deformation, which can easily compromise the quality of the hull [6,7,8,9]. Welding, which is essential in hull manufacturing, causes uneven local temperature distribution within the material [10,11,12,13]. The local temperature gradients generated by repetitive heating and cooling transients during welding lead to rapid thermal expansion and contraction in the weld zone and the surrounding heat-affected zone, resulting in deformation [14,15,16]. Since the heat applied during welding can cause distortion, create defects within the hull, and reduce structural quality, predicting and managing thermal deformation in hull manufacturing is a crucial step to ensure the reliability and performance of aluminum hulls [17,18,19,20,21,22]. Thermal deformation caused by welding is influenced by several factors, including material properties, the design of the weld area, and welding process conditions. Providing these conditions as accurately as possible in a simulation environment is essential for predicting thermal deformation [23,24].
For the selection of simulation conditions for thermal deformation, Sadeghi-Chahardeh et al. [25] derived and applied equilibrium equations governing thermal stress to choose appropriate simulation conditions for circular annular plates. Cheng Li et al. [26] predicted welding deformation for double-layer shell parts using the heat distribution formula and heat-affected area calculation method of T-joints, applying transverse and longitudinal inherent strains as well as anisotropic thermal expansion coefficients as welding simulation conditions. In addition to the method of selecting welding simulation conditions using calculation formulas, Chen et al. [27] conducted a three-dimensional thermo-elasto-plastic finite element analysis based on 12 cases of residual stress caused by welding. They considered factors such as welding sequence, distance from the starting point, and other conditions. The results showed that welding deformation could be effectively predicted along with the influence of these conditions, but systematic details on the selection of simulation conditions were not provided. Other studies include that of Tan et al. [28], who performed a finite element (FE) analysis of the residual stress occurring during the welding process of a nuclear power rotor pipe and demonstrated the accuracy of the simulation results. However, since the modeling was based on photographs of the welded part of the nuclear power rotor pipe for the development of the FE model, the selection of simulation conditions was not carried out. These foundational studies are used to predict the thermal deformation that occurs during processes at various industrial sites. However, most studies [29,30,31,32,33] use the shape and dimensions of the heat source in finite element method (FEM) simulations as estimates based on other variables in the simulation and the welded result. Actual welding, however, may exhibit different trends. Therefore, it is crucial to investigate whether the reliability of the analysis conditions can be ensured when the actual welding heat source’s shape and dimensions, rather than the estimated values, are used in the simulation process for predicting welding thermal deformation.
In this study, we investigated whether the heat source shape of a fillet weld, obtained from the welding process of the transverse model actually used in the lower part of an aluminum hull, can be used as a reliable analysis condition to predict thermal deformation. First, optimal welding conditions for use in the FE model were derived based on the weld bead shape obtained from fillet welding experiment results. Using the actual welding conditions and the heat source shape of the weld bead formed accordingly, we predicted the thermal deformation at various locations of the transverse model used in the lower part of the hull and compared it with the deformation measurement results from actual welding. The results of this study show that the FE model, which utilizes the heat source shape obtained from the welded area, provided accurate predictions of thermal deformation for the transverse fillet weld located at the bottom of the aluminum hull. This study offers practical foundational data for predicting welding deformation in aluminum hulls, addressing the issue of thermal deformation due to welding.

2. Experimental Methods and Simulation Conditions

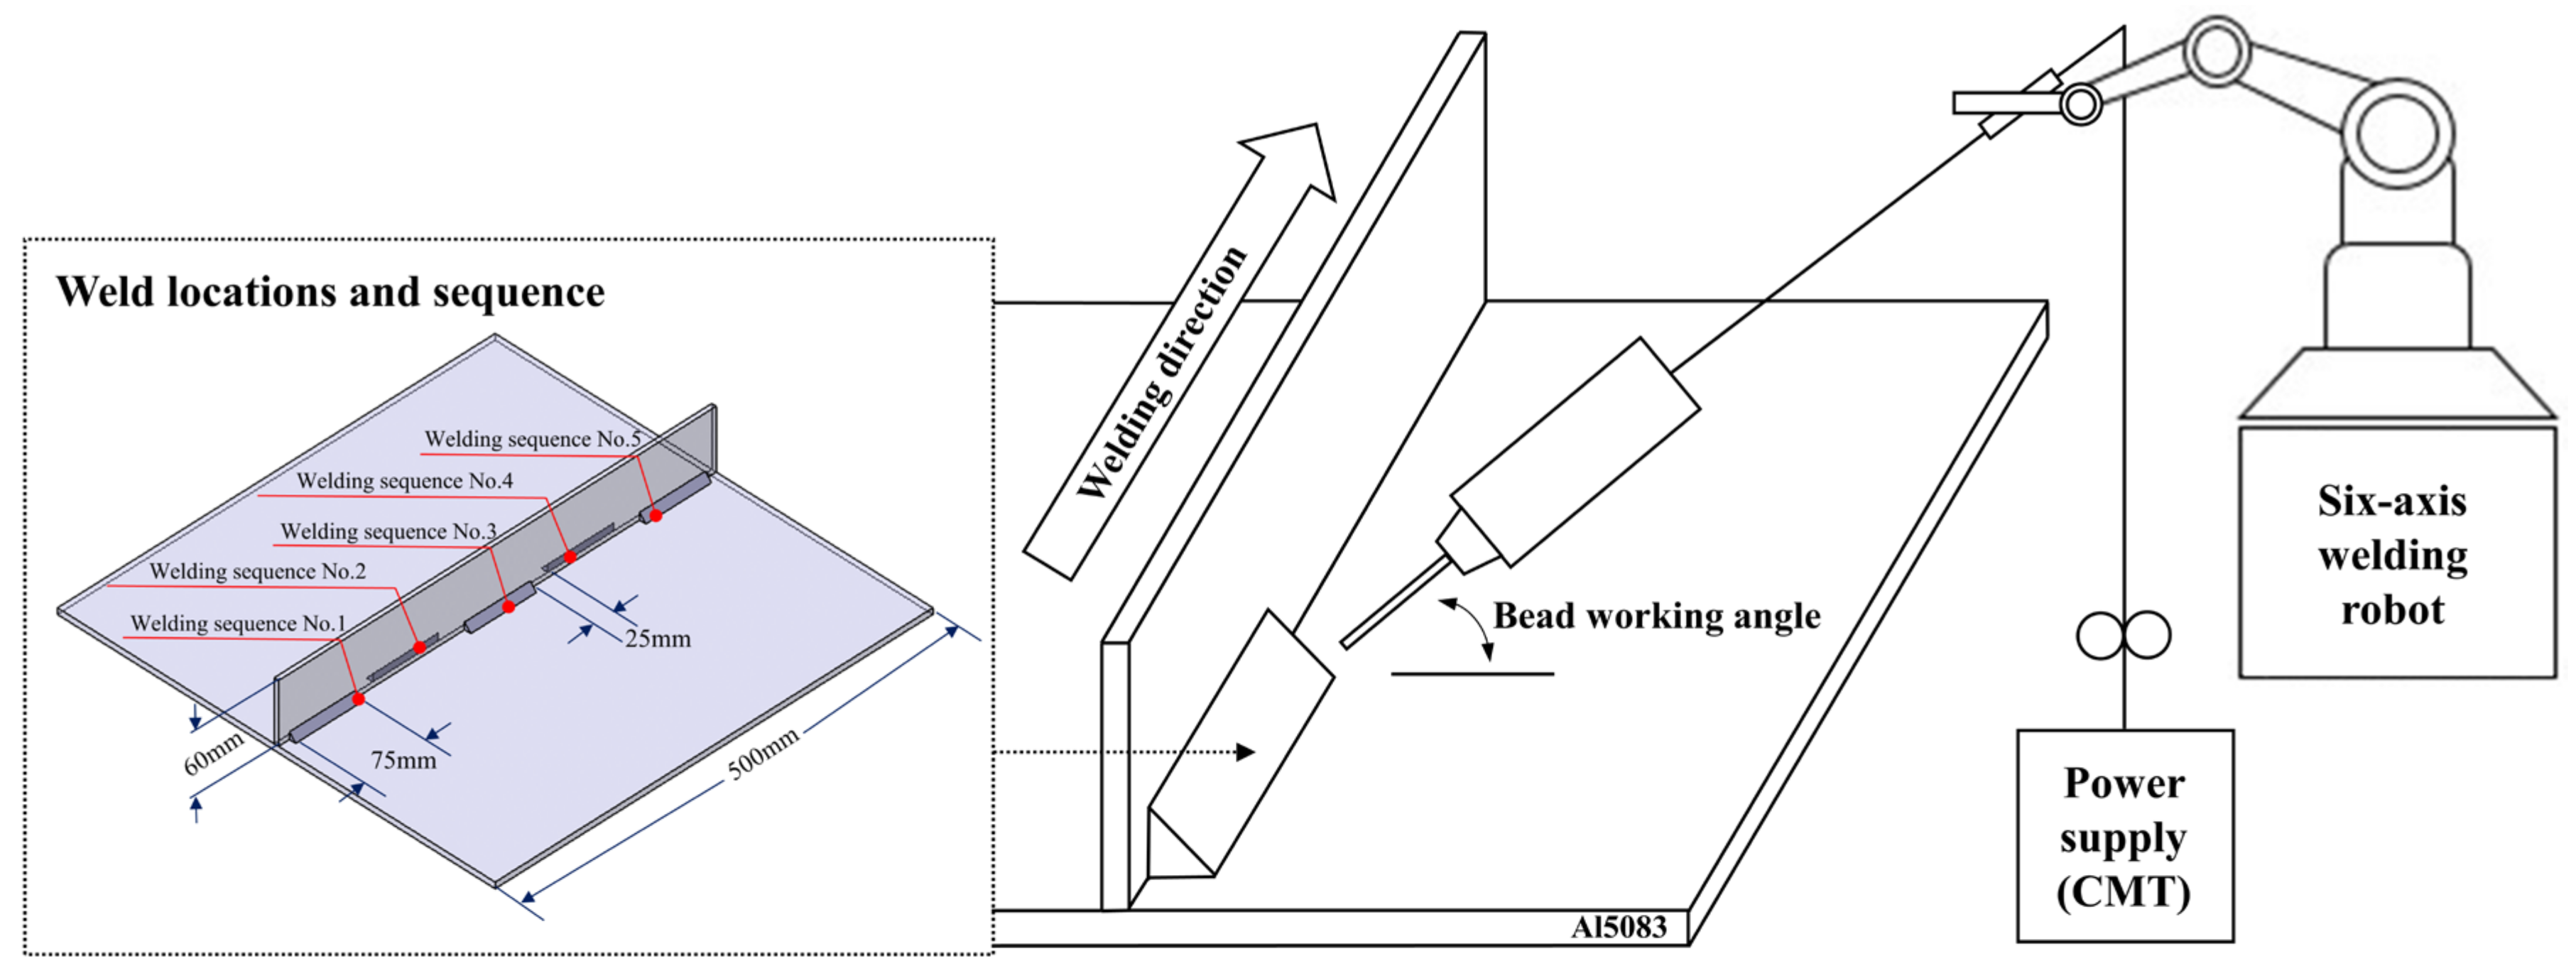
2.1. Welding Experimental Configuration

In the aluminum fillet welding experiment, fillet welds were performed on Al 5083 specimens with dimensions of 500 mm × 500 mm × 6 mm (t) with a 5 mm thick Al 5083 specimen vertically abutting them. The filler metal used was Al 5183 material wire, which is actually used for welding Al 5083 material. The chemical composition of the Al 5183 material used is shown in Table 1, and the chemical composition of the Al 5083 material used as the base metal is shown in Table 2.
For the fillet welding experiment, a GMAW (gas metal arc welding) process was performed using a 6-axis articulated robot (Yaskawa(Japan), MH6) and a CMT welder (Fronius(Austria), Advanced 4000 R). The CMT process was used to reduce the amount of input heat in the welding process according to the characteristics of the aluminum material used for the welding wire and base material. The configuration of the experimental equipment used in this study is shown in Figure 1.
The welding experiments were conducted at a contact tip to workpiece distance (CTWD) of 15 mm and a bead working angle of 45°. To form a stable weld bead, high-purity Ar 99.9% was used as the shielding gas, and the experiments were conducted at a flow rate of 20 L/min. In order to achieve good welding on the Al 5083 specimen covered with oxide film, surface polishing was performed before the welding experiment. A total of five consecutive welds were performed on 75 mm lengths. The fillet welds were welded alternately on an upright 5 mm thick Al 5083 specimen, and the distance between the welds was 25 mm.
Three conditions of current and voltage and three conditions of welding speed were selected as process variables in the welding experiments conducted with Al 5183 welding wire, and the experiments were conducted according to the full factorial design. The process variables used in the experiments are shown in Table 3. At 37.5 mm of the weld bead where the fillet weld was performed, a high-speed cutting machine (Allied(USA), Techcut5) was used to cut the cut surface in the vertical direction of the weld bead, and etching was performed for 10 s in a 100:3 ratio of water to hydrofluoric acid. The etched fillet welds were measured using a digital optical microscope (Leetech(Republic of Korea), portable welding microscope) with a resolution of 2 Mega pixels.

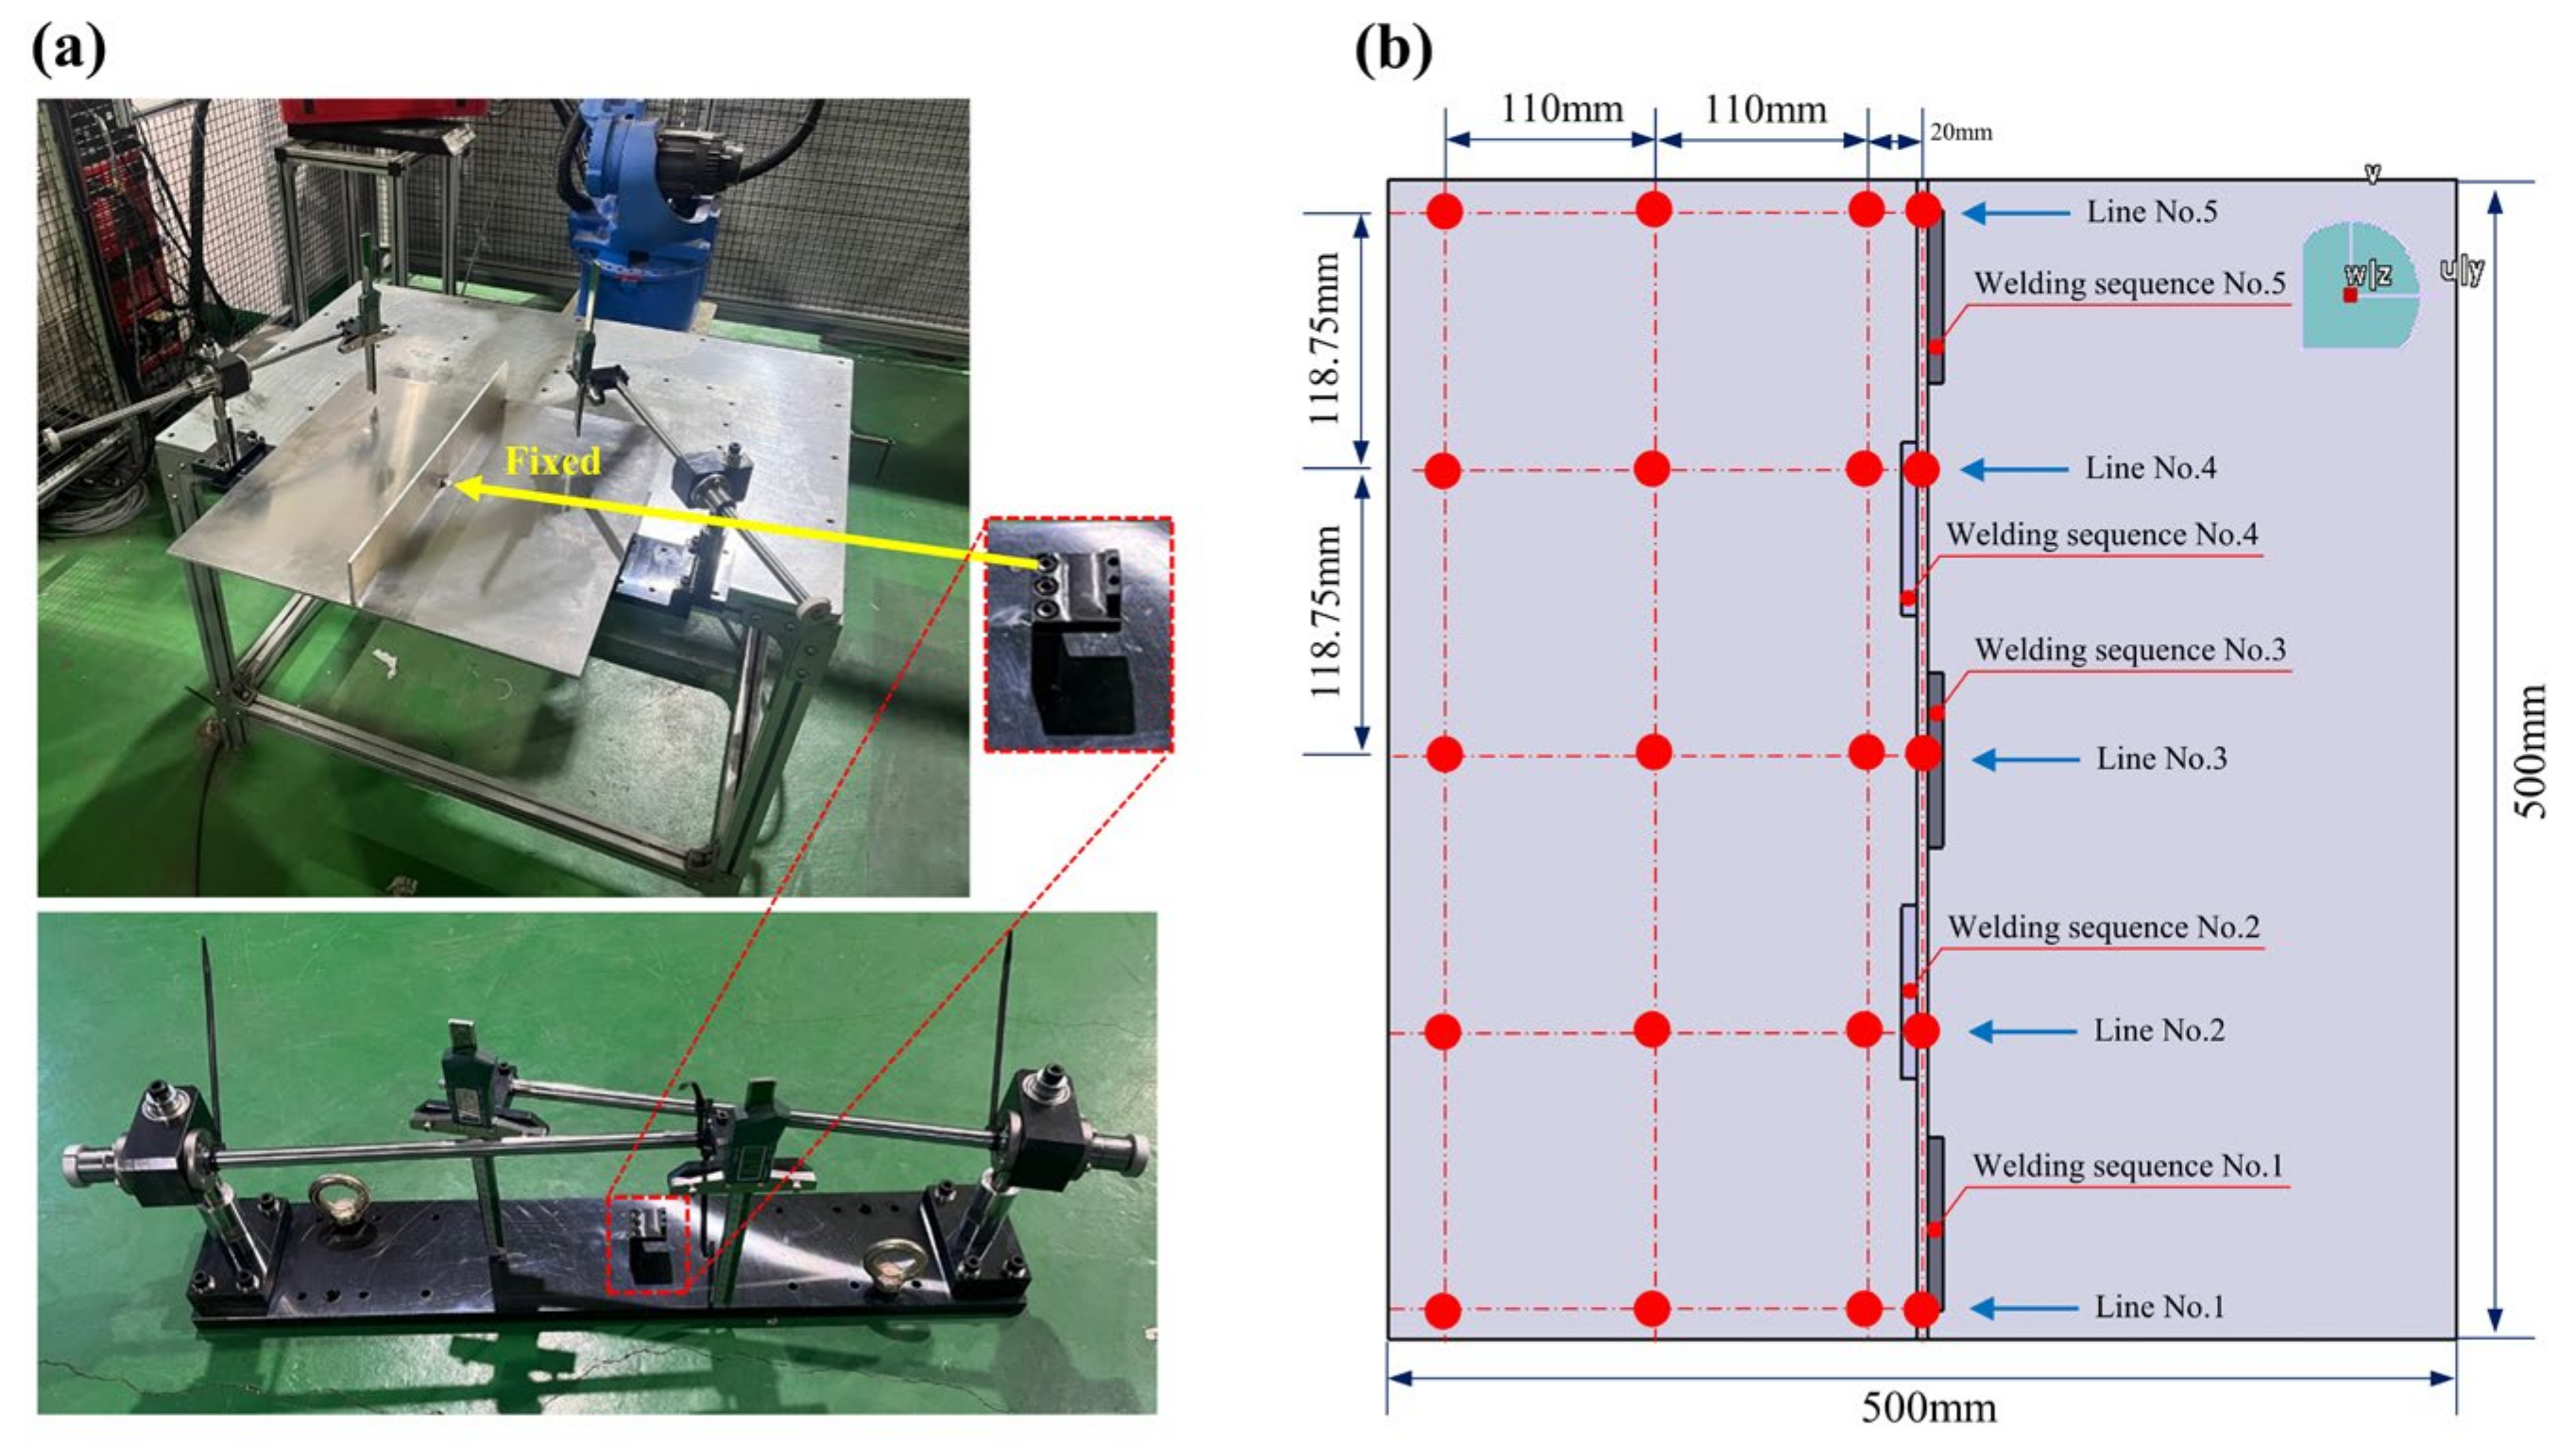
2.2. Deformation Measurement

In the aluminum fillet welding experiment, we used an in-house built welding jig to measure the deformation caused by welding. The fixture was clamped at the lower center of the base metal to ensure that the base metal was least affected by the constraint. Figure 2 shows the welding jig used in the experiment and the deformation measurement locations. For the deformation measurements, a calibrated digital vernier caliper (Insize, 1147-150) was hung upside down on the welding jig to measure the dimensional change before and after the weld was performed. The deformation measurements were taken after a total of five welds were completed. After welding was completed, the material was air-cooled, and no additional restraints were applied to minimize interference. The measurement locations were 5 lines horizontally and 7 lines vertically, 35 points in total, relative to the direction of weld progression, and the deformation was also measured for a 5 mm thick Al 5083 specimen in an upright position.

2.3. Deformation Simulation Conditions

To predict weld thermal deformation for fillet welds, MSC Apex (MSC Software Corporation) was used for mesh modeling. A simulation was performed using Simufact welding (MSC Software Corporation, Marc solver) for nonlinear analysis for deformation prediction. A hexa mesh with a relatively high resolution was used. The mesh size gradually increases from the center of the weld, which is most affected by heat, outward (minimum 0.5 mm), and it is modeled as a uniform structure with left–right symmetry for accurate analysis; the nodes are uniformly aligned to improve analysis precision. The welding beads were set to tetra mesh because we were concerned that the quality of the mesh would deteriorate in some welding beads if we used hexa mesh. Figure 3 shows the model with the mesh applied to the aluminum fillet-welded structure.
For the thermal deformation analysis of the fillet weld, the efficiency of the arc, which affects the heat-affected zone and the depth of melting, was selected as a variable to perform the thermal deformation analysis. The efficiency of the arc selected as a parameter cannot be applied as a variable in actual welding. However, it was selected as a parameter to achieve similar results through comparison between the actual weld and the FE model. In the analysis, the moving heat source due to welding was simulated to perform five passes in the same direction, following the selected welding sequence. The boundary conditions are shown in Figure 2. The same fixed geometry as the lower support used in the actual welding conditions, as shown in Figure 2, was applied, and the influence of gravity was taken into account. The boundary conditions used in the finite element analysis are shown in Equations (1)–(3). The convective heat transfer coefficient was established at 20 W/m2 K, based on the assumption of natural convection occurring on all exposed surfaces. The initial temperature was set at 25 °C, calculated following Newton’s law of cooling. In Equation (1), q c o n v represents the convective heat transfer coefficient, h c o n v represents the surface temperature, and T e n v represents the ambient temperature.
q c o n v = h c o n v ( T T e n v )
The contact heat transfer coefficient was set to 100 W/m2 K [34], calculated using Equation (2). This is expressed as follows:
Q ˙ = h A ( T 1 T 2 )
where A represents the surface area, T 2 represents the temperature of the surrounding fluid, and T 1 is the temperature of the solid surface. The emissivity coefficient was set at 0.6, in accordance with the Stefan–Boltzmann law. In the following equation, ε r a d represents the surface emissivity, σ r a d represents the Stefan–Boltzmann constant, and T e n v is maintained at 25 °C.
q r a d = ε r a d σ r a d ( T 4 T 4 e n v )
Finally, to model the change in material properties due to welding heat treatment, we used JMatPro (Sente Software(7.0.0)), a thermodynamics-based property calculation program, to derive the change in material properties according to temperature variations. The tendency of Al 5083 material properties to change with temperature was used as a simulation condition in the FEM analysis. Figure 4 shows the physical properties of the Al 5083 material.

3. FEM Development

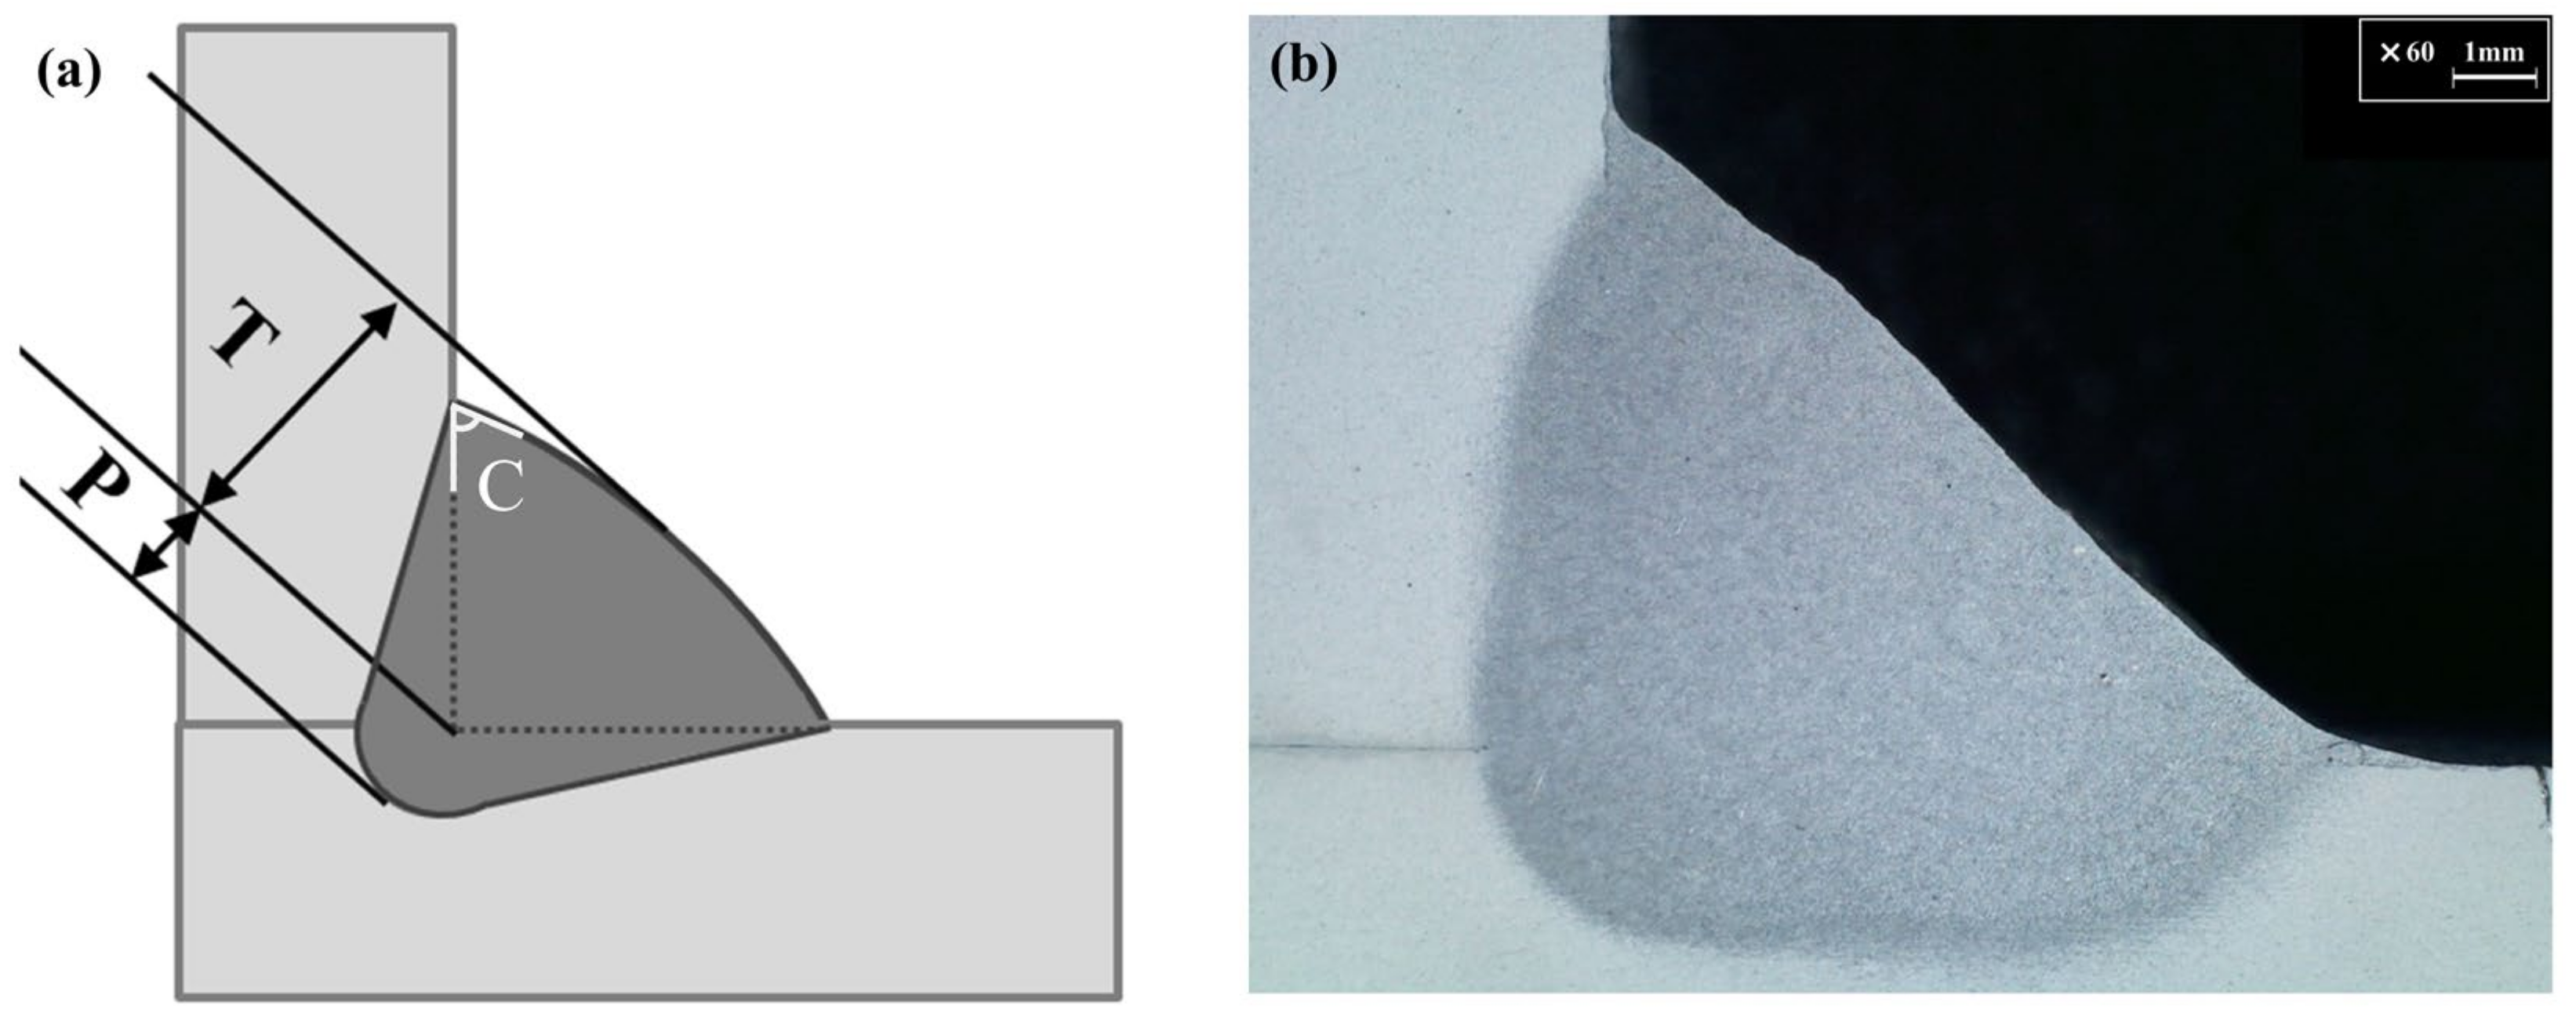
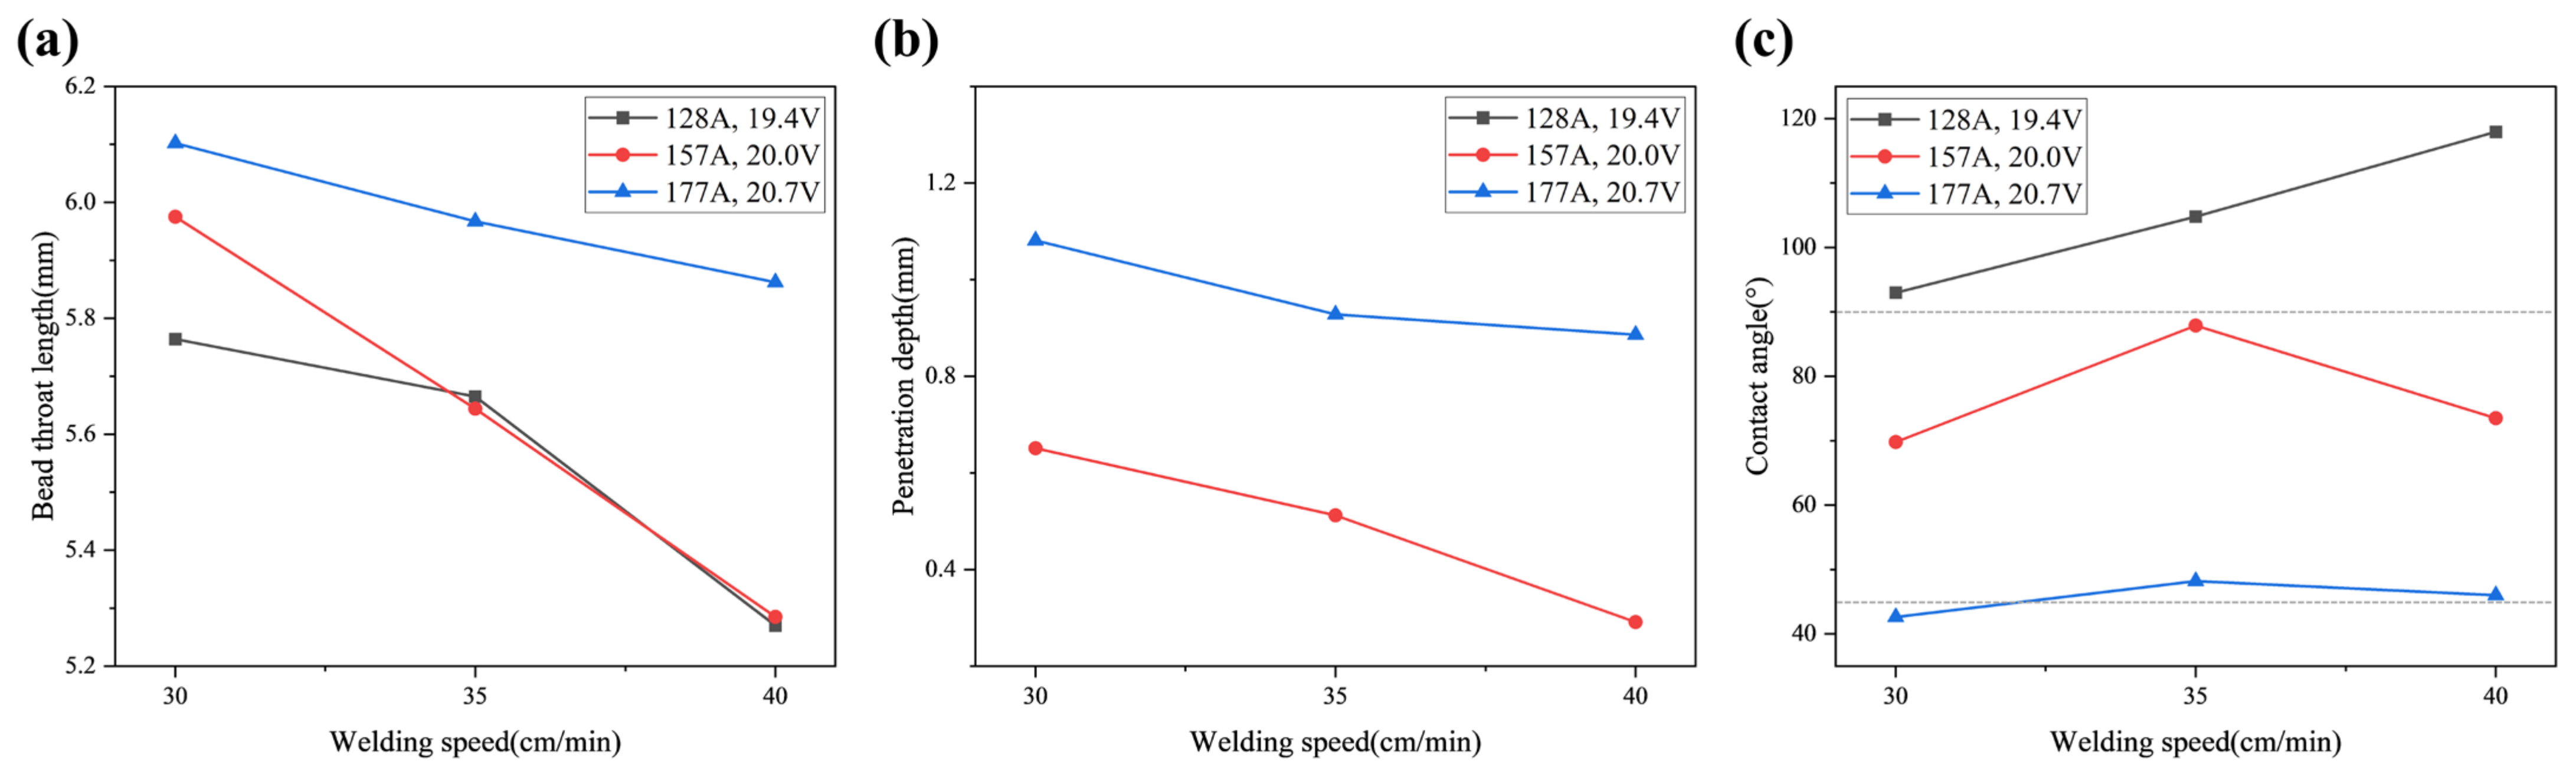
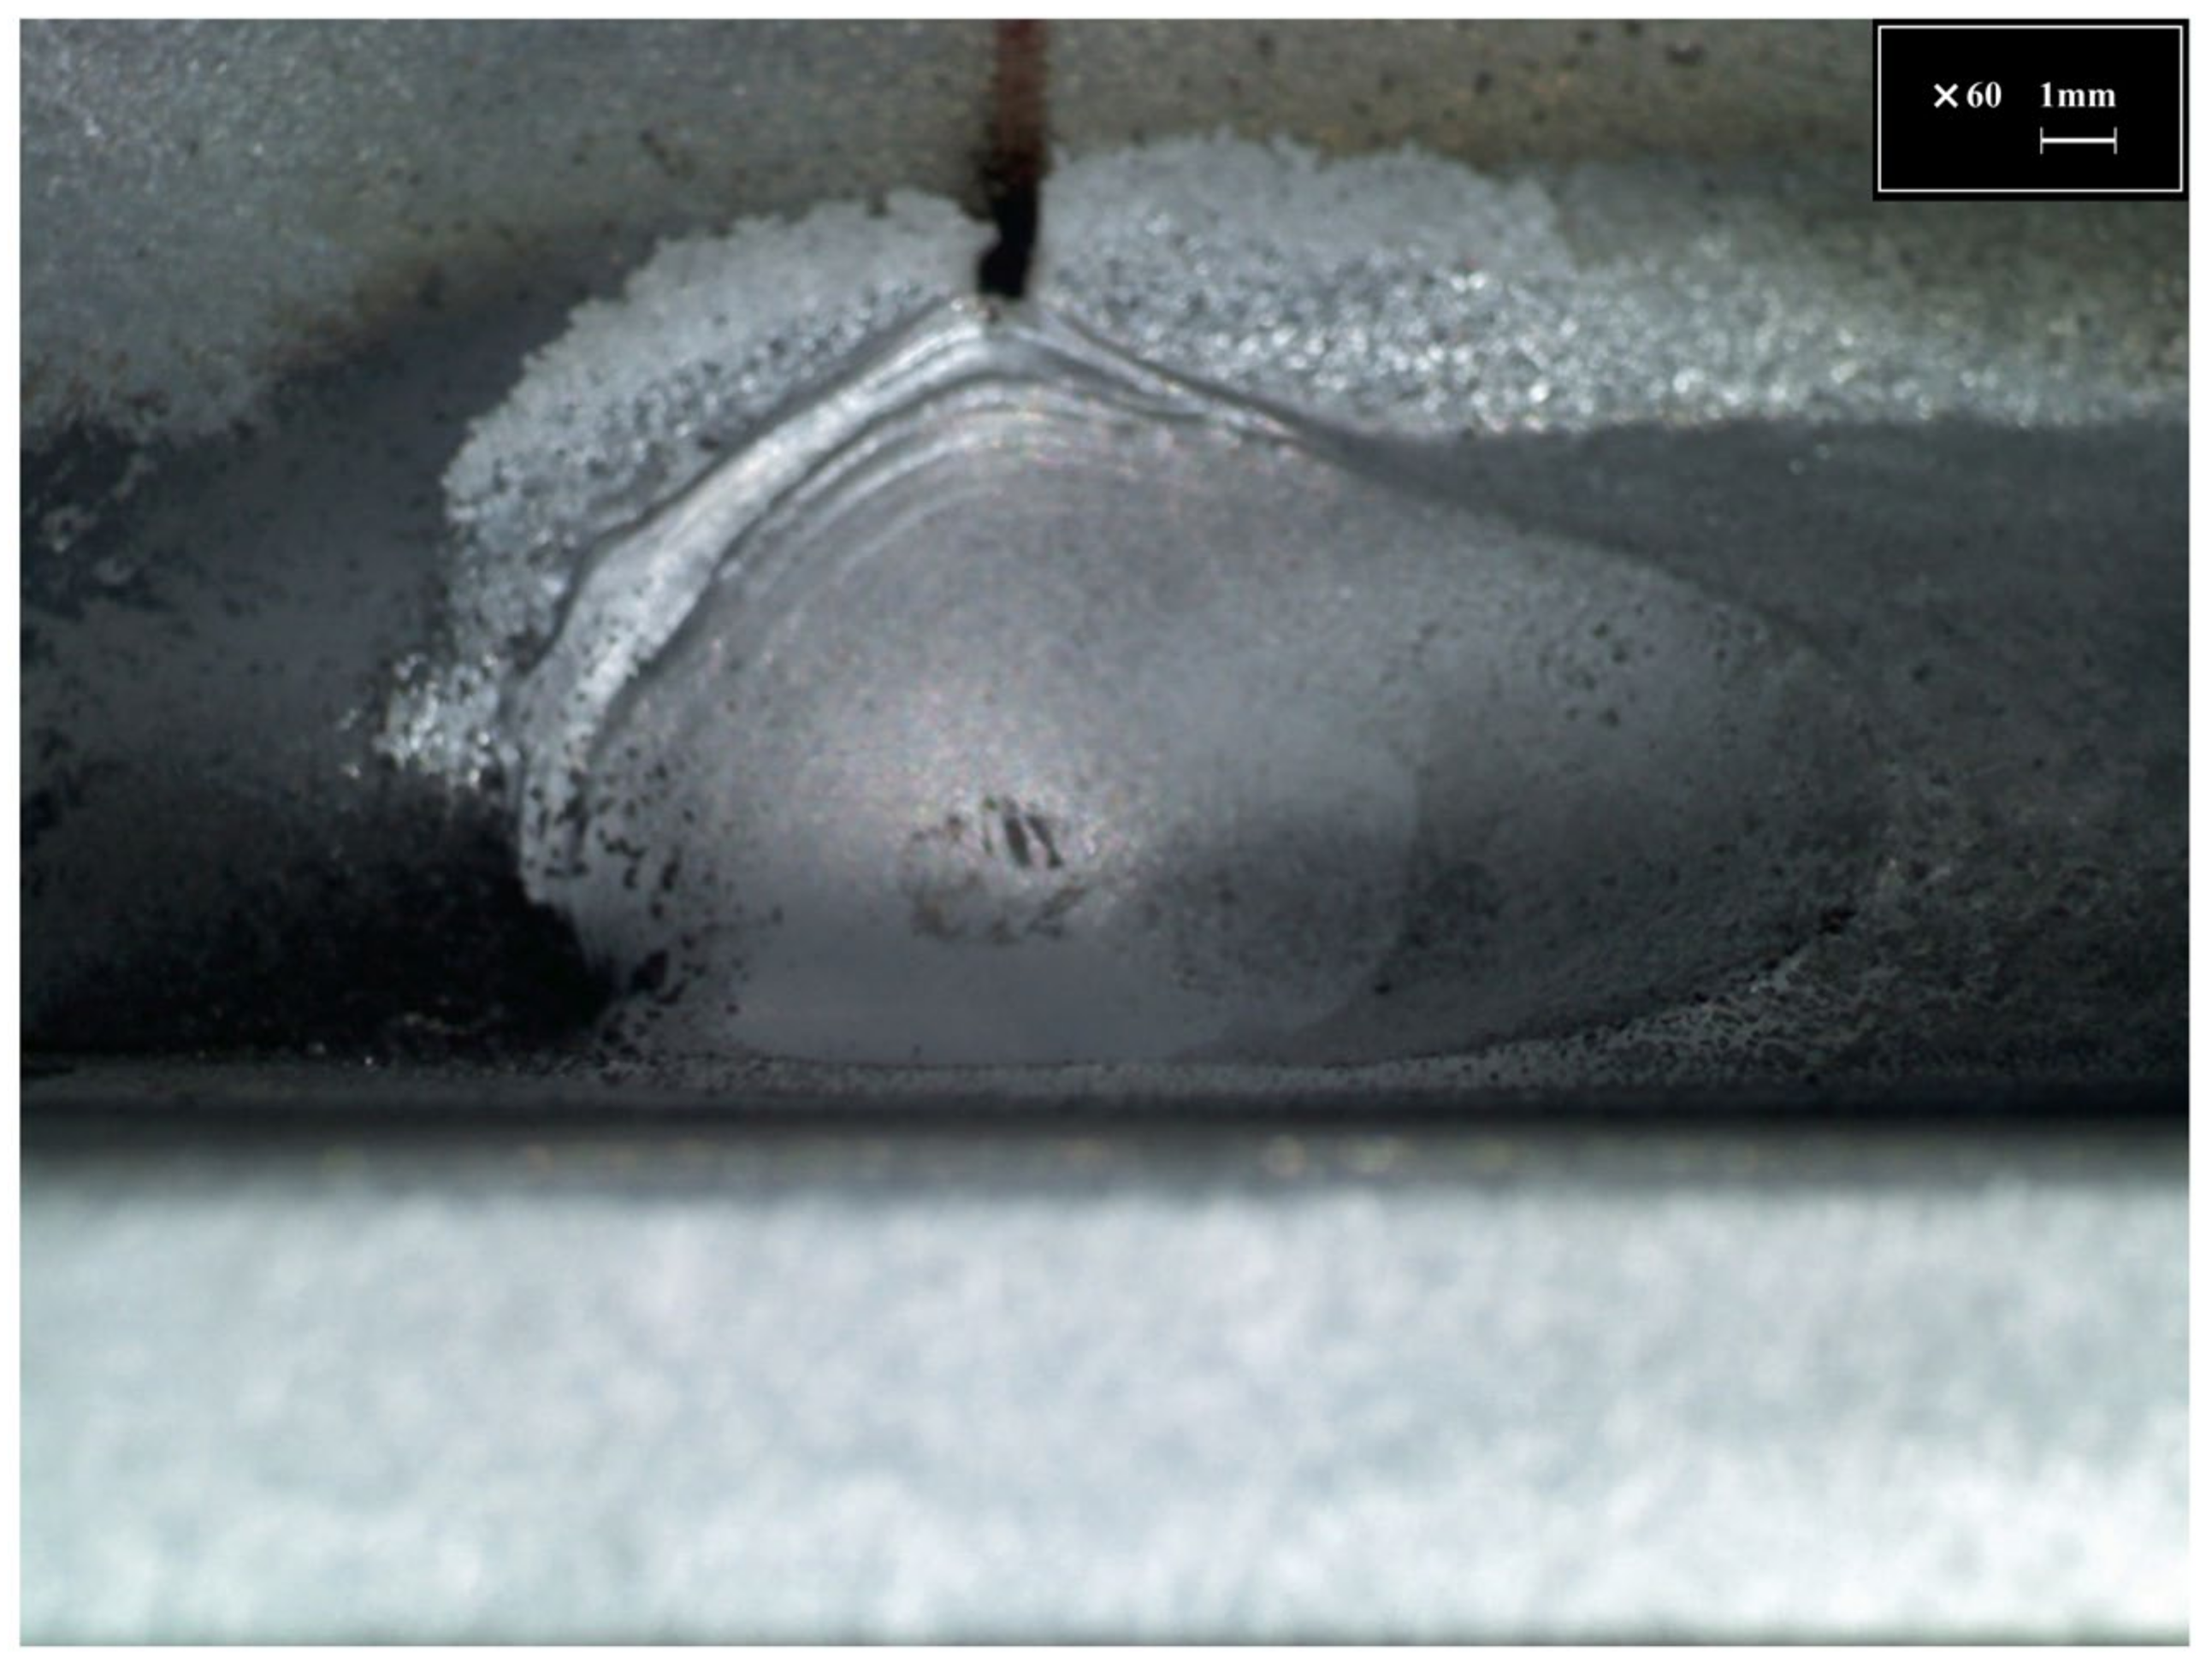
3.1. Aluminum Fillet Weld Experimental Results

Figure 5 shows the dimensioning position of the bead shape and the shape of the bead with respect to the cross-section of the fillet weld. The changes in the shape of the fillet-welded weld bead through three conditions of current and voltage and three conditions of welding speed were clearly identified. For the analysis of bead shape according to process variables, the bead shape dimensions of throat length (T), penetration depth (P), and contact angle (C) of the fillet weld bead were measured.
Figure 6 shows the dimensional measurement results of the bead geometry. In Figure 6a, the throat length of the fillet weld bead was found to be similar for the current and voltage conditions of 128 A, 19.4 V and 157 A, 20.0 V, suggesting that the welding speed has a greater influence than the current and voltage conditions. The penetration depth shown in Figure 6b shows that under the condition of 128 A and 19.4 V, no penetration was achieved regardless of the welding speed, so it was determined that the influence of the current and voltage is greater than that of the welding speed. It was found that the welding speed has a greater influence on the prism length of the formed bead than the current and voltage because it affects the time the bead-forming wire stays in a unit area during the formation of the fillet weld bead, and the penetration depth has a greater influence on the current and voltage because it requires melting and diluting the base metal for a short period of time. The contact angle was found to decrease linearly with increasing current and voltage conditions, but there was no trend with welding speed. The current and voltage conditions of 128 A and 19.4 V without penetration showed a contact angle of more than 90°, indicating that a good fillet weld was not achieved.

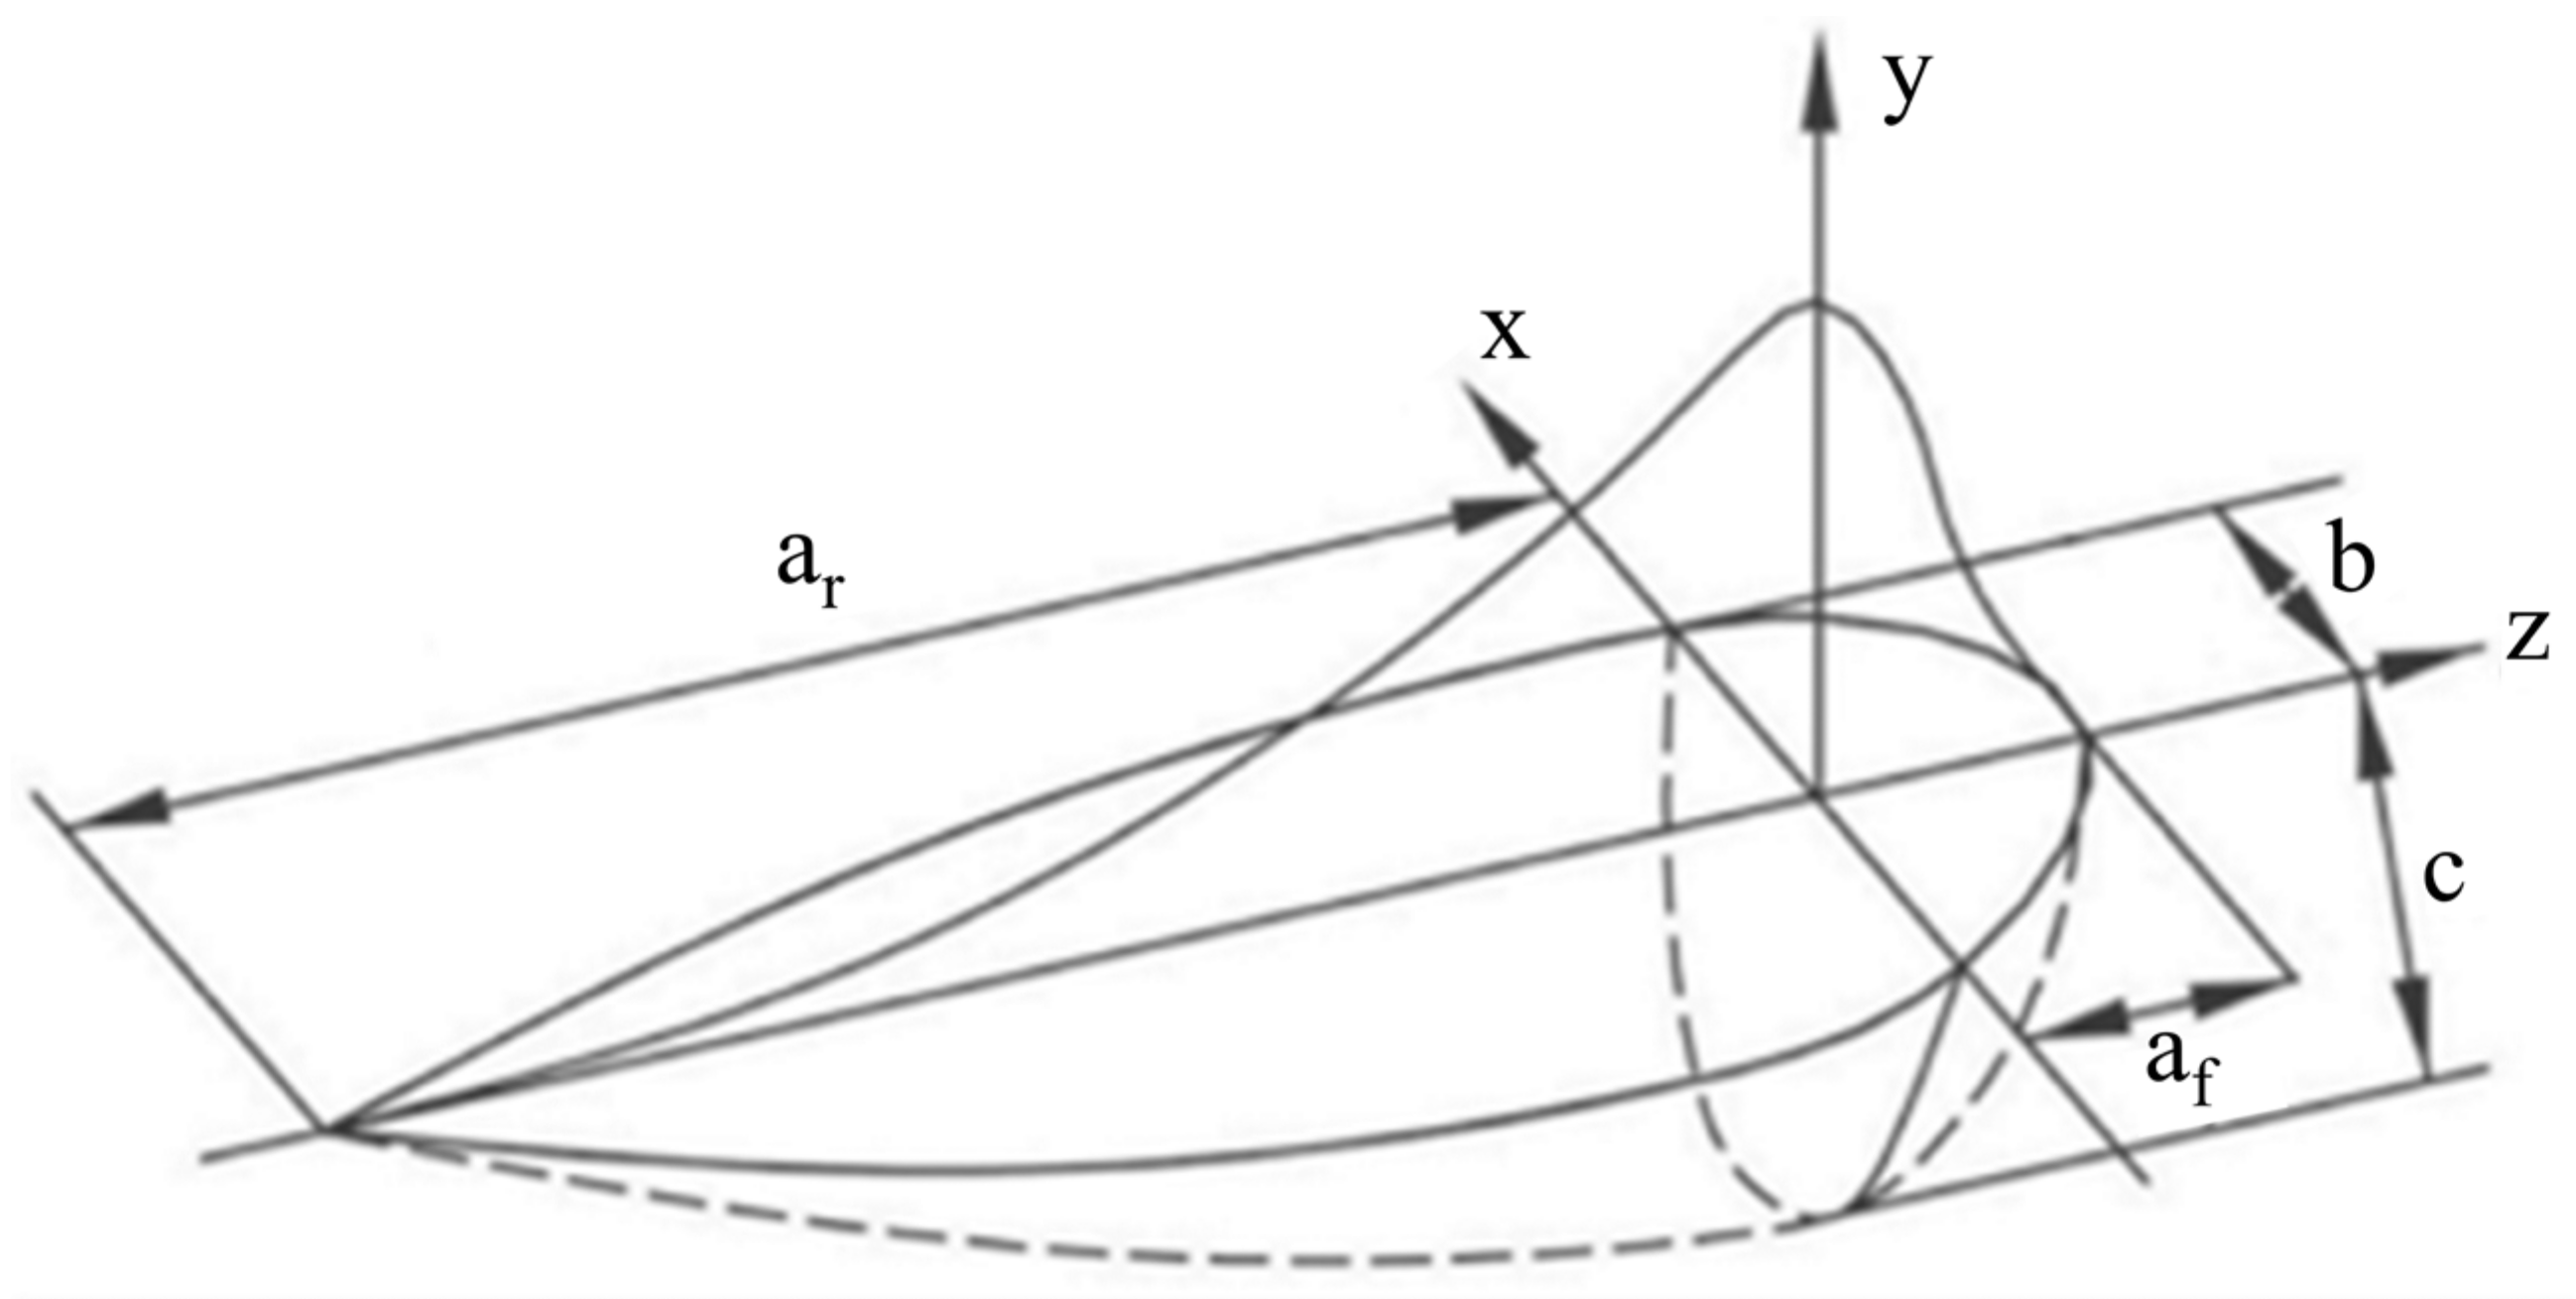
3.2. Heat Source Geometry

Since all the required conditions of an angular field length of more than 5 mm were satisfied considering the safety of an aluminum ship substructure, the welding conditions that resulted in good weld bead geometry were selected based on the contact angle measurement results in Figure 6c [35,36]. Since a larger contact angle increases the probability of fracture at the interface, a welding speed of 177 A, 20.7 V, and 30 cm/min was selected for the heat source analysis because it was the only weld bead geometry with a contact angle of 45° or less. In the FEM, the area of the heat source is provided as an estimate based on the welding variables, but actual welds may exhibit different trends. For a more reliable weld deformation prediction, the area of the actual weld heat source was measured and applied to the FEM. To derive the results of the weld thermal deformation analysis, the heat source geometry for the arc conditions of GMAW was derived based on the geometry identified at the end of the weld bead where fillet welding was performed at a current and voltage condition of 177 A, 20.7 V. The heat source geometry of the fillet weld is shown in Figure 7.
The Gaussian heat source model has the advantage of transforming an infinite heat source into a finite heat source by applying the concept of effective diameter, which is suitable for simulation [37]. Since the reliability of the Goldak model has been verified by many studies, in this study, the double ellipsoid Goldak model, as shown in Figure 8, is used for simulation [38]. The Goldak model consists of two ellipsoids of different sizes. One ellipsoid represents the front heat source, and the other ellipsoid represents the rear heat source. The governing equations are Equations (4)–(8).
Q = μ V I
where Q is the effective heat energy, μ is the welding efficiency, and V and I are the welding parameters voltage and current, respectively.
q f x , y , z , t = 6 3 f f Q a f b c π exp ( 3 ( ( z v t z 0 ) 2 a f 2 + y 2 c 2 + x 2 b 2 ) )
q r x , y , z , t = 6 3 f r Q a r b c π exp ( 3 ( ( z v t z 0 ) 2 a r 2 + y 2 c 2 + x 2 b 2 ) )
f f = 2 a r a f + a r
f r = 2 a f a f + a r
where f f and f r represent the fraction of heat deposited at the ellipsoid for the front and rear, and v is the velocity of the heat source. In Equations (5) and (6), parameters a f , a r , b , and c are independent, and in a general welding analysis, appropriate parameter values are entered by estimation, but in this study, the heat source geometry dimensions obtained from Figure 7 were used as simulation conditions. Table 4 shows the heat source geometry dimensions used in the Goldak model.

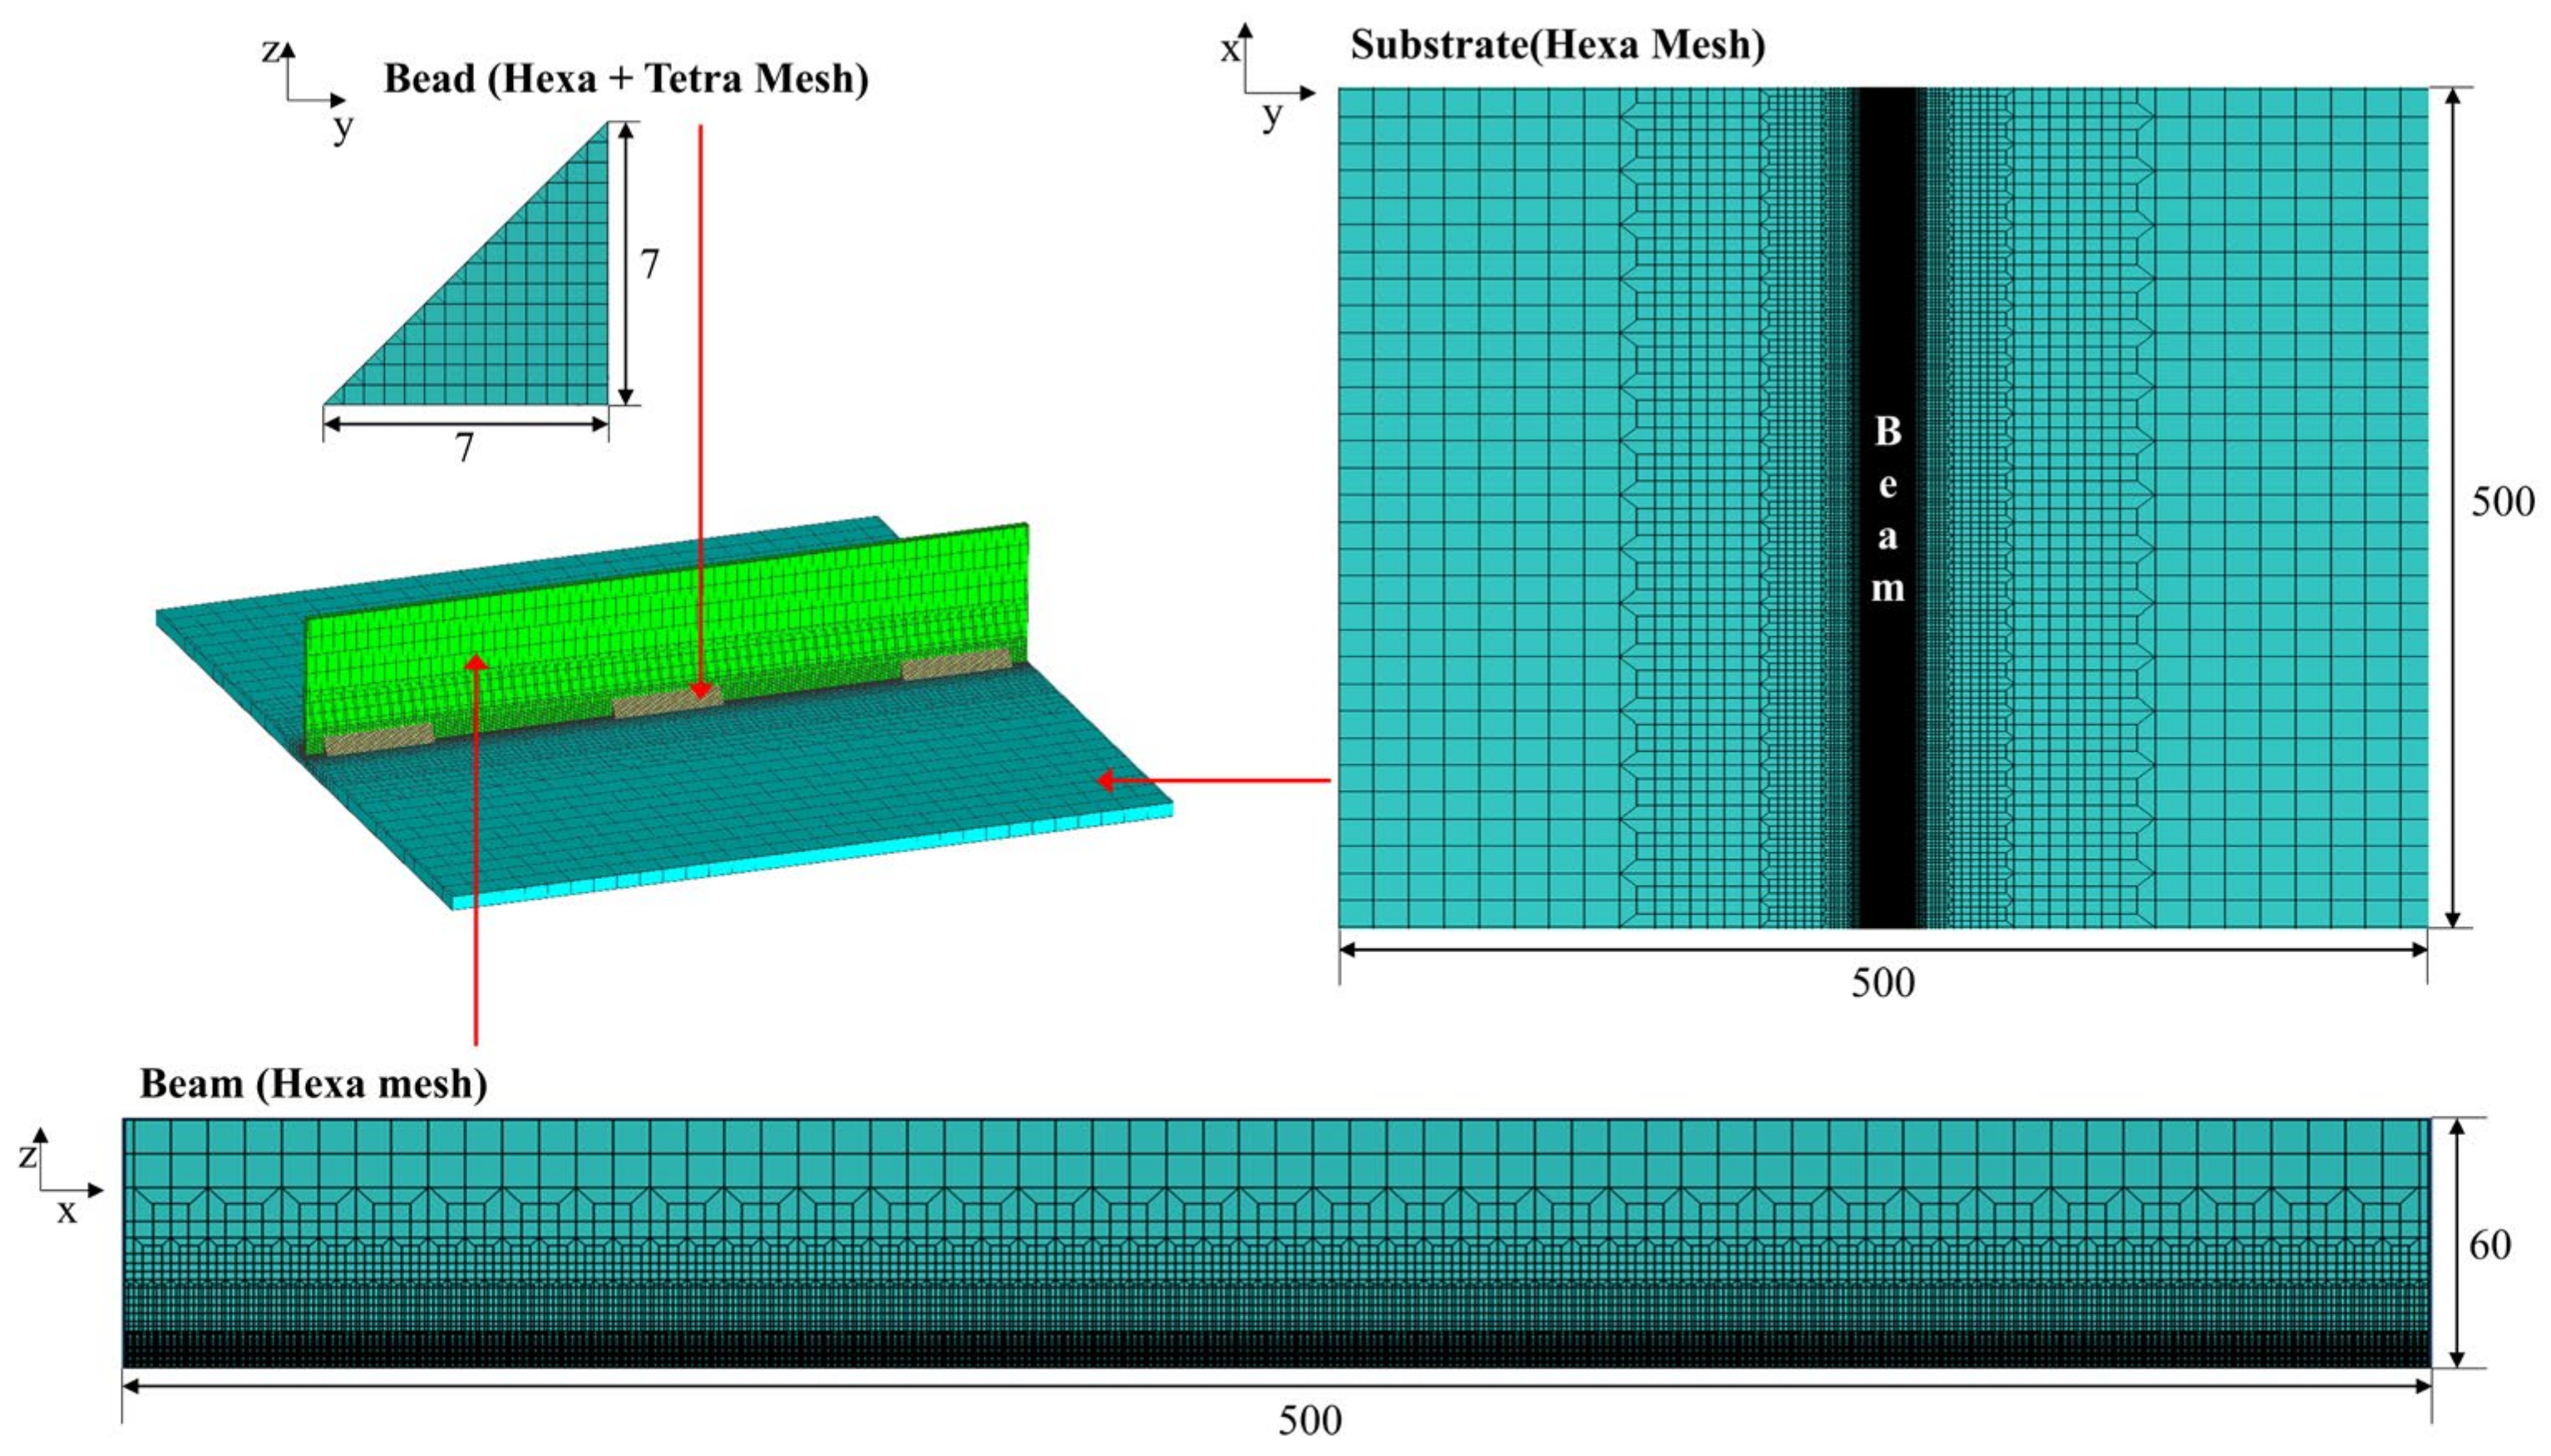
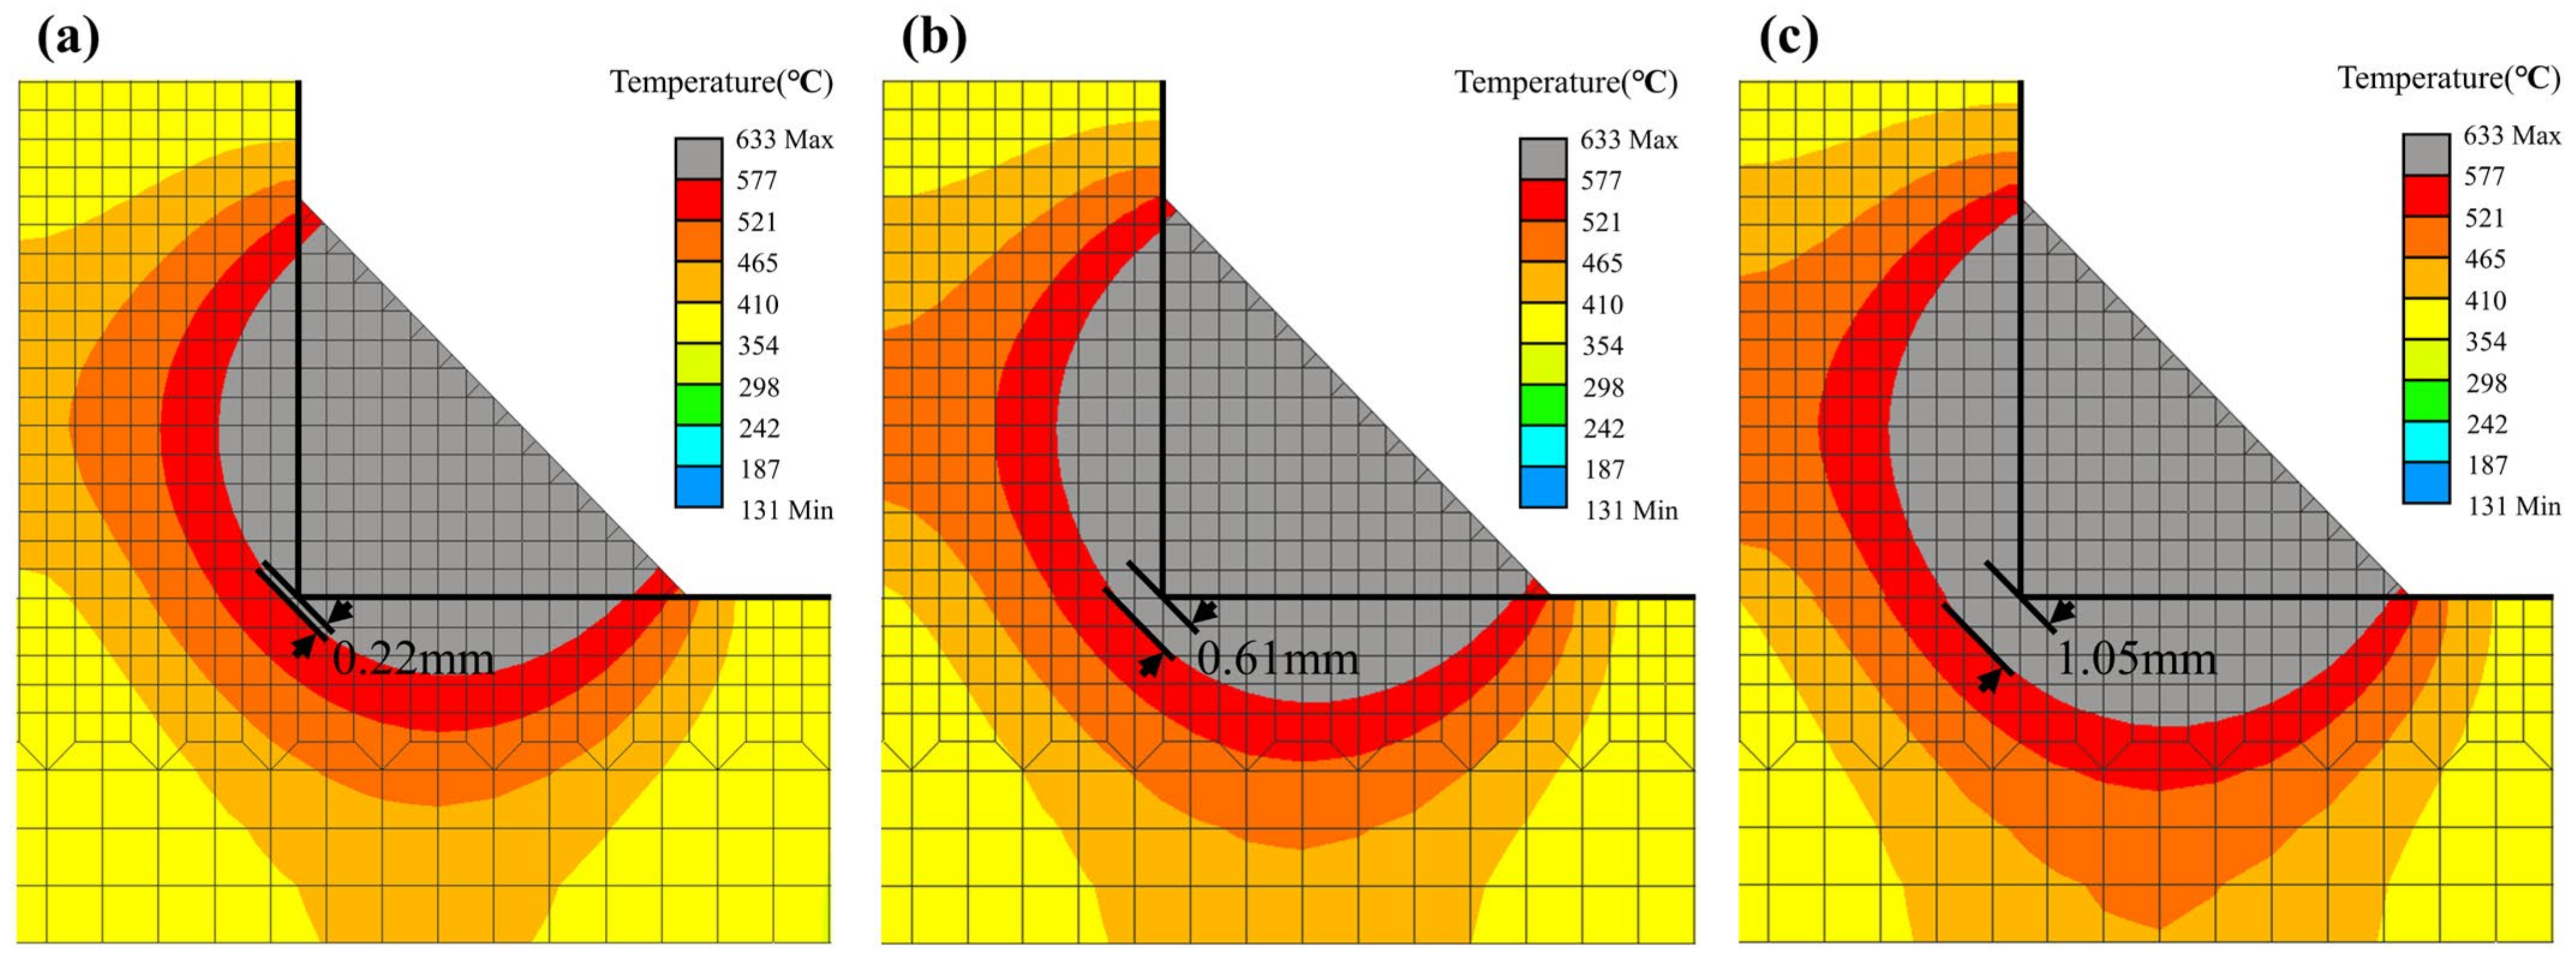
3.3. Simulation Model Development

For the development of the aluminum weld deformation analysis model, simulations were performed for 80%, 85%, and 90% to obtain the appropriate arc efficiency condition while using the normally distributed gaussian parameter condition. The heat source for the fillet weld was analyzed with the welding conditions selected in Section 3.2. For the 80% arc efficiency condition in Figure 9a, it was observed that the weld did not fully melt the base metal. The 85% arc efficiency condition in Figure 9b shows an increase in the melted area of the HAZ and base metal compared to the 80% arc efficiency condition, but the weld still did not fully melt the base metal. In Figure 9c, at a 90% arc efficiency, the weld is fully melted. In Figure 10, the bead geometry at a 90% arc efficiency is compared to the actual weld. The molten weld bead geometry and penetration depth are similar to the actual welded geometry. The 90% arc efficiency condition was selected as the final condition for the FE model to predict weld deformation because it better simulates the weld bead.

4. Deformation Prediction and Discussion

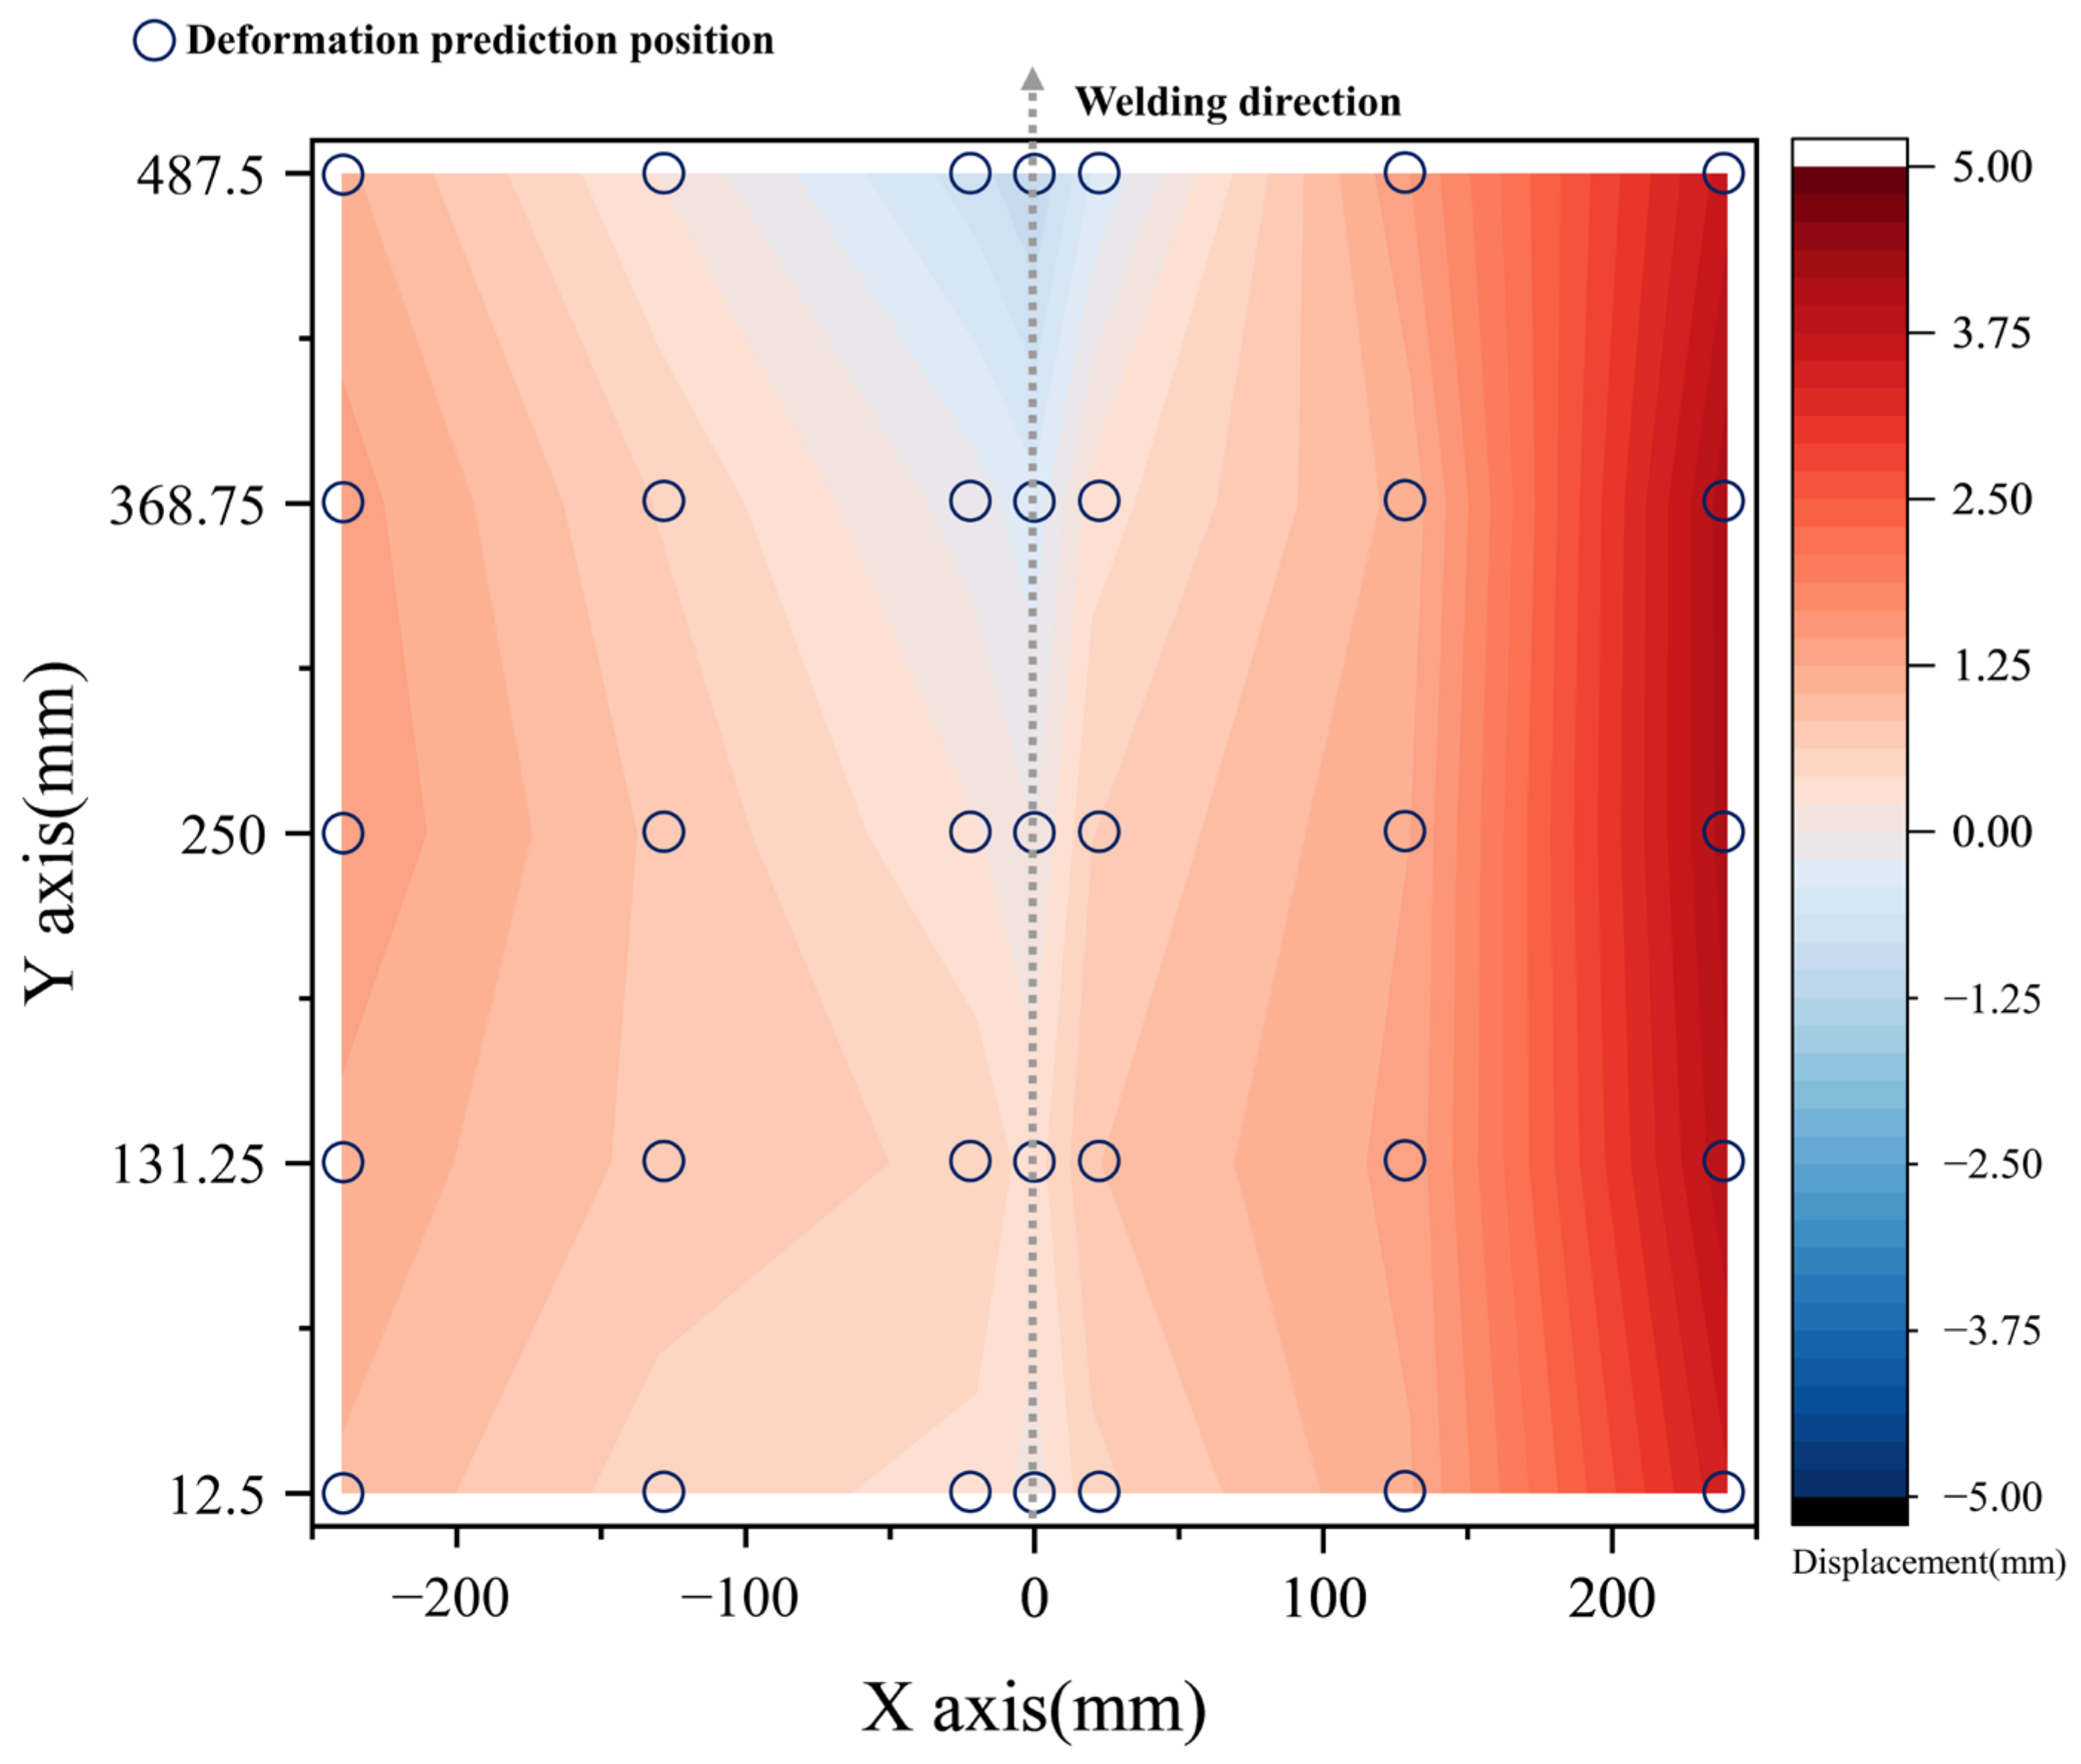
4.1. Deformation Prediction Results

Figure 11 shows the deformation prediction results obtained from the fillet welding experiment. The intercomparison results for each line perpendicular to the welding direction showed no significant difference in deformation. The intercomparison of welding deformation for each point horizontal to the welding direction shows that the deformation at the 240 mm position of the X-axis is large. The thermal deformation caused by welding was determined to be greater on the right side, where one more weld was performed. We found that most of the deformations were in the opposite direction of gravity, except for the 0 mm section of the X-axis, where the fillet weld was performed. This was determined to be due to deformation in the direction of the weld bead as the shrinkage stress from the weld acted on the weld zone.

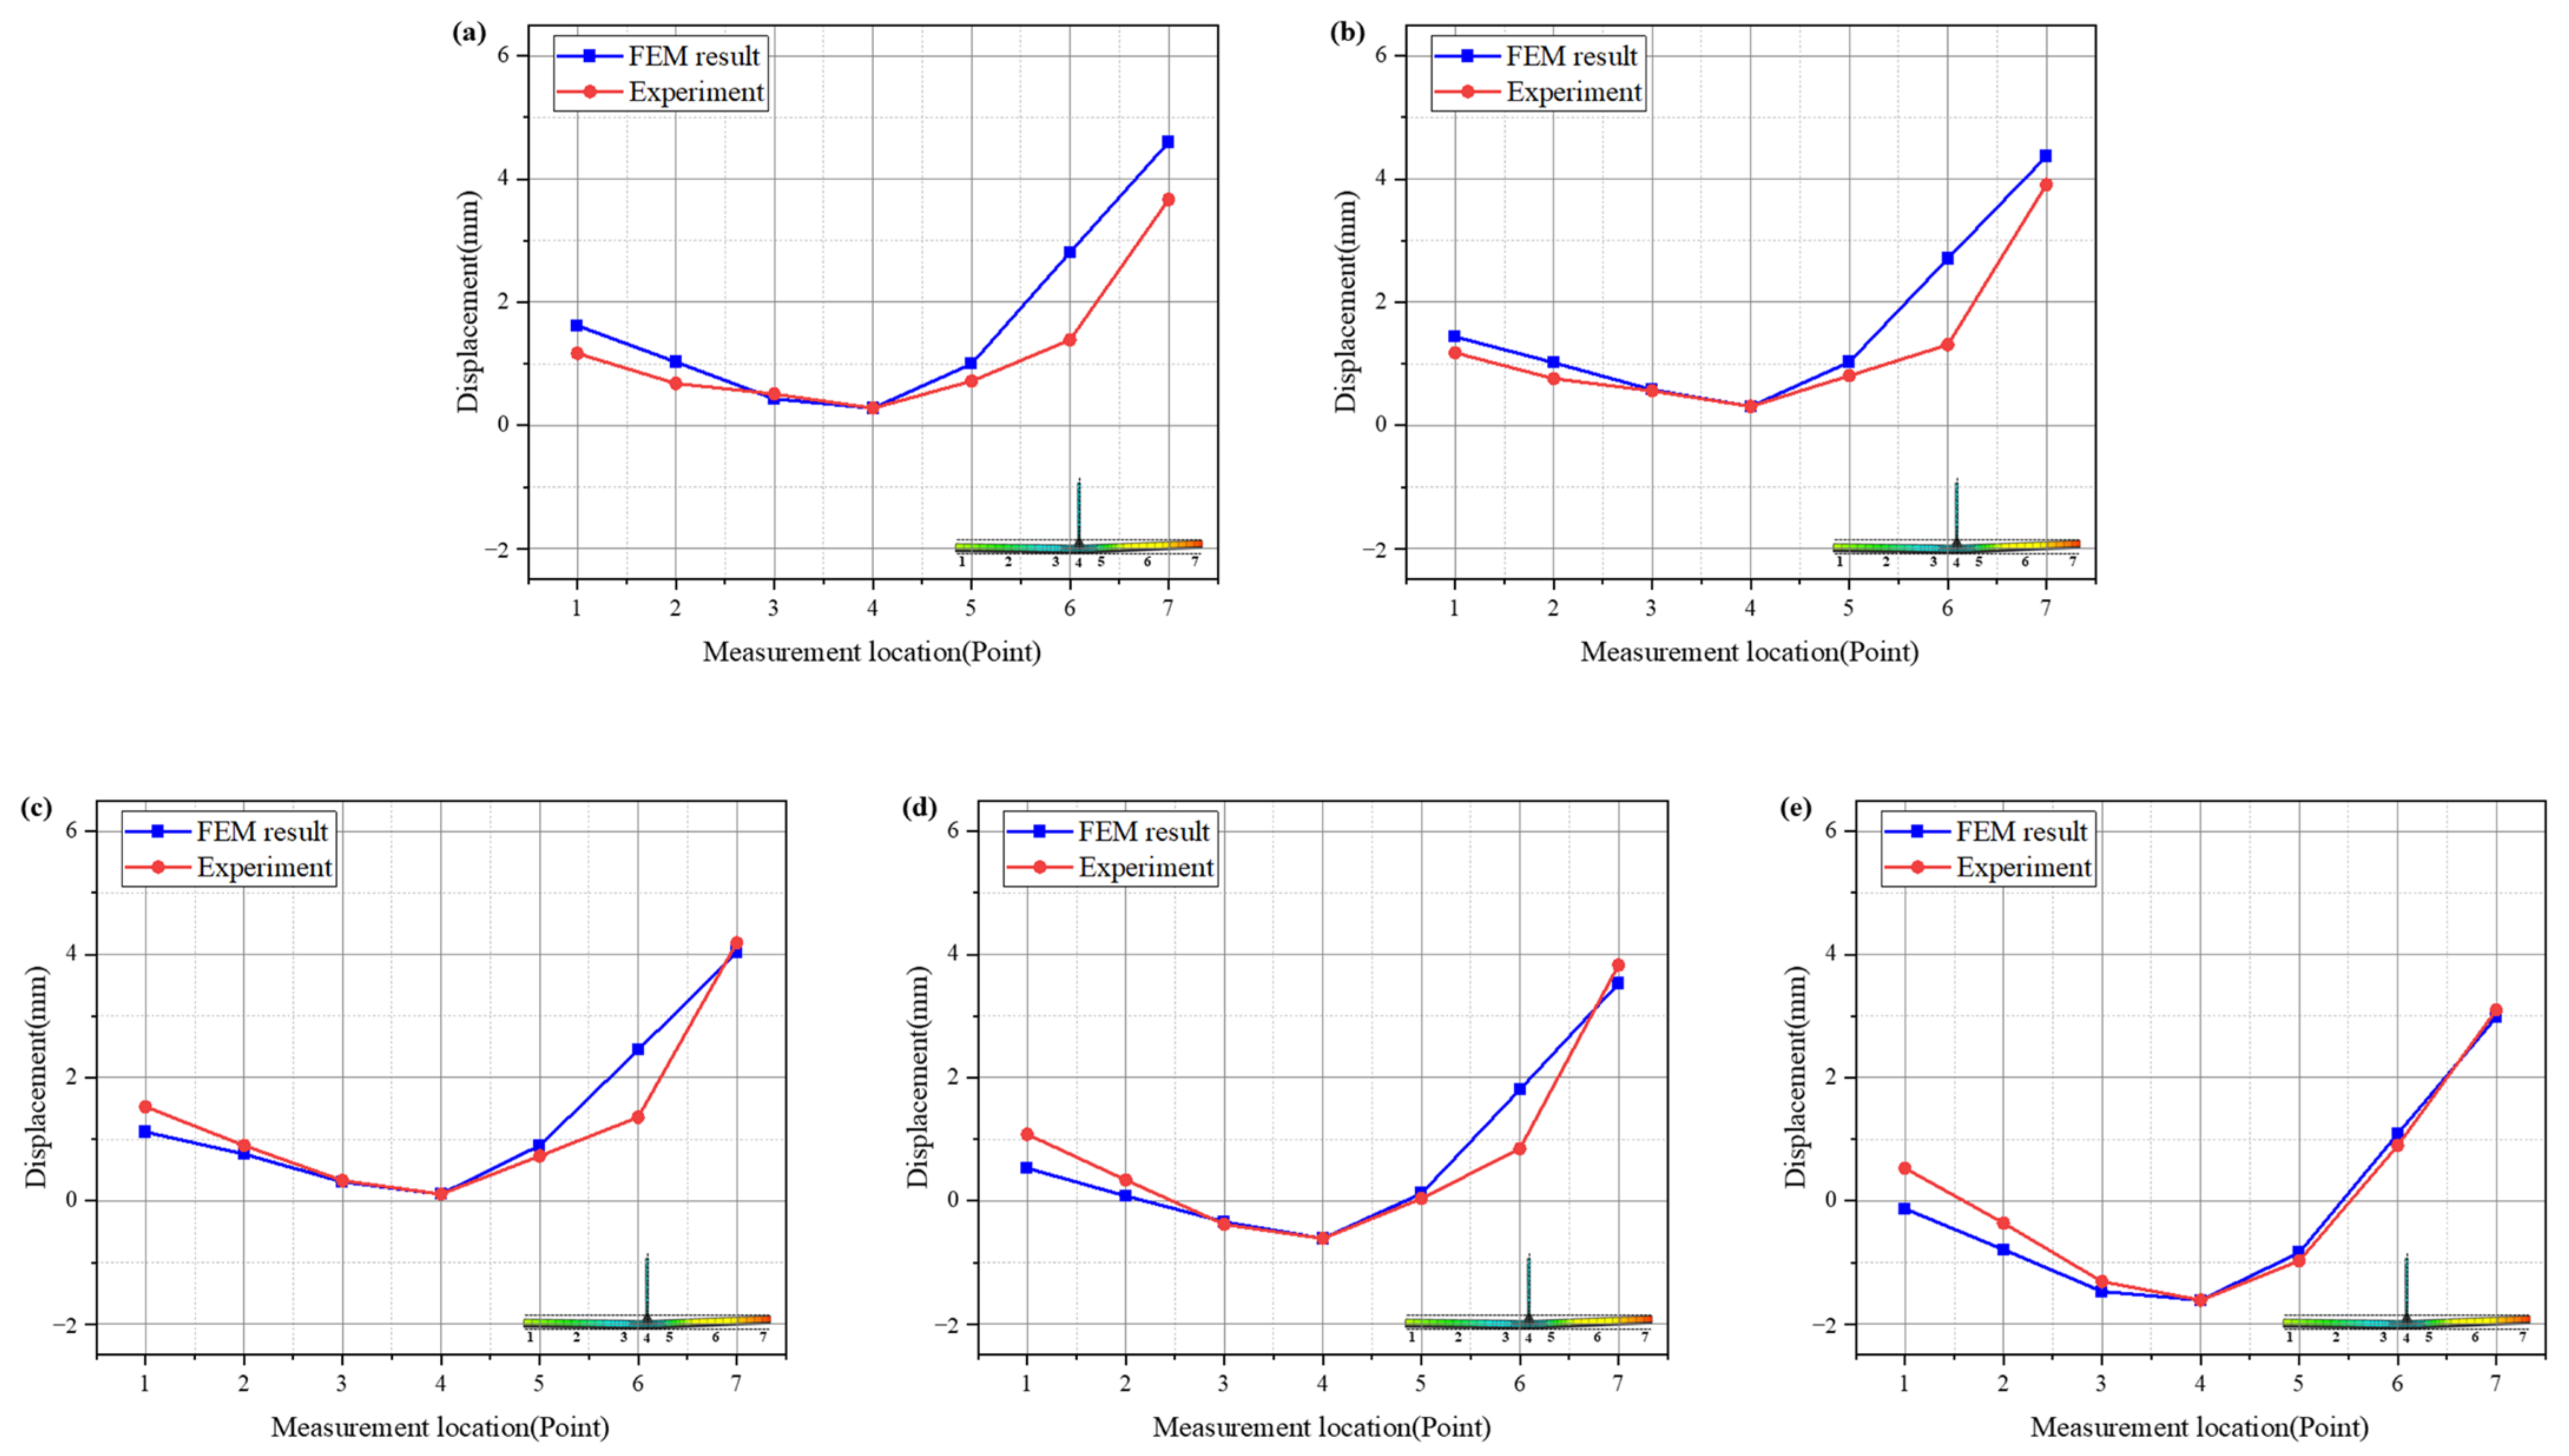
4.2. Comparison of Simulation and Experimental Results

The heat source model was derived based on the welding conditions that represented a good weld in the cross-section of the fillet weld. The fillet welding experiment of Al 5083 was simulated, and the weld deformation was checked by the finite element analysis using a moving heat source. Figure 12 shows the comparison between the actual weld deformation measurement results and the weld deformation prediction results using the heat source model. It can be seen that the deformation prediction results of the fillet weld based on the heat source geometry condition obtained from the welding experiment tend to be similar to the actual experimental values.
Figure 13 shows the standard deviation for each measurement line for the difference between the measured and interpreted deformation values. It can be seen that Figure 12e at the weld end position has better deformation prediction performance than Figure 12a at the weld bead position where the weld started. This was determined by the contact of the welding rods during the five welds, the weld deformation, and the small error between the deformation measurements. The simulation results differed from the simulation results by as little as 0.02 mm and as much as 1.4 mm over the entire range of strain measurements. Based on the simulation results, it was determined that it is possible to predict the welding deformation tendency and deformation amount using the heat source model without conducting actual welding deformation experiments.

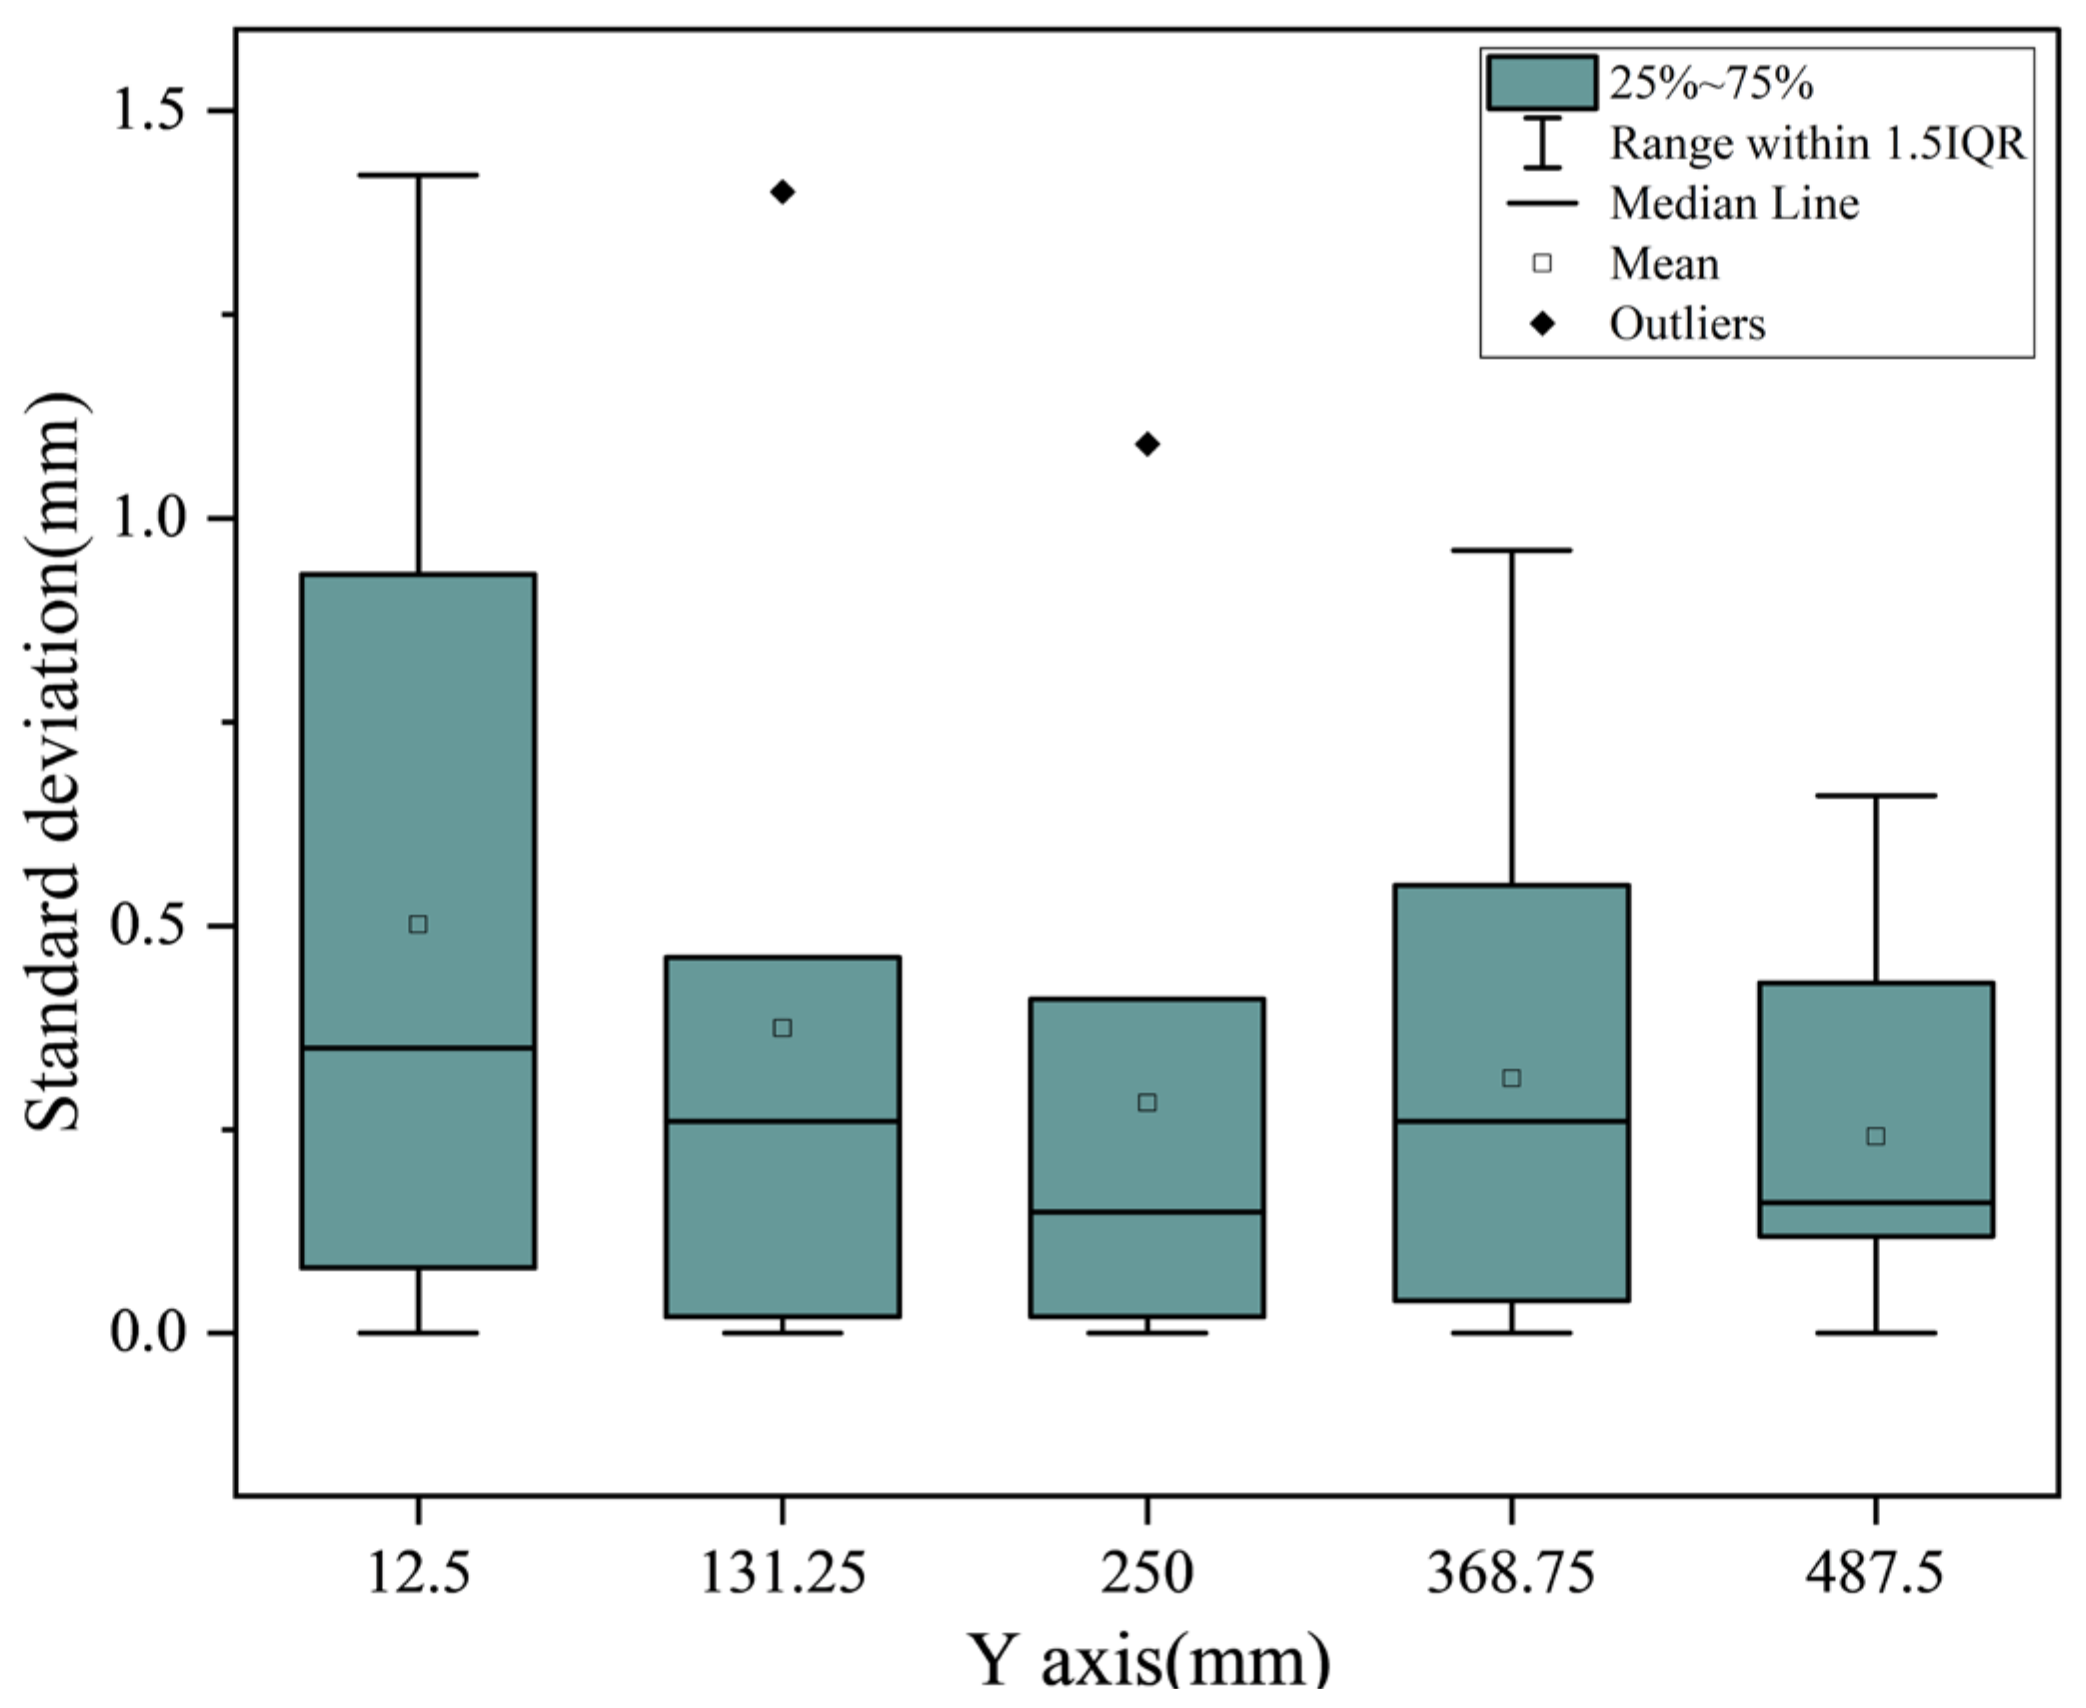
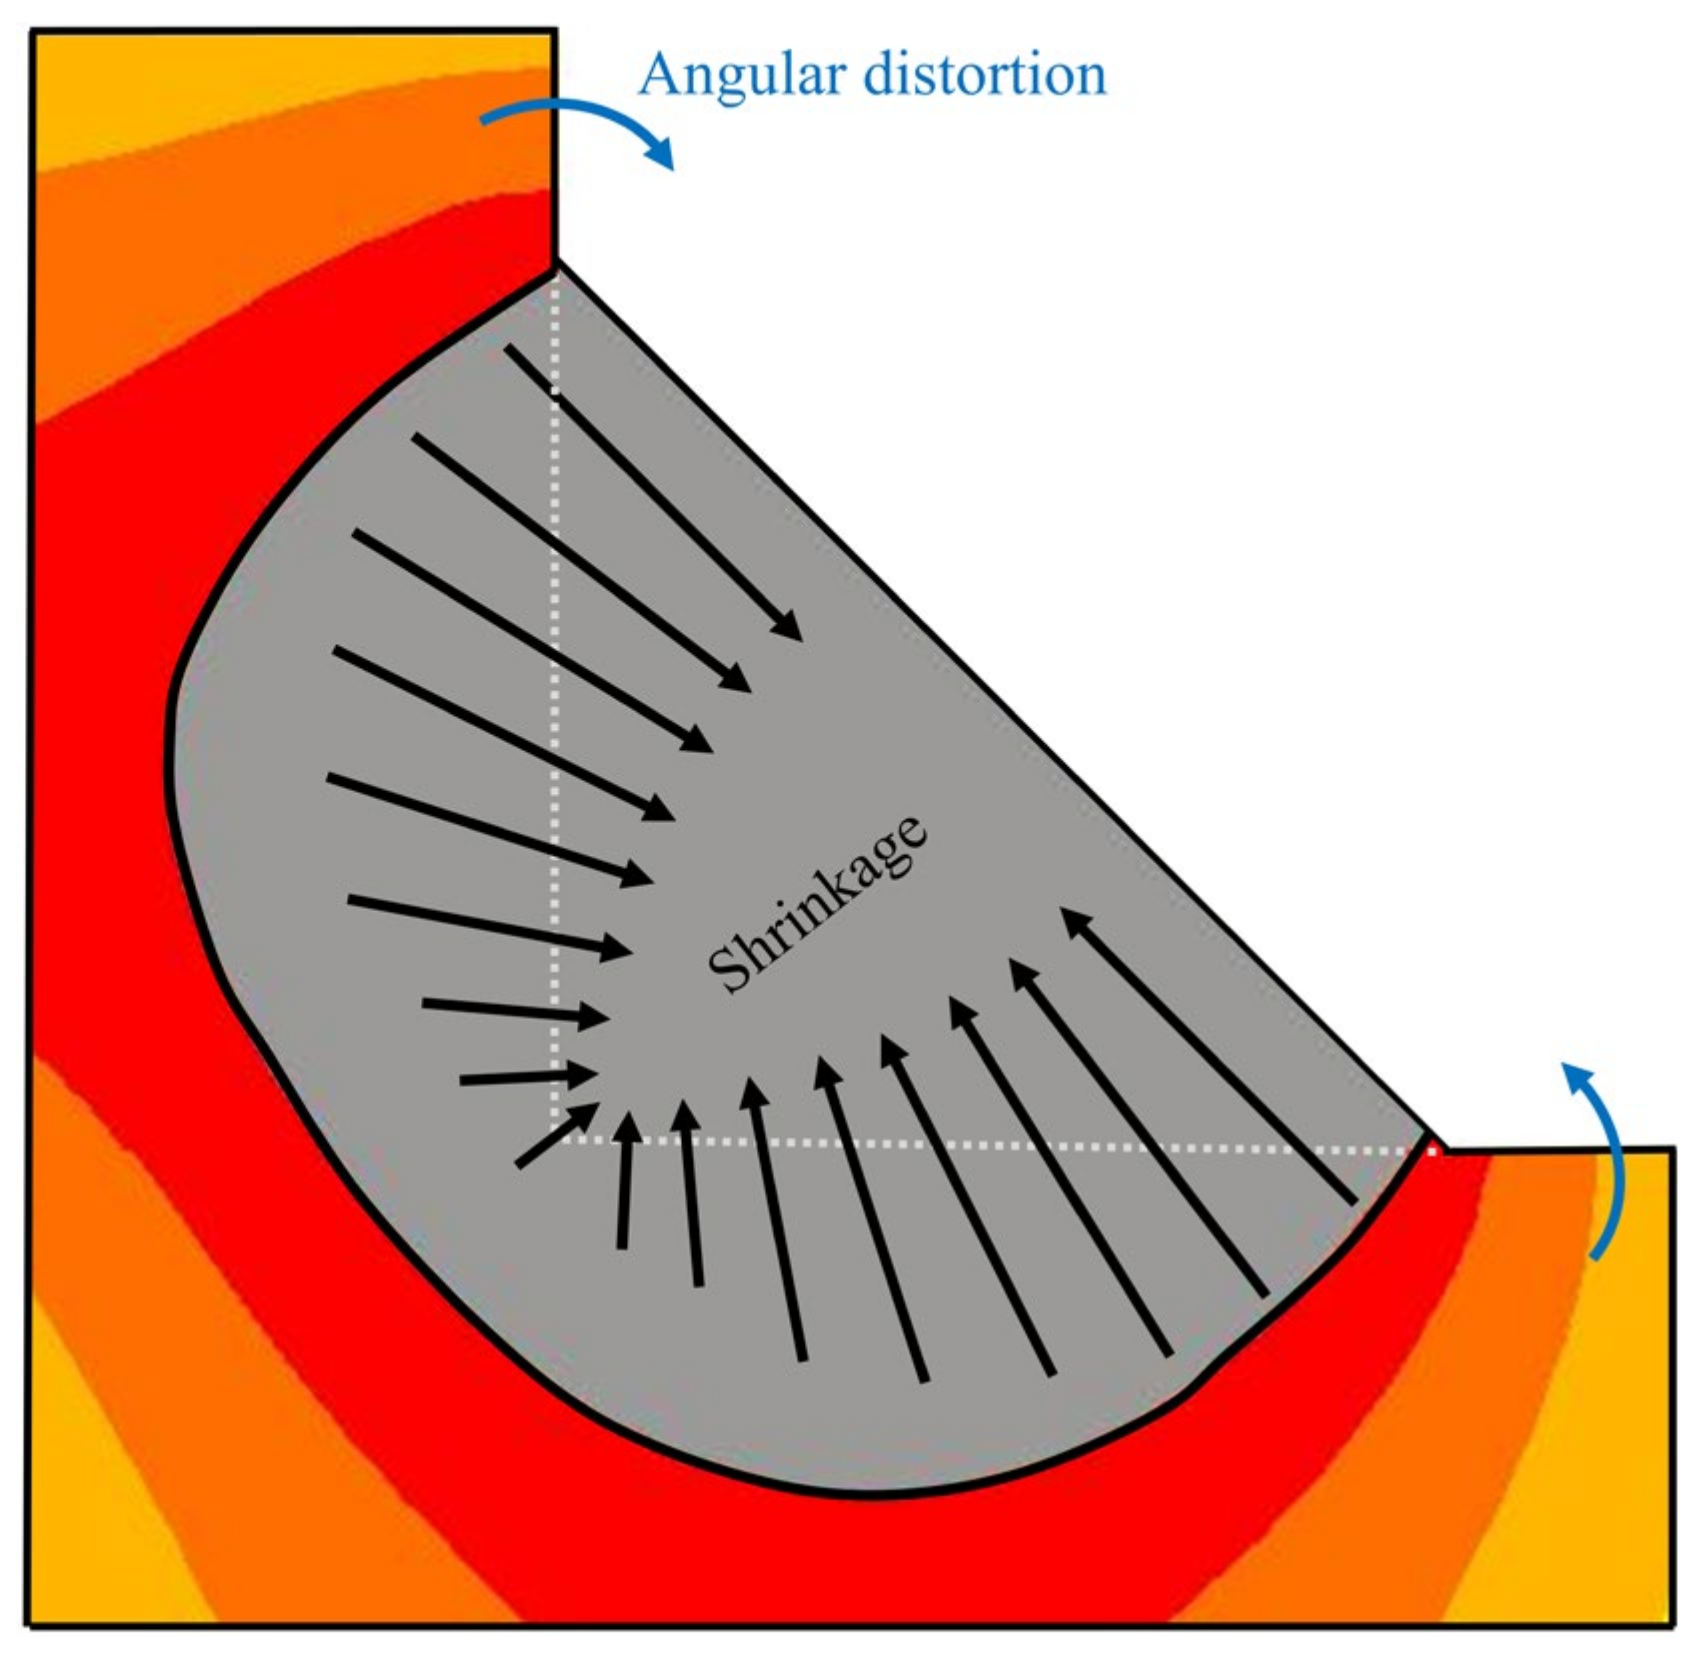
4.3. Consideration and Discussion

In comparing the welding deformation at each point selected horizontally in the direction of welding within the fillet weld zone, it was confirmed that the deformation occurred at the 240 mm position. This longitudinal distortion is attributed to a moment generated by the longitudinal contraction force of the welded metal. Rapid thermal expansion and contraction in the welded area occur due to the locally applied welding heat, and it was observed that greater thermal deformation due to welding happened on the right side, where welding was performed an additional time compared to the left side. This result is considered a fundamental phenomenon occurring in welding [22,40,41]. Figure 14 presents a schematic diagram of the deformation trend observed in the fillet weld zone.
In the case of a weld zone, a significant amount of heat is applied instantaneously to the base metal, creating a dilution area with the injected filler metal. After the base metal and filler metal mix, shrinkage stress occurs due to the dilution and the weld bead portion that cools rapidly, leading to longitudinal distortion. In other words, the extent of deformation in the welded structure is determined by the magnitude of the shrinkage stress. Shrinkage stress is related to the heat effect caused by welding, and the larger the dilution zone in the weld area, the greater the shrinkage stress. Therefore, since the size of the diluted area in the weld zone is influenced by the welding heat source, it was confirmed that selecting appropriate welding heat source conditions is crucial for predicting deformation due to shrinkage in the weld zone.
These results suggest that using the geometric dimensions of the welding heat source, measured at the weld bead, rather than estimated values during FEM simulation, can improve the accuracy of the simulation results. Referring to Figure 13, which shows the standard deviation of the deformation prediction results for the welding deformation studied, the deviation within 25 to 75% of the results was found to be within 1.0 mm at all locations. This level of error is acceptable for practical use in the shipbuilding field [42]. The findings of this study indicate that these results can be utilized for predicting deformation in aluminum shipbuilding.

5. Conclusions

In this study, a model was developed to predict the thermal deformation of welds based on the heat source geometry obtained from actual weld beads. The deformation of fillet welds used in the hull substructure of Al 5080 material was predicted, and the following conclusions were drawn.
Because welding speed affects the time the bead-forming wire dwells in a unit area, during the formation of a fillet weld bead, the throat length of the weld bead formed is more affected by welding speed than by current and voltage. It was found that the penetration depth formed during the process of melting and diluting the base metal is more influenced by the current and voltage than the welding speed.
Welding deformation was predicted using the dimensions of the heat source shape formed under the conditions of a welding speed of 30 cm/min, a welding current of 177 A, and a voltage of 20.7 V. The difference between the predicted deformation and the deformation measured in the actual fillet weld ranged from a minimum of 0.02 mm to a maximum of 1.4 mm, indicating a similar deformation trend.
It was observed that most of the deformation in the fillet-welded area was directed upwards from the fixed center, suggesting that the deformation occurred in the direction of the welded area due to the shrinkage stress generated by the heat from the welding process.
The diluted area between the base material and the weld bead in the weld zone experiences shrinkage stress during the cooling process after welding, leading to deformation. Since the size of the diluted area is influenced by the welding heat source, accurately predicting welding deformation requires the appropriate selection of heat source conditions.
The study found that the standard deviation of the actual and predicted deformation results within the 25 to 75% range was within 1.0 mm, which is acceptable for the shipbuilding field. The analysis model applying the heat source shape confirmed that it could contribute to predicting actual welding thermal deformation in fillet welds of the aluminum hull lower structure, establishing welding conditions, and developing methods to reduce deformation.

Author Contributions

Conceptualization, J.K.; data curation, S.W.; formal analysis, C.-W.L.; investigation, S.W.; methodology, C.-W.L.; project administration, J.K.; supervision, J.K.; validation, C.-W.L. and J.K.; writing—original draft, C.-W.L.; writing—review and editing, S.W. and J.K.; experiment, C.-W.L.; software, S.W.; validation, J.K. and C.-W.L.; paper research, S.W., J.K. and C.-W.L.; data analysis, C.-W.L.; writing—original draft preparation, C.-W.L.; writing—review and editing, C.-W.L. and S.W.; supervision, J.K.; project administration, J.K. All authors have read and agreed to the published version of the manuscript.

Funding

This study was supported by the “Hydrogen Fuel Cell-Based Leisure Ship Construction Demonstration Project (KITECH PIZ23860)” in Jeollanam-do and Yeongam-gun.

Data Availability Statement

The original contributions presented in the study are included in the article, further inquiries can be directed to the corresponding author.

Conflicts of Interest

The authors declare no conflict of interest.

References

  1. Farajkhah, V.; Liu, Y. Effect of Fabrication Methods on the Ultimate Strength of Aluminum Hull Girders. Ocean Eng. 2016, 114, 269–279. [Google Scholar] [CrossRef]
  2. Guo, Z.; Bai, R.; Lei, Z.; Jiang, H.; Zou, J.; Yan, C. Experimental and Numerical Investigation on Ultimate Strength of Laser-Welded Stiffened Plates Considering Welding Deformation and Residual Stresses. Ocean Eng. 2021, 234, 109239. [Google Scholar] [CrossRef]
  3. Reza Kashyzadeh, K.; Amiri, N.; Maleki, E.; Unal, O. A Critical Review on Improving the Fatigue Life and Corrosion Properties of Magnesium Alloys via the Technique of Adding Different Elements. J. Mar. Sci. Eng. 2023, 11, 527. [Google Scholar] [CrossRef]
  4. Kishta, E.E.; Darras, B. Experimental Investigation of Underwater Friction-Stir Welding of 5083 Marine-Grade Aluminum Alloy. Proc. Inst. Mech. Eng. Part B J. Eng. Manuf. 2016, 230, 458–465. [Google Scholar] [CrossRef]
  5. Feng, Z.; Li, J.; Ma, J.; Su, Y.; Zheng, X.; Mao, Y.; Zhao, Z. EBSD Characterization of 7075 Aluminum Alloy and Its Corrosion Behaviors in SRB Marine Environment. J. Mar. Sci. Eng. 2022, 10, 740. [Google Scholar] [CrossRef]
  6. Kumar Dewangan, S.; Kumar Tripathi, M.; Nandan Banjare, P.; Kumar Manoj, M. Temperature Distribution of Friction Stir Welded Al 7075 alloy using Finite Element Simulation along with Experimental Validation. Mater. Today Proc. 2018, in press. [Google Scholar] [CrossRef]
  7. Ahmed, S.; Rahman, R.A.u.; Awan, A.; Ahmad, S.; Akram, W.; Amjad, M.; Yahya, M.Y.; Rahimian Koloor, S.S. Optimization of Process Parameters in Friction Stir Welding of Aluminum 5451 in Marine Applications. J. Mar. Sci. Eng. 2022, 10, 1539. [Google Scholar] [CrossRef]
  8. Zhang, W.; Wang, S. Investigation of Laser-MIG Hybrid Welding of Al-Mg-Si Aluminum Alloy. Metals 2024, 14, 729. [Google Scholar] [CrossRef]
  9. Zhang, J.; Liu, Y.; Cheng, L.; Kang, D.; Gao, R.; Qin, Y.; Mei, Z.; Zhang, M.; Yu, M.; Sun, Z. Design and Performance Study of Carbon Fiber-Reinforced Polymer Connection Structures with Surface Treatment on Aluminum Alloy (6061). Coatings 2024, 14, 785. [Google Scholar] [CrossRef]
  10. Kim, Y.; Kim, J.; Kang, S. A Study on Welding Deformation Prediction for Ship Blocks Using the Equivalent Strain Method Based on Inherent Strain. Appl. Sci. 2019, 9, 4906. [Google Scholar] [CrossRef]
  11. Li, L.; Luo, C.; Shen, J.; Zhang, Y. Numerical Prediction of Welding Deformation in Ship Block Subassemblies Via the Inhomogeneous Inherent Strain Method. J. Manuf. Process. 2022, 80, 860–873. [Google Scholar] [CrossRef]
  12. Sun, J.; Nitschke Pagel, T.; Dilger, K. Influence of Strain-Hardening Models and Slopes on the Predicted Residual Stresses in Structural Steel S235 Weldments. J. Mater. Res. Technol. 2022, 19, 4044–4062. [Google Scholar] [CrossRef]
  13. Jang, H.L.; Ryu, H.; Kang, S. A Study on the Effects of Welding Deformation According to Weld Sequence in Overlay-Welded Structures. Metals 2024, 14, 684. [Google Scholar] [CrossRef]
  14. Raftar, H.R.; Ahola, A.; Lipiäinen, K.; Björk, T. Simulation and Experiment on Residual Stress and Deflection of Cruciform Welded Joints. J. Constr. Steel Res. 2023, 208, 108023. [Google Scholar] [CrossRef]
  15. Peng, X.; Yao, D.; Ye, F.; Gong, J.; Zhang, L. Numerical Simulation of Welding Residual Stress in Incoloy 825/L360QS Bimetal Clad Tube. Int. J. Pres. Ves. Pip. 2023, 206, 105080. [Google Scholar] [CrossRef]
  16. Meléndez-Morales, L.D.; Ruíz-Mondragón, J.J.; Hernández-Hernández, M. In-Service Weld Repair by Direct Deposition: Numerical Simulation and Experimental Validation. Eng. Sci. Technol. Int. J. 2023, 46, 101503. [Google Scholar] [CrossRef]
  17. Yi, J.; Chen, Z.; Li, D.; Li, J.; Liu, J. Conditional generative adversarial network for welding deformation field prediction of butt-welded plates. J. Constr. Steel Res. 2022, 201, 107755. [Google Scholar] [CrossRef]
  18. Murakawa, H.; Deng, D.; Ma, N.; Wang, J. Applications of inherent strain and interface element to simulation of welding deformation in thin plate structures. Comput. Mater. Sci. 2012, 51, 43–52. [Google Scholar] [CrossRef]
  19. Preston, R.V.; Shercliff, H.R.; Withers, P.J.; Smith, S. Physically-based constitutive modelling of residual stress development in welding of aluminium alloy 2024. Acta Mater. 2004, 52, 4973–4983. [Google Scholar] [CrossRef]
  20. Li, T.; Wang, Y.; Yin, X.; Zhang, Z. Laser welding simulation of large-scale assembly module of stainless steel side-wall. Heliyon 2023, 9, e13835. [Google Scholar] [CrossRef]
  21. Wu, R.; Huang, Y.; Rong, Y.; Xu, J.; Chen, Q. Solid phase transformation effects on stress and strain in the thick plate EH40 welded butt joint. Opt. Laser. Technol. 2023, 157, 108635. [Google Scholar] [CrossRef]
  22. Han, Y.H.; Lim, H.B.; Shin, T.S.; Yang, H.I. Prediction of Welding Deformation Using the Thermal Elastic–Plastic Finite Element Method by Considering Welding Interpass Temperature. Materials 2024, 17, 3656. [Google Scholar] [CrossRef] [PubMed]
  23. Xu, F.; Zhao, Y.; Chen, J.; Liu, X.; Huang, Y. Experimental and Numerical Investigation on Residual Stress and Deformation of Welded I-Section Curved Steel Beams. Thin Walled Struct. 2024, 199, 111821. [Google Scholar] [CrossRef]
  24. Sun, J.; Dilger, K. Influence of Welding Sequence and External Restraint on Buckling Distortion in Thin-Plate Arc-Welded Joints. J. Adv. Join. Process. 2023, 8, 100157. [Google Scholar] [CrossRef]
  25. Sadeghi-Chahardeh, A.; Abdollahi-Mamoudan, F. Temperature-Driven Instabilities in High-Pressure Vessel Flat Plates: A Thermal Buckling Study. Designs 2024, 8, 81. [Google Scholar] [CrossRef]
  26. Li, C.; Zhai, H.; Liu, Z.; Ma, J.; Ji, H.; Liu, Q. Suppressing Welding Deformation Instability of Vacuum Vessel Considering External Restraint and Welding Sequence. Fusion Eng. Des. 2023, 196, 114007. [Google Scholar] [CrossRef]
  27. Mcpherson, N.; Galloway, A.; Mcghee, W.; Soares, C.G. Thin plate buckling mitigation and reduction challenges for naval ships. J. Mar. Eng. Technol. 2013, 12, 3–10. [Google Scholar]
  28. Tan, L.; Zhang, J.; Zhuang, D.; Liu, C. Influences of lumped passes on welding residual stress of a thick-walled nuclear rotor steel pipe by multipass narrow gap welding. Nucl. Eng. Des. 2014, 273, 47–57. [Google Scholar] [CrossRef]
  29. Su, Y.; Yang, X.; Wu, D.; Meng, T.; Li, W.; Feng, W.; Vairis, A. Optimizing Welding Sequence of TIG Cross-Joint of Invar Steel Using Residual Stresses and Deformations. J. Manuf. Process. 2023, 105, 232–245. [Google Scholar] [CrossRef]
  30. Woo, D.; Kitamura, M.; Takezawa, A. Method to systemically order welding sequence to efficiently mitigate welding displacement of a general ship grillage structure. Ships Offshore Struct. 2019, 15, 753–768. [Google Scholar] [CrossRef]
  31. Hashemzadeh, M.; Garbatov, Y.; Guedes Soares, C. Analytically Based Equations for Distortion and Residual Stress Estimations of Thin Butt-Welded Plates. Eng. Struct. 2017, 137, 115–124. [Google Scholar] [CrossRef]
  32. Ueda, Y.; Yamakawa, T. Analysis of Thermal Elastic-Plastic Stress and Strain During Welding by Finite Element Method. Trans. Jpn. Weld. Soc. 1971, 2, 90–100. [Google Scholar]
  33. Lee, J.; Chung, H. Modified Equivalent Load Method for Welding Distortion Analysis. J. Mar. Sci. Eng. 2020, 8, 794. [Google Scholar] [CrossRef]
  34. Burghold, E.M.; Frekers, Y.; Kneer, R. Transient Contact Heat Transfer Mmeasurements Based on High-Speed IR-Thermography. Int. J. Therm. Sci. 2017, 115, 169–175. [Google Scholar] [CrossRef]
  35. Korean Register. Rules and Guidance for the Classification of Steel Ships: Part 2 Materials and Welding; Korean Register: Busan, Republic of Korea, 2022; pp. 133–140. [Google Scholar]
  36. Korean Register. Rules and Guidance for the Classification of Steel Ships: Part 3 Hull Structures; Korean Register: Busan, Republic of Korea, 2022; pp. 255–266. [Google Scholar]
  37. Pyo, C.; Jeong, S.M.; Kim, J.; Park, M.; Shin, J.; Kim, Y.; Son, J.; Kim, J.H.; Kim, M.H. A Study on the Enhanced Process of Elaborate Heat Source Model Parameters for Flux Core Arc Welding of 9% Nickel Steel for Cryogenic Storage Tank. J. Mar. Sci. Eng. 2022, 10, 1810. [Google Scholar] [CrossRef]
  38. Goldak, J.; Chakravarti, A.; Bibby, M. A New Finite Element Model for Welding Heat Sources. Metall. Trans. B 1984, 15, 299–305. [Google Scholar] [CrossRef]
  39. Lee, C.; Woo, S.; Kim, J. Impact Analysis of Welding Sequence to Reduce Weld Deformation in Aluminum Hulls. J. Mar. Sci. Eng. 2024, 12, 1604. [Google Scholar] [CrossRef]
  40. Wu, C.; Kim, J.W. Numerical Prediction of Deformation in Thin-Plate Welded Joints Using Equivalent Thermal Strain Method. Thin Walled Struct. 2020, 157, 107033. [Google Scholar] [CrossRef]
  41. Feng, Y.; Liu, Y.; Wang, J.; Li, R. Research on Simulation and Optimization of Traveling Induction Heating Process for Welding Deformation Rectification in High Strength Steel Sheet. Metals 2023, 13, 425. [Google Scholar] [CrossRef]
  42. Romanin, L.; Ferro, P.; Berto, F. A Simplified Non-Linear Numerical Method for the Assessment of Welding Induced Deformations. Mar. Struct. 2021, 78, 102982. [Google Scholar] [CrossRef]
Figure 1. Welding equipment configuration and welding location used in the experiment.
Processes 12 02628 g001
Figure 2. Welding jig and deformation measurement locations used in the experiment: (a) welding jig; (b) weld deformation measurement locations.
Processes 12 02628 g002
Figure 3. Mesh in FEM model.
Processes 12 02628 g003
Figure 4. Properties of Al 5083 as a function of temperature: (a) thermal conductivity; (b) expansion coefficient; (c) specific heat; (d) latent heat.
Processes 12 02628 g004
Figure 5. Bead dimensioning locations and welding results: (a) bead dimensioning locations; (b) fillet welding experiment results.
Processes 12 02628 g005
Figure 6. Bead geometry dimensioning results as a function of weld variables: (a) throat length; (b) penetration depth; (c) contact angle.
Processes 12 02628 g006
Figure 7. Heat source geometry of the weld bead.
Processes 12 02628 g007
Figure 8. Heat distribution of Goldak model. Reproduced with permission from [39].
Processes 12 02628 g008
Figure 9. Simulation results by arc efficiency condition: (a) arc efficiency 80%; (b) 85%; (c) 90%.
Processes 12 02628 g009
Figure 10. Comparison of bead geometry results at 90% arc efficiency.
Processes 12 02628 g010
Figure 11. Deformation prediction results.
Processes 12 02628 g011
Figure 12. Comparison of simulation and experimental results: (a) line 1, (b) line 2, (c) line 3, (d) line 4, (e) line 5.
Processes 12 02628 g012
Figure 13. Standard deviation of measured and simulation deformation values.
Processes 12 02628 g013
Figure 14. Schematic diagram of deformation trend of fillet weld.
Processes 12 02628 g014
Table 1. Chemical composition of Al 5183 material.
FeMgSiAl
<14.3~5.2<1Bal.
Table 2. Chemical composition of Al 5083 material.
FeMgSiCuMnMgCrZnTi
0.294.80.060.030.674.80.10.010.02
Table 3. Experimental conditions of welding.
Test No.Current (A)Voltage (V)Welding Speed (cm/min)
112819.430
215720.030
317720.730
412819.435
515720.035
617720.735
712819.440
815720.040
917720.740
Table 4. Heat source geometry used in the Goldak model.
VariableLevel
Front length (af)7.356 mm
Rear length (ar)12.221 mm
Width (b)6.102 mm
Depth (c)7.683 mm
Disclaimer/Publisher’s Note: The statements, opinions and data contained in all publications are solely those of the individual author(s) and contributor(s) and not of MDPI and/or the editor(s). MDPI and/or the editor(s) disclaim responsibility for any injury to people or property resulting from any ideas, methods, instructions or products referred to in the content.

