4.1. Vertical Model
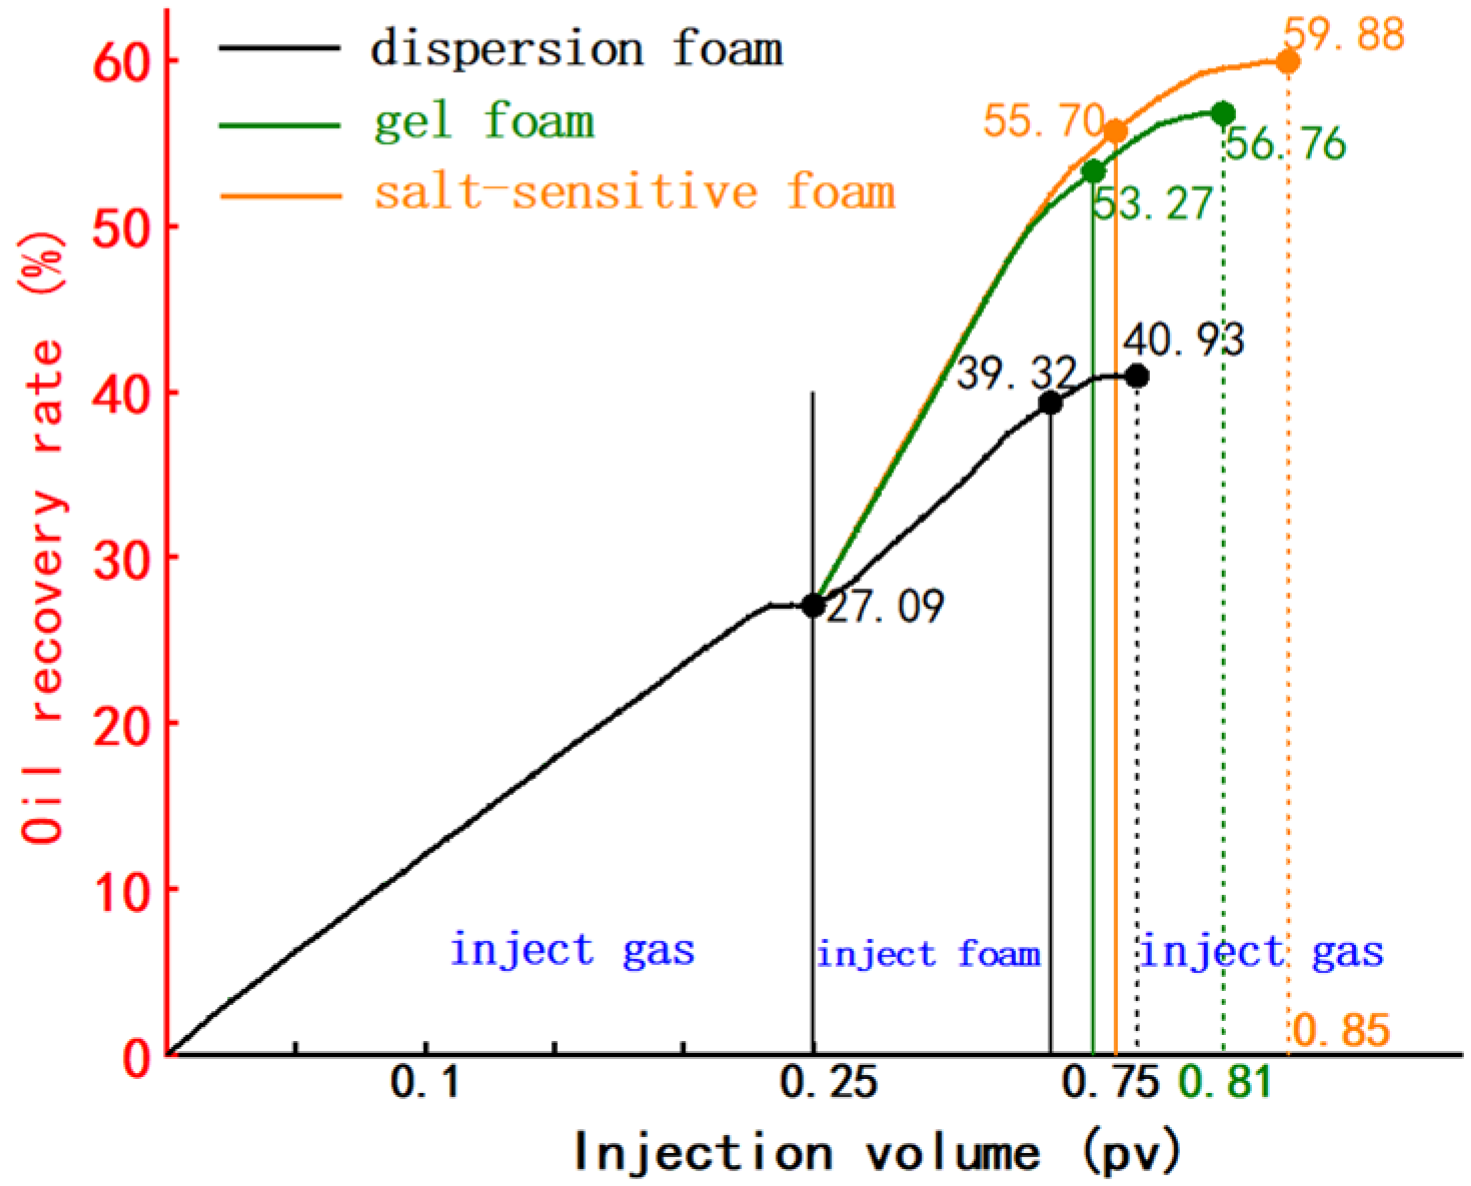
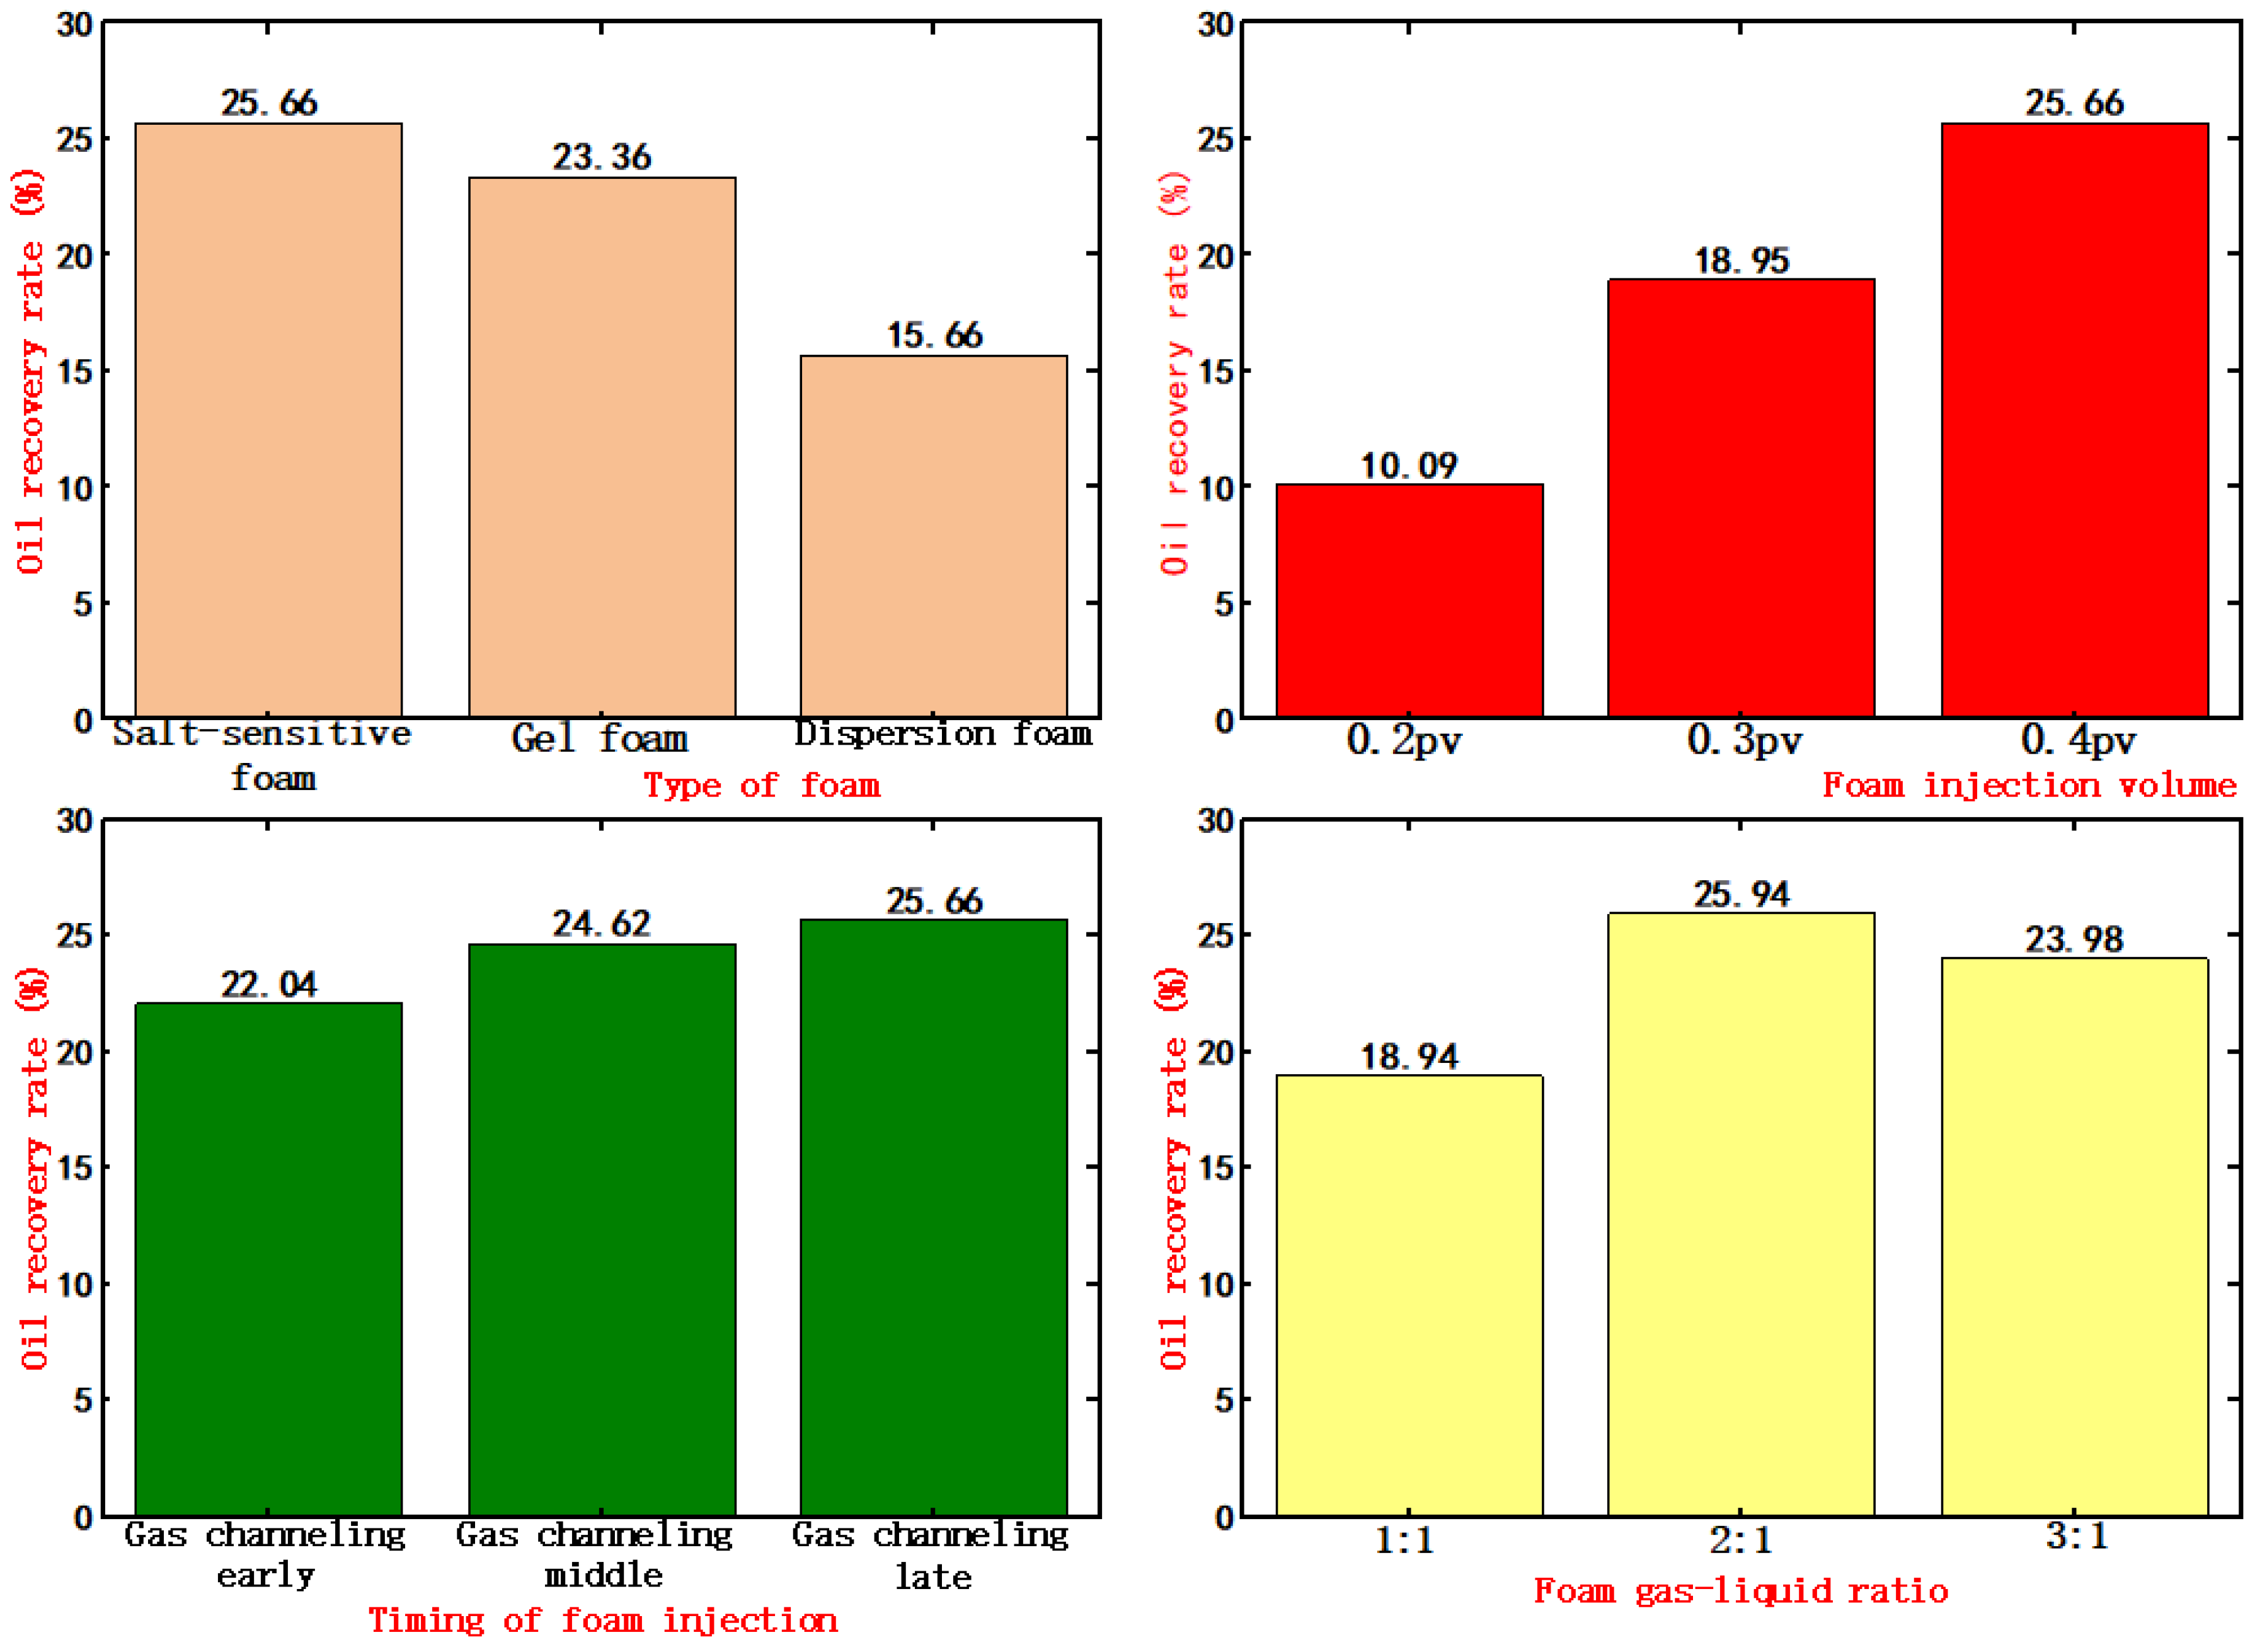
(1) Foam Type Optimization
The comparison of the effect of injecting different types of foams for assisted oil drive was studied when the injection volume was 0.4 pv, the gas–liquid ratio was 3:1, and the foam was injected for assisted gas drive at the late stage of gas flushing, and the experimental results are shown in
Table 1 and
Figure 9.
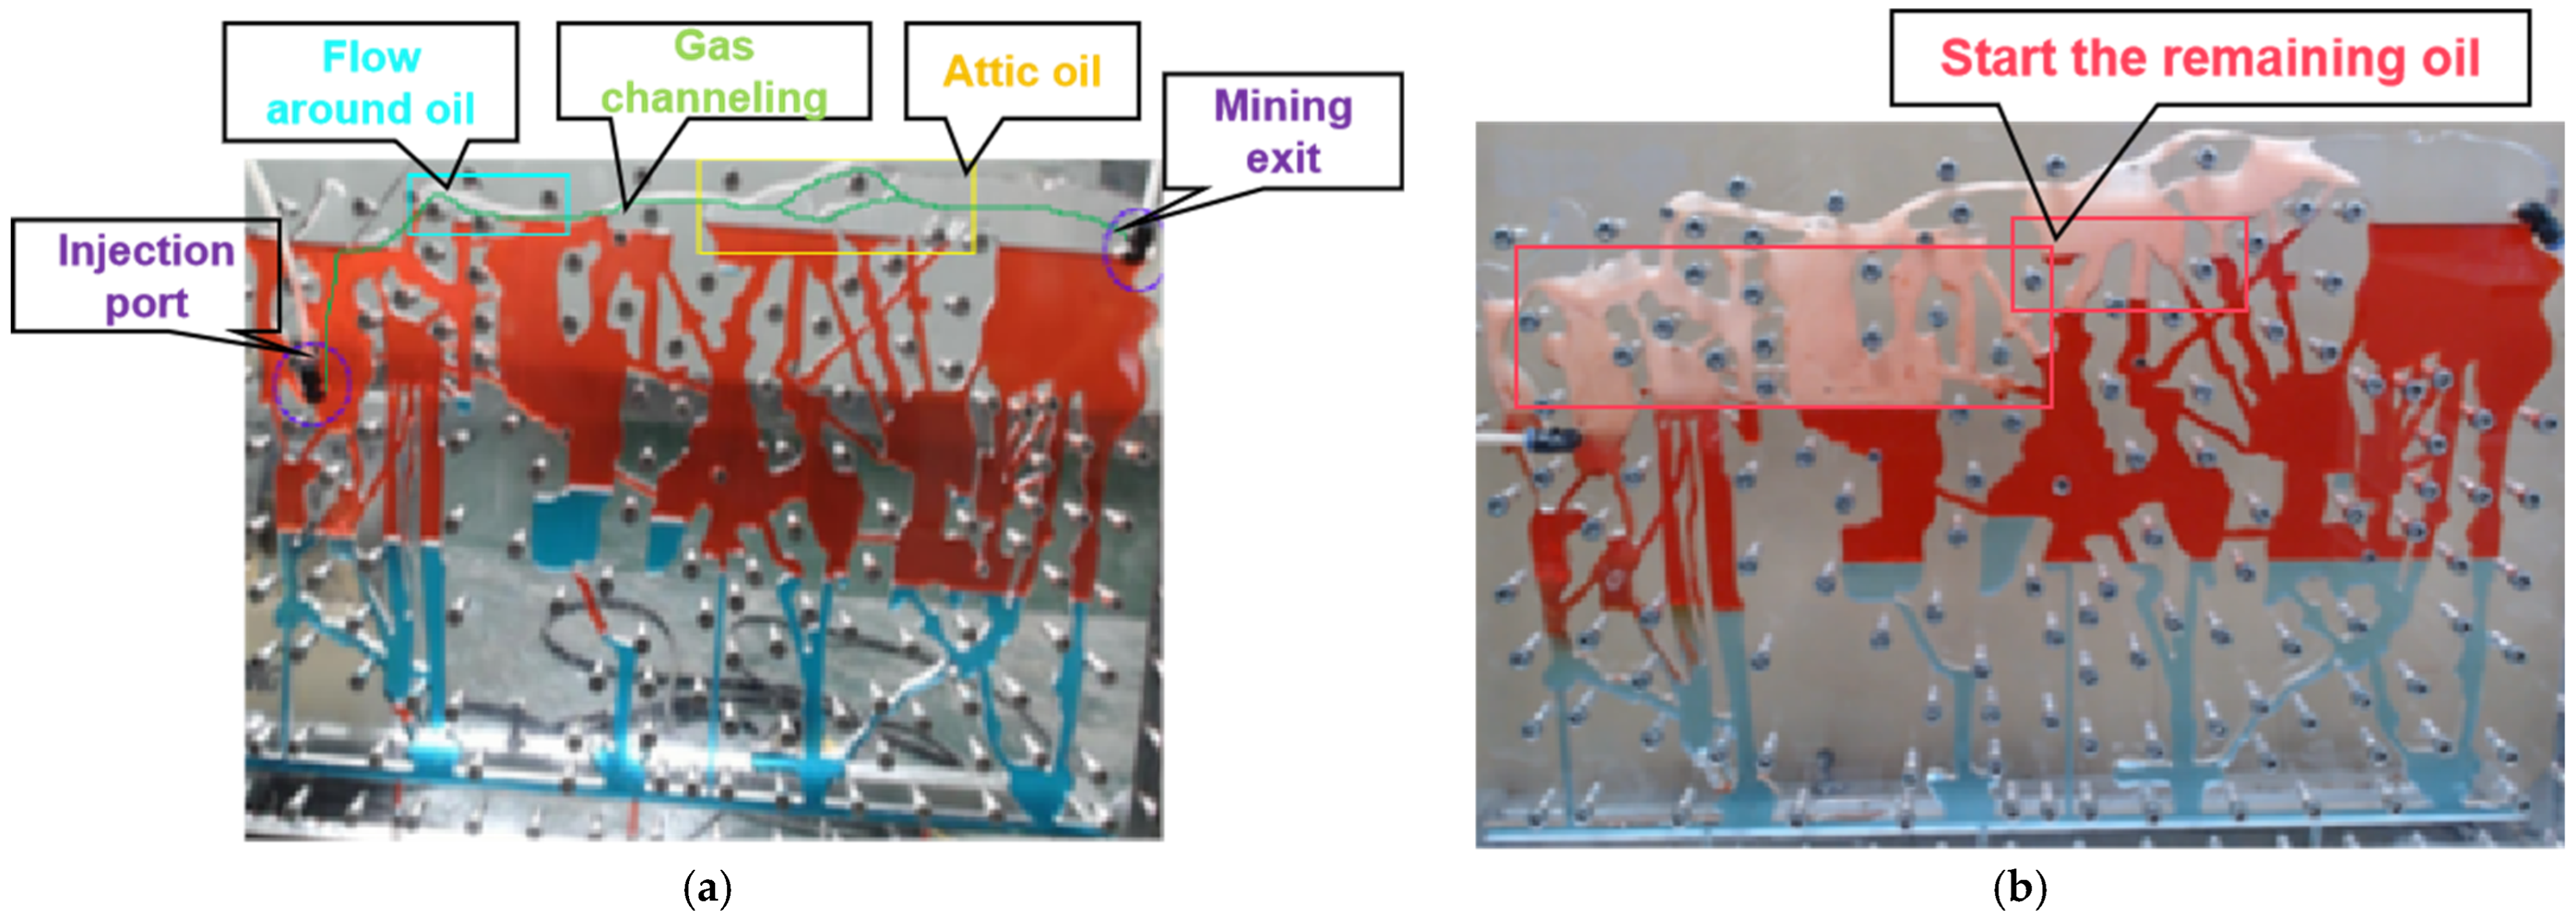
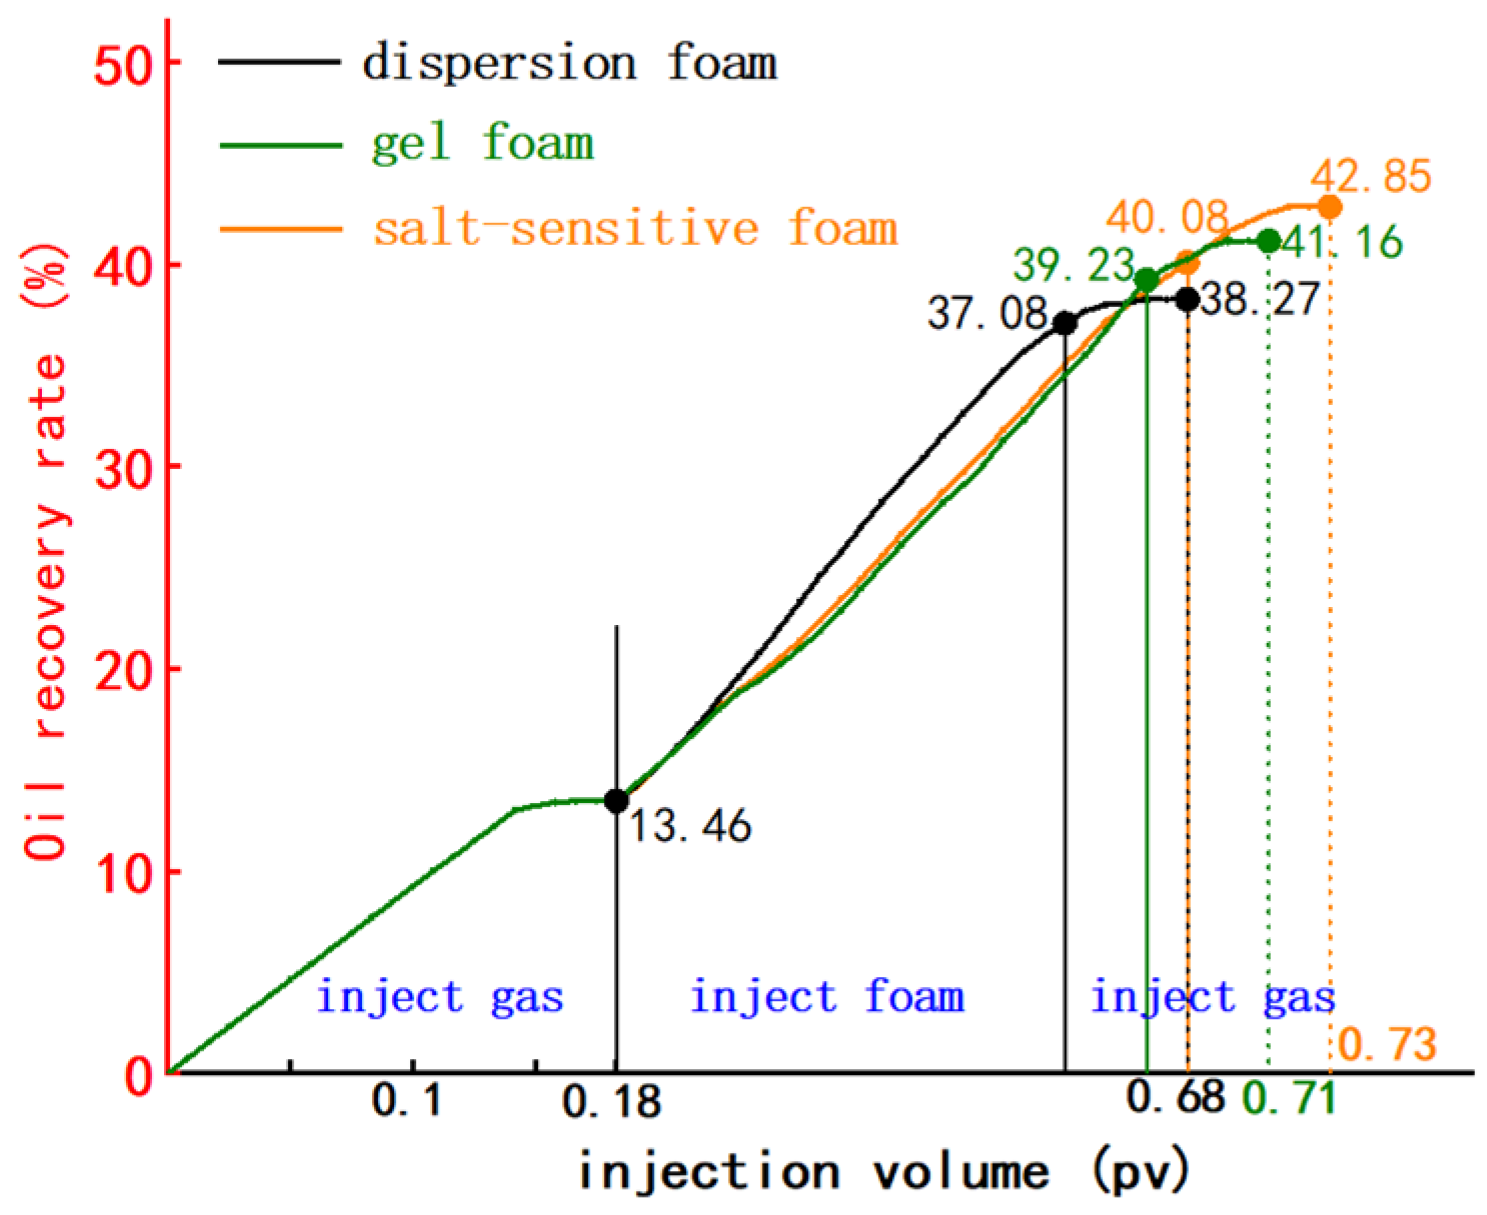
The experimental results show that the recovery rate of the salt-sensitive foam-assisted gas flooding model is the best among dispersed foam, gelatin foam, and salt-sensitive foam. The main reason is that compared with gelatin foam and dispersion foam, salt-sensitive foam has a longer half-life, defoaming is more difficult, and after injection into the model, the foam is more stable and more parts of the remaining oil can be started. Therefore, the injection of salt-sensitive foam-assisted gas flooding provides the best economic benefits after gas cannot be enhanced.
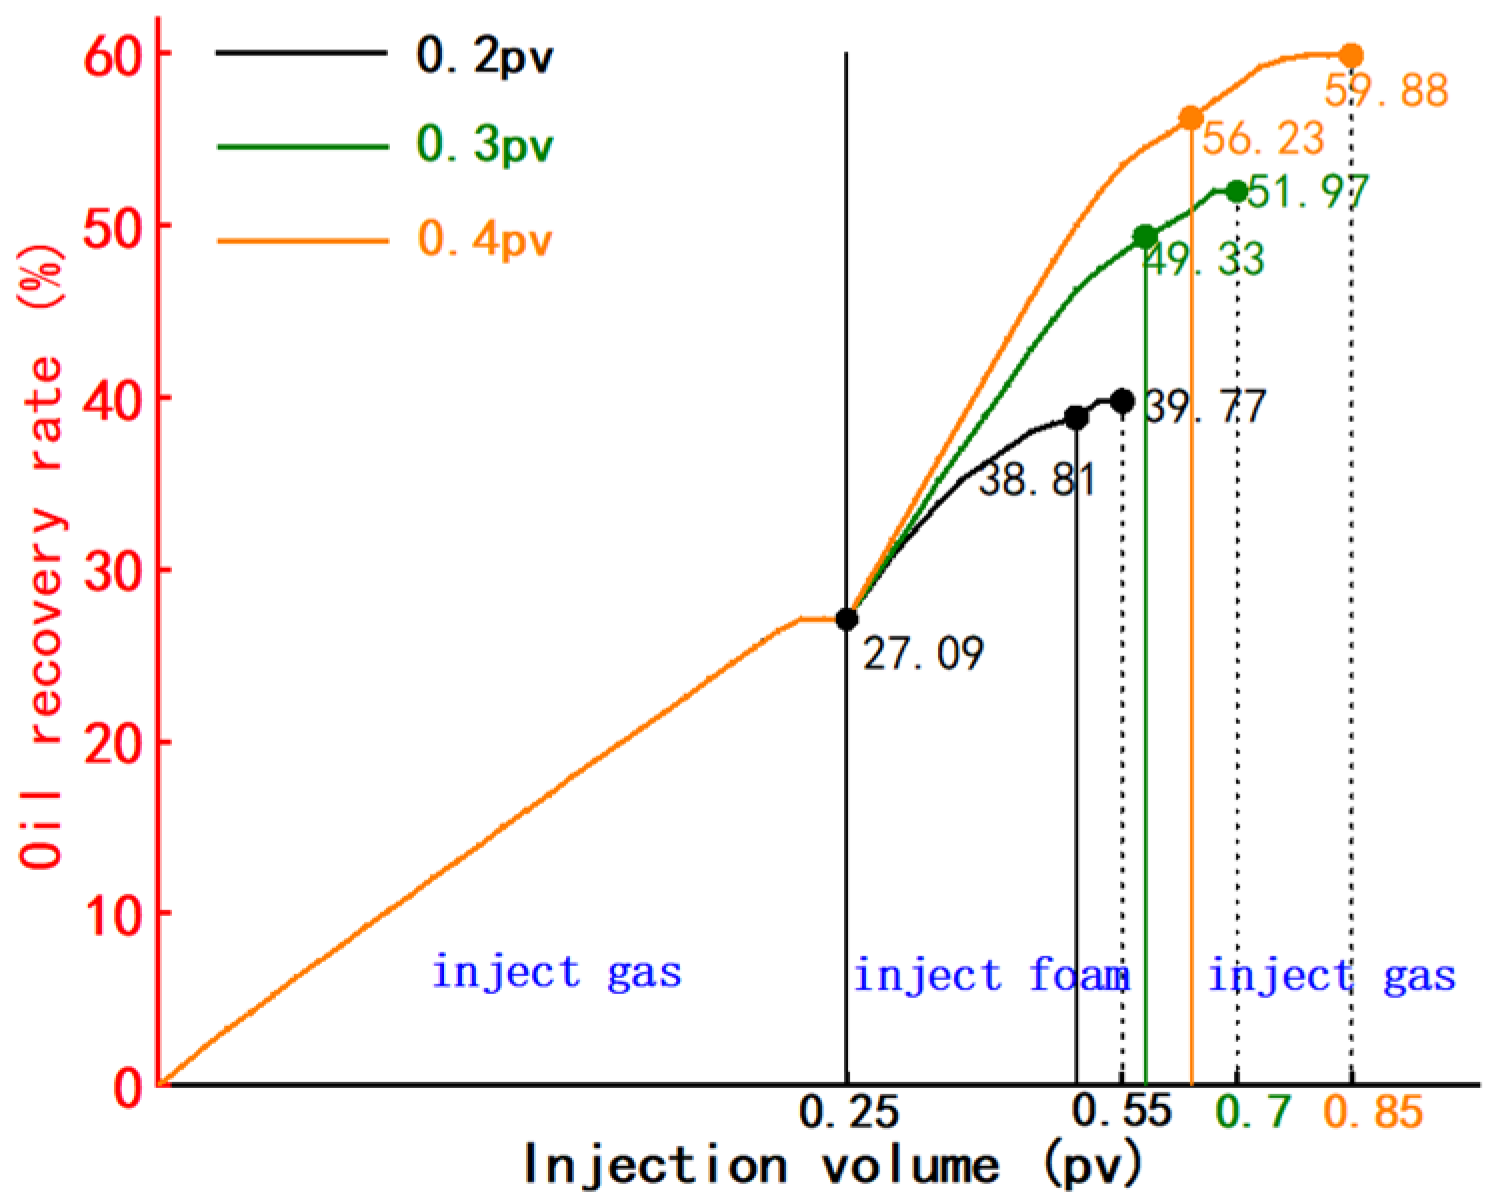
(2) Foam injection volume optimization
For the salt-sensitive foam, the comparison of the oil repelling effect under different foam injection volumes was studied when the gas–liquid ratio was 3:1 and foam-assisted gas drive was injected at the late gas flurry stage, and the experimental results are shown in
Table 2 and
Figure 10.
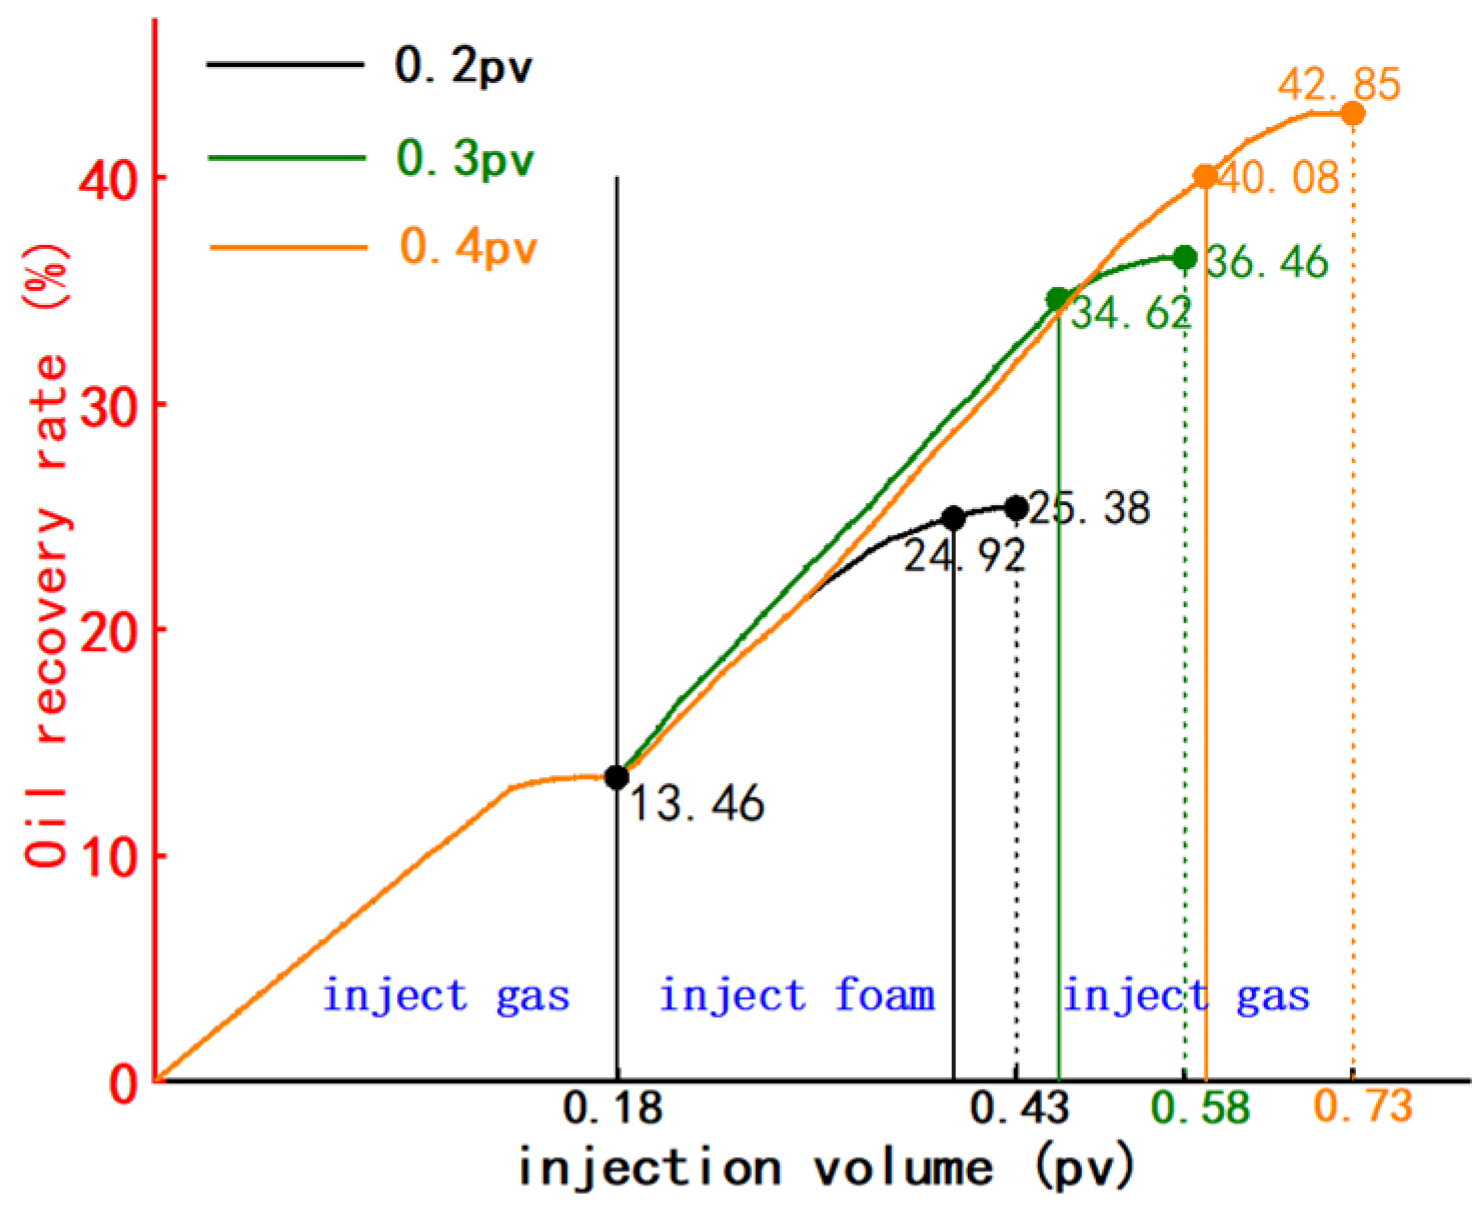
When 0.2 pv foam is injected, the recovery range of each 0.1 pv foam-assisted gas is 5.73%. When 0.3 pv foam is injected, the recovery range of each 0.1 pv foam-assisted gas is 7.05%. When 0.4 pv foam was injected, the recovery range of each 0.1 pv foam-assisted gas displacement was 6.65%. When the foam injection rate increases from 0.2 pv to 0.3 pv, the recovery rate increases by 11.08%, and when the foam injection rate increases from 0.3 pv to 0.4 pv, the recovery rate increases by 6.39%. The increase in recovery rate decreased.
According to the mean and range analysis, the optimal foam injection amount is between 0.3 pv and 0.4 pv. The optimized injection volume was 0.3 pv.
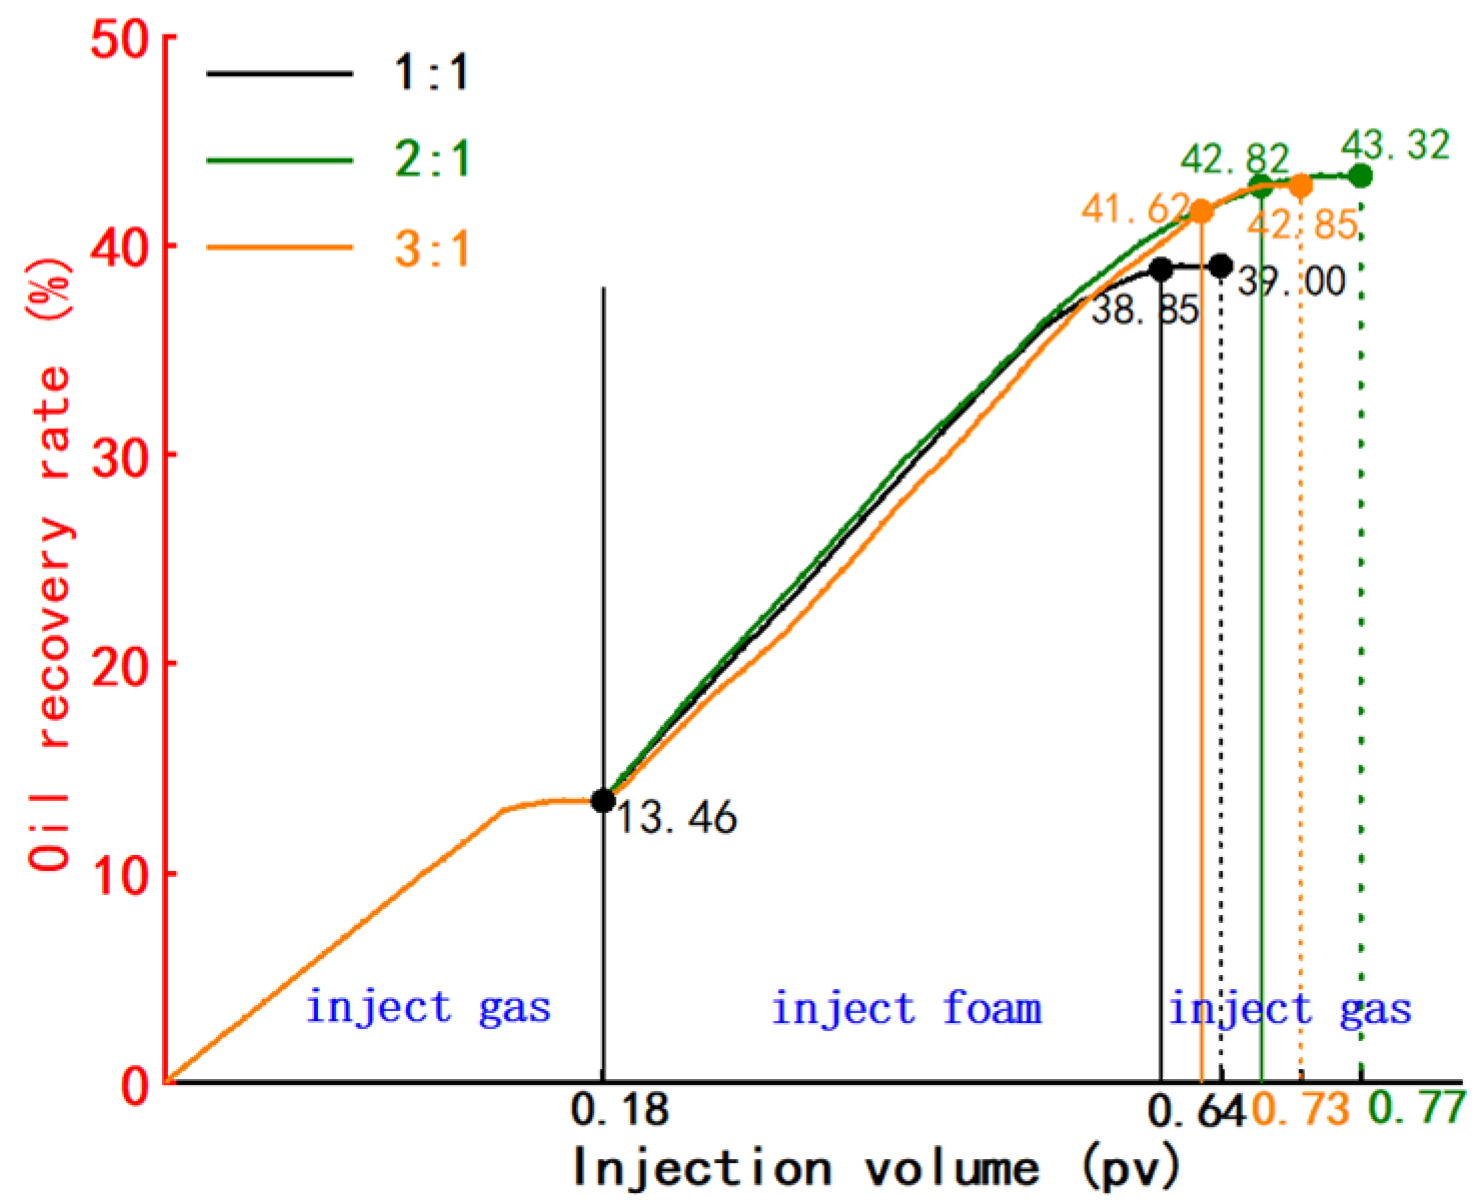
(3) Foam gas–liquid ratio optimization
For the salt-sensitive foam, the comparison of oil repelling effect under different gas–liquid ratios was investigated when the injection volume was 0.4 pv and the foam-assisted gas drive was injected at the late stage of the gas flurry, and the experimental results are shown in
Table 3 and
Figure 11.
When the gas–liquid ratio of foam injection is 1:1, the foam extraction range is 6.35% for every 0.1 pv. When the gas–liquid ratio of foam injection is 2:1, the foam extraction range is 7.34% for every 0.1 pv. When the gas–liquid ratio of foam injection is 3:1, the foam extraction amplitude is 7.04% for every 0.1 pv. When the gas–liquid ratio of foam is increased from 1:1 to 2:1, the recovery efficiency is increased by 4.32%, and when the gas–liquid ratio is increased to 3:1, the recovery efficiency is decreased by 0.47%.
According to the mean and range analysis, the foam gas–liquid ratio of 2:1 is the best gas–liquid ratio, and the foam-assisted gas drive effect is the best among the three kinds of gas–liquid ratio in the experiment.
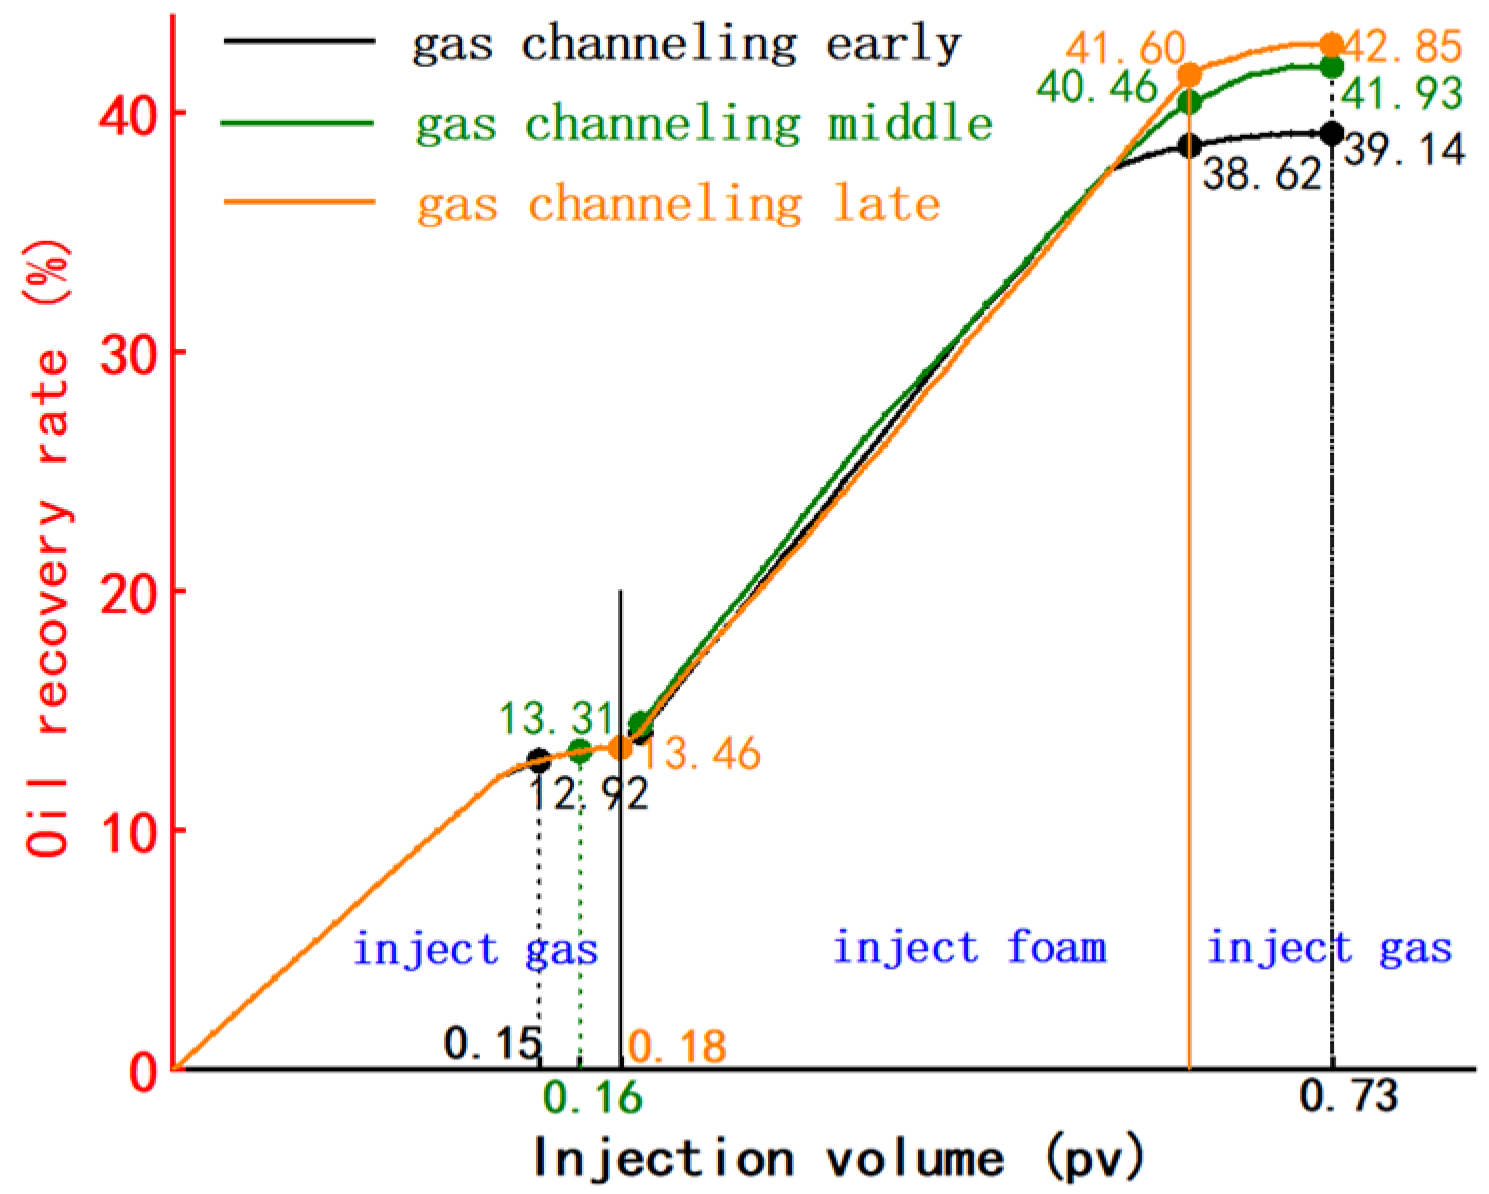
(4) Foam injection timing optimization
Salt-sensitive foam with 0.4 pv and a gas–liquid ratio of 3:1 was injected at the early stage, middle stage, and late stage of gas flushing to assist gas flushing, and the oil repelling performance of salt-sensitive foam at different injection times was compared. The experimental results are shown in
Table 4 and
Figure 12.
When the injection time is adjusted from the initial stage of gas channeling to the middle stage of gas channeling, the recovery rate increases by 2.79%. When adjusted to the late stage of gas channeling, the recovery rate increases by 0.92%. The recovery rate of foam-assisted gas drive in the early stage of gas channeling is 0.52%, that of foam-assisted gas drive in the middle stage of gas channeling is 1.47%, and that of foam-assisted gas drive in the late stage of gas channeling is 1.25%.
The comprehensive analysis of oil recovery at the range and secondary gas injection stage shows that foam injection-assisted gas flooding in the middle stage of gas channeling has the best economic benefit.
4.2. Horizontal Model
(1) Foam Type Optimization
The comparison of the effect of injecting different types of foams for oil repulsion was studied when the injection volume was 0.4 pv, the gas–liquid ratio was 2:1, and foam-assisted gas drive was injected at the late stage of gas flushing, and the experimental results are shown in
Table 5 and
Figure 13.
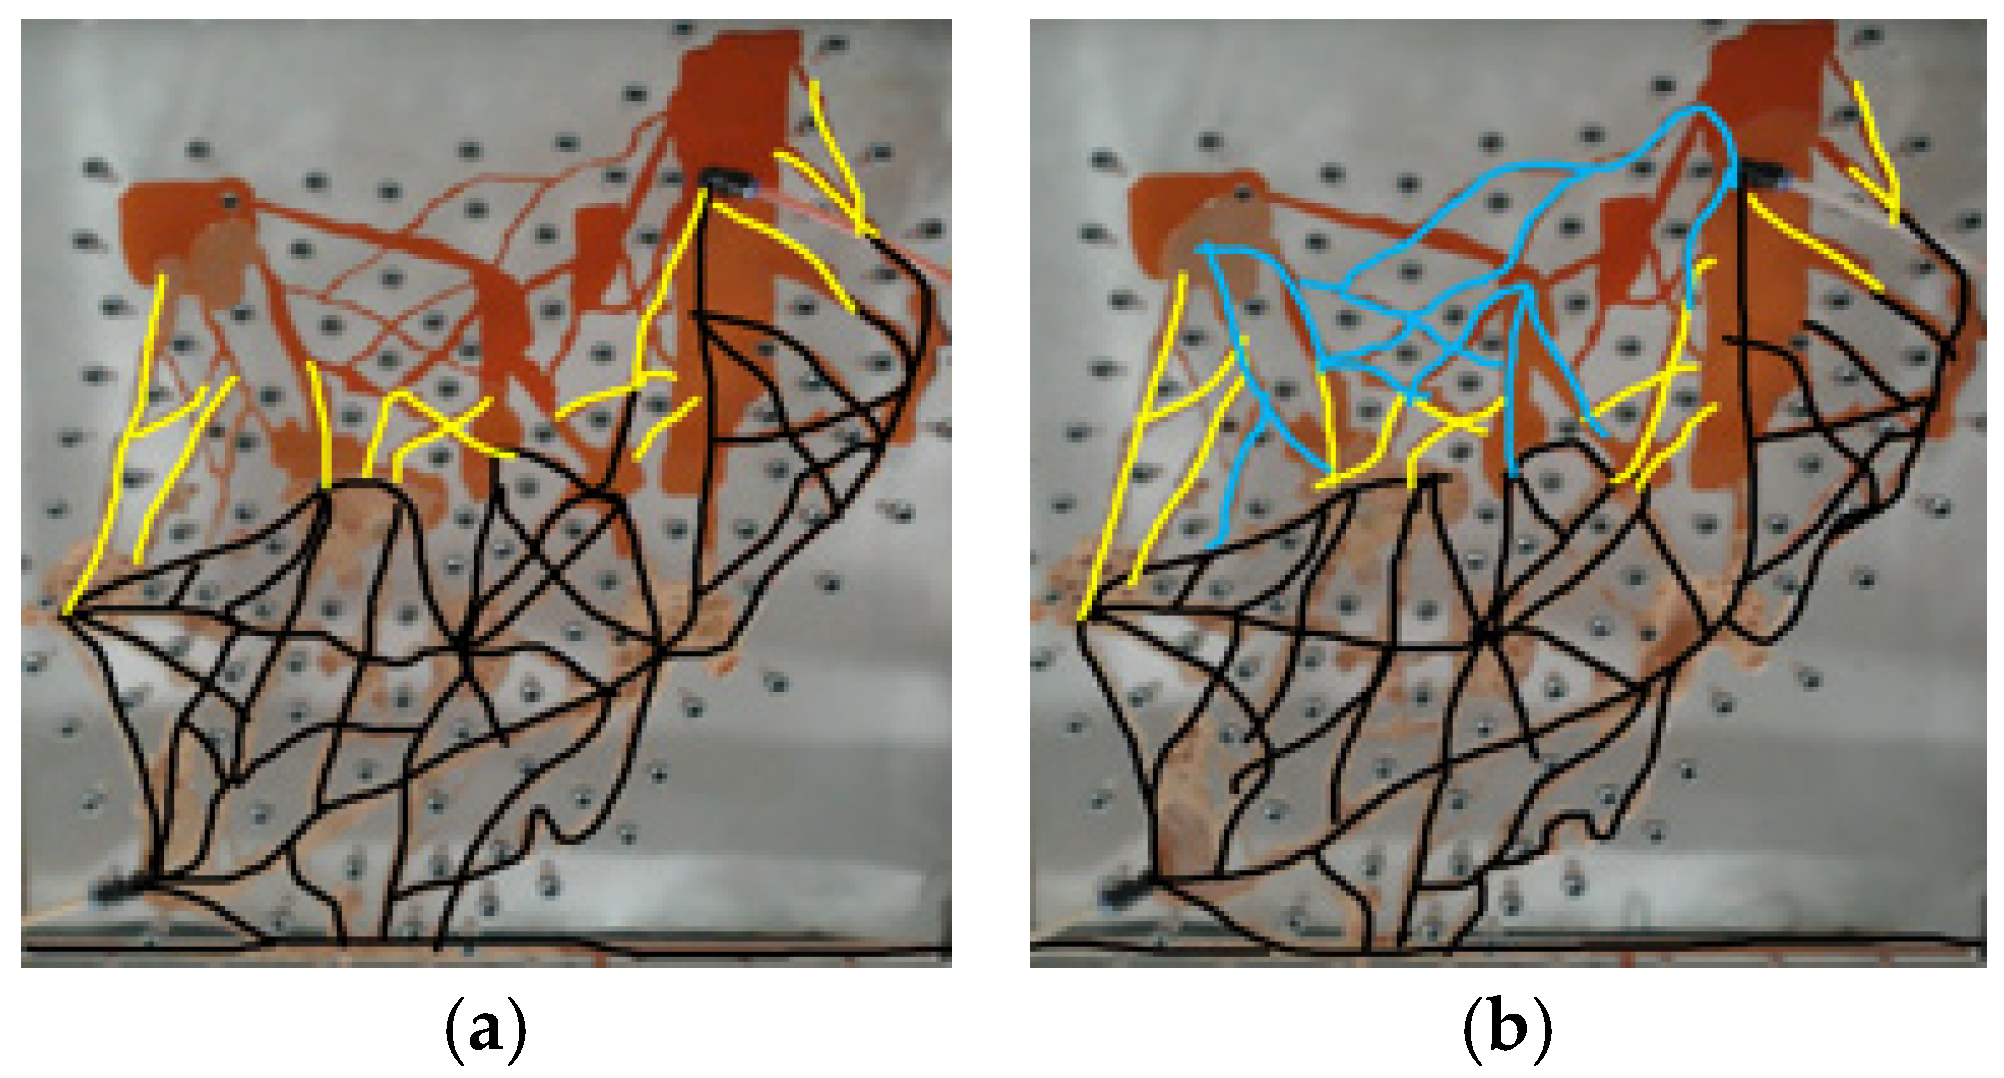
The experimental results show that after gas flooding reaches the maximum recovery rate, the injection of dispersed foam-assisted gas flooding can increase the recovery rate by 13.84%. The injection of gel foam-assisted gas drive can increase the recovery rate by 29.67%. The injection of salt-sensitive foam-assisted gas drive can increase the recovery rate by 32.79%. It can be seen that salt-sensitive foam has the best auxiliary benefits in auxiliary gas flooding, mainly because the flow channel plugging ability of salt-sensitive foam is stronger than that of dispersion foam and gelled foam. After injection, the effect of deep gas migration and steering is increased, and the sweep coefficient of gas is increased.
(2) Foam injection volume optimization
For the salt-sensitive foam, the comparison of the oil repelling effect under different foam injection volumes was studied when the gas–liquid ratio was 2:1 and foam-assisted gas drive was injected at the late gas flurry stage, and the experimental results are shown in
Table 6 and
Figure 14.
It was found that when 0.2 pv foam was injected, the recovery enhancement per 0.1 pv foam-assisted gas drive was 6.34%; when 0.3 pv foam was injected, the recovery enhancement per 0.1 pv foam-assisted gas drive was 8.3%; and when 0.4 pv foam was injected, the recovery enhancement per 0.1 pv foam-assisted gas drive was 8.19%. When the foam injection amount was increased from 0.2 pv to 0.3 pv, the recovery rate was improved by 12.2%, and when the injection amount was increased from 0.3 pv to 0.4 pv, the recovery rate was improved by 3.65%; the recovery rate improvement was reduced.
From the mean value as well as the extreme deviation analysis, it can be seen that there exists an economically optimal foam injection volume between 0.3 pv and 0.4 pv. The optimized result of injection volume was 0.3 pv.
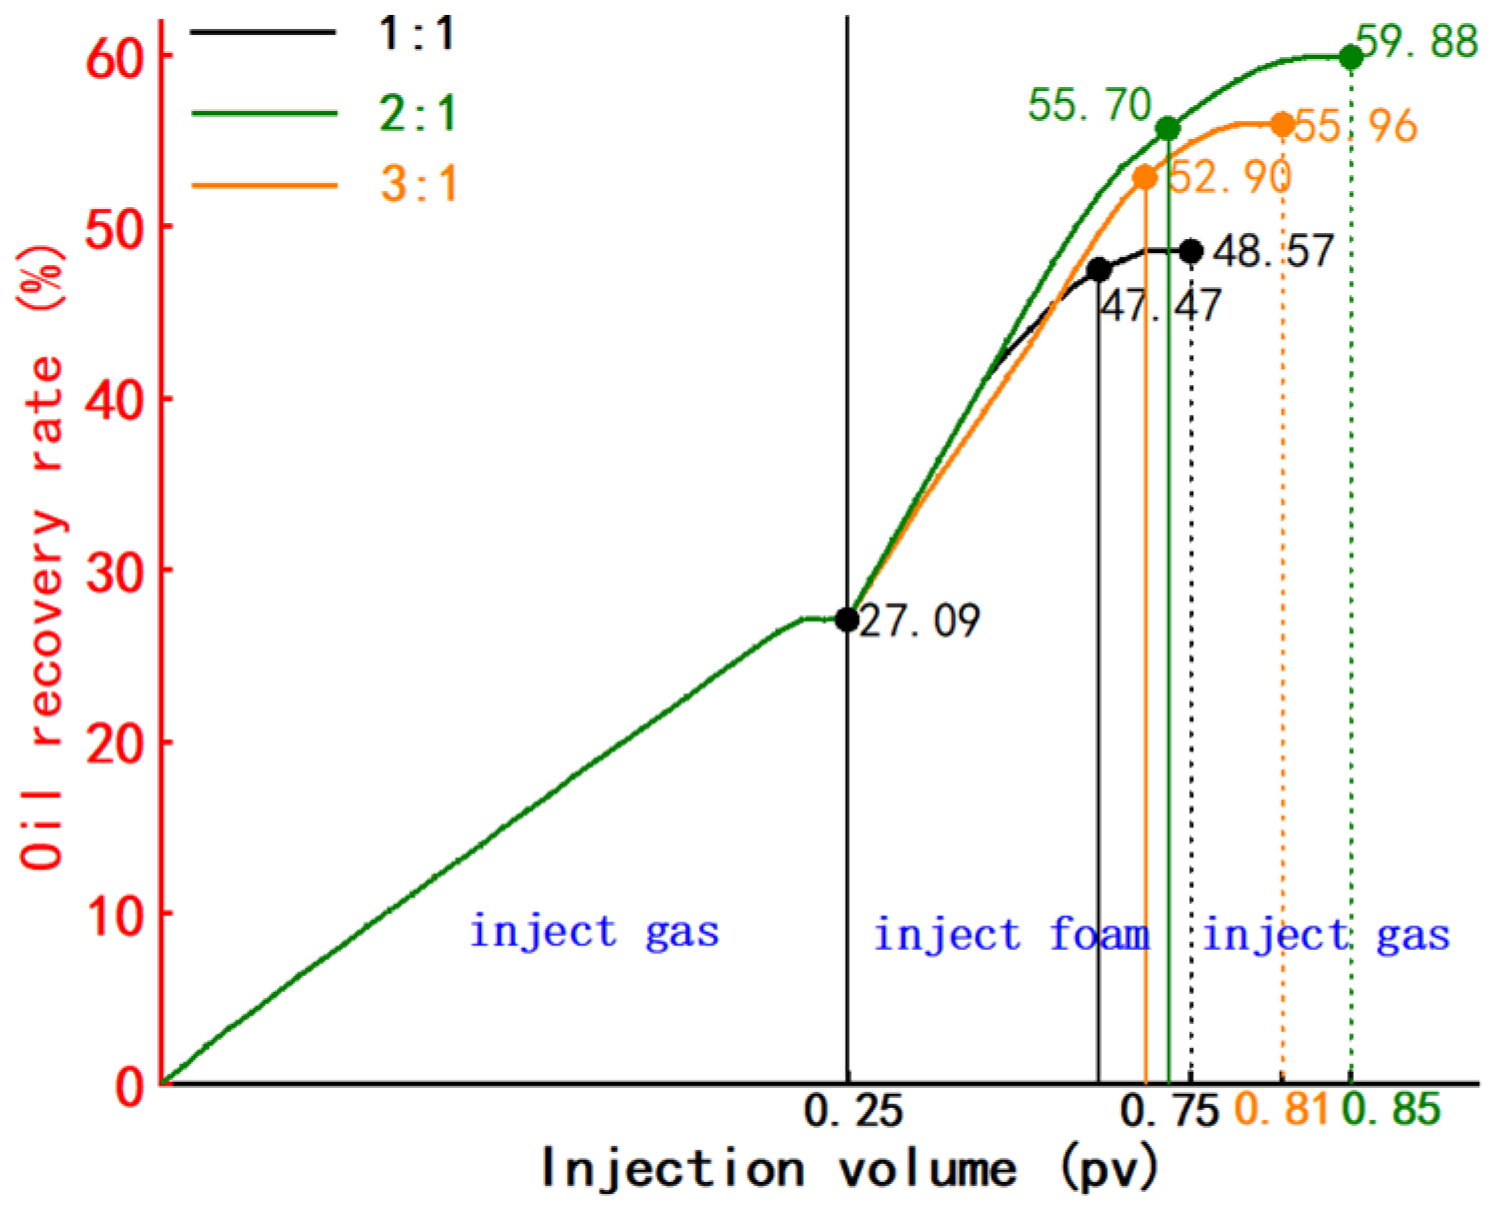
(3) Foam gas–liquid ratio optimization
For the salt-sensitive foam, the comparison of oil repelling effect under different gas–liquid ratios was investigated when the injection volume was 0.4 pv and the foam-assisted gas drive was injected at the late stage of the gas flurry, and the experimental results are shown in
Table 7 and
Figure 15.
When the foam injection gas–liquid ratio was 1:1, the recovery enhancement was 5.09% per 0.1 pv foam; when the foam injection gas–liquid ratio was 2:1, the recovery enhancement was 7.15% per 0.1 pv foam; when the foam injection gas–liquid ratio was 3:1, the recovery enhancement was 6.45% per 0.1 pv foam. When the foam gas–liquid ratio was increased from 1:1 to 2:1, the recovery rate was increased by 11.31%, and when the gas–liquid ratio was increased to 3:1, the recovery rate was decreased.
From the mean value as well as the extreme deviation analysis, it can be seen that the foam gas–liquid ratio of 2:1 is the best gas–liquid ratio.
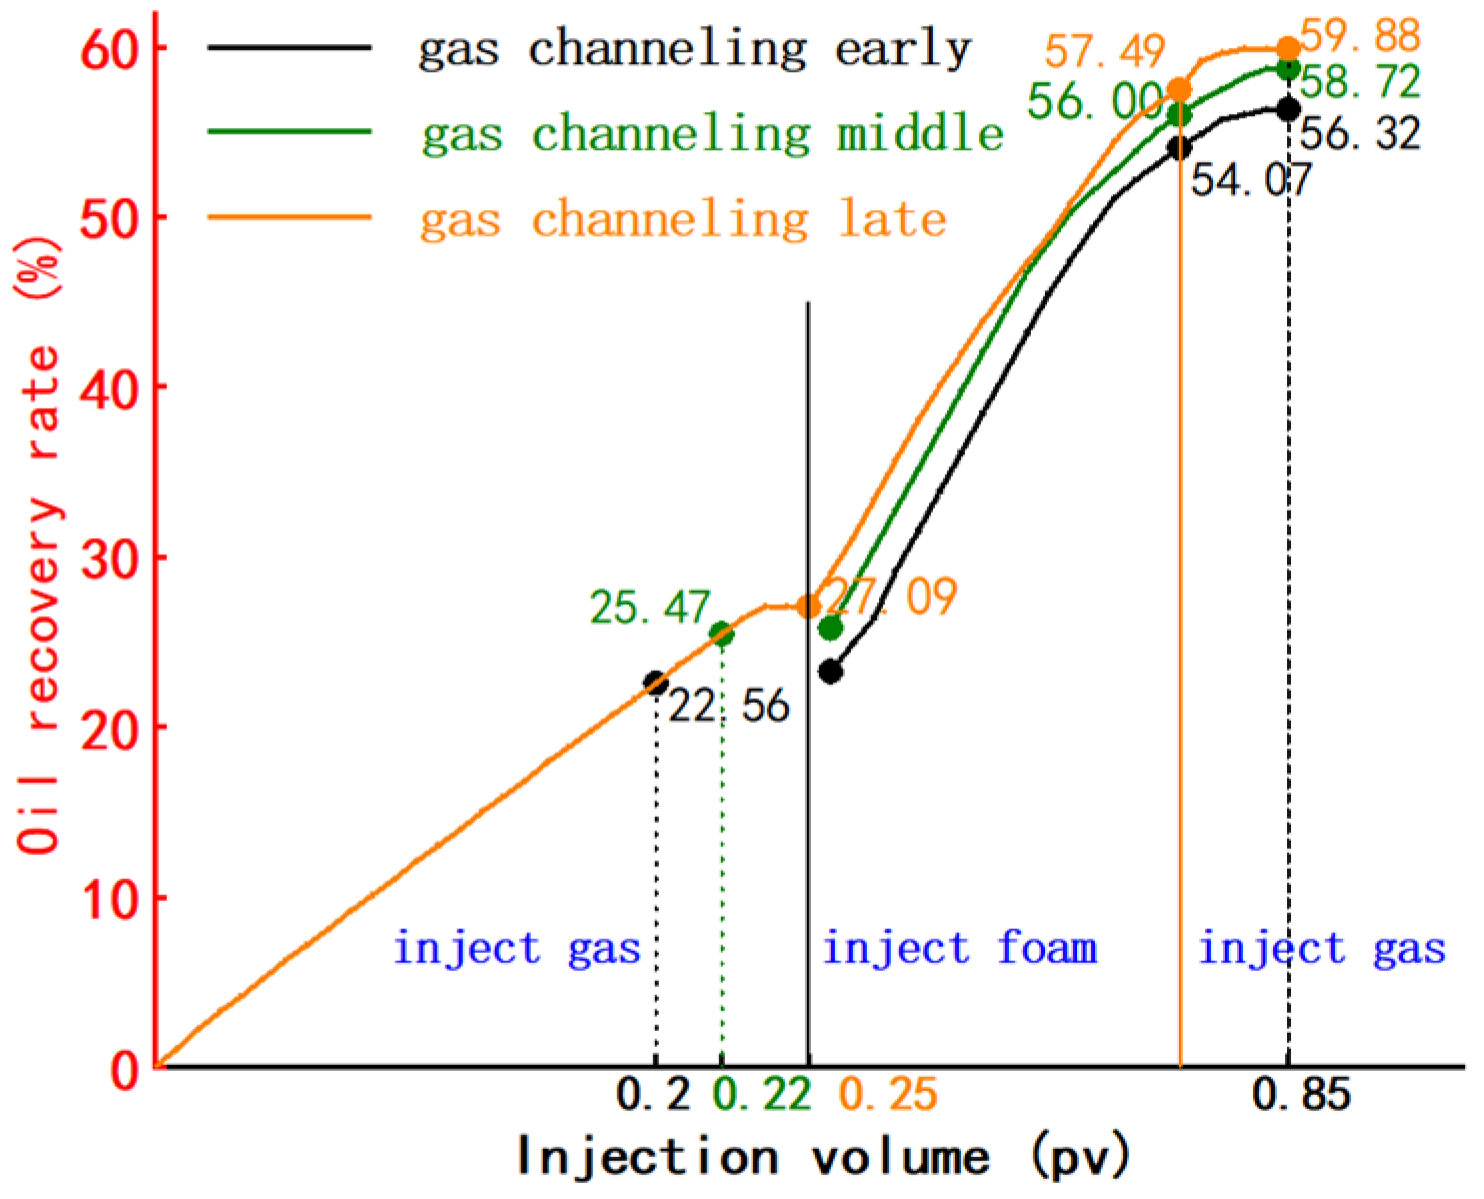
(4) Foam injection timing optimization
Foam-assisted gas drive was carried out by injecting 0.4 pv salt-sensitive foam with a gas–liquid ratio of 2:1 at the early, middle, and late stages of gas flushing to compare the oil repelling performance of salt-sensitive foam at different injection times. The experimental results are shown in
Table 8 and
Figure 16.
When the foam injection timing was adjusted from the early stage of gas flushing to the middle stage of gas flushing, the recovery rate was increased by 2.4%, and when it was adjusted to the late stage of gas flushing, the recovery rate was increased by 1.16%. The recovery rate of foam-assisted gas drive injected at the beginning of gas scram is 2.25% in the secondary gas injection and oil drive stage, the recovery rate of foam-assisted gas drive injected at the middle of gas scram is 2.72% in the secondary gas injection and oil drive stage, and the recovery rate of foam-assisted gas drive injected at the late stage of gas scram is 2.39% in the secondary gas injection and oil drive stage.
Comprehensively analyzing the extreme difference and the recovery rate in the second gas injection and oil driving stage, the gas scrambling middle injection foam-assisted gas drive has the best economic benefit.


