Article

Experimental Tests on In Situ Combustion Using Dynamic Ignition Simulation System in High-Temperature and High-Pressure Conditions

1
Research Institute of Engineering Technology, Tuha Oilfield Branch Company, PetroChina, Beijing 838200, China
2
School of Earth Resources, China University of Geosciences, Wuhan 430074, China
*
Authors to whom correspondence should be addressed.
Processes 2024, 12(1), 52; https://doi.org/10.3390/pr12010052
Submission received: 13 November 2023 / Revised: 11 December 2023 / Accepted: 18 December 2023 / Published: 25 December 2023
(This article belongs to the Special Issue Oil and Gas Well Engineering Measurement and Control)

Abstract

:
The study of crude oil oxidation characteristics is fundamental to the design of ignition in situ combustion. Experimentation is the most crucial method for studying the oxidation characteristics of crude oil. Aiming to address the challenges posed by high temperature, high pressure, and rapid temperature changes during the combustion of crude oil, a dynamic simulation system for high-temperature and high-pressure ignition is designed. In order to study the oxidation characteristics of the crude oil ignition process, we conducted experiments using a high-temperature and high-pressure dynamic ignition simulation device. The experiments focused on determining the ignition point of crude oil under different pressure conditions, oil–water ratios, heating rates, gas injection rates, and other relevant characteristics. The kinetic model for the oxidation process of crude oil ignition was established. The kinetic parameters were calculated for different ignition conditions and the apparent activation energy for each oxidation stage was determined. Additionally, the stability of in situ combustion was evaluated under various ignition parameters. The results show that the Arrhenius curves for crude oil exhibit noticeable differences in the HTO (high-temperature oxidation) and LTO (low-temperature oxidation) regions. The curves demonstrate good linearity in the HTO region, with correlation coefficients exceeding 0.9. Moreover, the apparent activation energies in the HTO region range from 8.01 to 26.7 kJ/mol. The apparent activation energies and finger front factors were calculated for the HTO stage under different pressure conditions. The results showed that, as the pressure increased, the autoignition point, inflection point temperature, and apparent activation energy of the crude oil decreased. This suggests that increasing the pressure can enhance the HTO of the crude oil. The spontaneous ignition point of the crude oil exhibited an upward trend as the heating rate increased. Additionally, the maximum temperature during the combustion process generally increased with the heating rate, reaching a maximum temperature of 453.1 °C. The tests demonstrated that the simulation system is capable of real-time monitoring and recording of oxidation parameters during the combustion process of crude oil. This system can provide essential data for project implementation and numerical simulation.

1. Introduction

In situ combustion is an oil extraction technology that can effectively enhance the recovery rate of oil reservoirs [1,2]. Heavy oil has poor fluidity in formation and is difficult to extract, so thermal extraction methods such as steam huff and puff, and steam flooding are commonly employed. After many rounds of steam injection, the water content in the heavy oil reservoir increases, leading to a decrease in production. In situ combustion, as a replacement development method to improve recovery after steam huff and puff, has the advantages of a high recovery rate and low heat loss. It is worth noting that, for low-permeability light oil reservoirs, in situ combustion can heat the reservoir skeleton and fluids through heat conduction and heat convection. This process prompts the fluids in the pores to expand and discharge on their own, thereby achieving enhanced recovery. The initiation of combustion is the most critical step in the in situ combustion process. The time it takes to ignite and establish a combustion front in the formation can vary, ranging from a few days to several weeks. This duration depends on the chemical composition and physical properties of the crude oil. Crude oils vary in terms of their chemical composition and physical properties, and, as a result, their oxidizing characteristics also differ. In situ combustion is different from conventional combustion. It is the process of replacing crude oil with combustion in a high-pressure porous medium. This process is extremely complex, involving both chemical and physical factors [3,4,5]. To study the combustion characteristics of in situ combustion, it is necessary to obtain the dynamics of the temperature field and other essential data. However, the process of in situ combustion takes place underground, making it impossible for researchers to obtain such dynamic information directly. Therefore, the aforementioned information must be obtained through indoor experiments.
In-house experiments are essential for studying in situ combustion, and allow for important qualitative and quantitative conclusions to be drawn. Thermal analysis experimental methods are commonly used in the laboratory. Thermal analysis experimental methods, such as TGA (Thermogravimetric Analysis) and DSC (Differential Scanning Calorimetry), are commonly employed in laboratory settings to investigate the oxidation mechanism of crude oil. In addition, in situ combustion indoor simulation experiments are also utilized for this purpose. In terms of studying crude oil oxidation using thermal analysis methods, Kok et al. utilized TGA to examine the oxidation characteristics of various fractions of crude oil at different heating rates [6]. They also analyzed the kinetic parameters using the iso-conversional method. Li et al. conducted TGA/DSC experiments to investigate the oxidation behaviors of three types of crude oils, and observed variations in oxidation behaviors between heavy oils and dilute oils [7]. Additionally, Zhao et al. explored the oxidation behavior of crude oil through oxidizing tube experiments [8]. The oxidation behavior of crude oil during the LTO (low-temperature oxidation) stage was studied, and the results indicated that various factors, including pressure, oxidation time, water saturation, and clay type, significantly influence the oxidation process of crude oil. Hu et al. conducted research on the oxidation characteristics of light oil, rock chips, and oil-bearing rock chips using TG/DTG and DTA techniques. They also analyzed the catalytic role of clay minerals in the oxidation of crude oil. Gundogar et al. conducted TGA/DSC experiments to analyze the oxidation behavior of six crude oils [9]. They also examined the oxidation characteristics of different crude oils in the LTO and HTO regions and calculated their kinetic parameters. Shokrlu et al. studied the impact of nickel ions on the combustion of crude oils using TGA and infrared spectroscopy [10]. The results indicated that nickel ions had a significant catalytic effect on the LTO of crude oils. It was found that the presence of nickel ions reduced the reaction activation energy from 16.9 kJ/mol to 10.9 kJ/mol. Ni et al. analyzed the kinetic properties of light oil oxidation in the presence or absence of rock chips using TGA [11]. The findings revealed that the clay medium exhibited a catalytic effect on the oxidation of heavy oil, resulting in a reduction in the apparent activation energy of the crude oil. Khelkhal et al. investigated the influence of an iron catalyst on the oxidation of heavy oil, using TGA, DSC, and SEM (scanning electron microscope) [12]. The results showed that the catalyst promoted both LTO and HTO (high-temperature oxidation). Yang et al. investigated the oxidation behavior of crude oil containing Ottawa sand, iron oxide, and pyrite using accelerated rate calorimetry (ARC). Temperature profiles and detailed kinetic data from the ARC tests were compared to analyze the oxidation characteristics of crude oil containing various mineral particles in the ARC vessel. The objective was to investigate the catalytic effect of iron minerals on the oxidation of crude oil. Thermal analysis experiments, which monitor changes in a single physical quantity to reflect crude oil oxidation, are easy to perform. However, they cannot be generalized to represent the overall oxidation behavior of crude oil. Additionally, it is challenging to maintain consistency between the experimental process and the actual conditions of the formation [13,14,15].
Unlike thermal analysis experimental devices, RTO (ramped temperature oxidation kinetic cell), CT (combustion tube), PMTEC (porous medium thermo-effect cell), and other devices can simulate the oxidation behavior of crude oil in a porous medium under the action of dynamic airflow [16,17,18]. The RTO test can obtain some basic parameters in ISC. Zhao et al. used RTO to measure the oxidation kinetic characteristics of different boiling fractions of Karamay crude oil in a porous medium [19]. They then compared it with the whole crude oil and used the iso-conversional method to analyze the results of RTO for each boiling fraction, obtaining the activation energy characteristics of each boiling fraction. Pu et al. used CT to study the low-temperature oxidation (LTO) of heavy crude oil in a porous medium [20]. They also conducted a comprehensive assessment of the in situ combustion (ISC) performance of the heavy oil and the alteration of oil properties before and after ISC. CT scanning enables the acquisition of crucial parameters such as the temperature distribution at the combustion front, variations in off-gas components, and the recovery rate during the ISC process [21]. However, CT experiments are often large in scale. For instance, the CT developed by the University of Calgary has a combustion tube with a diameter of 0.1 m and a length of 1.825 m. Each group of repulsion experiments takes more than 24 h, making the operation process very complicated [22]. This complexity requires a significant amount of manpower and material resources. Yuan et al. developed PMTEC, which allows for the study of crude oil combustion behavior in a porous medium by directly monitoring the temperature signal, similarly to TGA. PMTEC has the advantages of saving time and materials [17,23]. However, it cannot simulate the high-pressure environment in the formation. The ISC process is accompanied by high temperature and high pressure, so the simulation device needs to have high-temperature and high-pressure resistance, as well as high sealing.

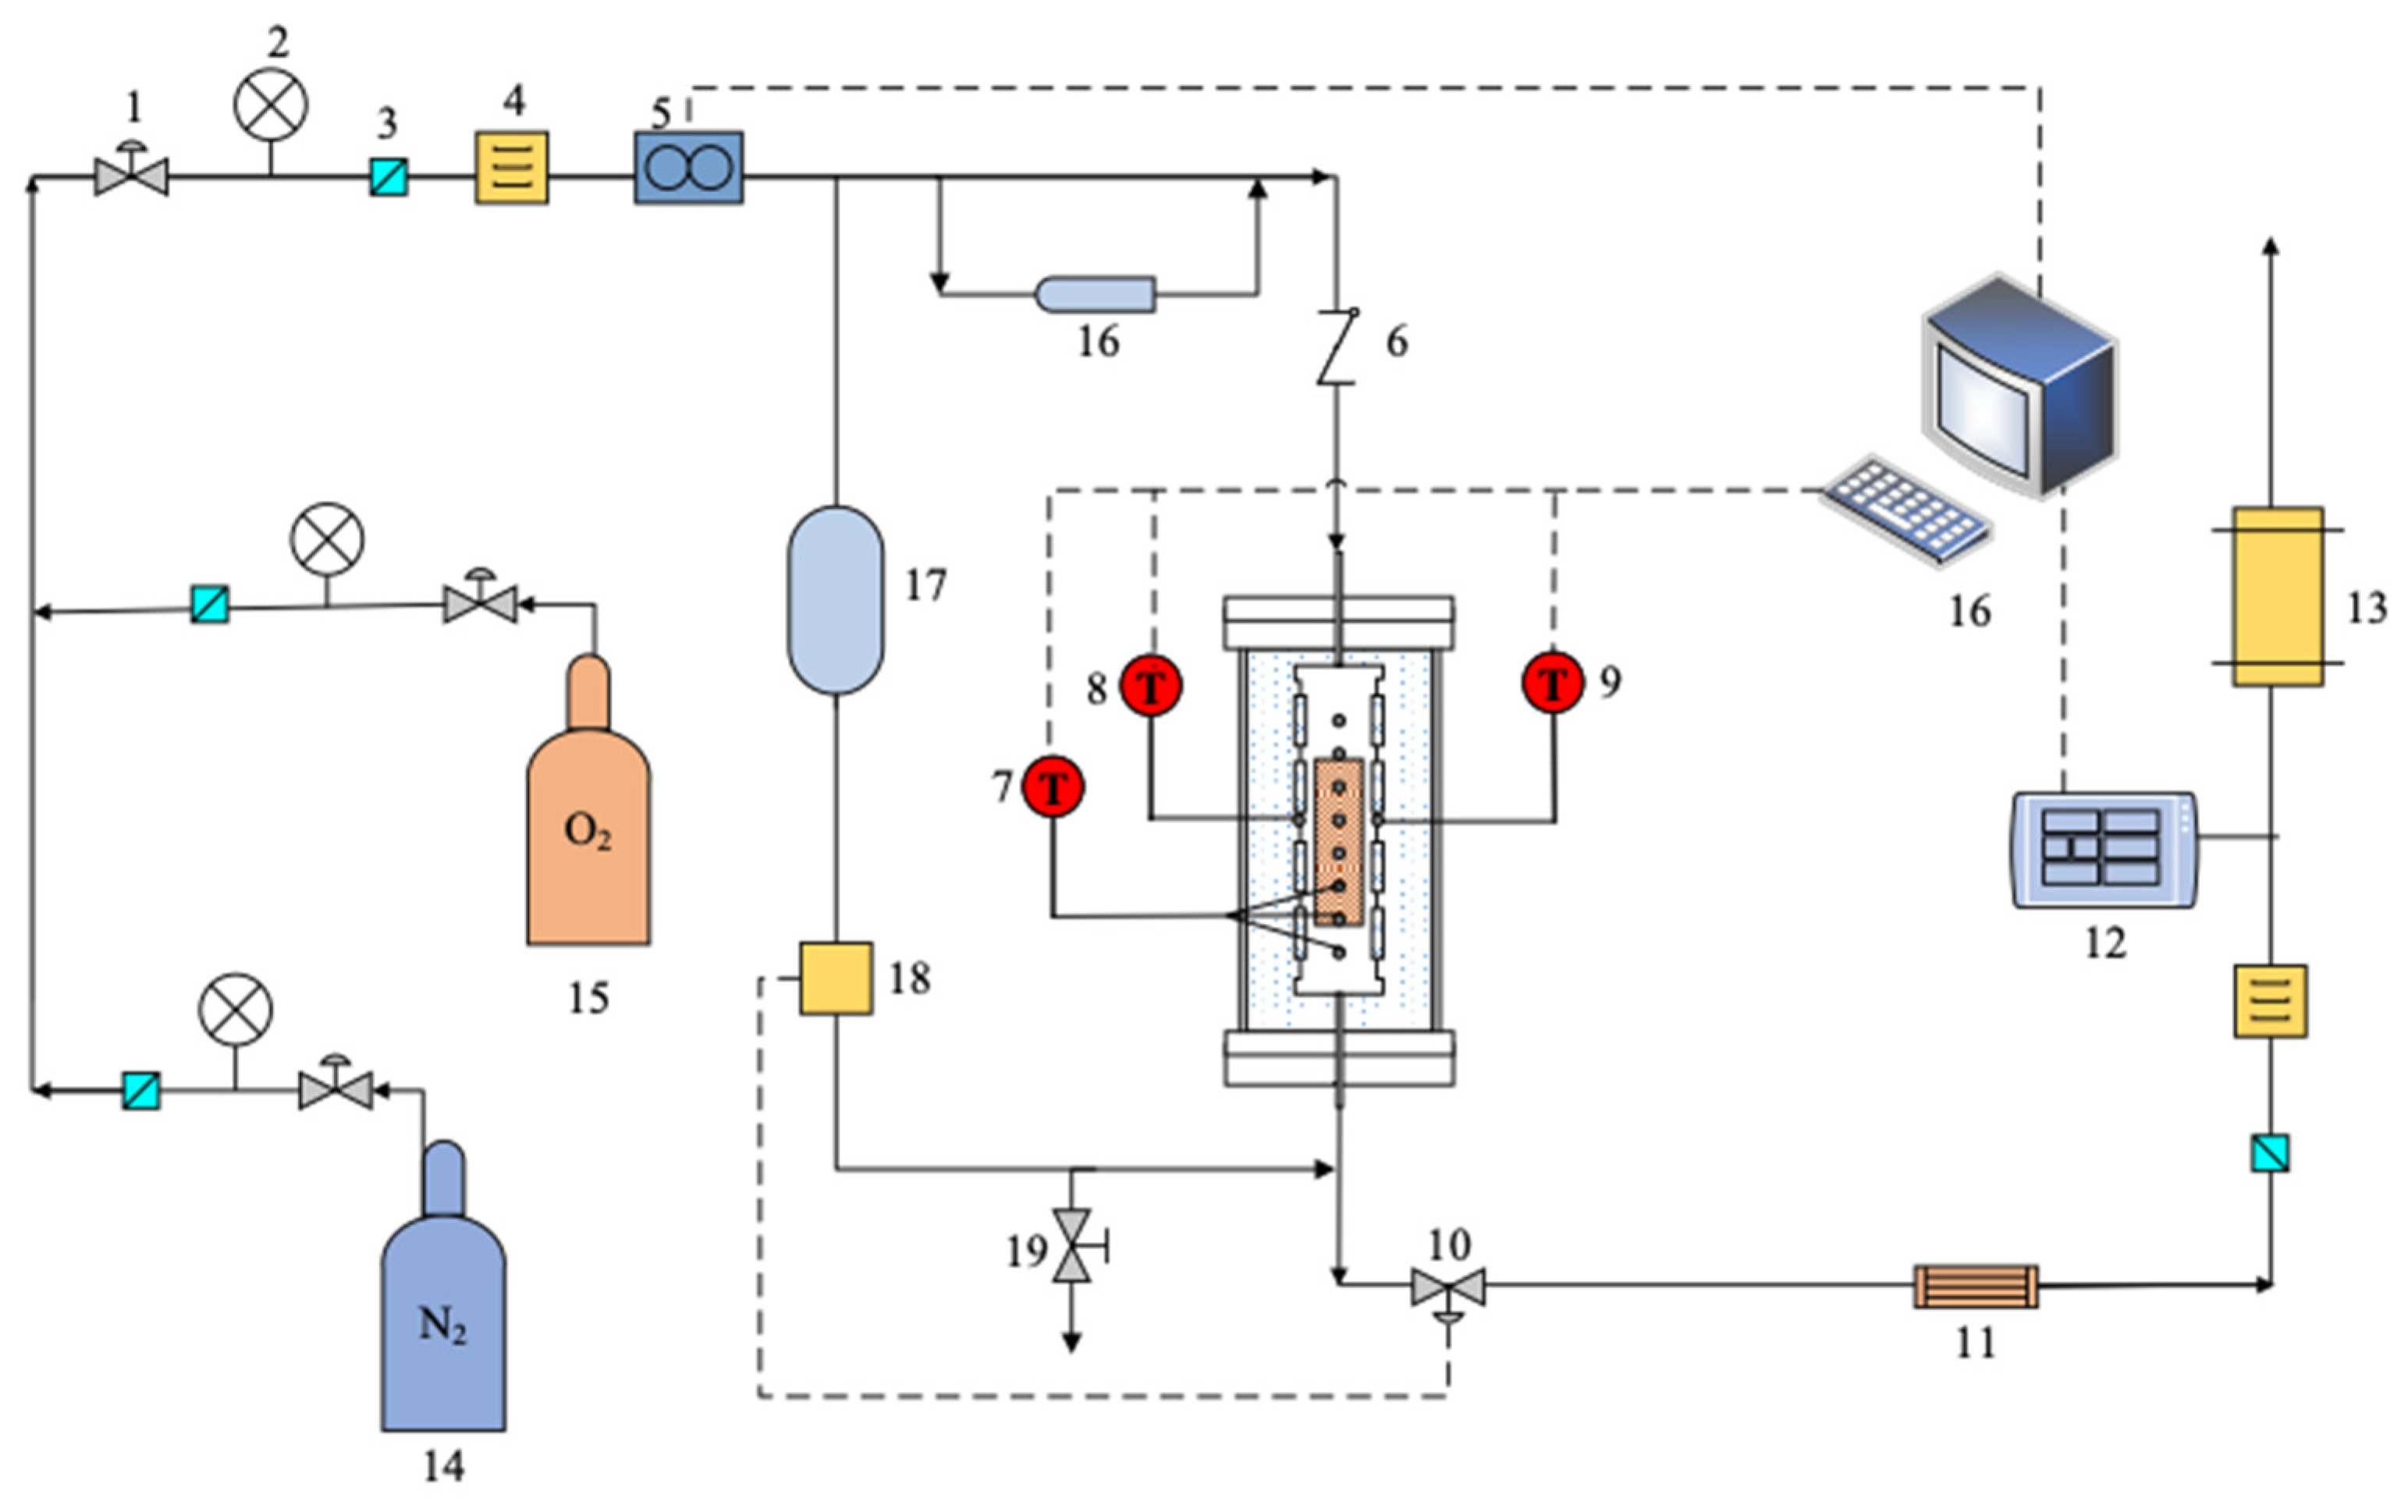
2. System Components and Design

The high-temperature and high-pressure dynamic ignition simulation system is used to simulate the ignition state of crude oil under formation conditions. It needs to fulfill the following functions: studying the impact of reservoir parameters (such as porosity, permeability, crude oil saturation, reservoir temperature, etc.) and injection parameters (such as gas injection rate, gas injection pressure, etc.) on the underground combustion of crude oil; examining the influence of additives (solid, liquid) on the ignition of crude oil; and collecting dynamic information during the process of crude oil combustion (such as temperature, pressure, component data, etc.) to analyze the kinetic parameters of crude oil oxidation and provide data for numerical simulation of ISC.
The simulation system can accurately control the heating-up program, collect temperature field pressure field data, and collect real-time exhaust gas component data. It consists of six systems, including ignition simulation system, safety protection system, discharge system, online exhaust gas monitoring system, exhaust gas treatment and discharge system, and data acquisition and control system. The principle of the high-temperature and high-pressure dynamic ignition simulation system is shown in Figure 1.

2.1. Ignition Simulation System

2.1.1. Combustion Tube Structure Design

The combustion tube is 37 cm long with an inner diameter of 2.5 cm and is characterized by a high length-to-diameter ratio (L/D). Due to the end effect, the temperature at the two ends is generally lower than that in the center. However, the axial temperature of the combustion tube with a large L/D ratio is more uniform. There are 11 temperature probes inside the core at 1.5 cm intervals, as illustrated in Figure 2. Thermocouples are also installed in the middle of the outer wall of the combustion tube to monitor its temperature. Additionally, thermocouples are placed on the opposite side of the outer wall of the combustion tube. These thermocouples are connected to the temperature control system, allowing for temperature regulation through the collection of temperature data. Both ends of the combustion tube are sealed with a double-layer high-temperature graphite ring sealing structure. The combustion tube is made of GH4169 alloy, which exhibits excellent high-temperature resistance and thermal fatigue resistance. There is a heat-insulating layer on the outside of the combustion tube and this layer is in close proximity to the outer wall of the combustion tube. The heating layer is connected to the control module through a specialized cable. The control module determines the output power of the heating layer in order to accurately regulate the heating of the core. The heating layer can reach a maximum temperature of 500 °C with a sampling resolution of 0.1 °C.

2.1.2. Temperature Control Design

The heating power is precisely controlled through the thermocouple feedback loop, which can maximize the simulation of the stratum heat storage process. The temperature control module includes the control module, processor module, and communication serial port module. As shown in Figure 3, the control module adopts the combination of fuzzy theory and PID control, taking the ignition simulation system as the controlled object, the J-type thermocouple located in the middle of the outer wall of the combustion pipe as the sensor, and the heating layer as the actuator. The temperature information collected by the thermocouple is fed back to the controller, which adjusts the PID parameters online after self-tuning by adding fuzzy control and outputs the optimal control parameters, thus adjusting the output power of the heating layer to keep the output temperature consistent with the target temperature, and the temperature control accuracy is ±0.1 °C.

2.1.3. Combustion Tube Sealing and Stability Design

The two ends of the combustion tube are sealed with double-layer graphite rings that are resistant to high temperatures. The structure of the sealing device is divided into five parts: mold sleeve, compression block, mandrel, wedge-shaped graphite ring, gasket, and nut. The die sleeve has two different diameters of internal threads to connect the combustion pipe body and the tightening block. The mandrel’s role is to compact the core. The lower part of the ring limit can make contact with the wedge-shaped graphite ring, while the upper part has external threads for connecting the nut. Additionally, the interior of the mandrel has a through hole that serves as a gas channel. The compacting block has an external thread that connects it to the mold sleeve through the connection. The mandrel, wedge-shaped graphite ring, ring gasket, and compression block can be sequentially assembled into a combination of parts. The mold sleeve is used to secure the assembled parts and, at this point, the core is compressed. However, due to the loose pressing of the wedge-shaped graphite ring, the sealing is not effective. To improve the sealing, it is necessary to tighten the nut, which will expand the wedge-shaped graphite ring and ensure close contact with the inner wall of the combustion tube for high-pressure sealing. According to the test results, the ignition simulation system can withstand pressures exceeding 10 MPa.

2.2. Online Exhaust Gas Monitoring System

An online exhaust gas monitoring system can monitor the exhaust gas in real time and has an alarm function. The online exhaust gas monitoring system includes the main instrument box, gas monitoring controller, and external serial port, among other components. The main instrument box is responsible for collecting data on exhaust gas components. The main instrument box is responsible for collecting data on exhaust gas components. It is equipped with built-in sensors for CH4, O2, H2S, CO, CO2, H2, and N2 gases. These sensors are connected in series through a hose. The parameters of the gas sensors are shown in Table 1. When the concentration of a specific gas exceeds or falls below the predetermined alarm threshold, it will activate either the high-level alarm or the low-level alarm, thereby ensuring the safety of the experimental procedure.

2.3. Injection and Discharge System

The function of the injection system is to simulate the gas circulation state under stratum conditions and it has four roles: first, supplying oxygen and gas to the system; second, controlling the flow; third, controlling back pressure; and fourth, injecting liquid. The flow control section consists of a gas mass flow meter and a flow controller. The gas mass flow meter is connected to the flow indicator using a specialized cable. The back-pressure control section consists of a back-pressure control valve, a back-pressure controller, and an intermediate container. The back-pressure controller collects pressure information and transmits it to a PC through a specialized cable. The PC then outputs control parameters based on the pressure information, and the back-pressure controller adjusts the opening and closing of the valve.
The tail gas generated in the in situ combustion ignition experiment contains water vapor, core particles, and oil, among other substances. In order to prevent pipeline clogging and damage to downstream equipment, it is necessary to treat the tail gas. The treatment process includes depressurization, filtration, dehydration, drying, and other steps.

3. Experimental Section

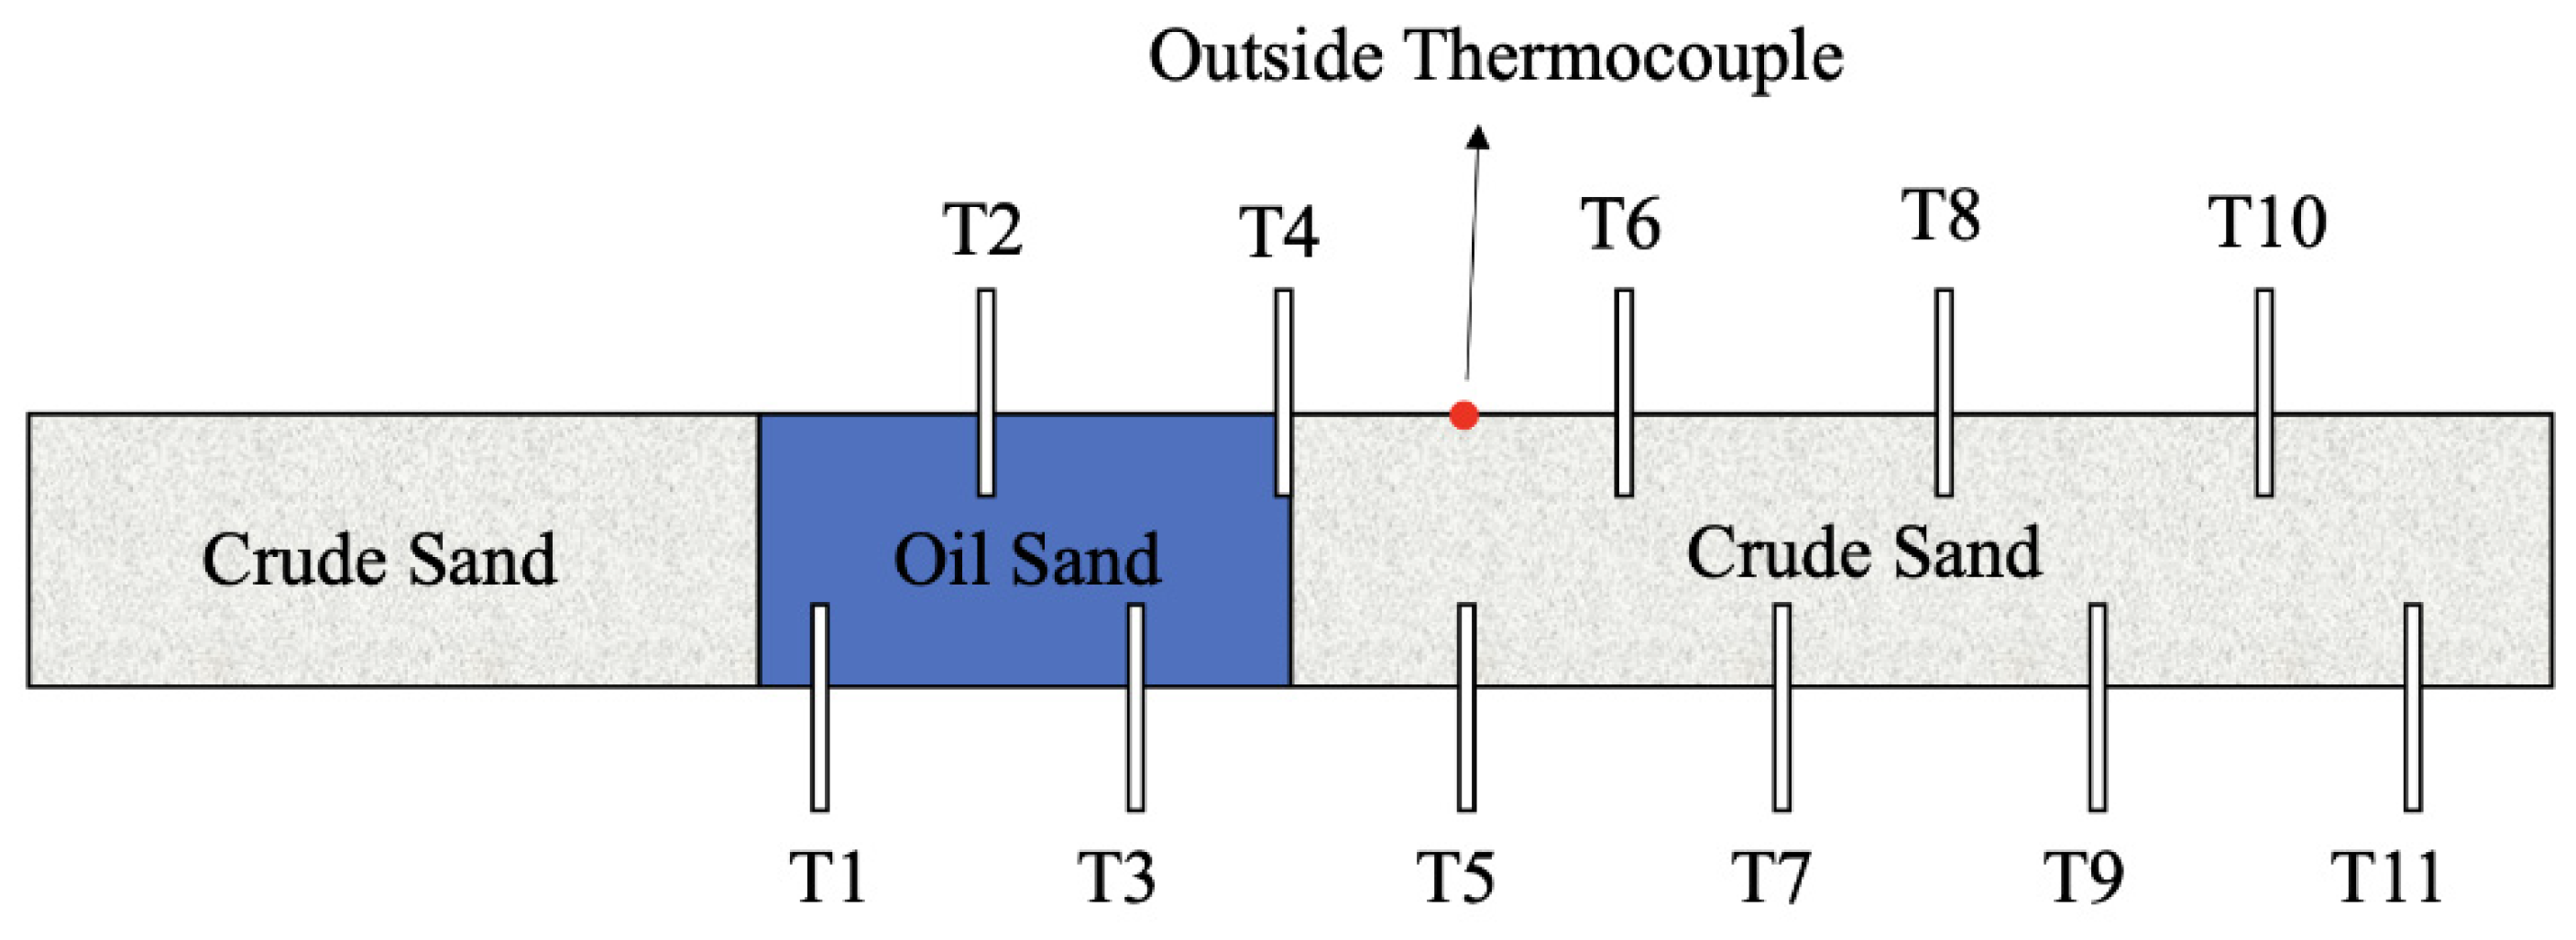
3.1. Materials Preparation

Experimental samples: Tuha oilfield light crude oil with viscosity of 0.74 mPa-s was used in the ignition experiment. The crude oil used for all the experiments was the same light crude oil and the properties of the crude oil are shown in Table 2.
Pre-experiment preparation: 400-mesh quartz sand was mixed with crude oil and brine in the specified ratio. The mixture was then filled into the middle section of the combustion tube, ensuring it was compacted. The two ends of the core were filled with 70-mesh quartz sand. Fine mesh screens were placed near the air inlet and outlet to prevent sand particles from entering the pipeline and causing blockages.

3.2. Experimental Procedure

  • Close the outlet valve and inject nitrogen to bring the back pressure to 4 MPa.
  • Once the pressure has stabilized, open the outlet valve and adjust the mass flow controller to maintain a flow rate of 300 mL/min. Keep the flow at this rate for 5 min.
  • If it is necessary to add liquid additives, place the additives in the liquid cylinder of the liquid injector. Inject nitrogen at a flow rate of 500 mL/min and continue injecting for 5 min. Then, decrease the flow rate to 300 mL/min and switch to air once stabilization is achieved. If there is no need to add liquid additives, switch to using air directly.
  • Once the flow rate has stabilized, begin heating and set the heating rate on the PC. Start recording the dynamic parameters of the combustion process.
  • When all temperature measurements at the measurement points remain stable for 30 min, close the cylinder valve to stop gas injection. Slowly adjust the pressure relief valve to ensure that the system pressure drops to atmospheric pressure.
  • Wait for the device to cool down and then disassemble the core, which is divided into sections at 3 cm intervals, weighed and sealed for later analysis and processing.

3.3. Experimental Test

In order to study the characteristics of crude oil oxidation and the factors that influence it during the in situ combustion process, ignition experiments were conducted to evaluate the factors that influence the spontaneous combustion of light crude oil under dynamic gas flow. The experimental parameters were designed as shown in Table 3.

3.3.1. Blank Heating Experiment

In the ignition simulation experiment, in order to simulate the actual formation conditions, the temperature of the combustion tube should be consistent with the reservoir temperature. Therefore, a blank experiment was designed to verify the thermal tracking compensation effect of the experimental device. The temperature difference between the core wall temperature and the warming rate is illustrated in Figure 4. As the warming rate increases, the temperature difference also increases. This is due to the airflow carrying away the heat from the core and the porous medium requiring time for heat transfer. Therefore, a temperature difference exists. At the heating rate of 0.5 °C/min, the temperature difference is only 6.3 °C.

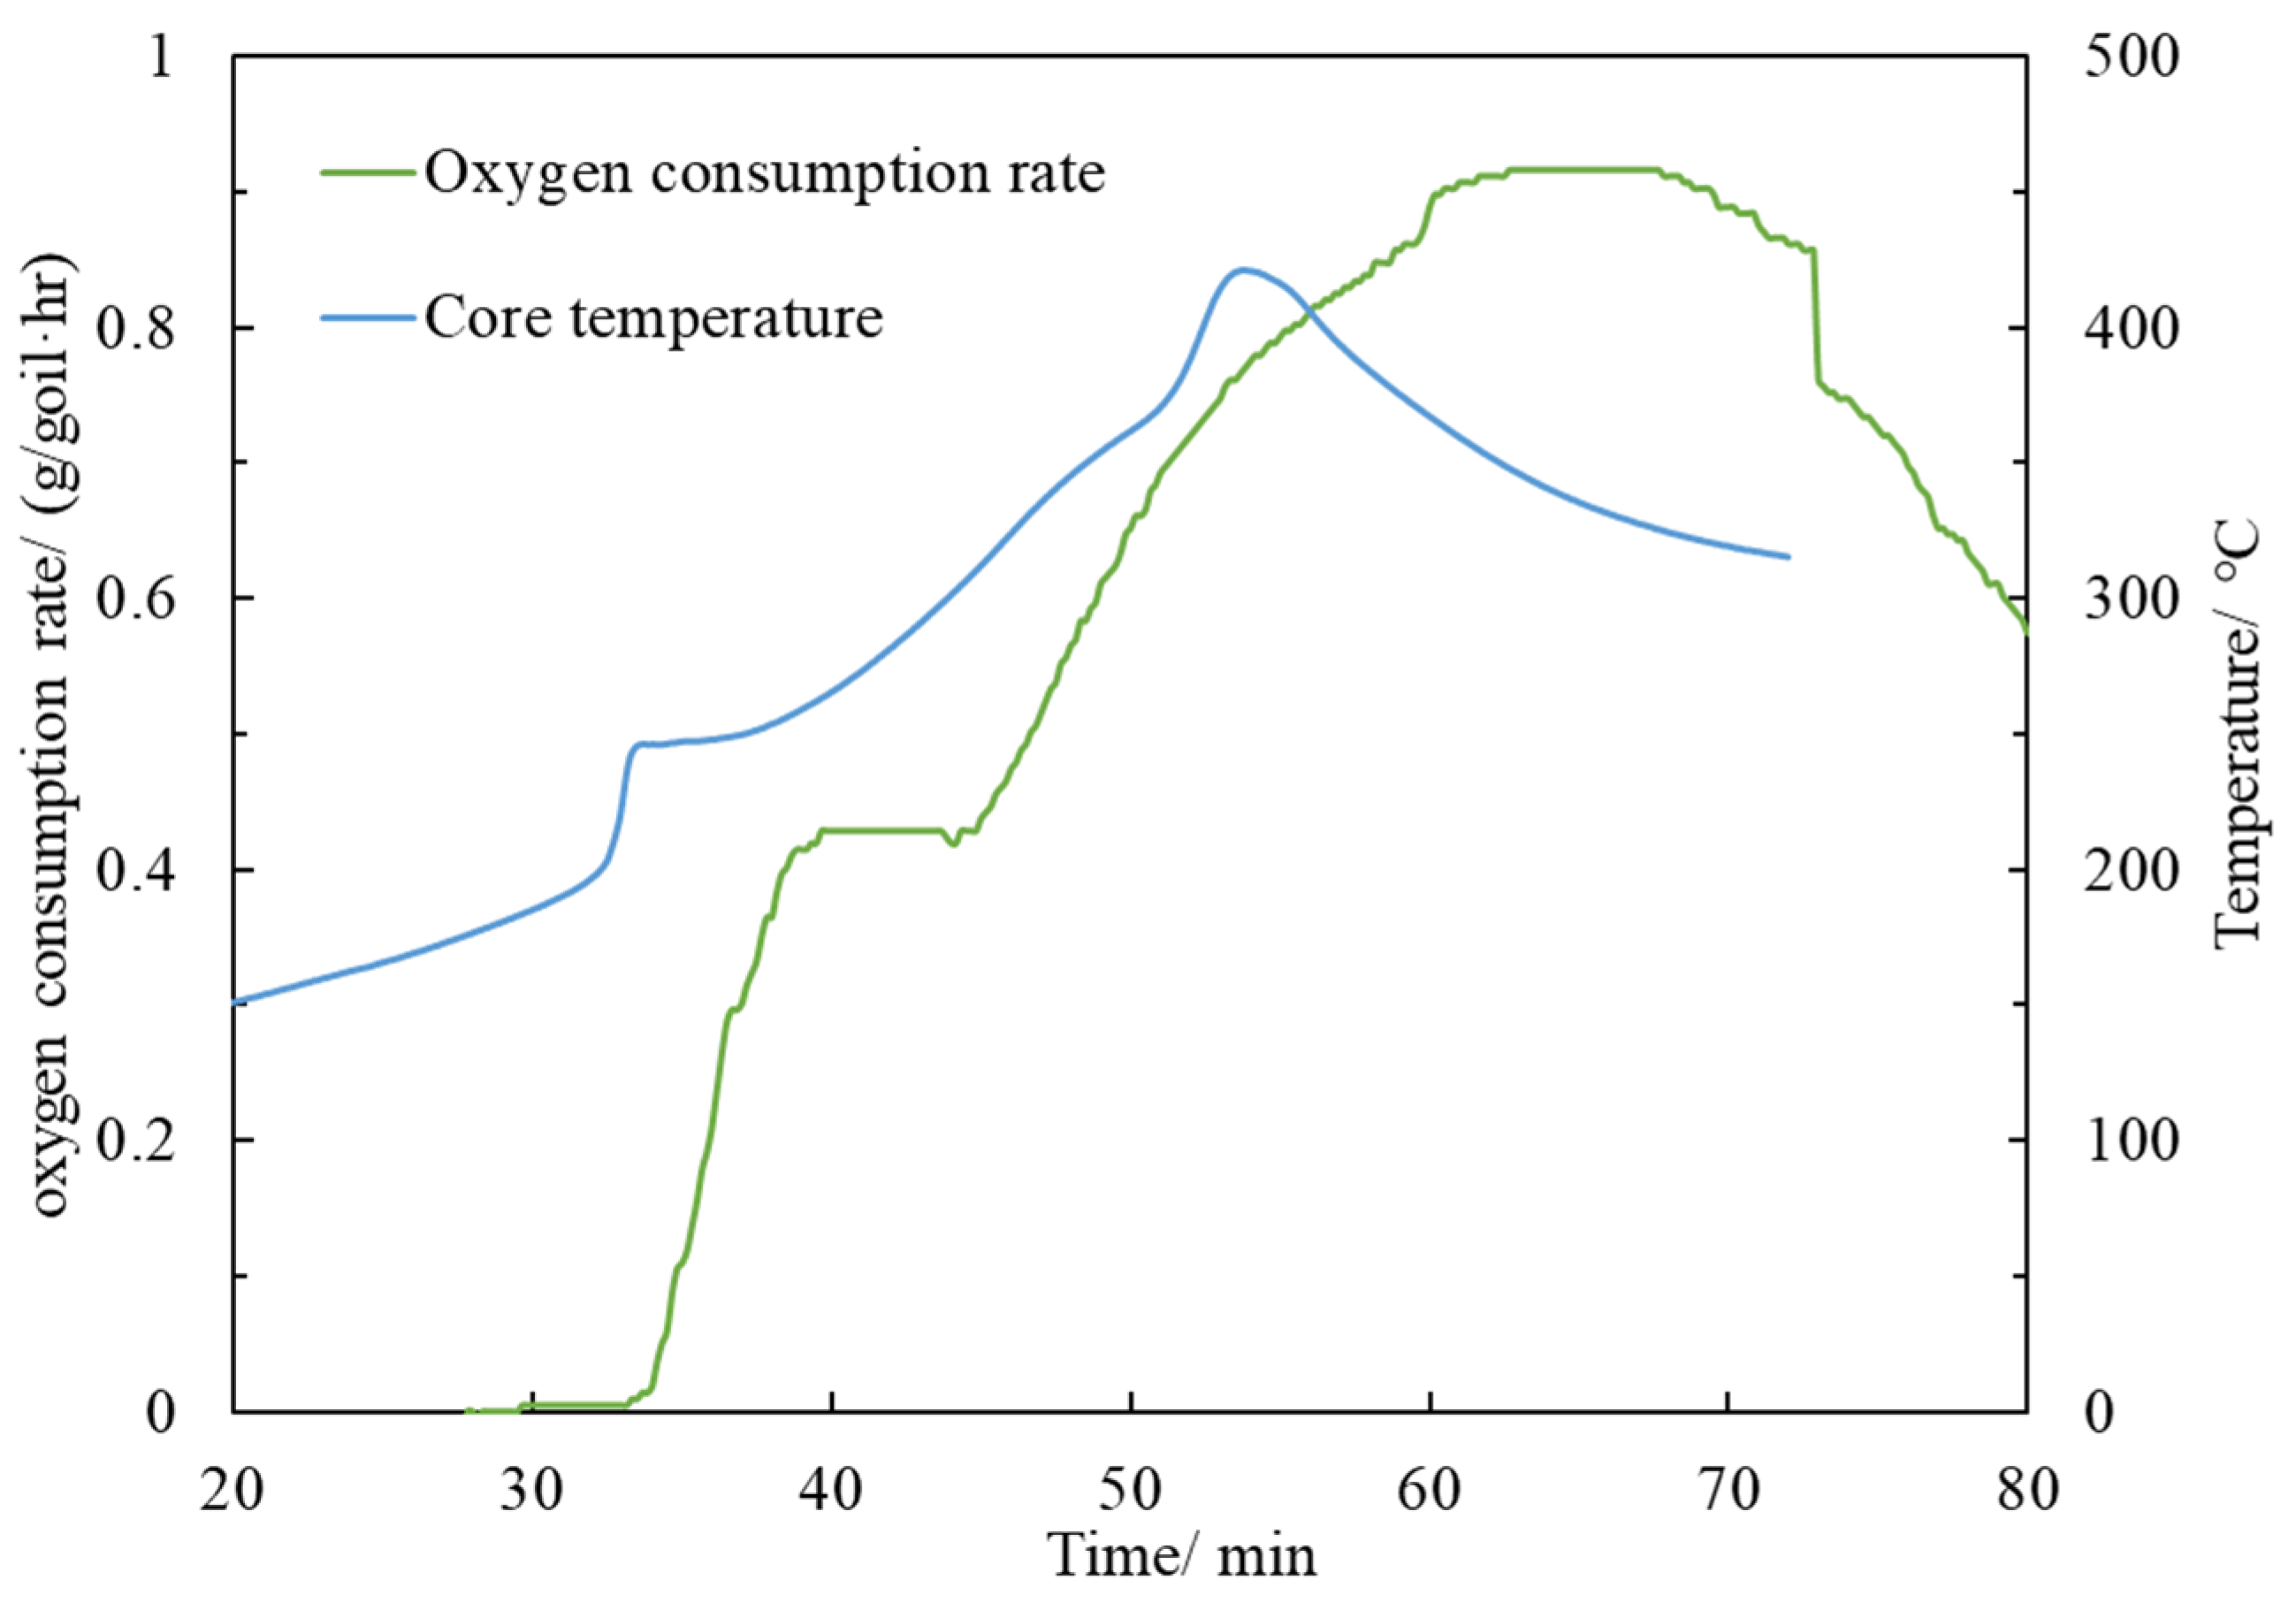
3.3.2. Ignition Test

The purpose of the ignition simulation experiment is to obtain various key parameters in the oxidation process of crude oil for subsequent numerical simulation and combustion analysis. The data from the ignition simulation experiment were organized to generate curves depicting the core temperature and oxygen consumption rate over time, as illustrated in Figure 5.
According to the theory of thermal spontaneous combustion, combustion occurs when the exothermic factors of a reaction interact with the heat dissipation factors of the system [24]. When the rate of exothermic reaction exceeds the rate of heat dissipation in the system, the reaction rate is further accelerated, indicating that the reactants have entered the combustion state. The definition of spontaneous combustion point is when the temperature at the measurement point exceeds and continues to exceed the temperature of the wall. With the continuous exothermic LTO, the heat storage of the reaction system prompts the crude oil to undergo spontaneous oxidation. At 102 min, the core temperature reaches 189.1 °C, causing the experimental oil samples to reach the ignition temperature. As a result, the crude oil oxygen consumption rate and temperature characteristics undergo significant changes. The O2 in the tail gas is completely consumed and a large amount of O2 is involved in the reaction. This leads to a rapid rise in temperature at the front end of the oil sands section and the movement of the thermal leading edge can be observed in the temperature curves [25].
The experimental results were processed to obtain the spontaneous ignition point and the maximum temperature under different heating rates, pressures, gas injection rates, and oil–water ratios, as shown in Figure 6, Figure 7, Figure 8 and Figure 9.
As shown in Figure 6, the auto-ignition point of crude oil exhibited an upward trend as the heating rate increased. Additionally, the maximum temperature during combustion generally increased with the heating rate, reaching a maximum temperature of 453.1 °C. This is because the slower rate of temperature rise prolongs the low-temperature oxidation stage of crude oil. Although some of the light crude oil undergoes phase change and volatilization, a larger portion of the crude oil undergoes oxidation. This increases the viscosity and fuel content of the oil, promoting the movement of the crude oil to LTO and subsequently lowering the auto-ignition point. As shown in Figure 7, the spontaneous ignition point of crude oil does not change significantly with an increase in pressure. However, the maximum temperature is slightly higher compared to the maximum temperature observed in the lower pressure experiment at 4 Mpa pressure. This is due to the fact that the oil sample is lighter, making it easier to volatilize. The increase in pressure inhibits the volatilization of the lighter components. At high pressure, the oil may undergo a violent oxidation reaction at the gas-phase or gas-phase and liquid-phase interface, resulting in an increased exothermic rate. As shown in Figure 8, the spontaneous ignition point of crude oil remains relatively unchanged with an increase in gas injection rate. However, the maximum temperature does increase as the gas injection rate increases. As shown in Figure 9, the spontaneous combustion point of crude oil decreases with an increase in oil saturation, while the maximum temperature exhibits an increasing trend.

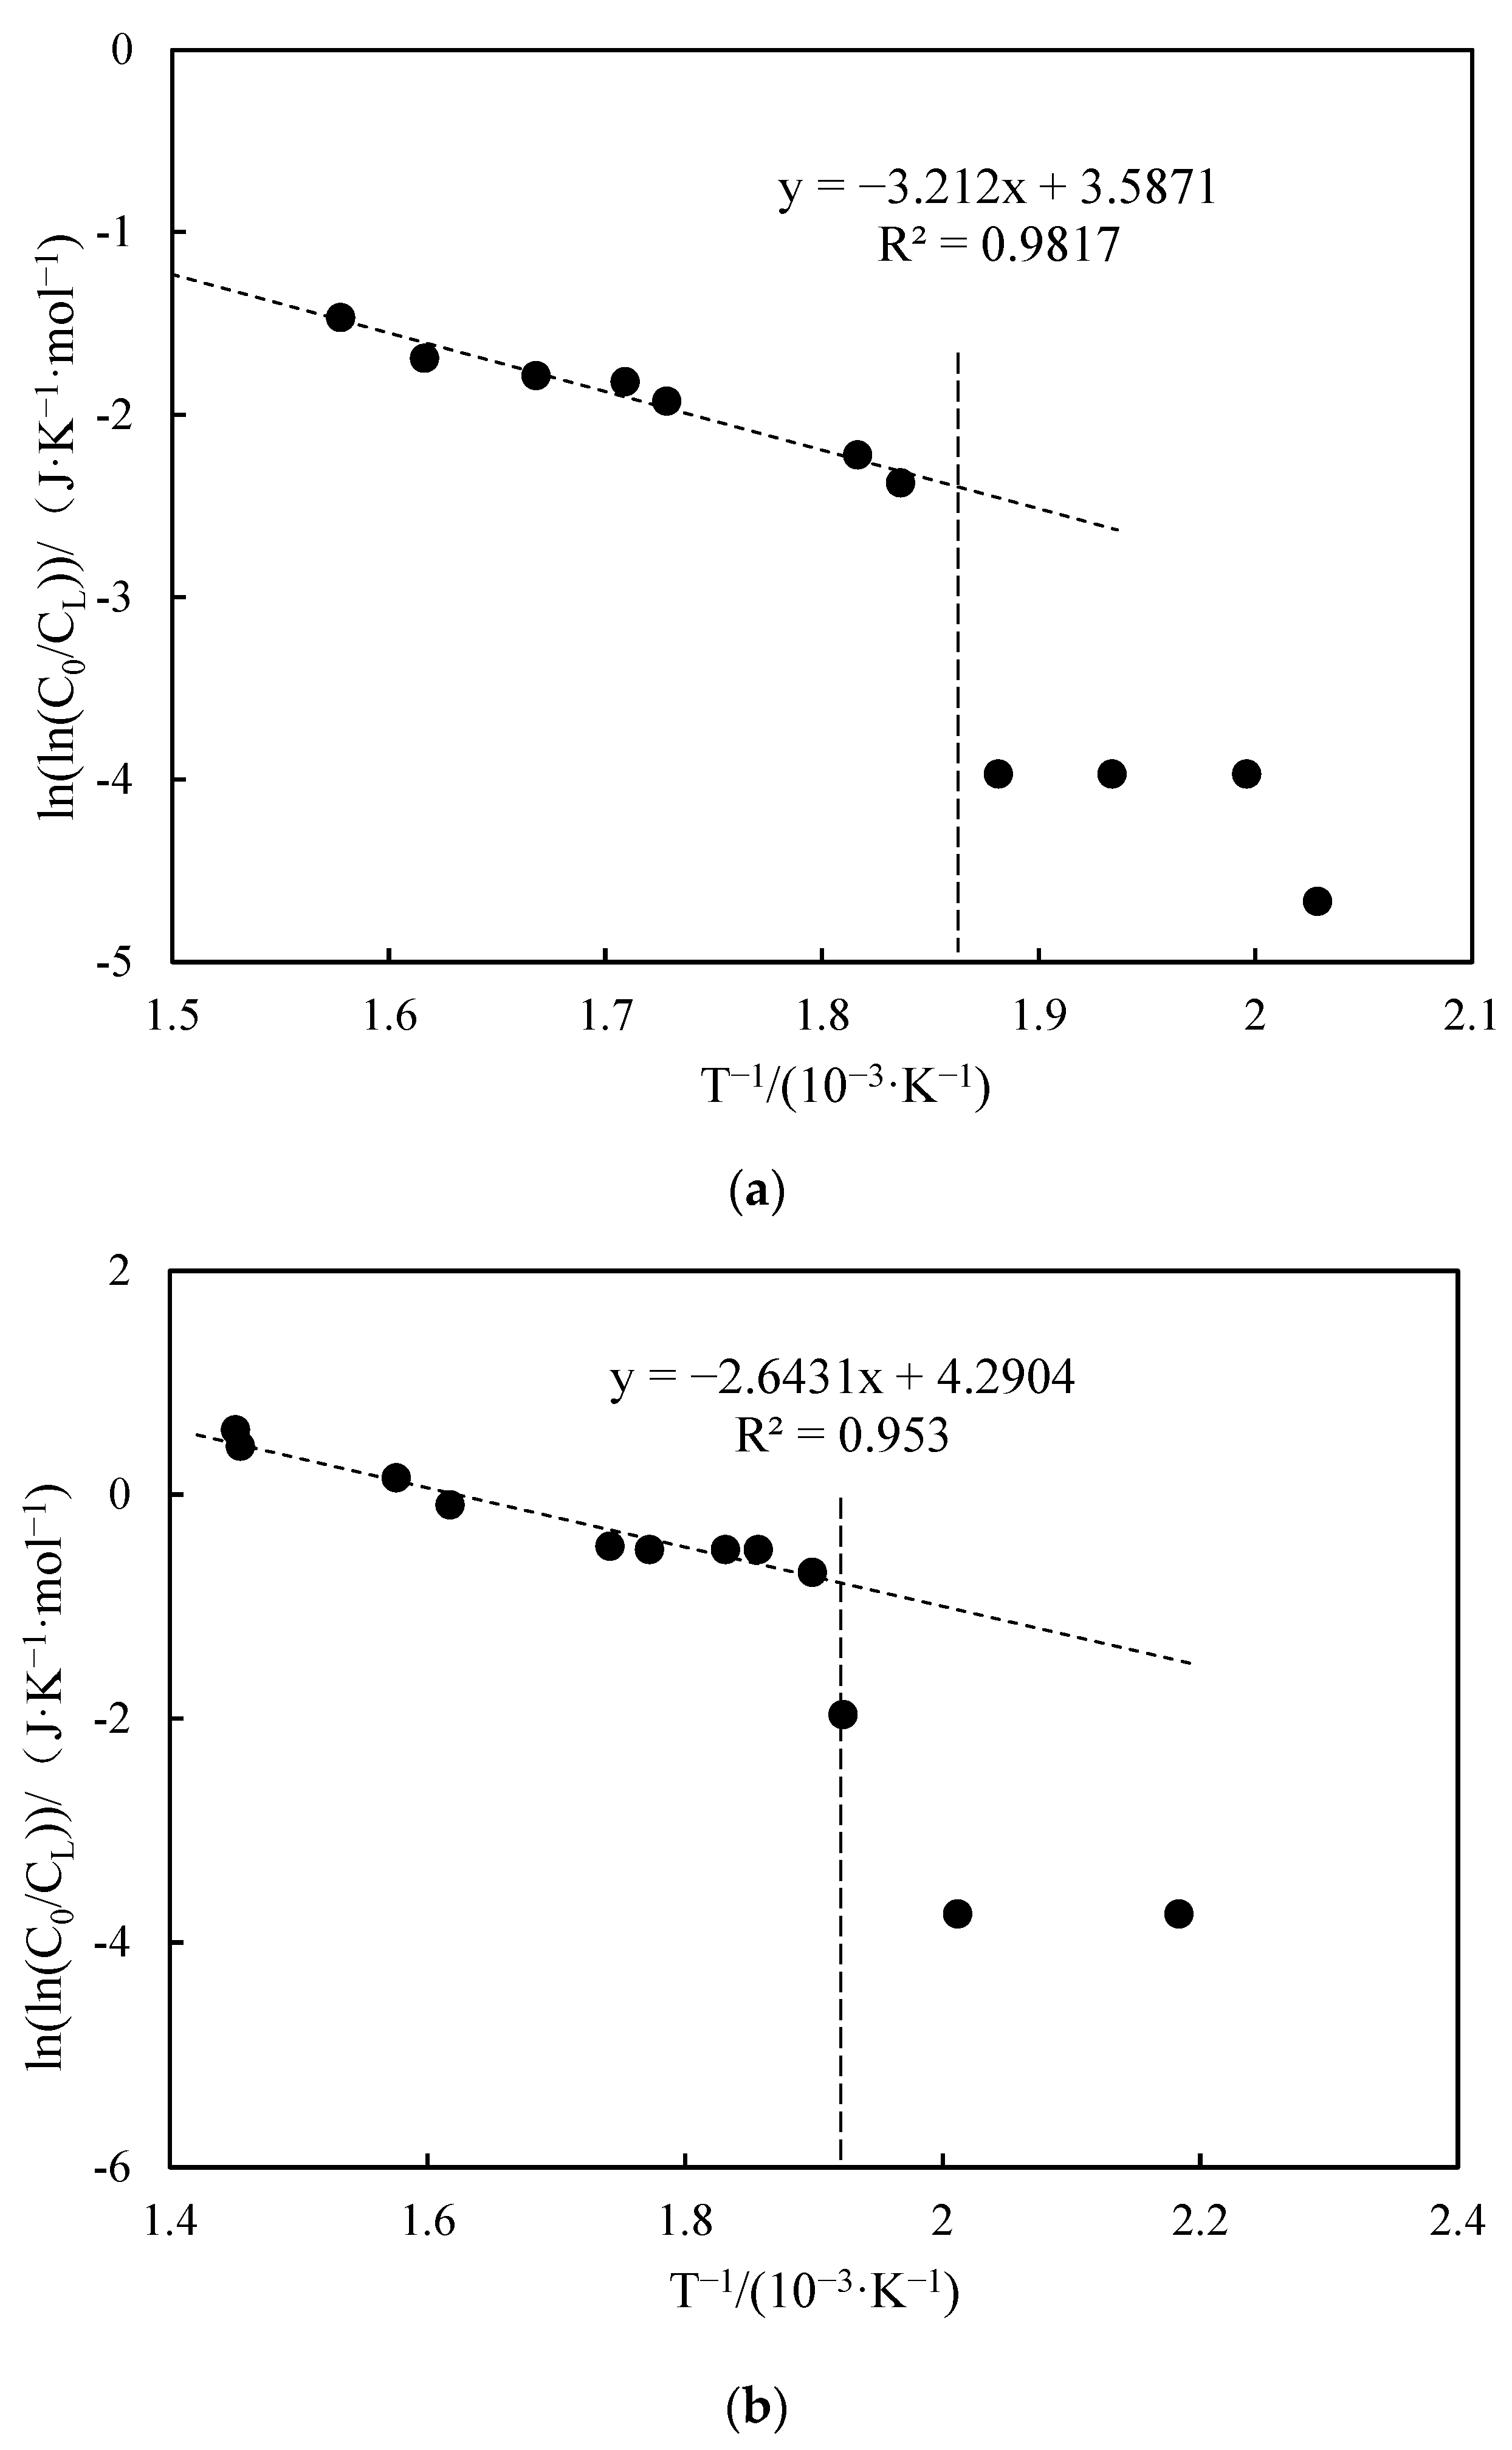
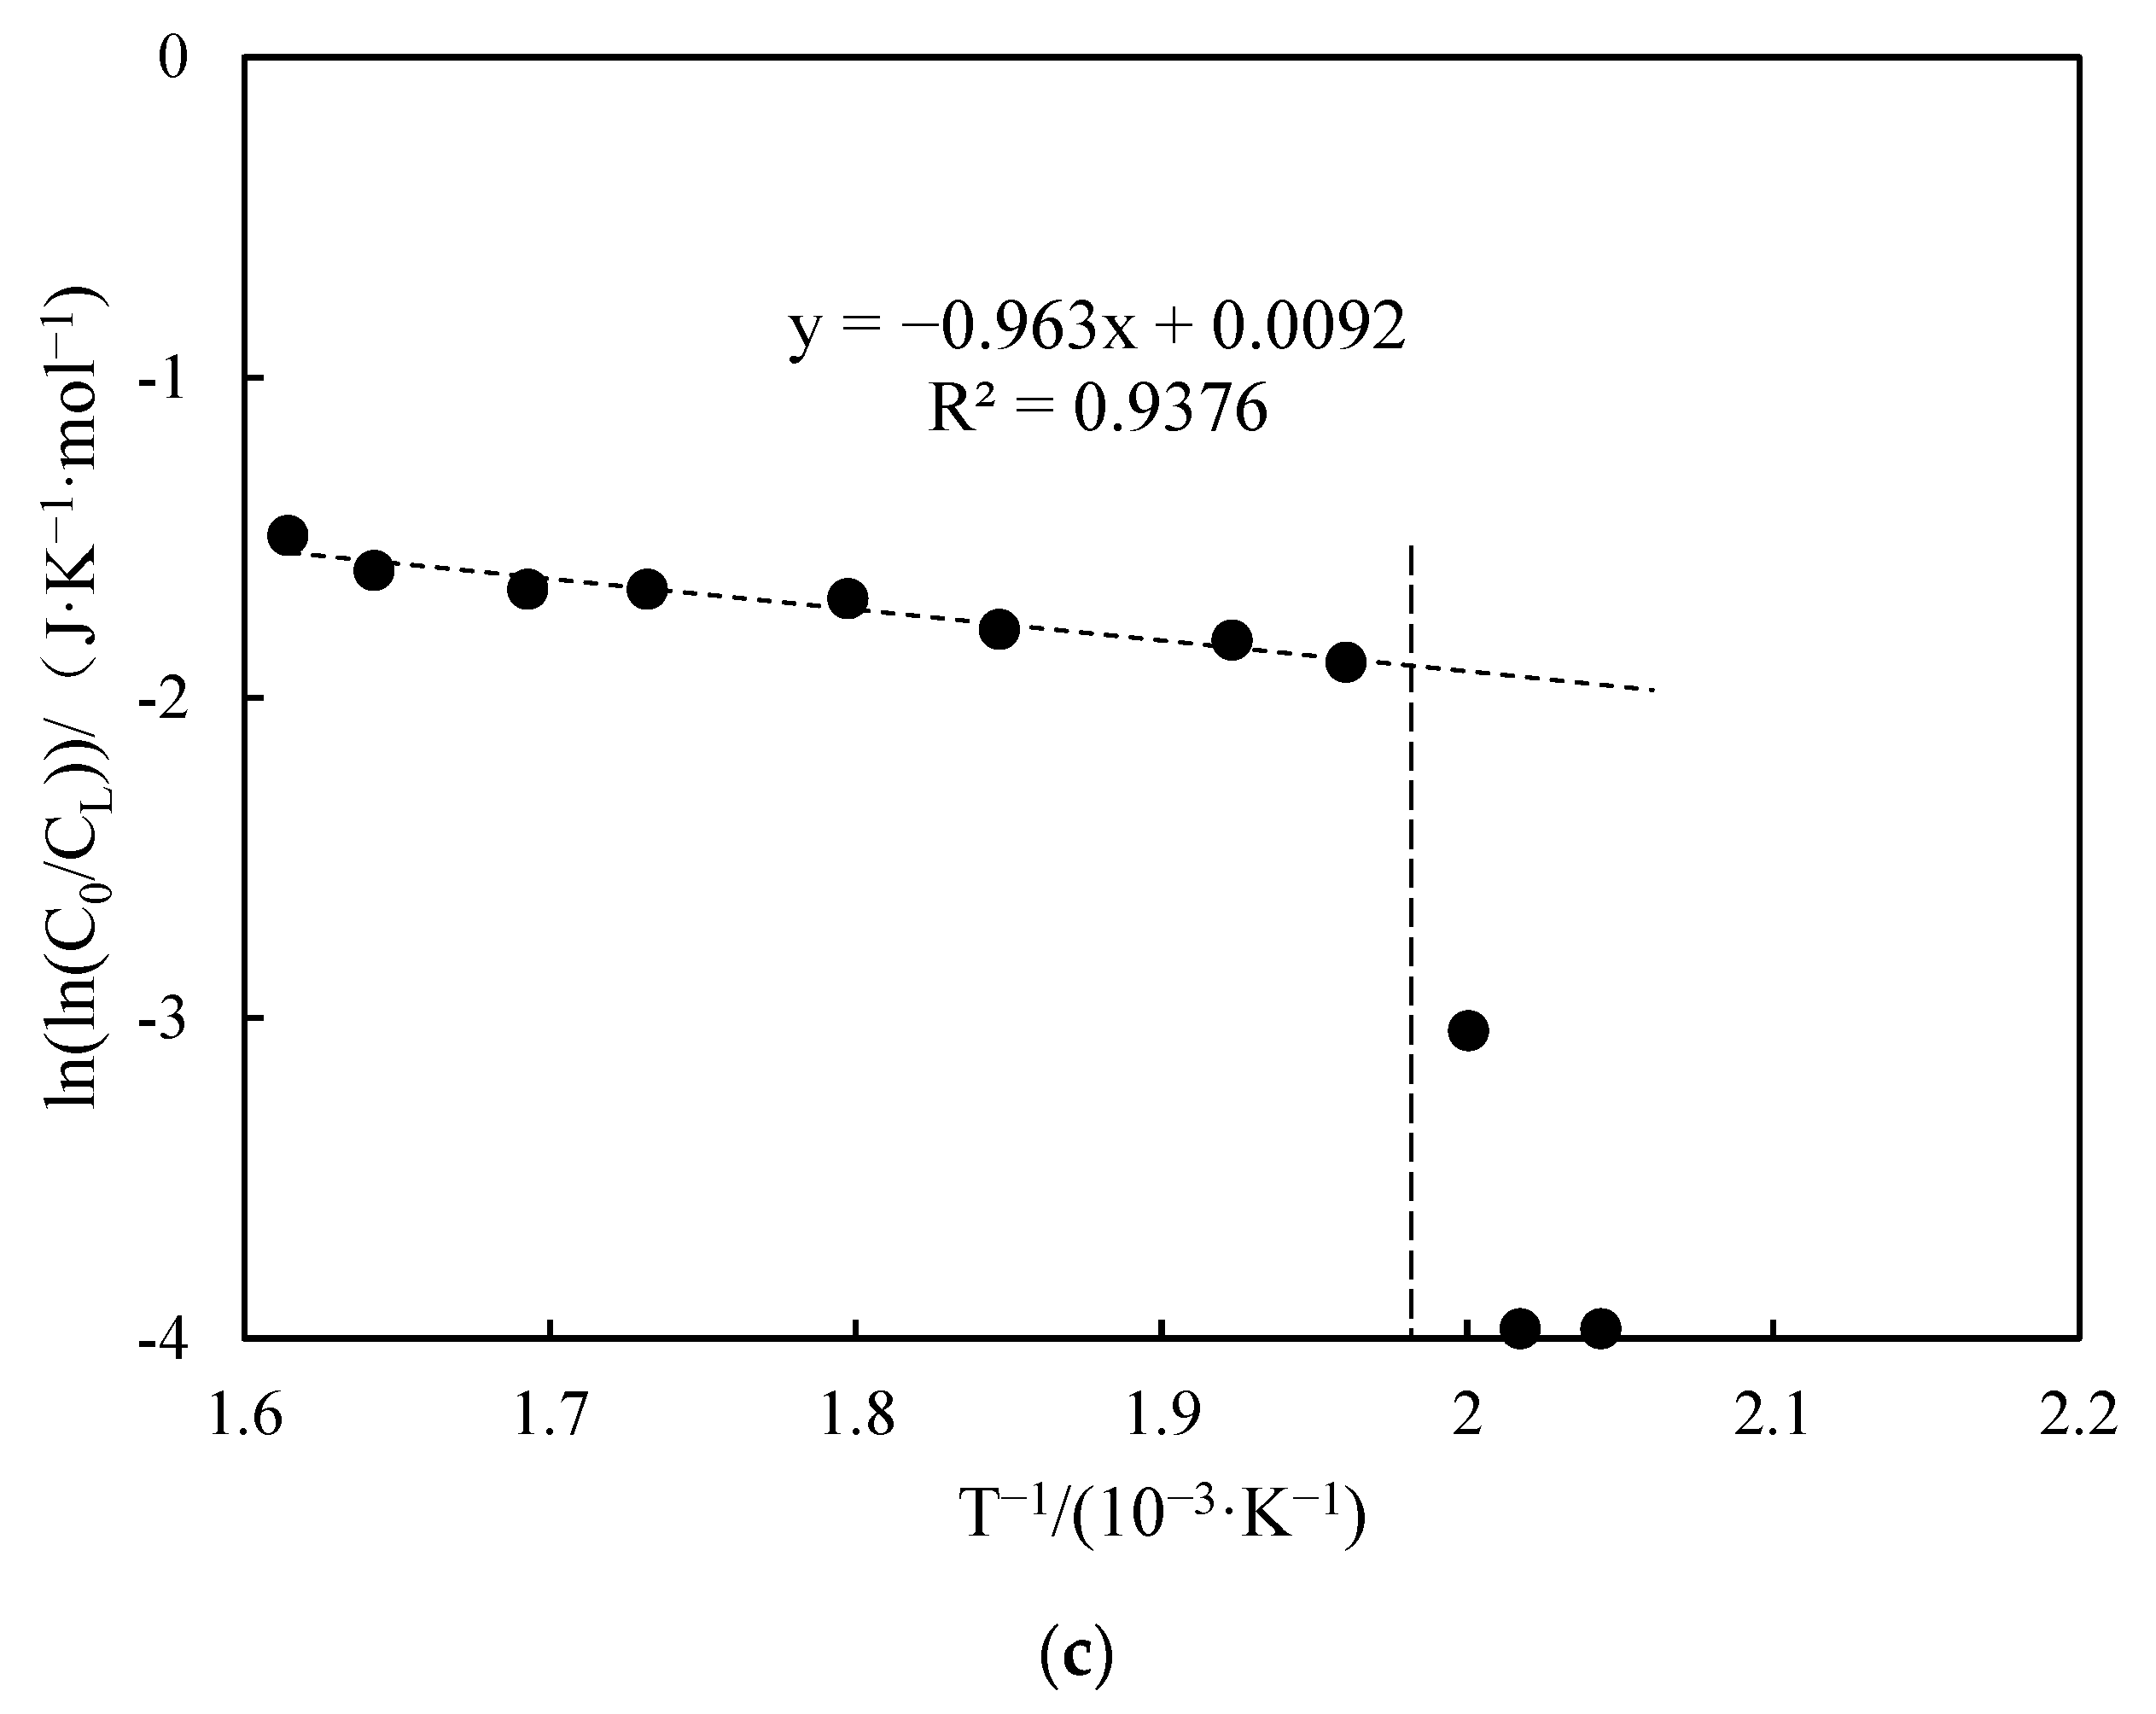
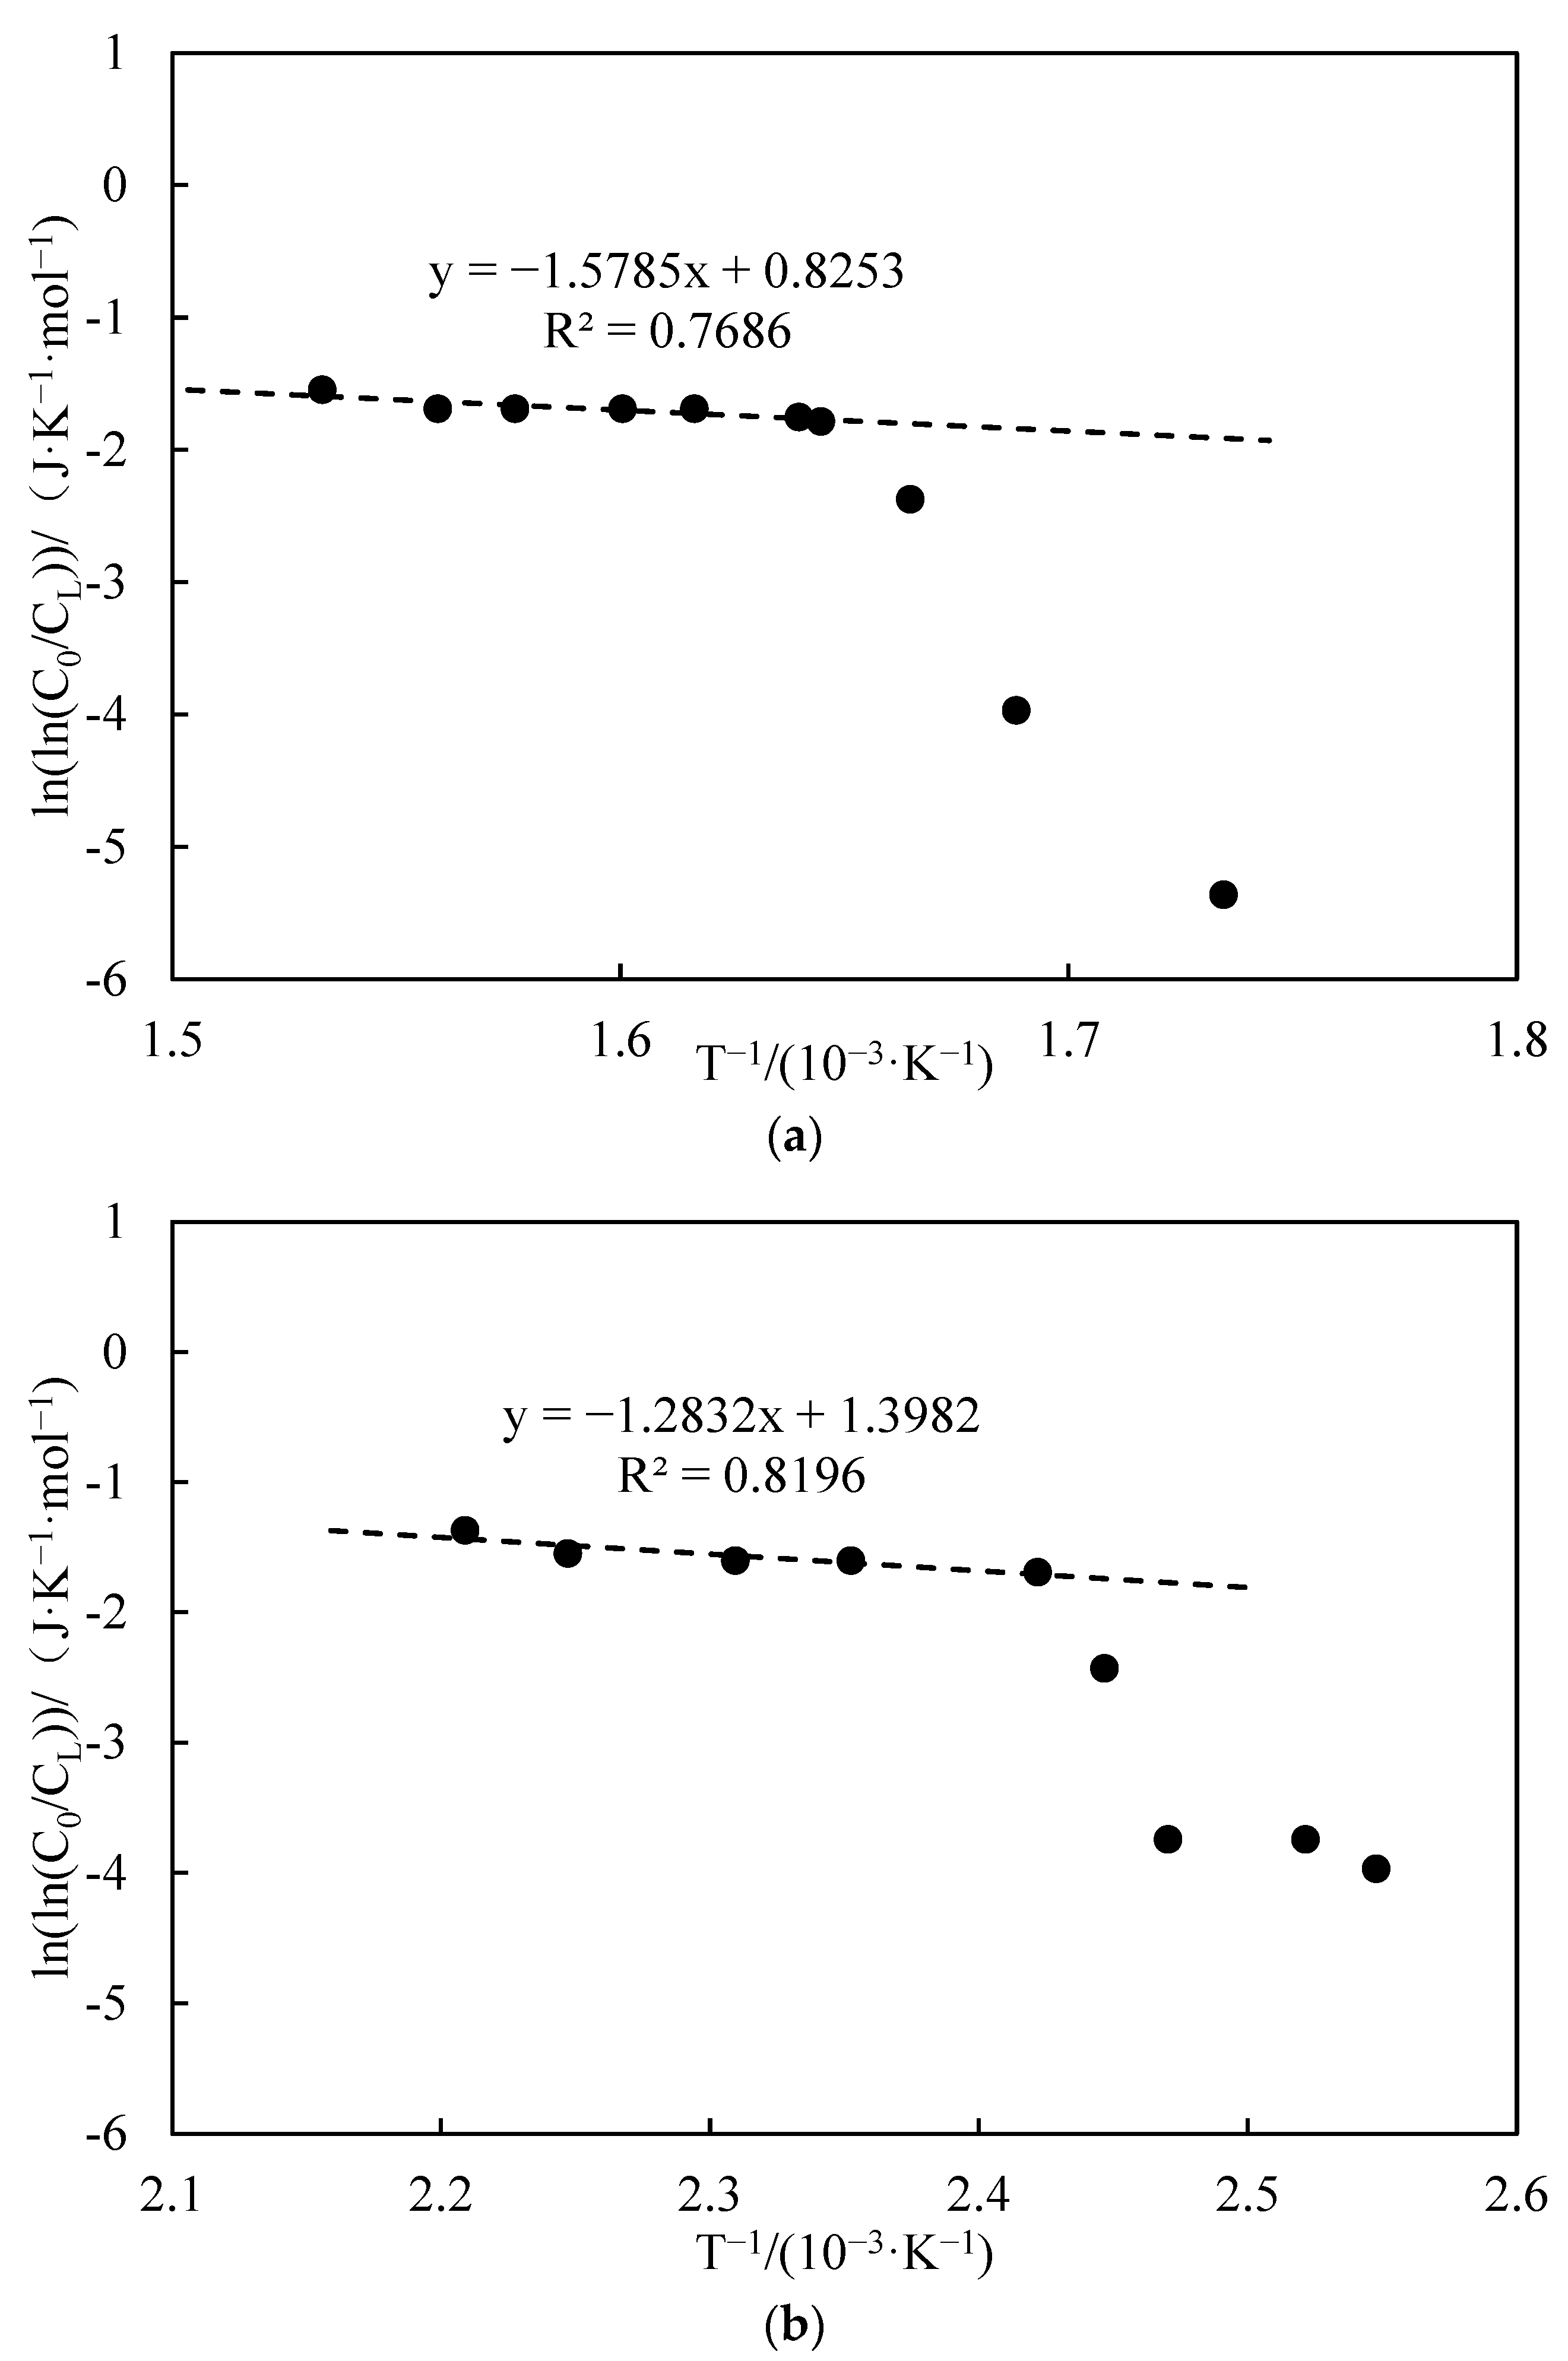
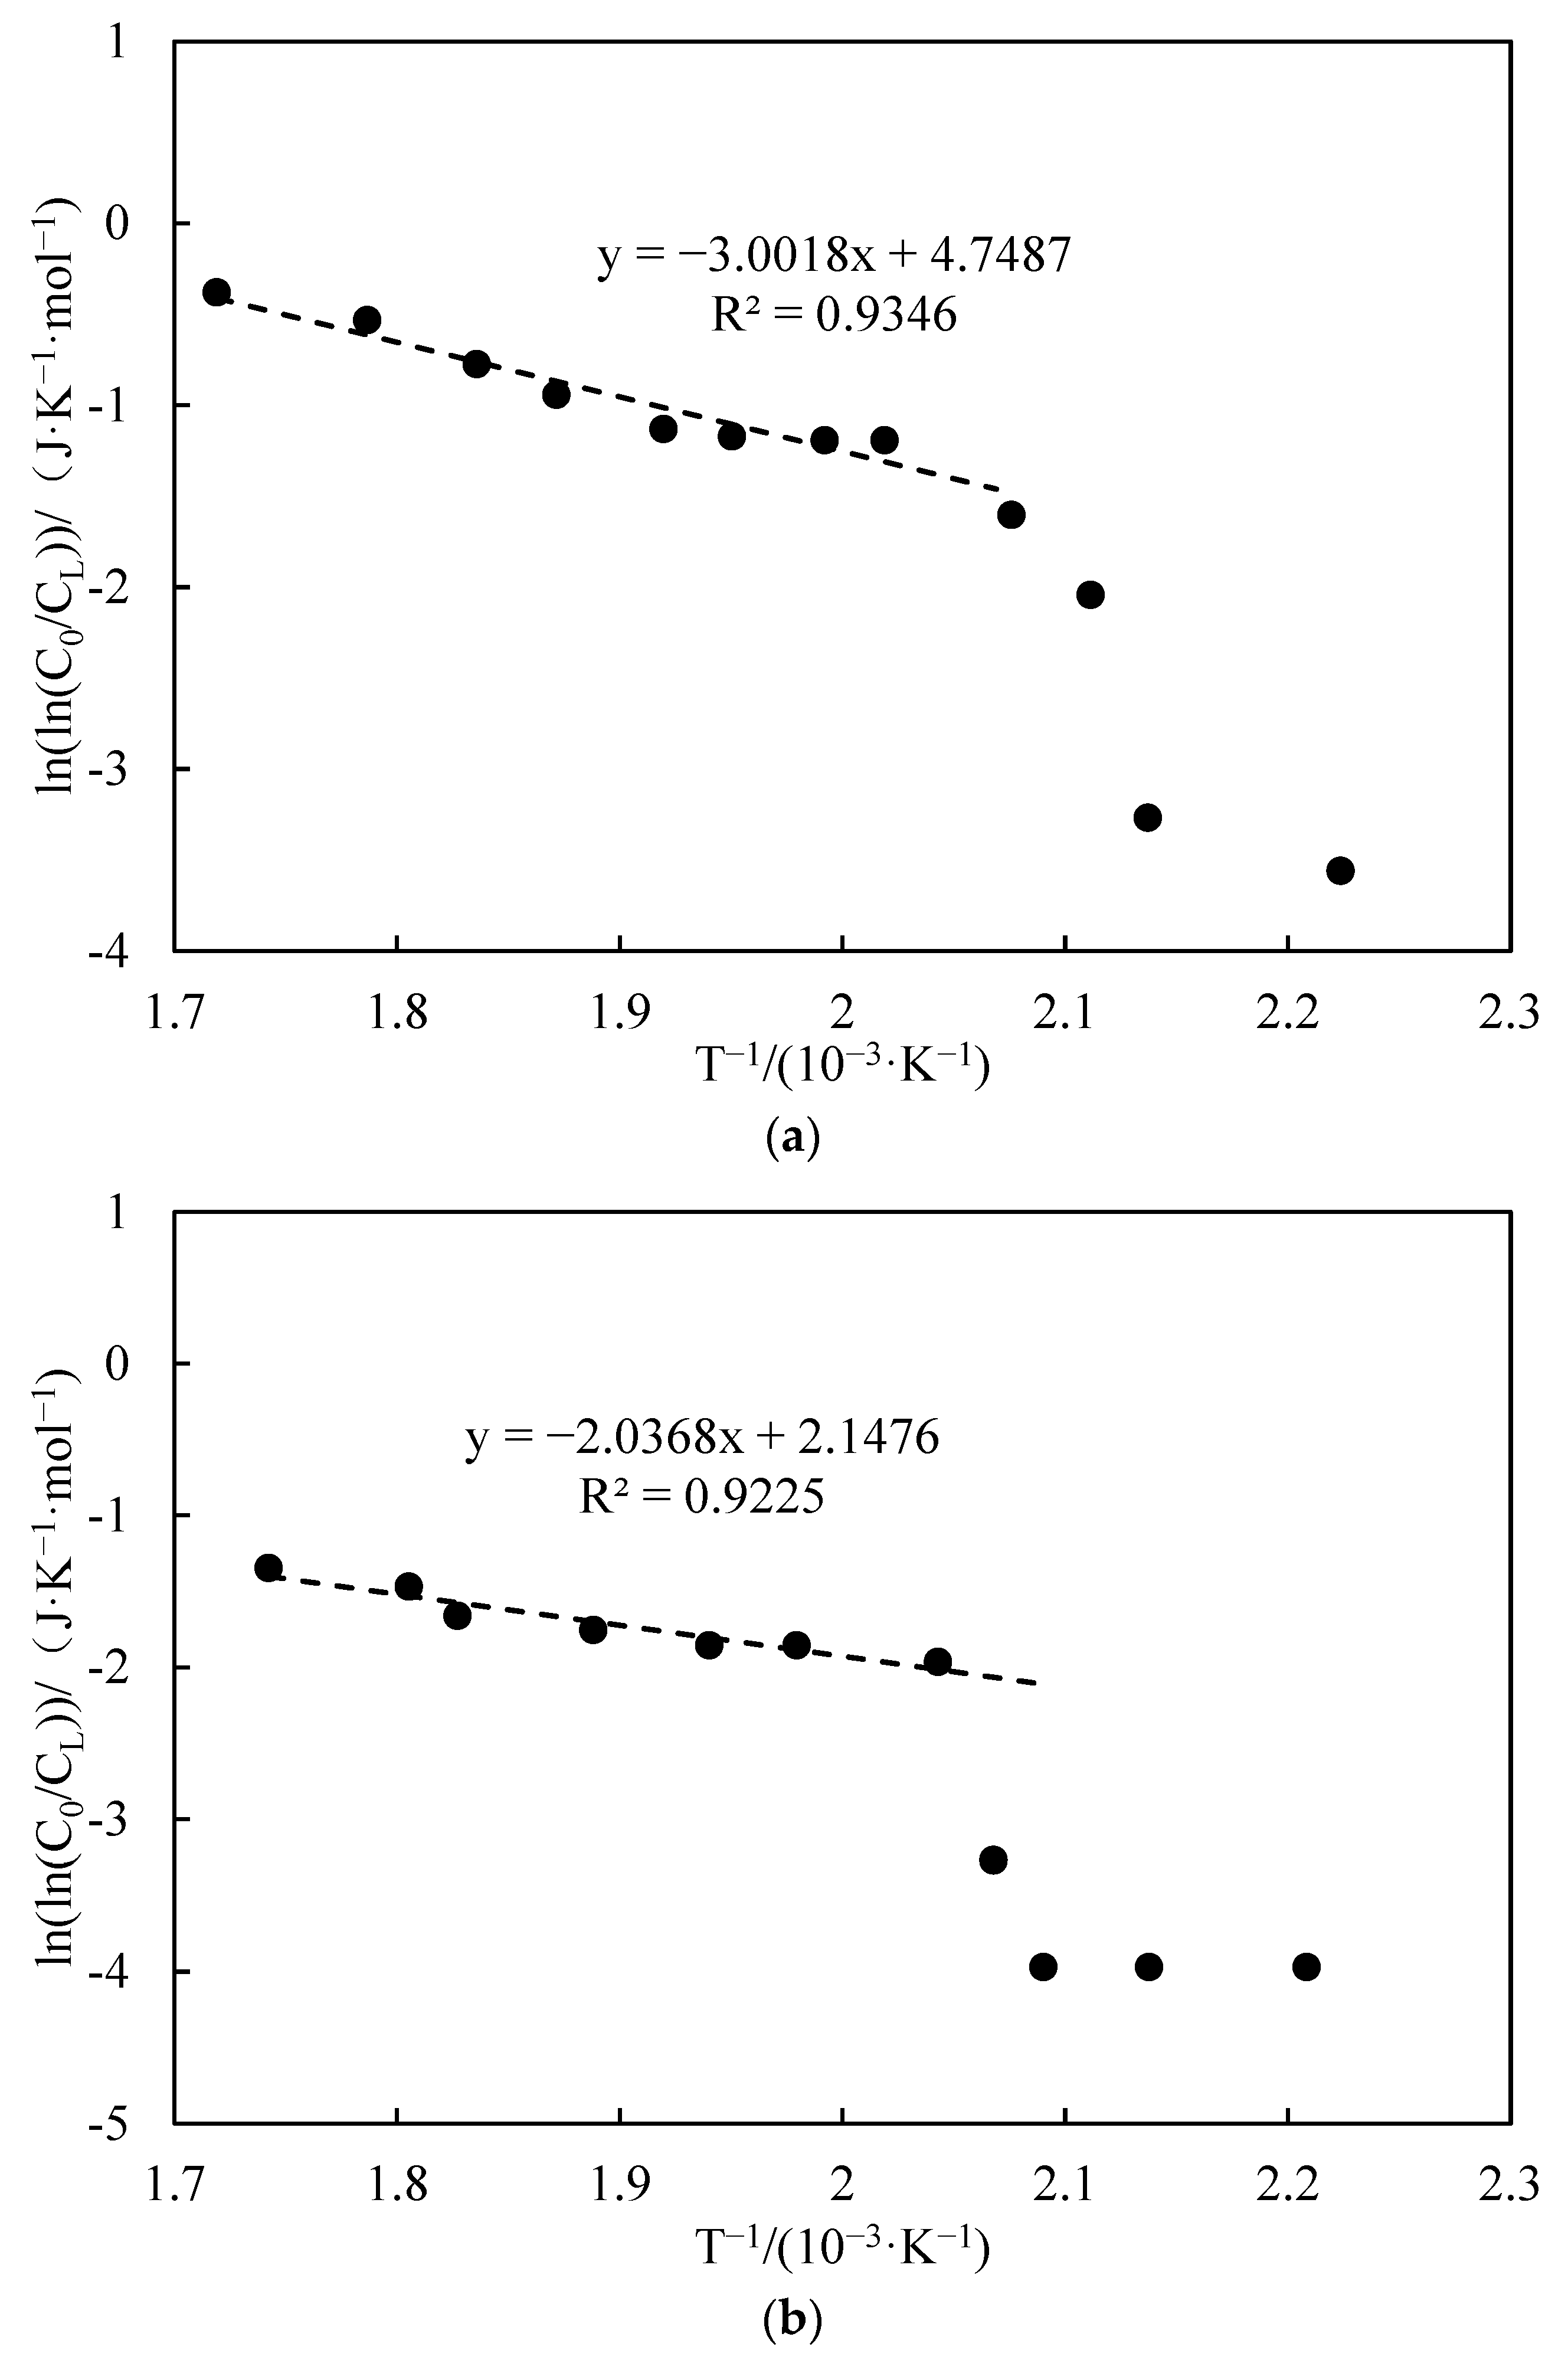
3.3.3. Apparent Activation Energy Analysis

Crude oil oxidation kinetic parameters can be further calculated using a high-temperature and high-pressure ignition simulator [16]. The rate of change of the reactant concentration, obtained from the derivation, is used to characterize the crude oil oxidation rate according to the law of mass action [26]:
d C d t = k C n
where C is the concentration of the reactant, mol/L; t is the time, s; k is the rate function of Arrhenius equation; and n is the number of reaction stages, which is taken as 1 here.
The rate function k can be expressed by the Arrhenius equation:
k = A e E R T
where A is the prefinger factor, L/(s·kPa); E is the activation energy, kJ/mol; R is the gas constant, 8.314 J/(mol-K); and T is the temperature, K. In order to ensure accurate calculations, the temperature of the core section is determined by taking the weighted average of the temperatures measured by the three thermocouples located in the core section.
Since oxygen serves as the oxidizing agent in the process of crude oil oxidation, the calculations of the kinetic parameters were conducted by using the oxygen concentration as an indicator of reactant generation. This involved incorporating Equation (2) into Equation (1):
d C d t = C n A e E R T
The inner diameter of the combustion tube is ϕ = 2.5 × 10⁻² m, the cross-sectional area is S = 4.91 × 10⁻⁴ m2, and the length of the core is L = 5 cm. Assuming that the injected gas is an ideal gas, the equation for the rate of oxygen consumption of a unit volume of an oil-bearing core located at X at a temperature of T is known from the theory of crude oil oxidation:
d C O 2 d t = d C O 2 x d x · Q S
where d C O 2 x is the consumption of oxygen in dx section, mol/m3 and Q is the gas flow rate, m3/s.
Substitute Equation (4) into Equation (3) and take the natural logarithm to obtain the following:
ln ( l n ( C o C L ) ) = l n ( S L A Q ) E R · 1 T
where C o is the molar concentration of oxygen at the inlet end, mol/m3 and C L is the molar concentration of oxygen at the outlet end, mol/m3.
The temperature and exhaust gas component data from experiments 1 to 3 were processed to obtain the curve of ln ( l n ( C o C L ) ) versus T 1 under different pressure conditions, as shown in Figure 10.
As depicted in Figure 10, the relationship between ln ( l n ( C o C L ) ) and T 1 is not entirely linear as the system temperature increases. Instead, it exhibits a distinct stage characterized by an inflection point. The curves only demonstrate better linearity when the temperature surpasses a specific inflection point temperature. This is because the reaction mechanism of crude oil in different oxidation stages varies. In the LTO oxidation stage, the oxidation reaction is not the sole factor, as it is accompanied by physical changes such as phase change and volatilization. Therefore, it becomes challenging to demonstrate the linear relationship depicted in the Arrhenius equation. When the temperature exceeds the inflection point, the oxidation reaction is rapidly enhanced and enters the high-temperature oxidation (HTO) stage. As the temperature rises, the water and light components in the core become volatile. This leads to a change in temperature and concentration of the output material, which is primarily caused by HTO [6]. The temperature range of the HTO stage is about 230~400 °C, the linearity of the curve is improved, and all correlation coefficients are above 0.9.
The curve of the HTO stage was linearly fitted, and the apparent activation energy, finger front factor, and inflection point temperature were determined based on the fitted curve. The calculation results are shown in Table 4. From the data in the table, it can be observed that, as the pressure increases, the inflection point temperature decreases and the apparent activation energy decreases. This suggests that, during the combustion initiation stage, increasing the pressure raises the partial pressure of oxygen and enhances the heat transfer efficiency of the medium, resulting in a lower apparent activation energy and facilitating the oxidation of the crude oil [27].
The temperature and exhaust gas component data from experiments 4 to 5 were processed to obtain the curves of ln ( l n ( C o C L ) ) versus T 1 under the conditions of different injection velocities, which are shown in Figure 11. The curves were processed to obtain the oxidation kinetic parameters, as shown in Table 5.
When the gas injection rate is 200 mL/min, the correlation coefficient of its high-temperature section is only 0.7686, indicating a poor fit. Additionally, the apparent activation energy is higher compared to the experiment with a high gas injection rate. The inflection point temperature is also as high as 333 °C, suggesting insufficient oxygen supply at this time. As a result, the accumulation of heat generated by HTO is slower, causing the inflection point to be reached only at a relatively higher temperature. Consequently, the apparent activation energy is also higher. When the gas injection rate reaches 400 mL/min, the inflection point temperature is only 140 °C. At this point, the heat generated by LTO is greater than the reservoir warming and heat loss [28]. Therefore, in the in situ combustion ignition process, attention should be paid to the design of the air injection speed during ignition. The injection air speed must be controlled within a certain range. If it is too low, it cannot ensure the maintenance of low-temperature oxidation. On the other hand, if it is too high, it is likely to sweep the formation, causing cooling. The cold air carries LTO heat into the depths of the formation and the accumulation of heat cannot meet the ignition requirements. Consequently, the success of the ignition is bound to decline.
The temperature and exhaust gas component data from experiments 6 and 7 were processed to obtain the curve of ln ( l n ( C o C L ) ) versus T 1 under different oil–water ratios, as shown in Figure 12. The curves were processed to obtain the oxidation kinetic parameters, as shown in Table 6.
From Figure 12, it can be seen that the crude oil can still reach the combustion state even under high water saturation conditions (50%). With the increase in oil saturation, both the inflection point temperature and apparent activation energy also increase.
The temperature and exhaust gas component data from experiments 8 to 10 were processed to obtain the curves of ln ( l n ( C o C L ) ) versus T 1 under the conditions of different heating rates, as shown in Figure 13. The curves were processed to obtain the oxidation kinetic parameters, as shown in Table 7.
As can be seen from Figure 13, the inflection point temperature rises with the increase in heating rate and the apparent activation energy generally shows a decreasing trend. With the increase in heating rate, the onset temperature of crude oil HTO gradually shifts backward and the thermal hysteresis phenomenon becomes more pronounced. This is because an increase in the heating rate results in a shorter duration of the fuel deposition stage. When the heating rate is low, the crude oil and oxygen can be well contacted and react in the LTO oxidation reaction stage. However, when the heating rate is increased, the speed of the crude oil oxidation reaction will accelerate, resulting in a shorter oxidation time for the different oxidation stages. This phenomenon is known as thermal hysteresis [29]. When the heating rate is 6℃/min, the correlation coefficient of the HTO curve is only 0.7169, which indicates a poor fit. This suggests that, as the heating rate increases, the reaction time for each reaction stage of the crude oil becomes shorter and shorter. Consequently, the reactions become less sufficient, leading to the overlapping of oxidation stages.

4. Conclusions

7.
The experimental system can achieve real-time monitoring of crude oil combustion in situ. The combination of fuzzy theory and PID control enables thermal tracking compensation, achieving a temperature control accuracy of ±0.1 °C. This device is designed to meet the experimental requirements of high-pressure, rapid temperature changes and complex gas production components during crude oil combustion. It has a pressure resistance of 10 MPa, a sampling resolution of 0.1 °C, and the capability to monitor and record the content of seven tail gas components in real time.
8.
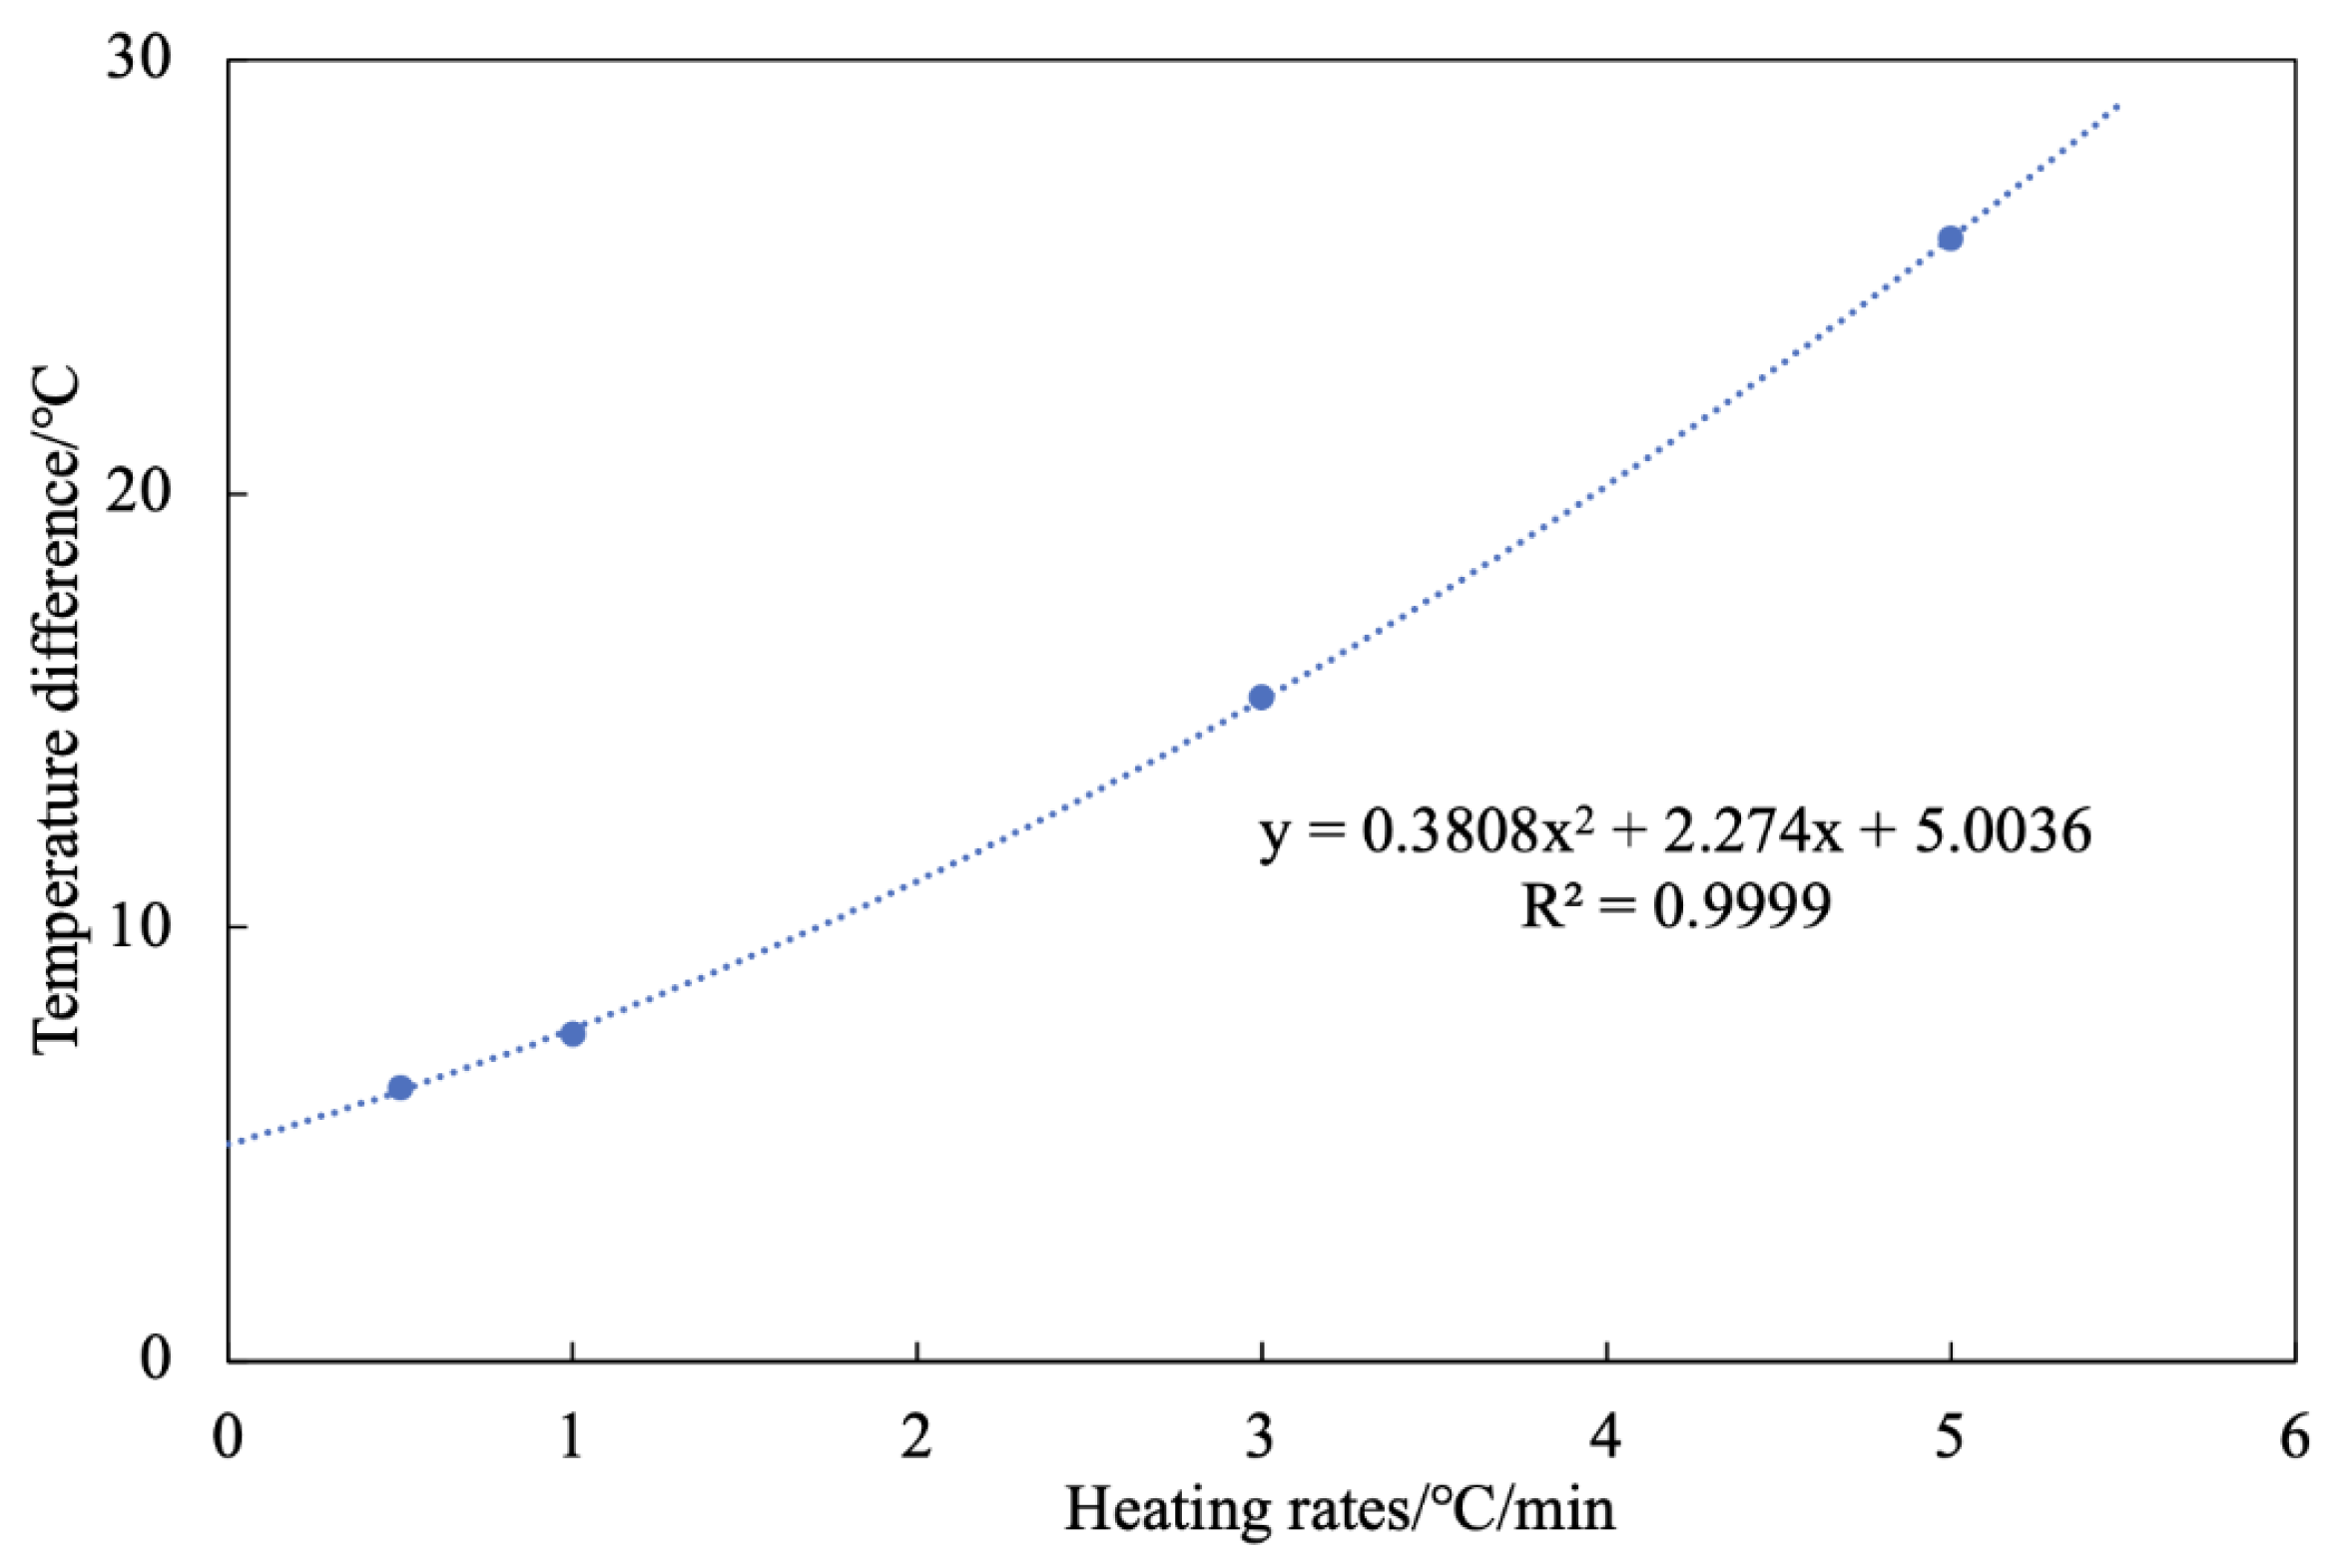
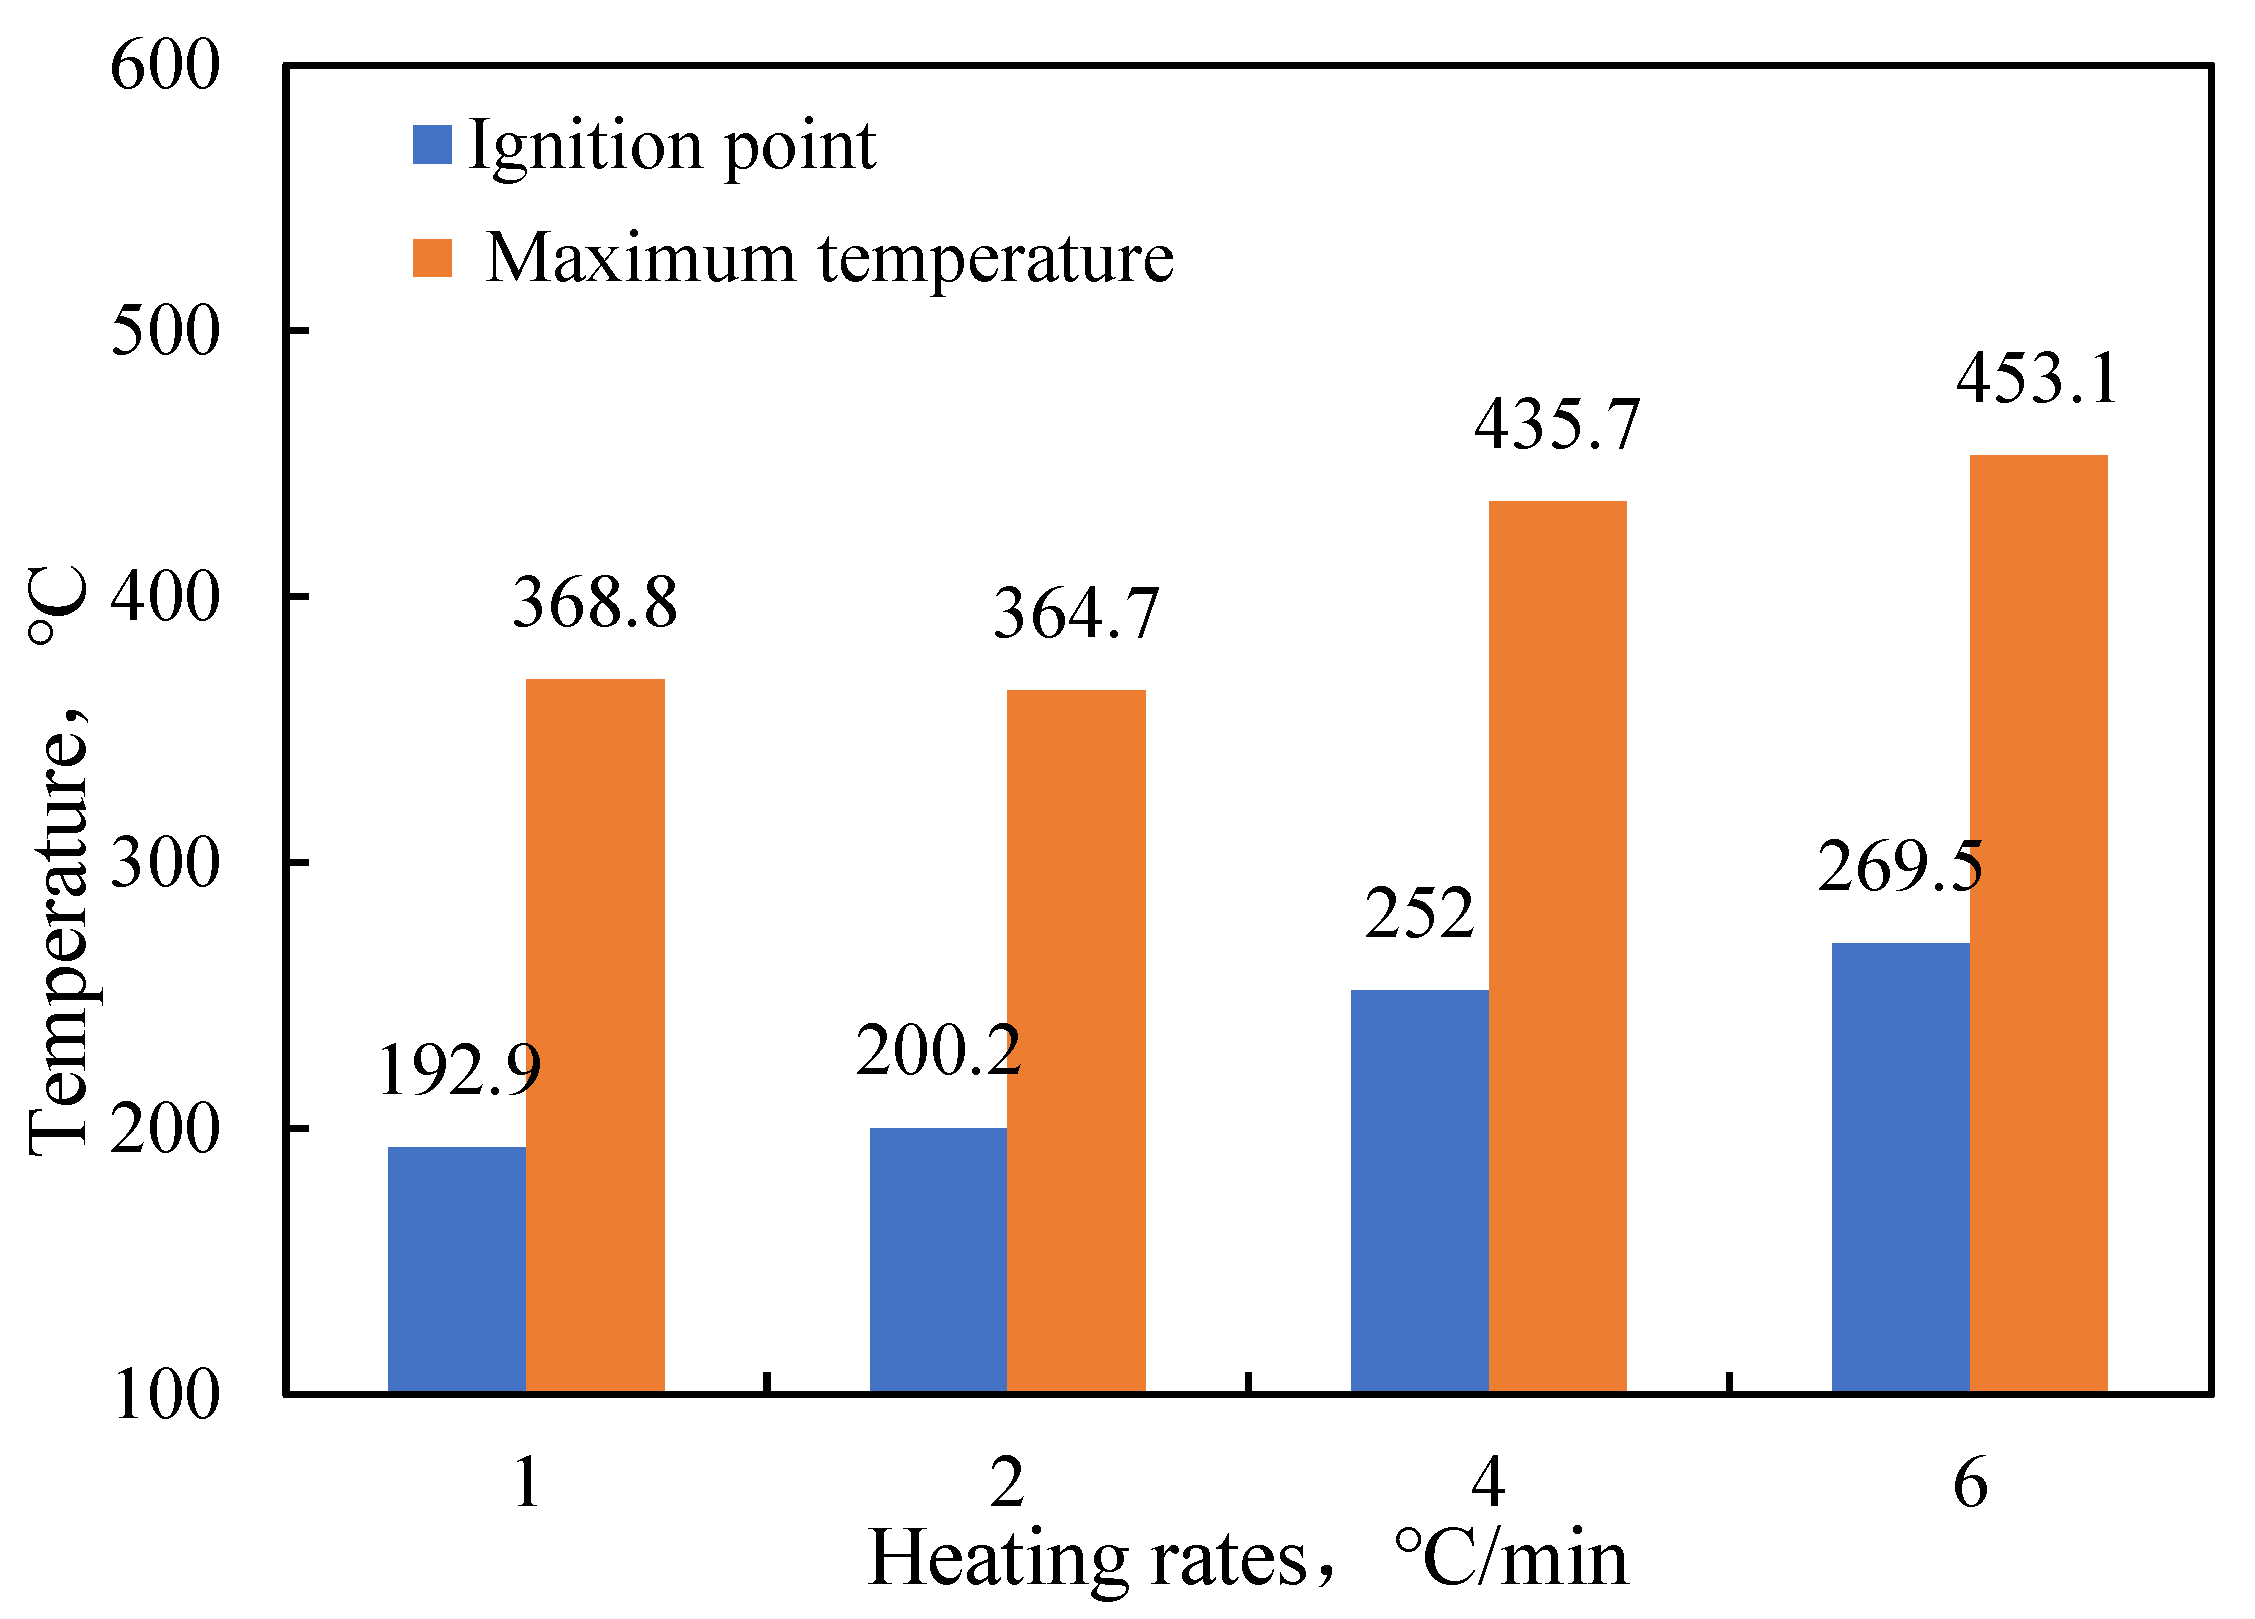
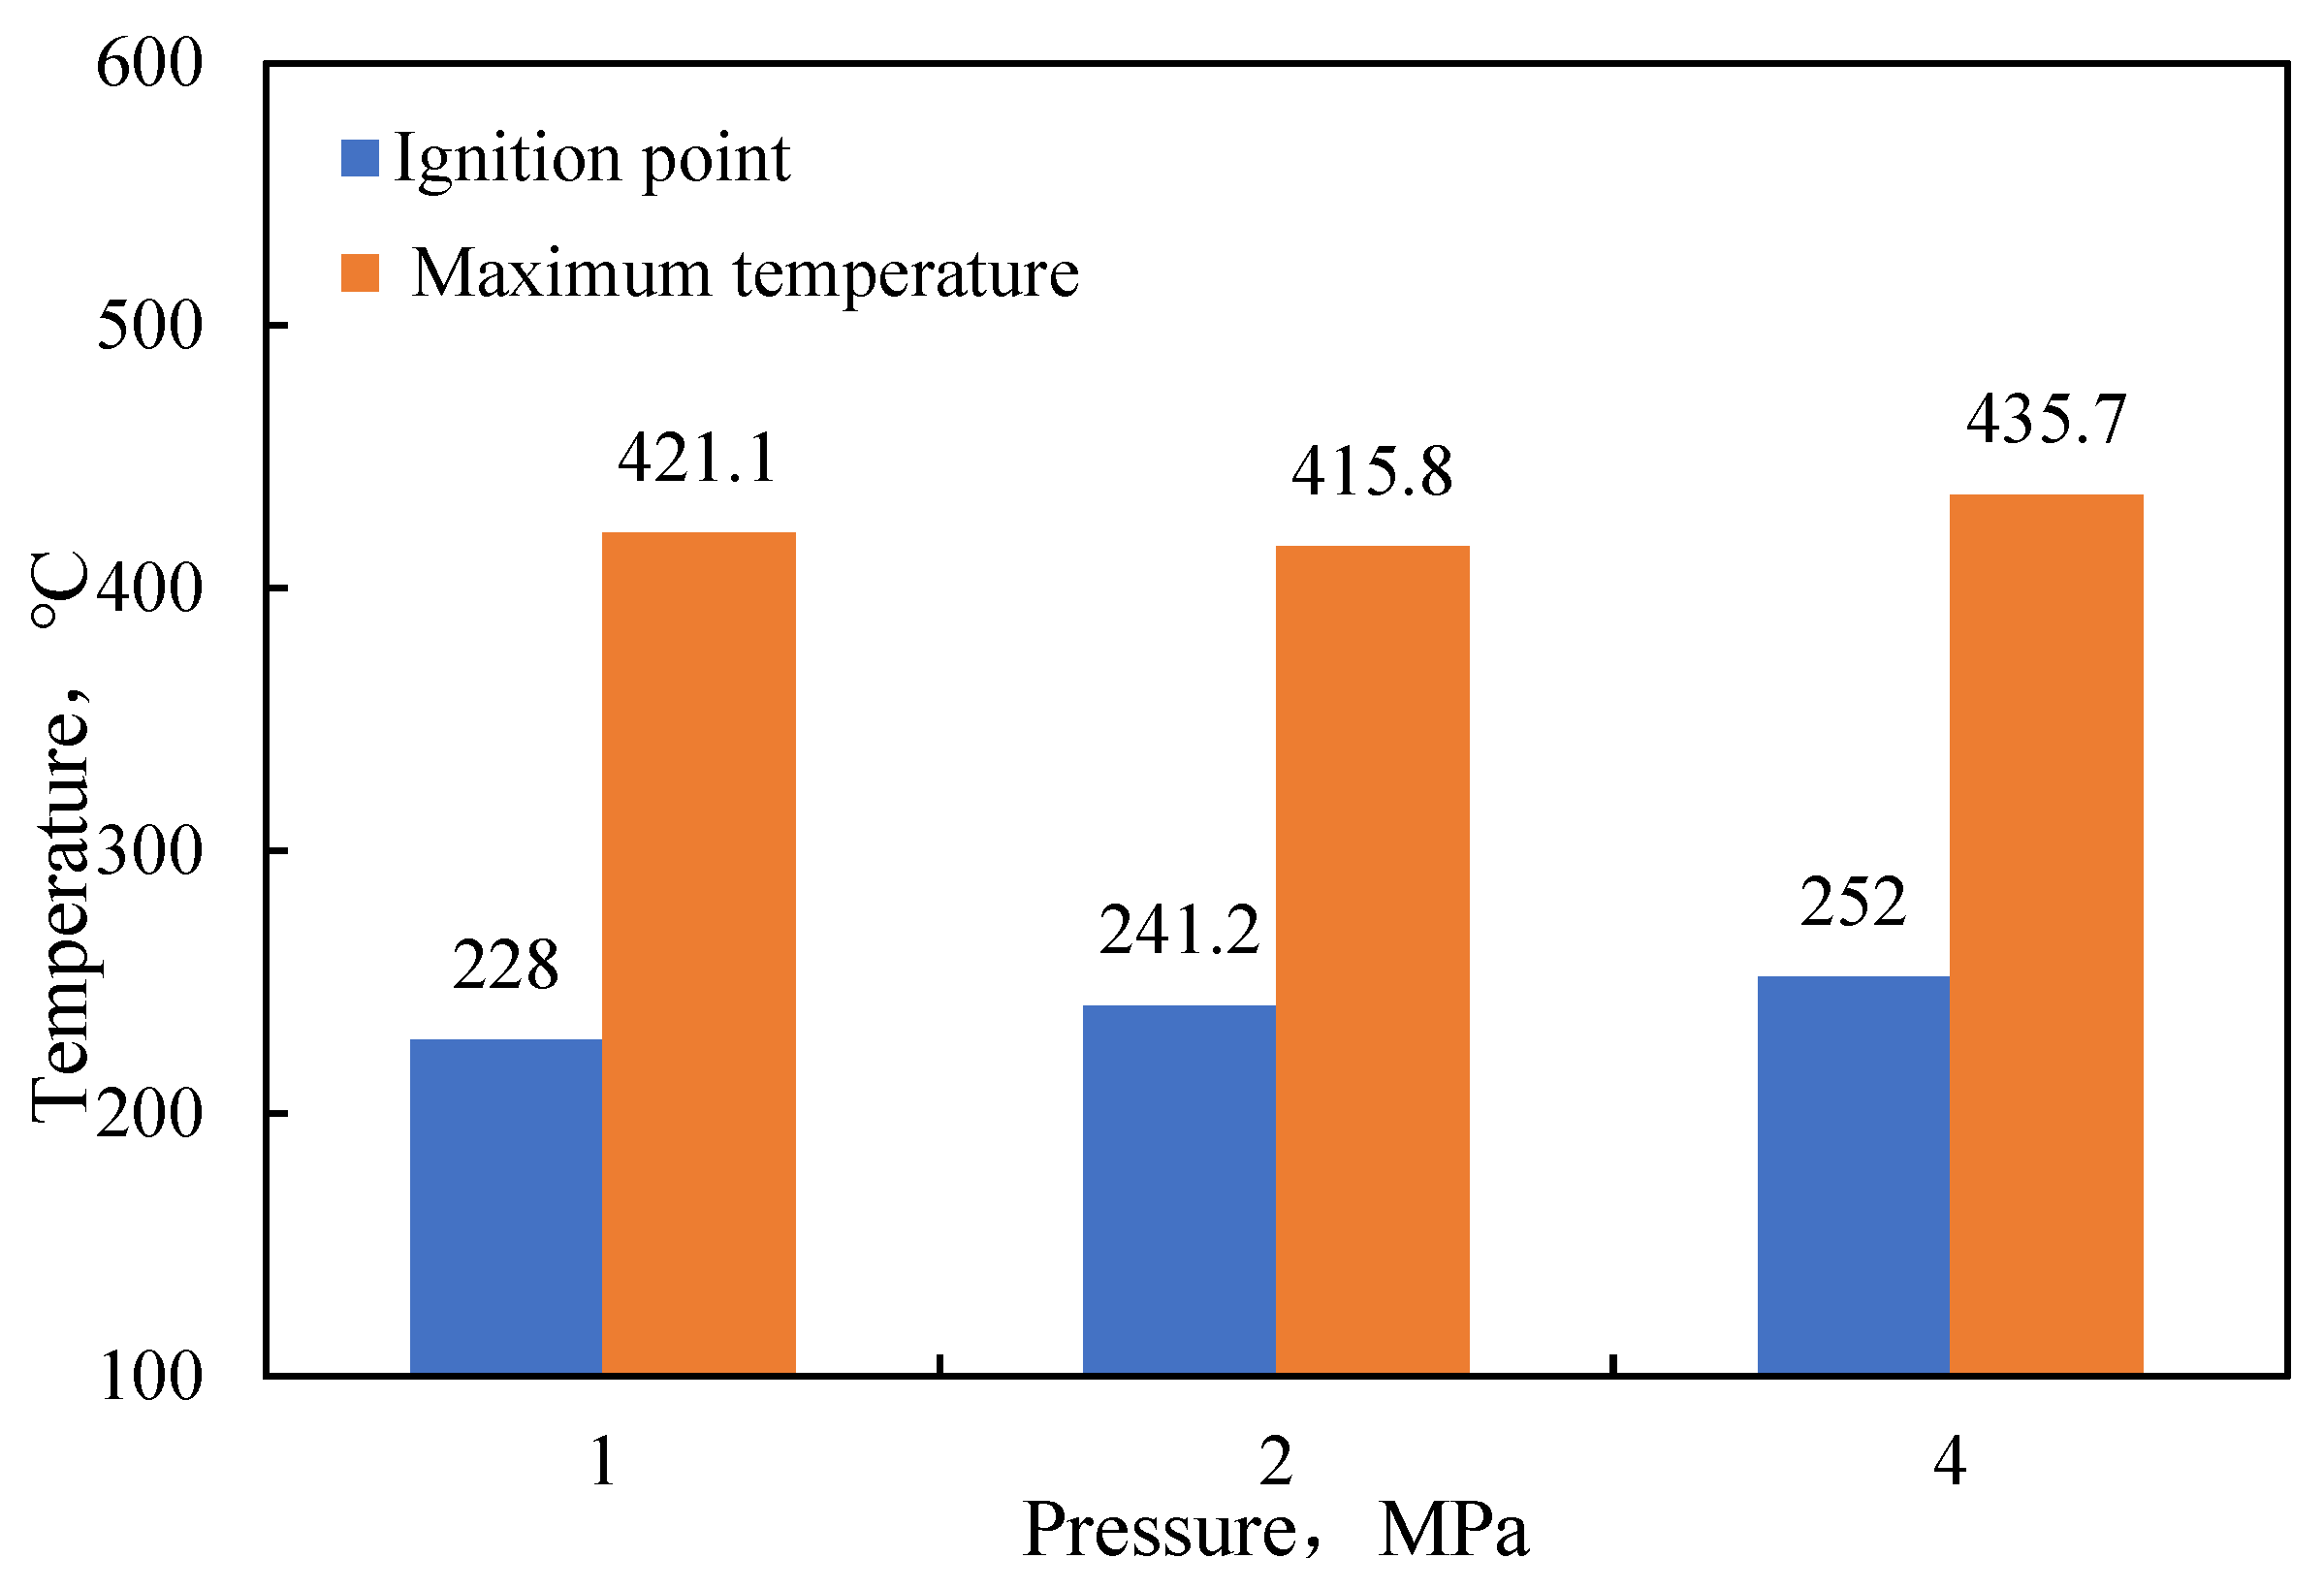
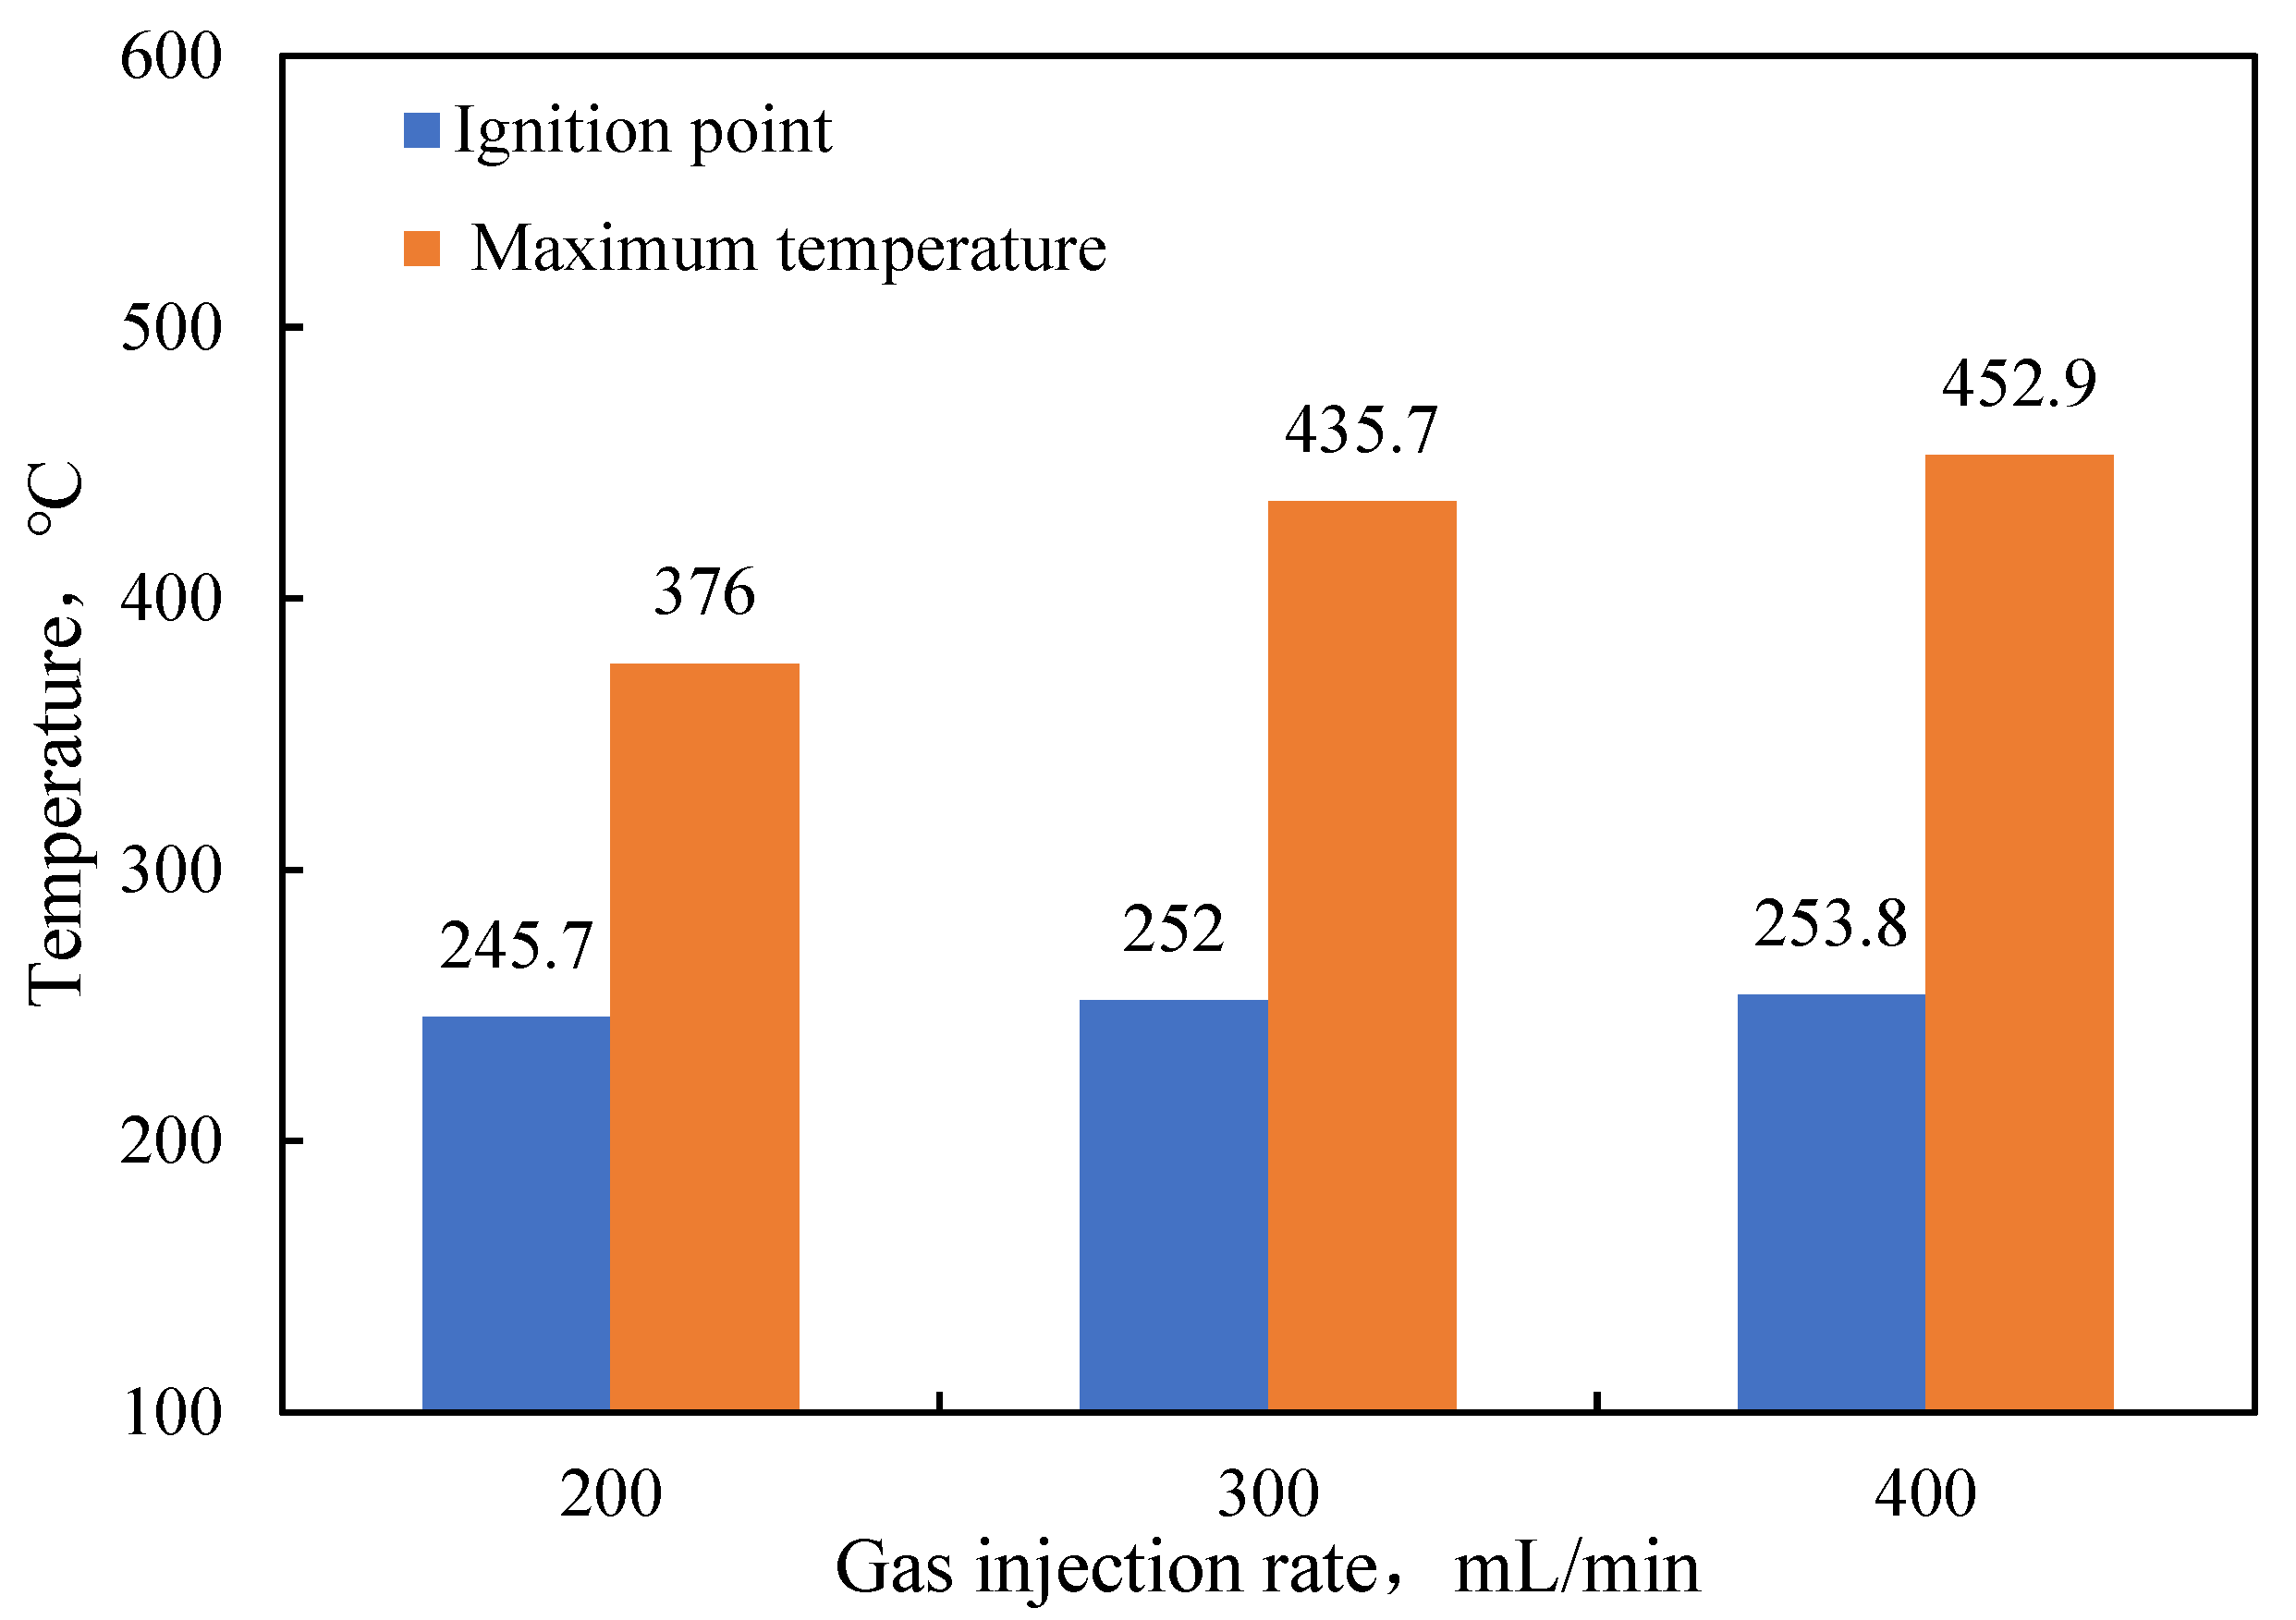
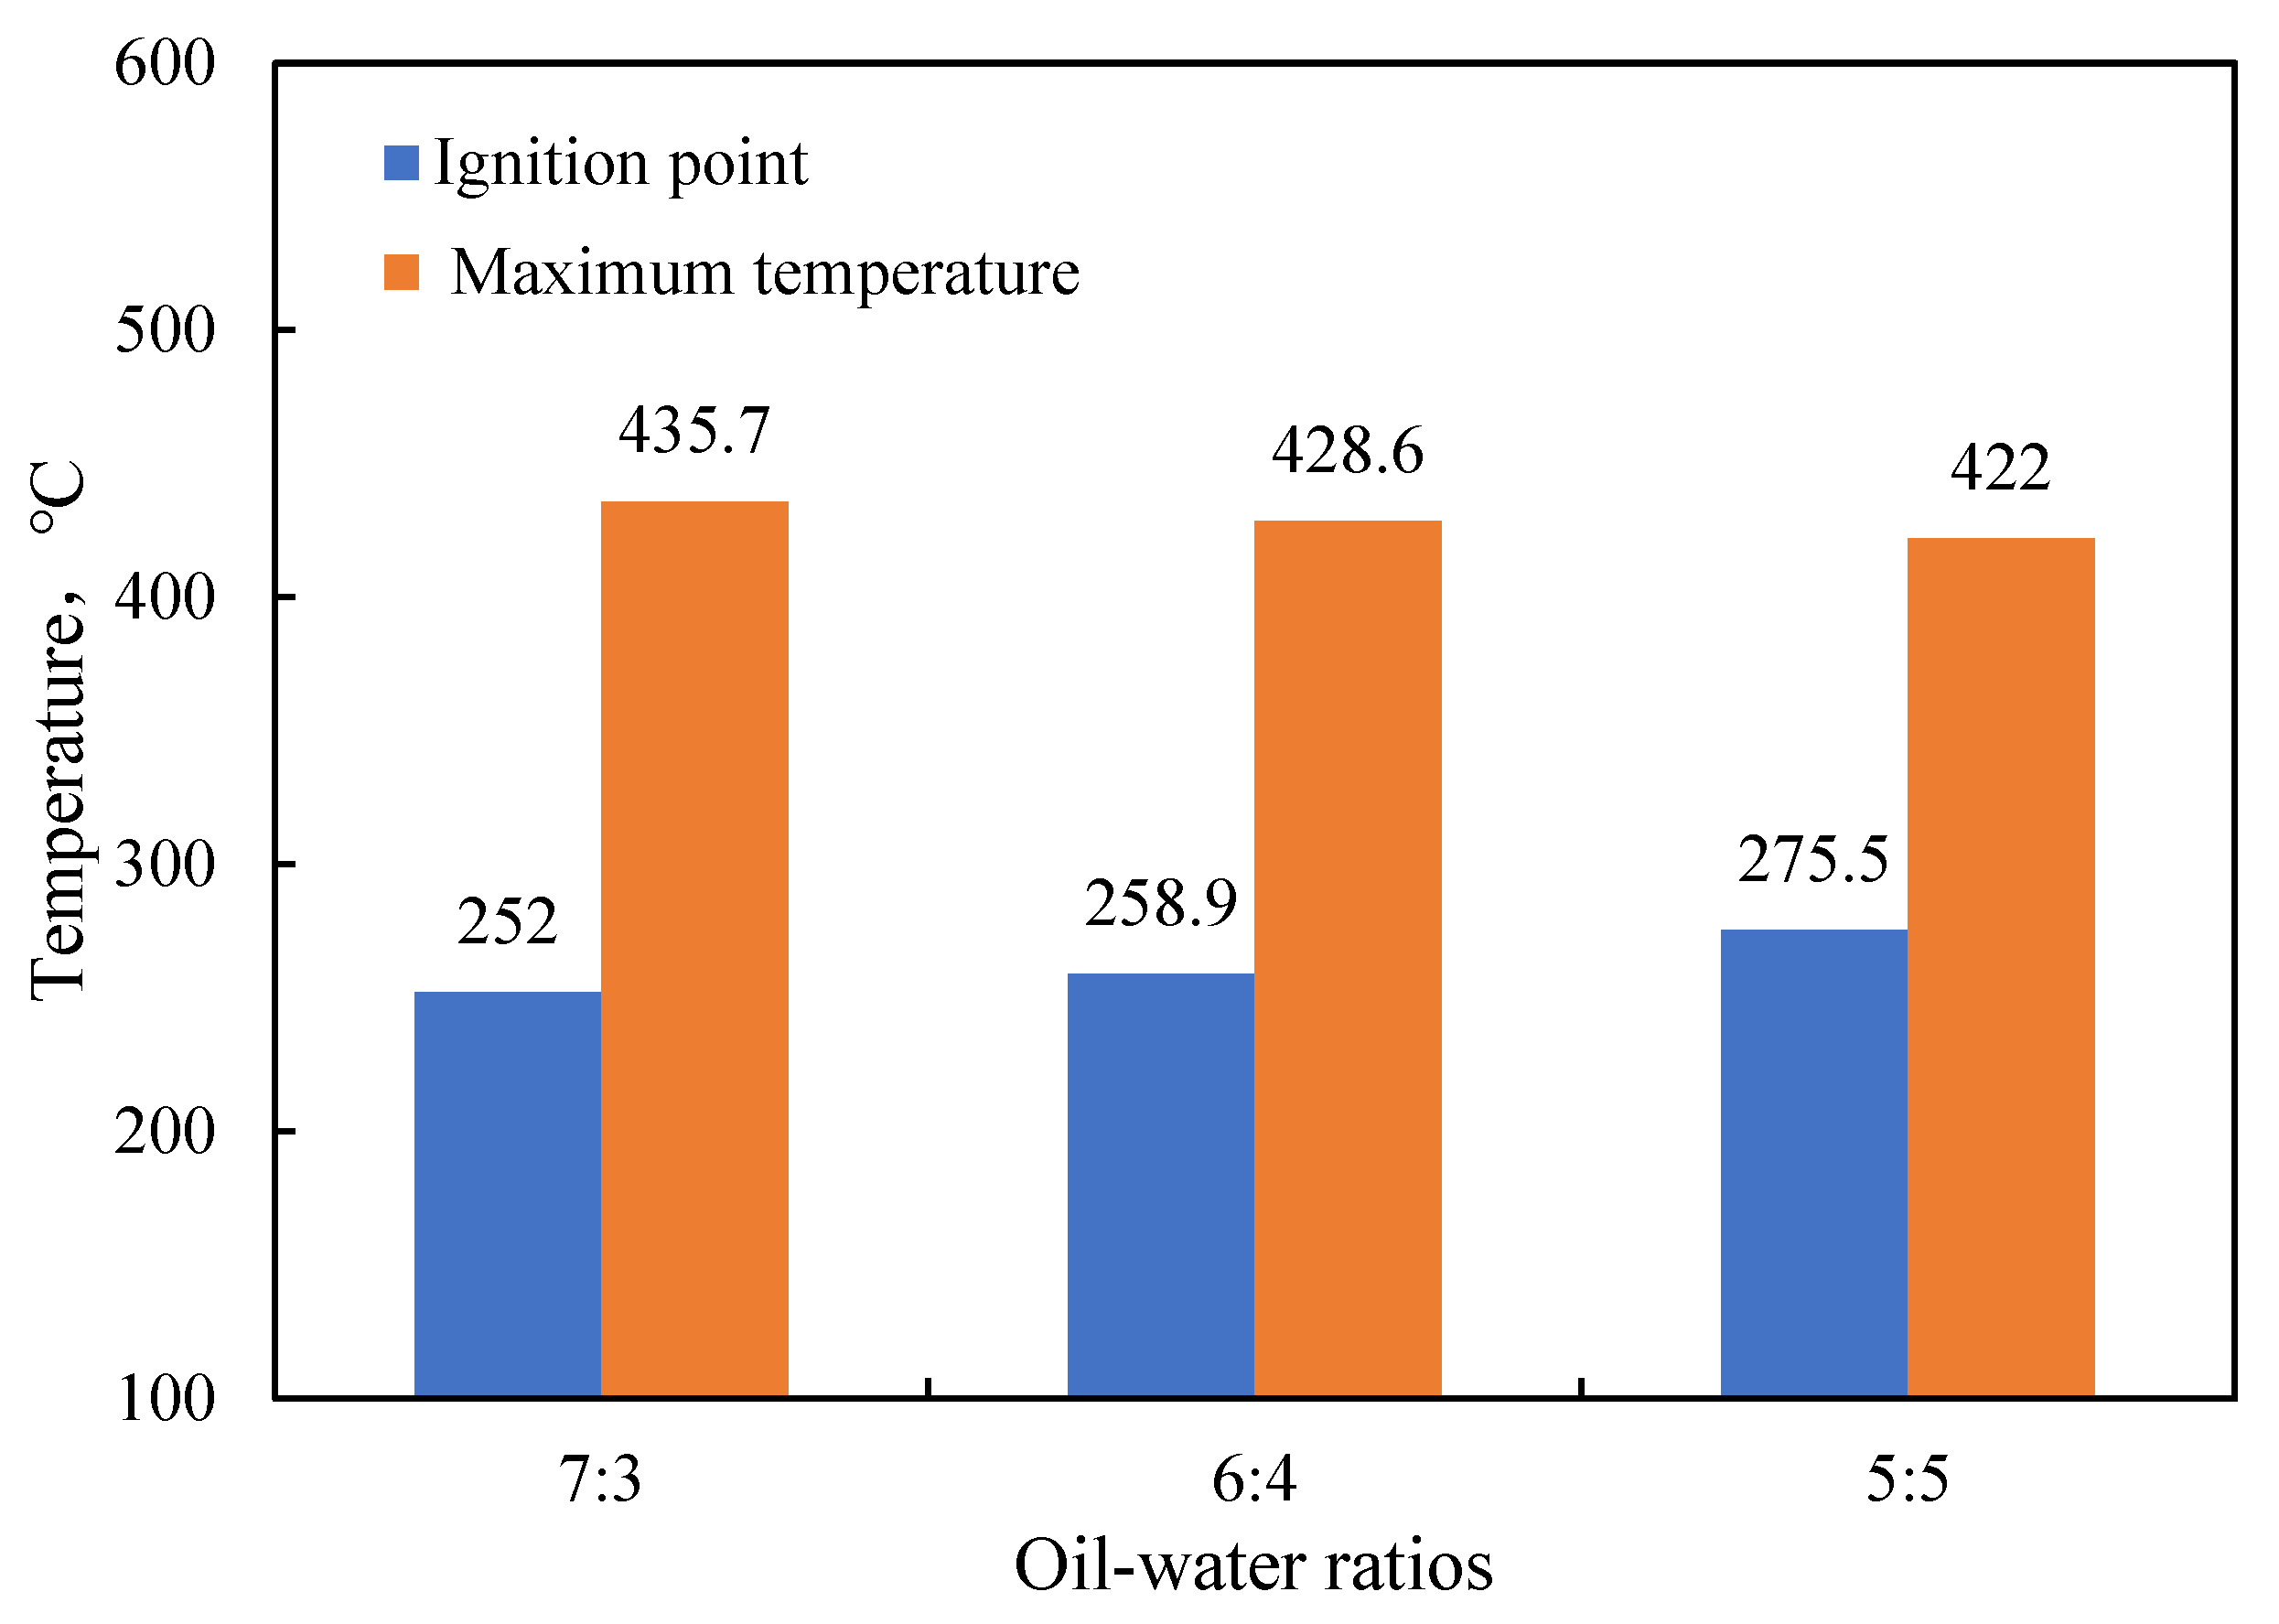
Functional experiments showed that the variation of ln ( l n ( C o C L ) ) with T 1 during the experimental process exhibited a distinct stage bounded by an inflection point. The linearity of the curves improved only when the temperature exceeded a specific inflection point temperature. The apparent activation energies and finger front factors were calculated for the HTO stage under different pressure conditions. The results showed that, as the pressure increased, the auto-ignition point, inflection point temperature, and apparent activation energy of the crude oil decreased. This indicates that increasing the pressure can promote the HTO of the crude oil. The spontaneous ignition point of the crude oil exhibited an upward trend as the heating rate increased. Additionally, the maximum temperature during the combustion process generally rose with the increase in heating rate, reaching a maximum temperature of 453.1 °C.
9.
Using the experimental data obtained from the high-temperature and high-pressure dynamic ignition simulation system, it is possible to calculate the kinetic parameters of crude oil oxidation. This calculation provides essential data support for the implementation of in situ combustion and numerical simulation.

Author Contributions

Conceptualization, Y.Y. and X.Y.; writing—review and editing, X.C.; methodology, C.K. and D.L.; data curation, X.Z.; writing—original draft preparation, Y.Y. and C.C.; investigation, X.L. and L.Z. All authors have read and agreed to the published version of the manuscript.

Funding

The study received funding from the National Science Foundation of China (Grant No. 52004259).

Data Availability Statement

All data used to support the findings of this study are available from the corresponding author on request.

Conflicts of Interest

Authors Yuchuan Yin, Deji Liu, Chao Chen, Xiaosong Zhou, Xiaohui Li, and Lidong Zhang were employed by the Tuha Oilfield Branch Company, PetroChina. The remaining authors declare that the research was conducted in the absence of any commercial or financial relationships that could be construed as a potential conflict of interest.

References

  1. Shah, A.; Fishwick, R.; Wood, J.; Leeke, G.; Rigby, S.; Greaves, M. A review of novel techniques for heavy oil and bitumen extraction and upgrading. Energy Environ. Sci. 2010, 3, 700–714. [Google Scholar] [CrossRef]
  2. Changfeng, X.; Wenlong, G.; Jihong, H. Research and Application of Fire-Flooding Technologies in Post-Steam Injected Heavy Oil Reservoir. In Proceedings of the International Petroleum Technology Conference, Beijing, China, 26–28 March 2013. [Google Scholar]
  3. Hamdy, M.; Mohamed, A.A.; Curran, H. Combination Effect of in-Situ Combustion and Exhaust Gases Recirculation on 1D Combustion Tube: Numerical Approach. Combust. Sci. Technol. 2023, 195, 3296–3309. [Google Scholar] [CrossRef]
  4. Farahani, M.D.; Abdrabou, M.; Zhang, H.; Zhu, J.; Wang, F.; Lee, K.; Zheng, Y. In situ burning of crude oils using iron oxide nanoparticles as additives. Fuel 2022, 330, 125568. [Google Scholar] [CrossRef]
  5. Yang, L.F.; Sheng, J.J. Pyrite effects on the oxidation of in situ crude oil. J. Pet. Sci. Eng. 2022, 209, 109812. [Google Scholar] [CrossRef]
  6. Kok, M.V.; Iscan, A.G. Catalytic effects of metallic additives on the combustion properties of crude oils by thermal analysis techniques. J. Therm. Anal. Calorim. 2001, 64, 1311–1318. [Google Scholar] [CrossRef]
  7. Li, J.; Mehta, S.A.; Moore, R.G.; Ursenbach, M.G. New Insights Into Oxidation Behaviours of Crude Oils. J. Can. Pet. Technol. 2009, 48, 12–15. [Google Scholar] [CrossRef]
  8. Zhao, J.-Z.; Jia, H.; Pu, W.-F.; Wang, L.-L.; Peng, H. Sensitivity Studies on the Oxidation Behavior of Crude Oil in Porous Media. Energy Fuels 2012, 26, 6815–6823. [Google Scholar] [CrossRef]
  9. Gundogar, A.S.; Kok, M.V. Thermal characterization, combustion and kinetics of different origin crude oils. Fuel 2014, 123, 59–65. [Google Scholar] [CrossRef]
  10. Hamedi Shokrlu, Y.; Maham, Y.; Tan, X.; Babadagli, T.; Gray, M. Enhancement of the efficiency of in situ combustion technique for heavy-oil recovery by application of nickel ions. Fuel 2013, 105, 397–407. [Google Scholar] [CrossRef]
  11. Ni, J.; Jia, H.; Pu, W.; Jiang, H.; Yang, J.; Ren, Q. Thermal kinetics study of light oil oxidation using TG/DTG techniques. J. Therm. Anal. Calorim. 2014, 117, 1349–1355. [Google Scholar] [CrossRef]
  12. Khelkhal, M.A.; Eskin, A.A.; Sitnov, S.A.; Vakhin, A.V. Impact of Iron Tallate on the Kinetic Behavior of the Oxidation Process of Heavy Oils. Energy Fuels 2019, 33, 7678–7683. [Google Scholar] [CrossRef]
  13. Jia, H.; Zhao, J.-Z.; Pu, W.-F.; Liao, R.; Wang, L.-L. The Influence of Clay Minerals Types on the Oxidation Thermokinetics of Crude Oil. Energy Sources Part A Recovery Util. Environ. Eff. 2012, 34, 877–886. [Google Scholar] [CrossRef]
  14. Li, J.; Mehta, S.A.; Moore, R.G.; Ursenbach, M.G.; Zalewski, E.; Ferguson, H.; Okazawa, N.E. Oxidation and ignition behaviour of saturated hydrocarbon samples with crude oils using TG/DTG and DTA thermal analysis techniques. J. Can. Pet. Technol. 2004, 43, 45–51. [Google Scholar] [CrossRef]
  15. Li, J.; Mehta, S.A.; Moore, R.G.; Zalewski, E.; Ursenbach, M.G.; Van Fraassen, K. Investigation of the oxidation behaviour of pure hydrocarbon components and crude oils utilizing PDSC thermal technique. J. Can. Pet. Technol. 2006, 45, 48–53. [Google Scholar] [CrossRef]
  16. Jiao, A.; Huang, P.; Qian, X.; Feng, C.; Liu, Z. A chemically assisted ignition mathematical model based on the theory of thermal ignition. Energy Rep. 2022, 8, 1358–1369. [Google Scholar] [CrossRef]
  17. Yuan, C.D.; Sadikov, K.; Varfolomeev, M.; Khaliullin, R.; Pu, W.; Al-Muntaser, A.; Mehrabi-Kalajahi, S.S. Low-temperature combustion behavior of crude oils in porous media under air flow condition for in-situ combustion (ISC) process. Fuel 2020, 259, 116293. [Google Scholar] [CrossRef]
  18. Ren, S.R.; Greaves, M.; Rathbone, R.R. Air injection LTO process: An IOR technique for light-oil reservoirs. SPE J. 2002, 7, 90–99. [Google Scholar] [CrossRef]
  19. Zhao, R.; Chen, Y.X.; Huang, R.P.; Castanier, L.M.; Kovscek, A.R. An experimental investigation of the in-situ combustion behavior of Karamay crude oil. J. Pet. Sci. Eng. 2015, 127, 82–92. [Google Scholar] [CrossRef]
  20. Pu, W.F.; Wang, L.-L.; Peng, X.-Q.; Li, N.; Zhao, S. Effects of aromatics, resins, and asphaltenes on oxidation behavior and kinetics of heavy crude oil. Pet. Sci. Technol. 2020, 38, 815–822. [Google Scholar] [CrossRef]
  21. Yang, M.; Liu, Y.S.; Lu, N.; Chai, M.J.; Wang, S.; Feng, Q.H.; Chen, Z.X. Integration of ramped temperature oxidation and combustion tube tests for kinetic modeling of heavy oil in-Situ combustion. Energy 2023, 274, 127435. [Google Scholar] [CrossRef]
  22. Abu, I.I.; Moore, R.G.; Mehta, S.A.; Ursenbach, M.G.; Mallory, D.G.; Almao, P.P.; Ortega, L.C. Upgrading of Athabasca Bitumen Using Supported Catalyst in Conjunction With In-Situ Combustion. J. Can. Pet. Technol. 2015, 54, 220–232. [Google Scholar] [CrossRef]
  23. Zhao, S.; Pu, W.; Varfolomeev, M.A.; Yuan, C.; Mehrabi-Kalajahi, S.S.; Saifullin, E.R.; Sadikov, K.; Talipov, S. Low-temperature combustion characteristics of heavy oils by a self-designed porous medium thermo-effect cell. J. Pet. Sci. Eng. 2020, 195, 107863. [Google Scholar] [CrossRef]
  24. Shouman, A.R. A review of one aspect of the thermal-explosion theory. J. Eng. Math. 2006, 56, 179–184. [Google Scholar] [CrossRef]
  25. Niu, B.L.; Ren, S.; Liu, Y.; Wang, D.; Tang, L.; Chen, B. Low-Temperature Oxidation of Oil Components in an Air Injection Process for Improved Oil Recovery. Energy Fuels 2011, 25, 4299–4304. [Google Scholar] [CrossRef]
  26. Ambalae, A.; Mahinpey, N.; Freitag, N. Thermogravimetric studies on pyrolysis and combustion behavior of a heavy oil and its asphaltenes. Energy Fuels 2006, 20, 560–565. [Google Scholar] [CrossRef]
  27. Fadaei, H.; Castanier, L.; Camp, A.M.M.; Debenest, G.; Quintard, M.; Renard, G. Experimental and Numerical Analysis of In-Situ Combustion in a Fractured Core. SPE J. 2011, 16, 358–373. [Google Scholar] [CrossRef]
  28. Kuppe, G.J.M.; Mehta, S.A.; Moore, R.G.; Ursenbach, M.G.; Zalewski, E. Heats of combustion of selected crude oils and their SARA fractions. J. Can. Pet. Technol. 2008, 47, 38–42. [Google Scholar] [CrossRef]
  29. Clara, C.; Durandeau, M.; Quenault, G.; Nguyen, T.-H. Laboratory studies for light-oil air injection projects: Potential application in Handil field. SPE Reserv. Eval. Eng. 2000, 3, 239–248. [Google Scholar] [CrossRef]
Figure 1. Schematic diagram of high-temperature and high-pressure dynamic ignition simulation device. Note: 1—Pressure regulating valve; 2—Pressure gauge; 3—Filter; 4—Dryer; 5—Mass flow controller; 6—Check valve; 7—Internal thermocouple in core; 8—External thermocouple; 9—Temperature-control thermocouple; 10—Back-pressure control valve; 11—Gas–liquid separator; 12—Online exhaust monitoring system; 13—Wash gas cylinder; 14—Nitrogen cylinder; 15—Oxygen cylinder; 16—Liquid injector; 17—Intermediate vessel; 18—Back-pressure controller; 19—Pressure relief valve.
Processes 12 00052 g001
Figure 2. Combustion tube structure.
Processes 12 00052 g002
Figure 3. Block diagram of temperature control design.
Processes 12 00052 g003
Figure 4. Relationship curve between temperature difference and heating rate.
Processes 12 00052 g004
Figure 5. Curve of core temperature and oxygen consumption rate in ignition experiment.
Processes 12 00052 g005
Figure 6. Spontaneous ignition point and maximum temperature of crude oil at different heating rates.
Processes 12 00052 g006
Figure 7. Spontaneous ignition point and maximum temperature of crude oil at different pressures.
Processes 12 00052 g007
Figure 8. Spontaneous ignition point and maximum temperature of crude oil at different gas injection rates.
Processes 12 00052 g008
Figure 9. Spontaneous ignition point and maximum temperature of crude oil at different oil–water ratios.
Processes 12 00052 g009
Figure 10. Variation curve of ln ( l n ( C o C L ) ) with T 1 at different pressures. (a) 1 MPa. (b) 2 MPa. (c) 4 MPa.
Processes 12 00052 g010aProcesses 12 00052 g010b
Figure 11. Variation curve of ln ( l n ( C o C L ) ) with T 1 at different gas injection rates. (a) 200 mL/min. (b) 400 mL/min.
Processes 12 00052 g011
Figure 12. Variation of ln ( l n ( C o C L ) ) with T 1 at different oil–water ratios. (a) oil-water ratios 6:4. (b) oil-water ratios 7:3.
Processes 12 00052 g012aProcesses 12 00052 g012b
Figure 13. Variation curves of ln ( l n ( C o C L ) ) with T 1 at different heating rates. (a) heating rates 1 °C/min. (b) heating rates 2 °C/min. (c) heating rates 6 °C/min.
Processes 12 00052 g013aProcesses 12 00052 g013b
Table 1. Gas sensor measurement parameters.
GasesMeasuring RangeResolution
CH4(0–100)% LEL1% LEL
O2(0–30.0)% LEL0.1% LEL
H2S(0–100) PPM1 PPM
CO(0–1000) PPM1 PPM
CO2(0–30.0)% LEL0.1% LEL
H2(0–100)% LEL1% LEL
N2(0–100)% LEL1%LEL
Table 2. Oil properties.
Oil PropertiesValue
API gravity (°)41.1
Viscosity (mPa⋅s) 50 °C0.74
SARA fractions (%)Saturates84.35
Aromatics11.31
Resins4.09
Asphaltenes0.25
Table 3. Experimental parameter table.
Serial NumberExperimental SampleOil–Water RatioSample Quality
g
Heating Rates °C/minGas Injection Rate mL/minGas Injection Pressure
MPa
1light crude oil7:35.843001
22
34
4light crude oil7:35.842004
5400
6light crude oil6:4543004
75:54.1
8light crude oil7:35.813004
92
106
Table 4. Calculated oxidation kinetic parameters at various pressures.
NumberFitted Linear SlopeFitted Linear InterceptCorrelation CoefficientInflection Temperature (°C)Apparent
Activation Energy
(kJ·mol−1)
Prefactor
(s−1)
Pressures
(MPa)
1−3.2123.5870.98126726.708.411
2−2.6434.2900.95325321.9716.992
3−0.9630.0090.9372348.010.234
Table 5. Calculated results of oxidation kinetic parameters at various gas injection rates.
NumberFitted Linear SlopeFitted Linear InterceptCorrelation CoefficientInflection Temperature
(°C)
Apparent Activation Energy
(kJ·mol−1)
Prefactor
(s−1)
Gas Injection Rate
(mL/min)
4−1.5780.8250.76833313.120.53200
3−0.9630.0090.9372348.010.23300
5−1.2831.3980.81914010.670.94400
Table 6. Calculated results of oxidation kinetic parameters at various oil–water ratios.
NumberFitted Linear SlopeFitted Linear InterceptCorrelation CoefficientInflection Temperature
(°C)
Apparent Activation Energy
(kJ·mol−1)
Prefactor
(s−1)
Oil–Water Ratio
6−2.4382.2940.98525320.272.316:4
7−4.1185.0250.99826034.2435.475:5
3−0.9630.0090.9372348.010.237:3
Table 7. Calculated results of oxidation kinetic parameters at various heating rates.
NumberFitted Linear SlopeFitted Linear InterceptCorrelation CoefficientInflection Temperature
(°C)
Apparent Activation Energy
(kJ·mol−1)
Prefactor
(s−1)
Heating Rates
8−3.0014.7480.93420924.9626.881
9−2.0362.1470.92221716.931.992
10−1.1370.1440.7162589.450.396
3−0.9630.0090.9372348.010.234
Disclaimer/Publisher’s Note: The statements, opinions and data contained in all publications are solely those of the individual author(s) and contributor(s) and not of MDPI and/or the editor(s). MDPI and/or the editor(s) disclaim responsibility for any injury to people or property resulting from any ideas, methods, instructions or products referred to in the content.

