
PADDME—Process Analysis for Digital Development in Mechanical Engineering


Abstract

1. Introduction
- 1.
- How can a method for process analysis in product development be designed to facilitate cost-effective process optimisation for digital engineering?
- 2.
- In what way can a technology’s readiness level for digital engineering methods be measured based on a process analysis?
2. Materials and Methods
2.1. Digital Engineering
2.2. Design Process Management
Product Development Characteristics
- Design processes are highly dynamic and creative [63].
- Changing product requirements or boundary conditions [64].
- Every design process differs, since a unique product, not existing at the beginning, is designed [66].
- The process is highly problem-driven and generates new knowledge [67].
- Shared information is not taken into account [3].
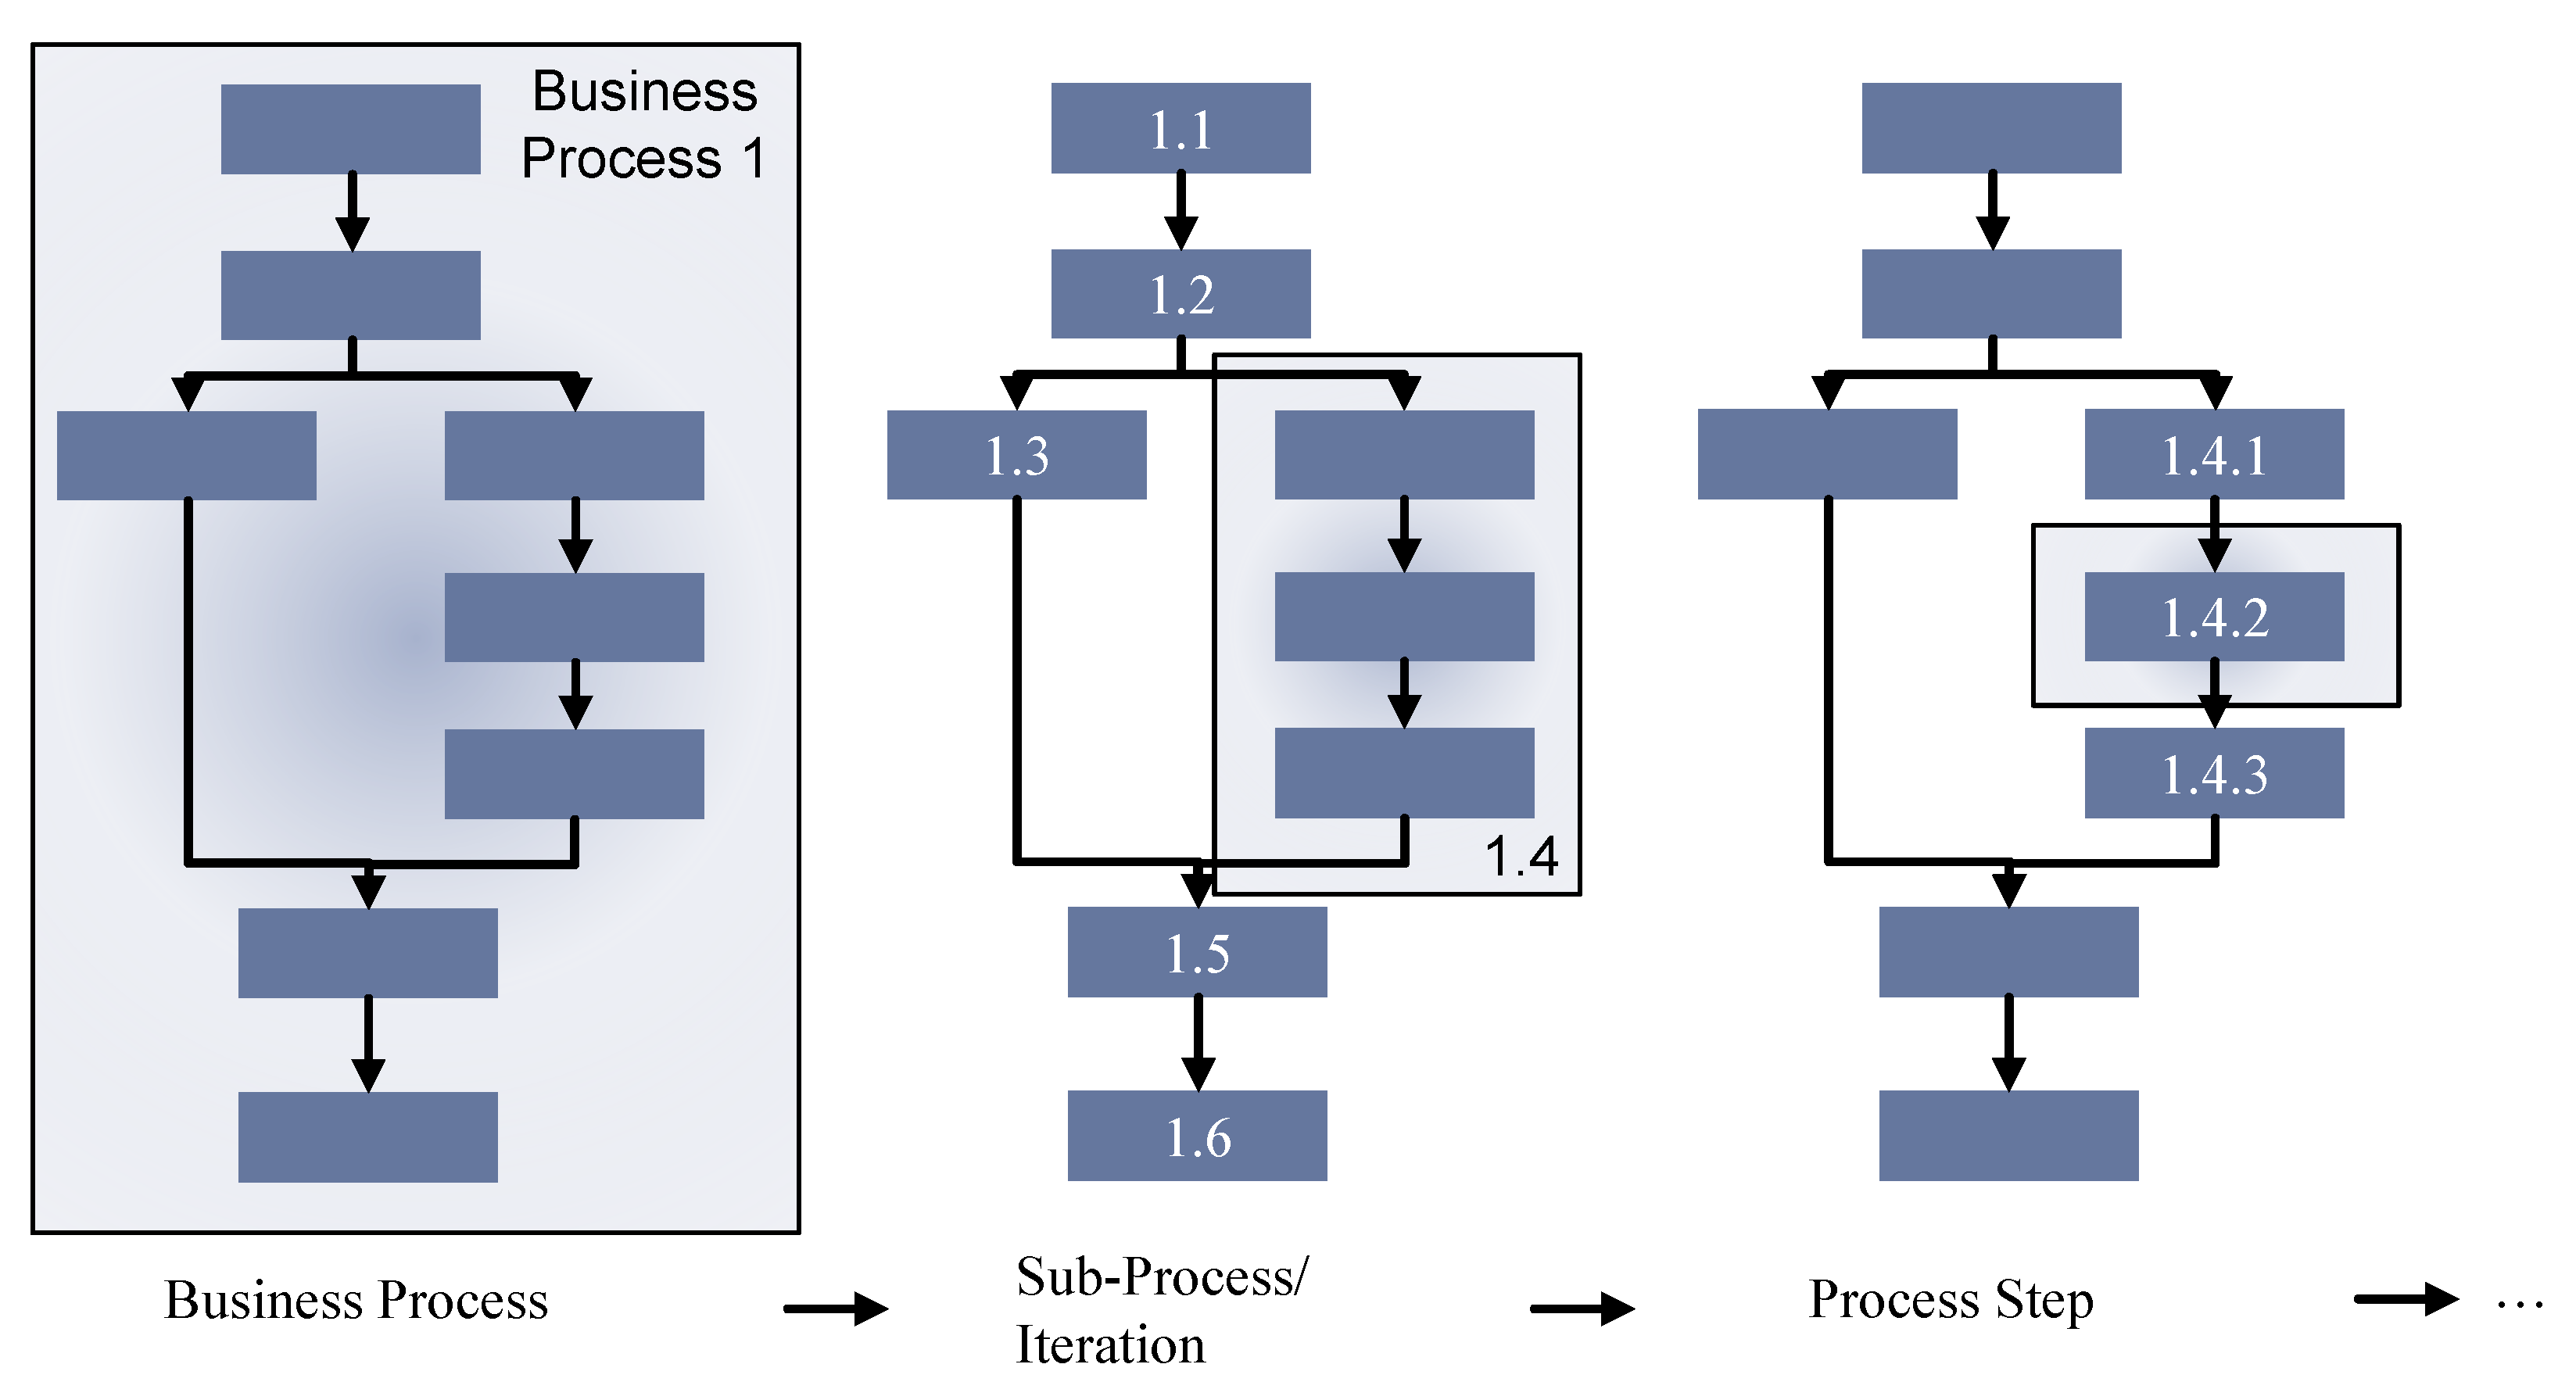
3. Purpose and Scope
4. Methodological Approach
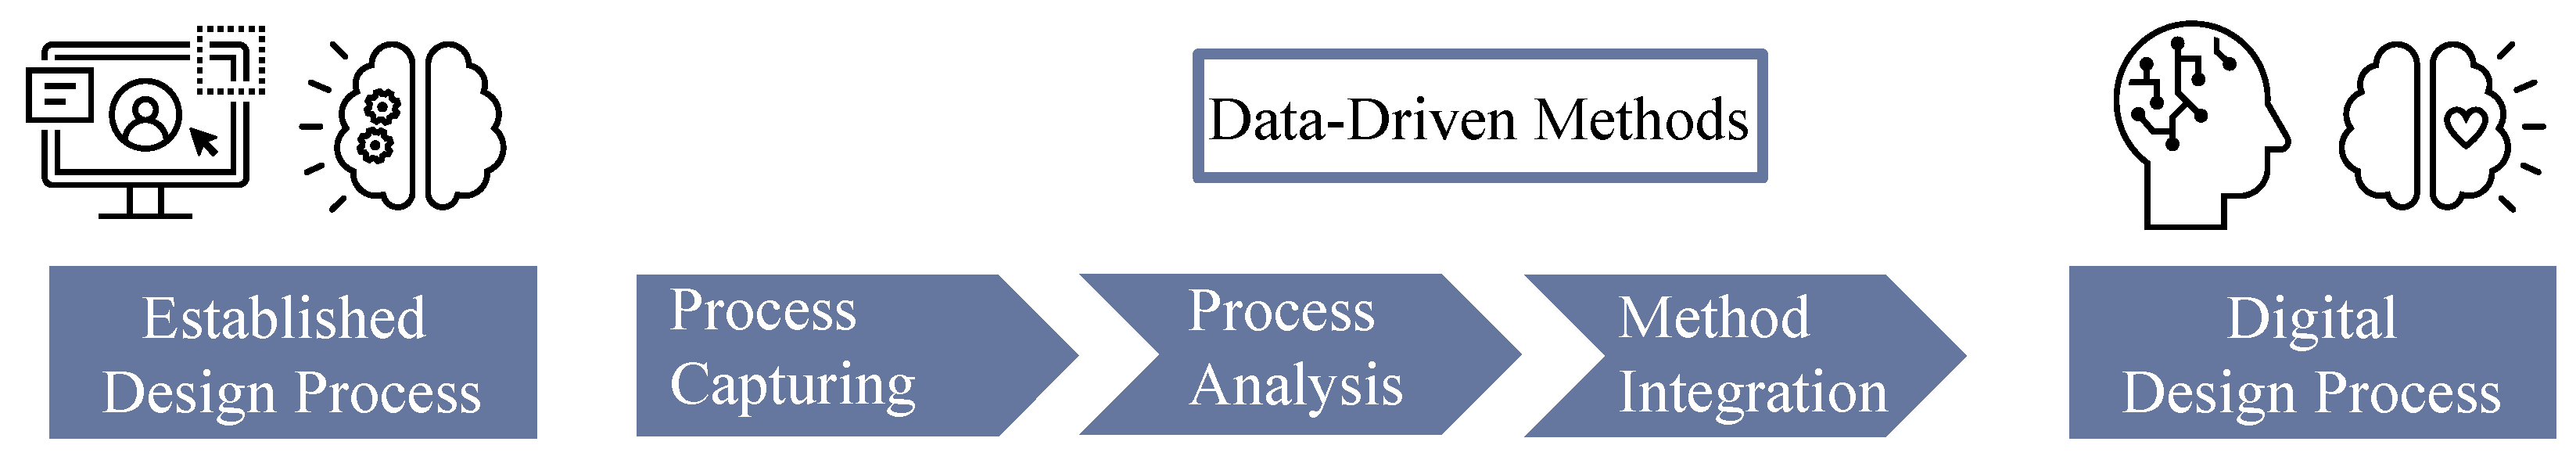
4.1. Use Case: Integrating Data-Driven Methods into Product Development Processes
4.2. Requirements for Process Analysis in Design Departments of Small and Medium Enterprises
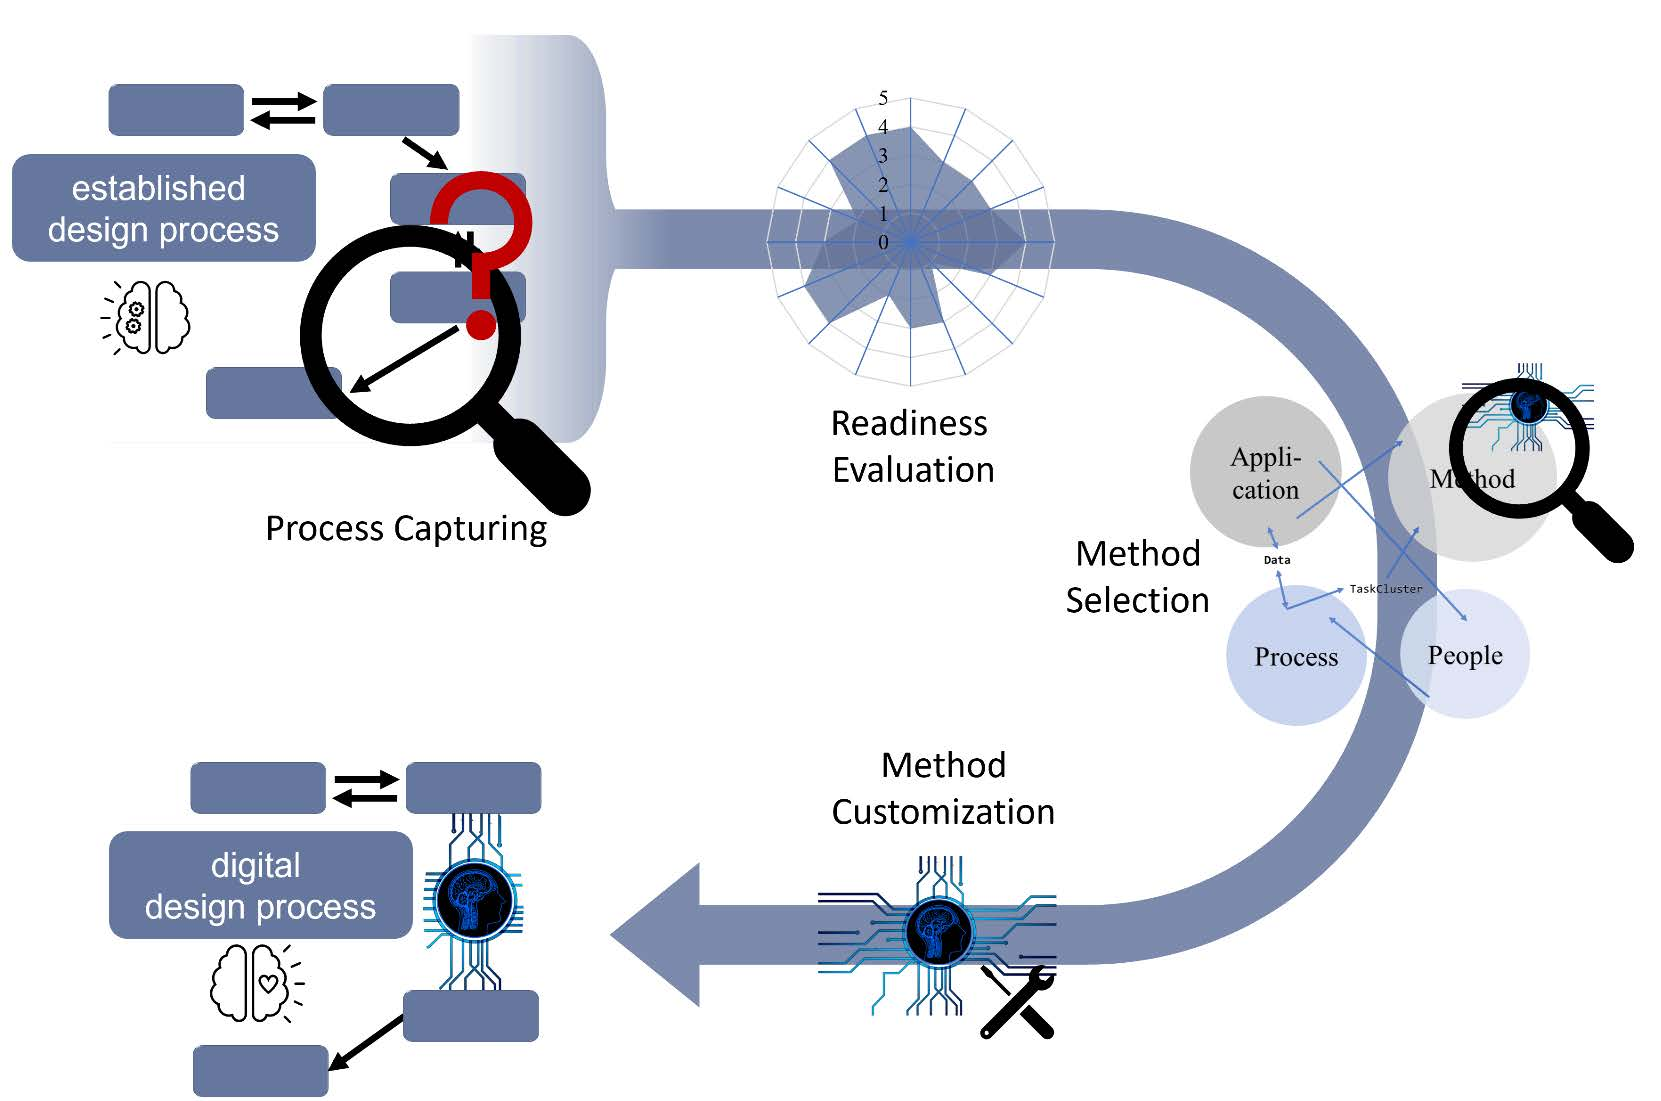
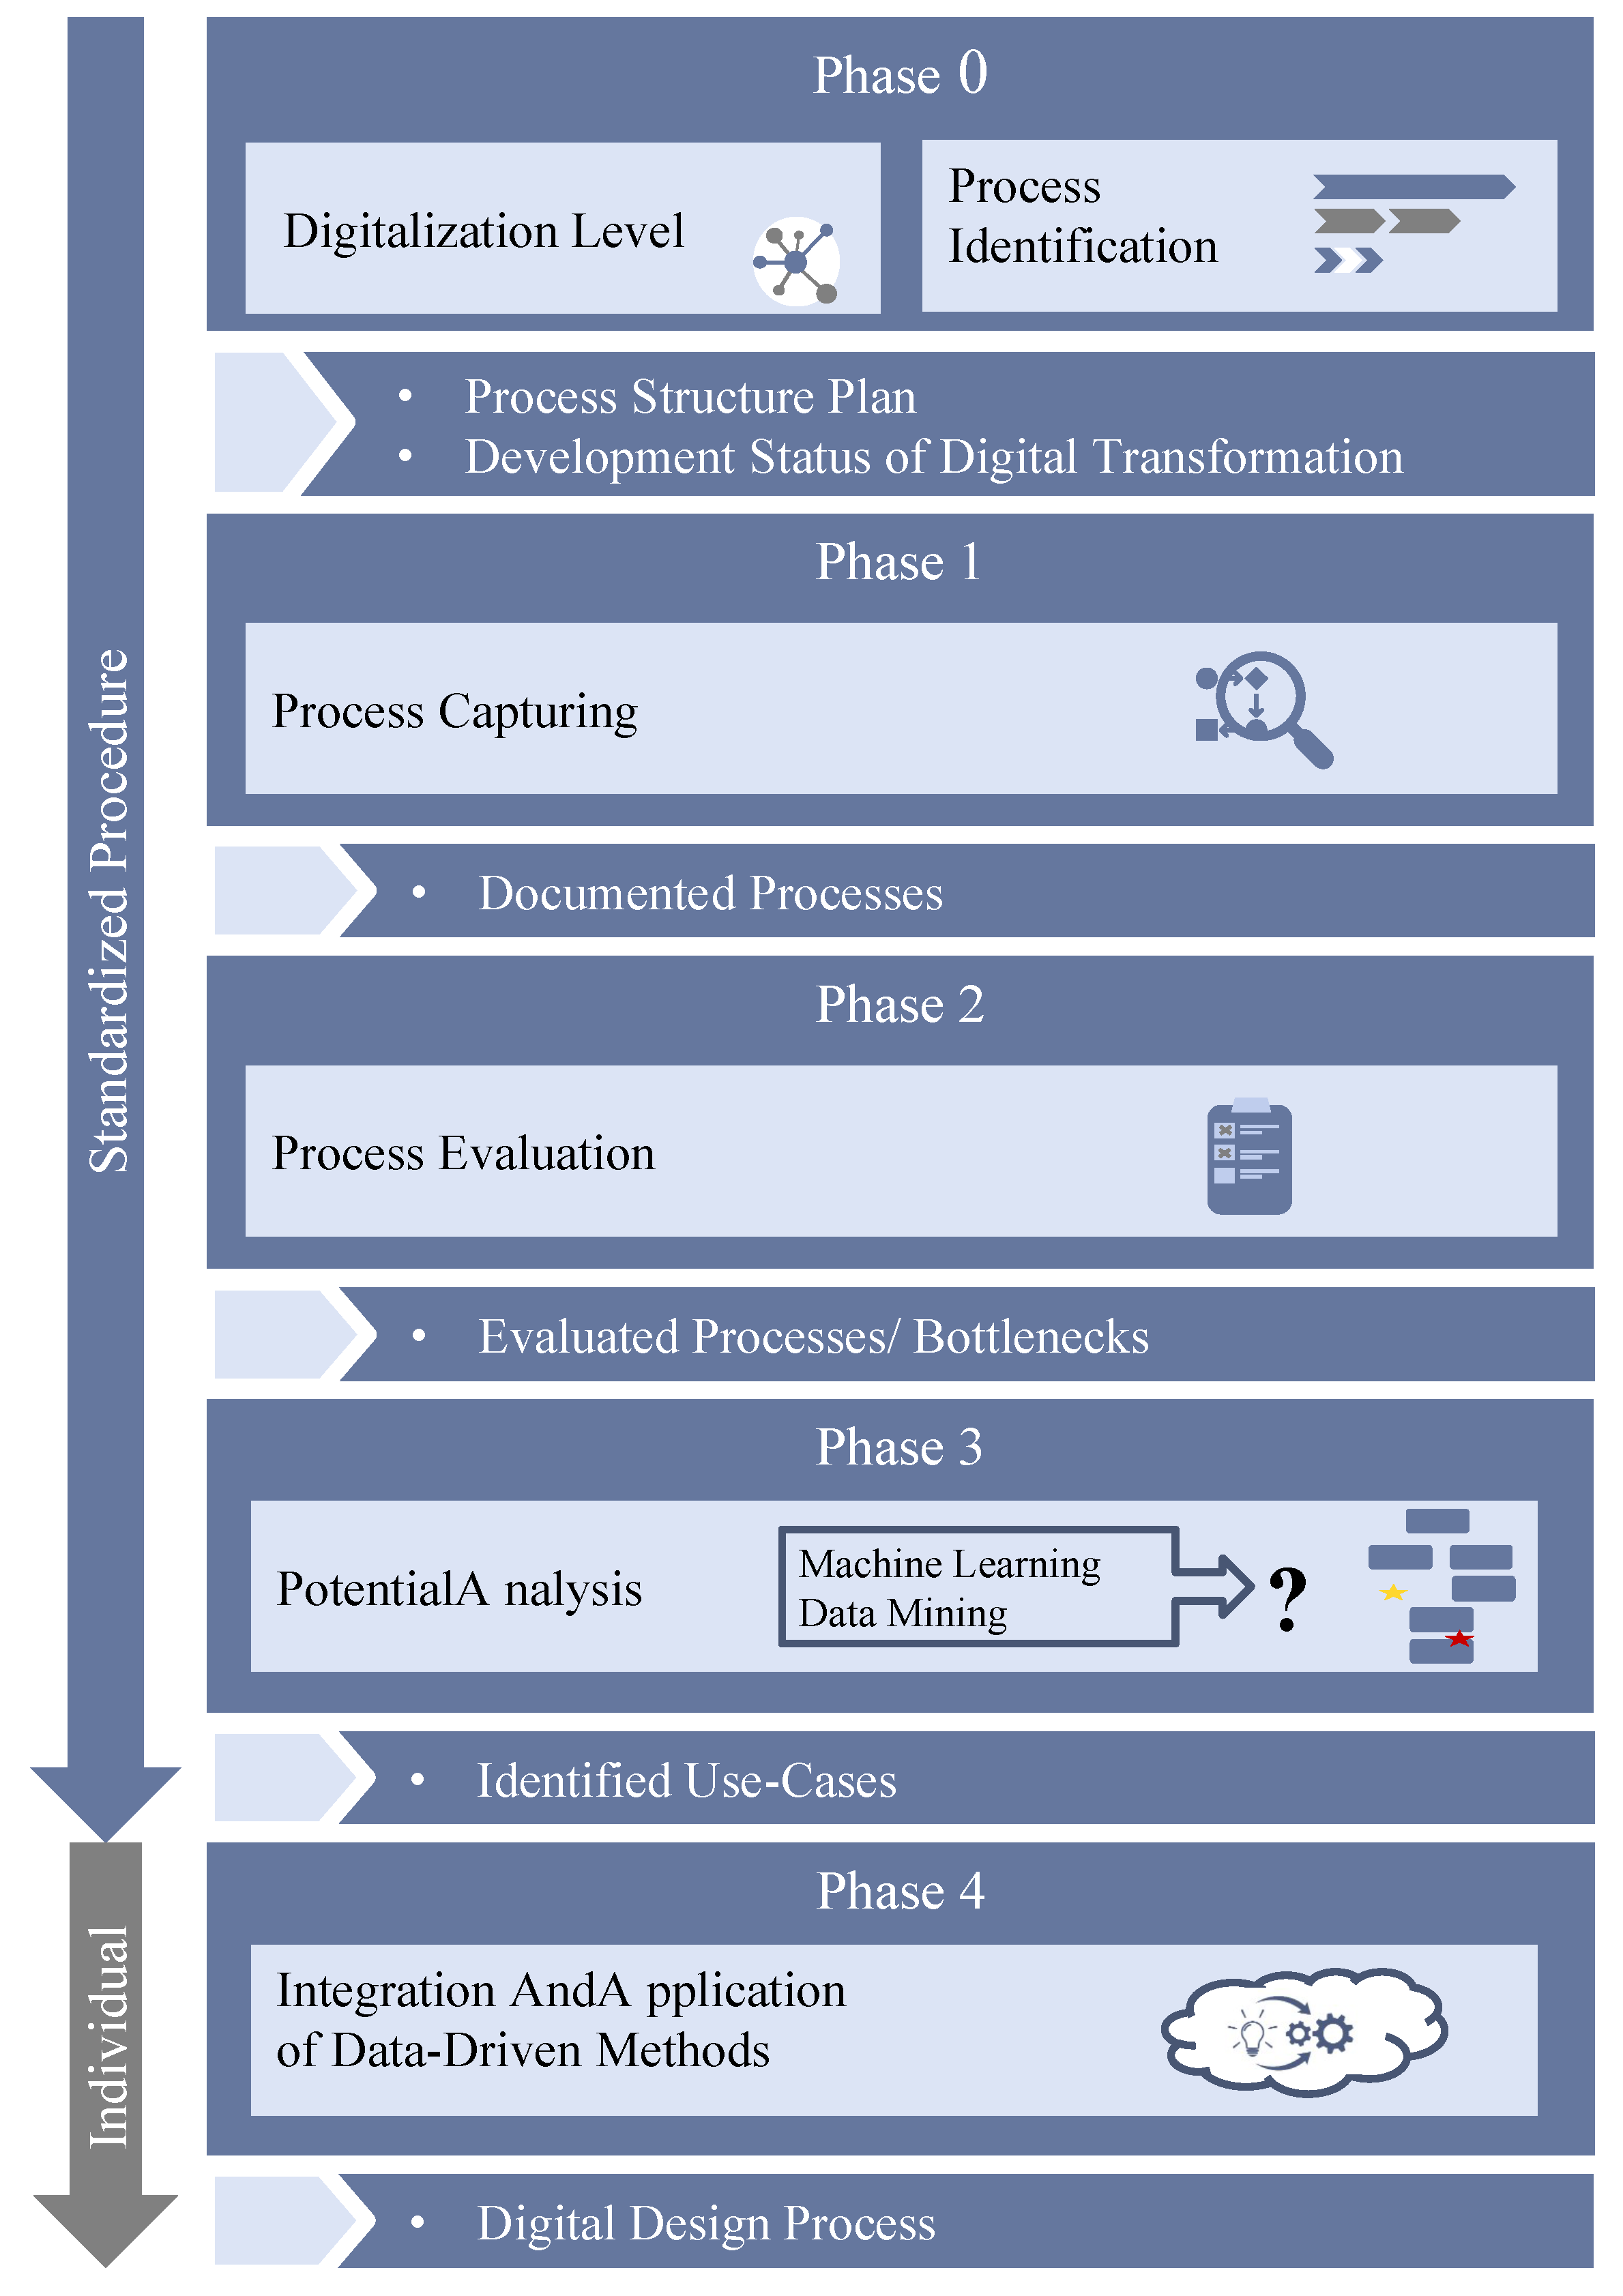
4.3. Analysis Method—PADDME
- 0.
- Preparation;
- 1.
- Process capturing;
- 2.
- Process evaluation;
- 3.
- Potential analysis;
- 4.
- Process redesign and integration of data-driven methods.
4.3.1. Phase 0: Preparation
Goal and Results
Methods
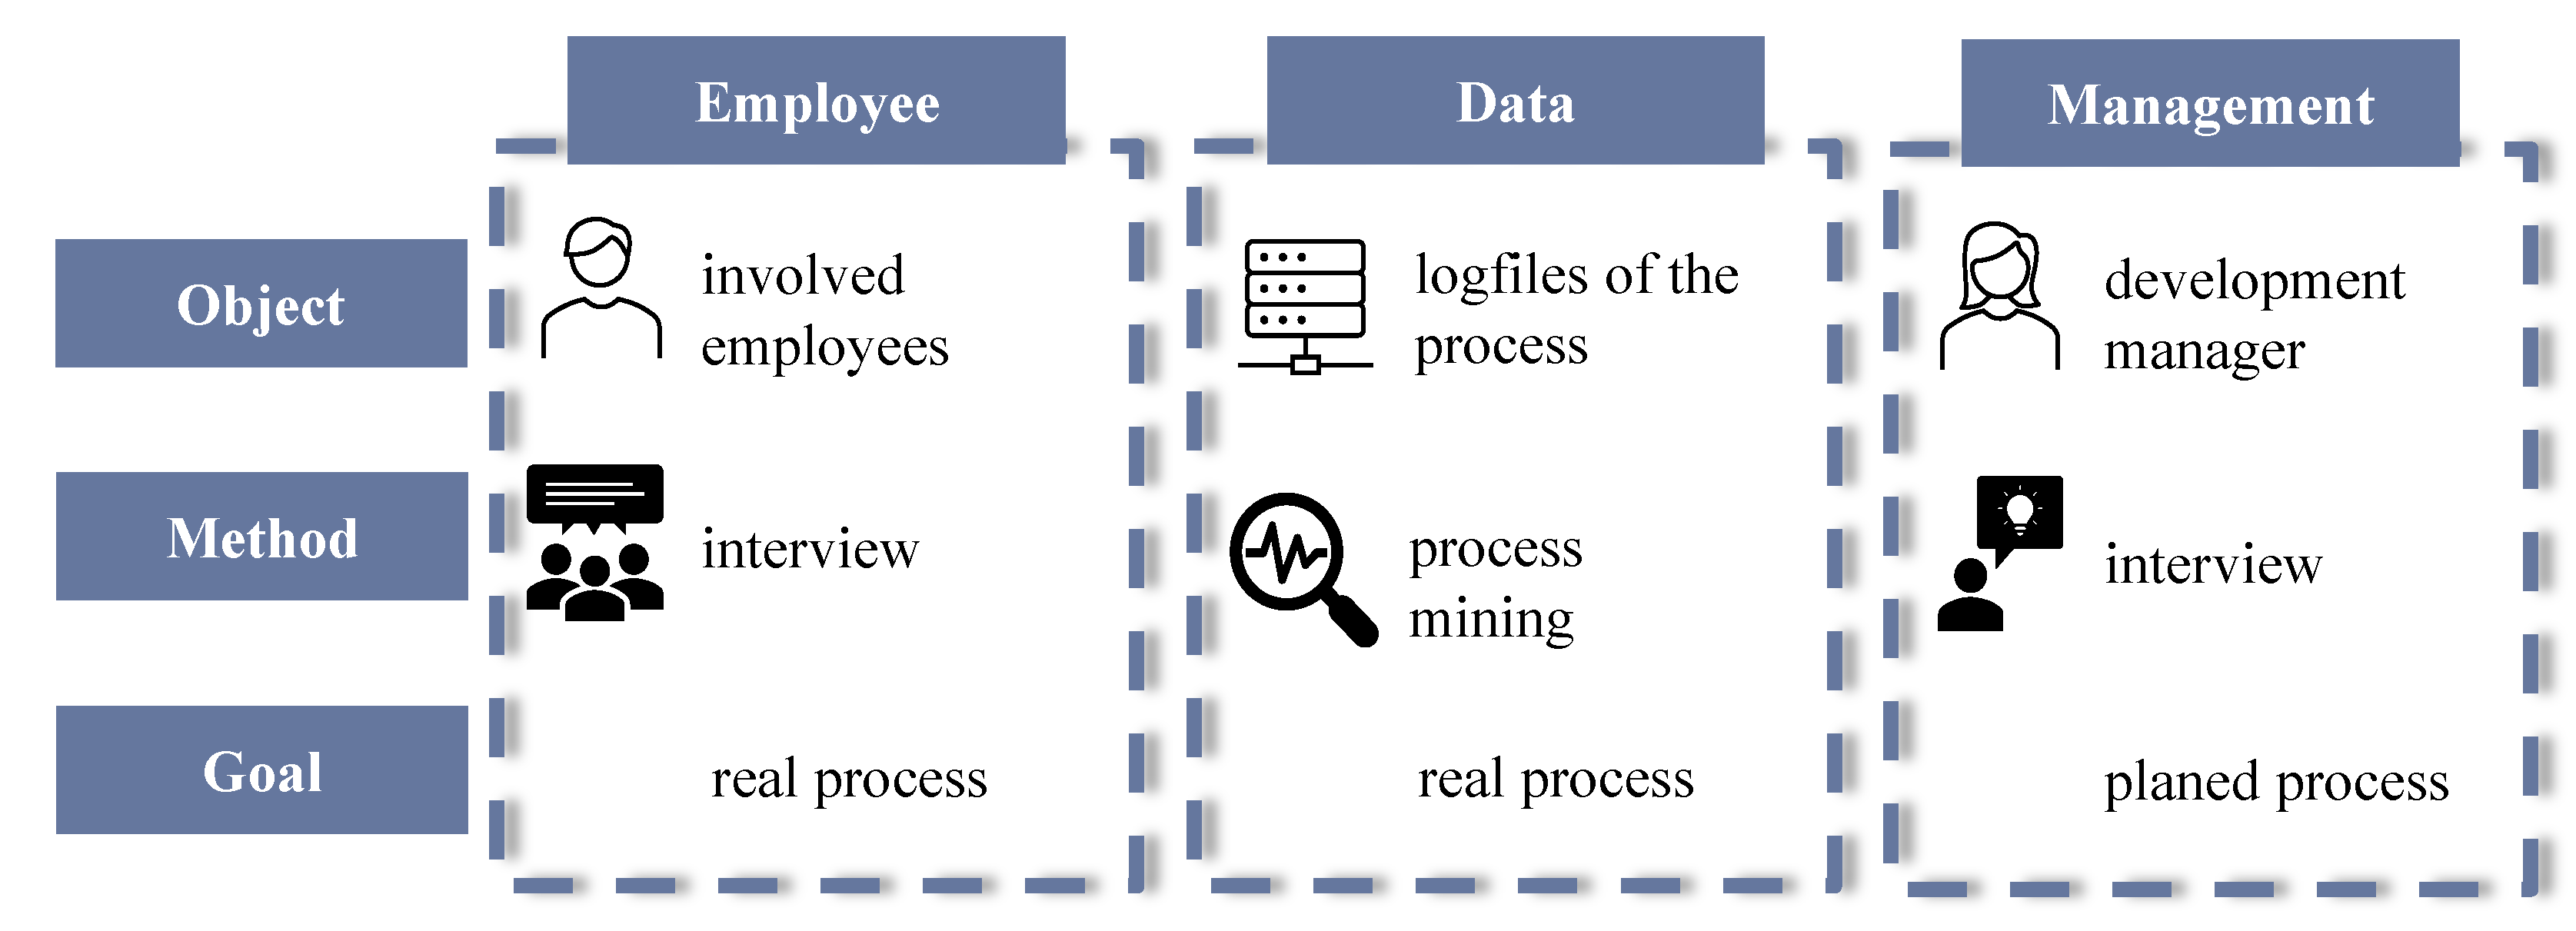
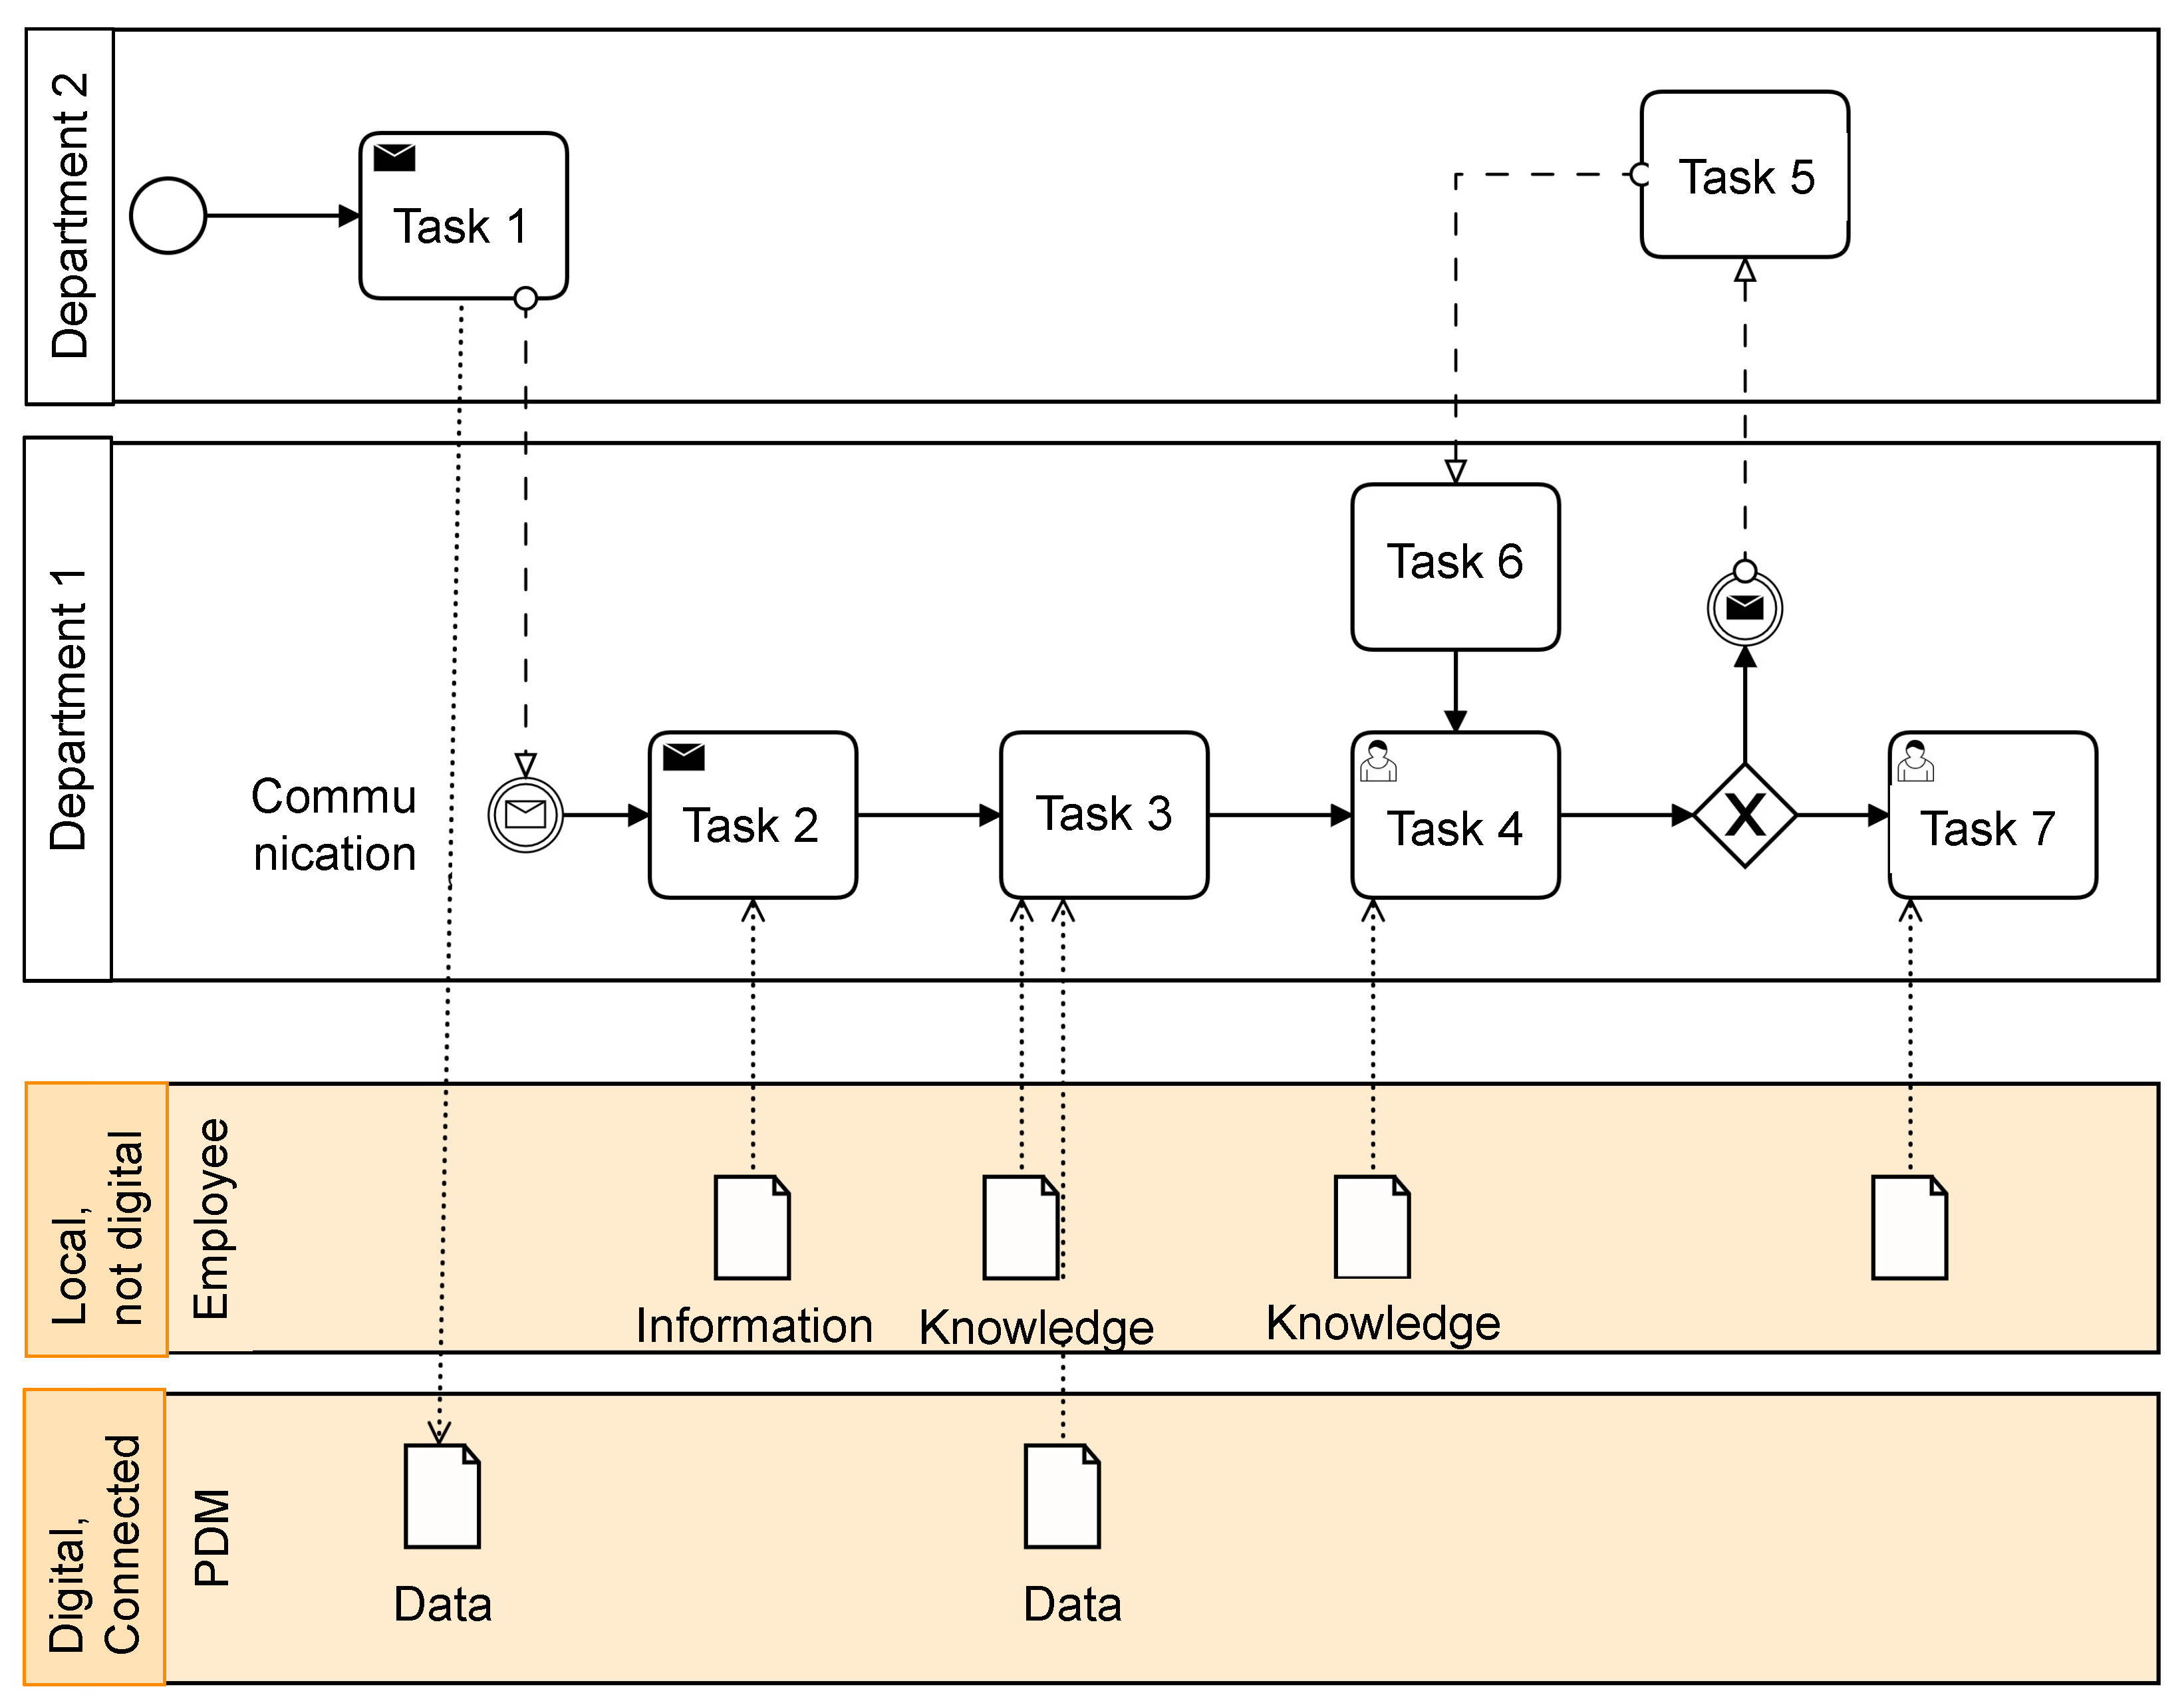
4.3.2. Phase 1: Process Capturing
Goal and Results
Methods
Tools
- In communication tasks, the medium of the messages can be set (e.g., e-mail, paper, or by voice).
- In normal tasks, the used programs and tools are added to the context menu.
- Approvals have also been realised by adapting the existing task template using custom fields for sender, receiver, and approval information.
- The data and information fragments are extended by the data format and version. If a task has the same input and output file, the version is incremented.
Intermediate Summary
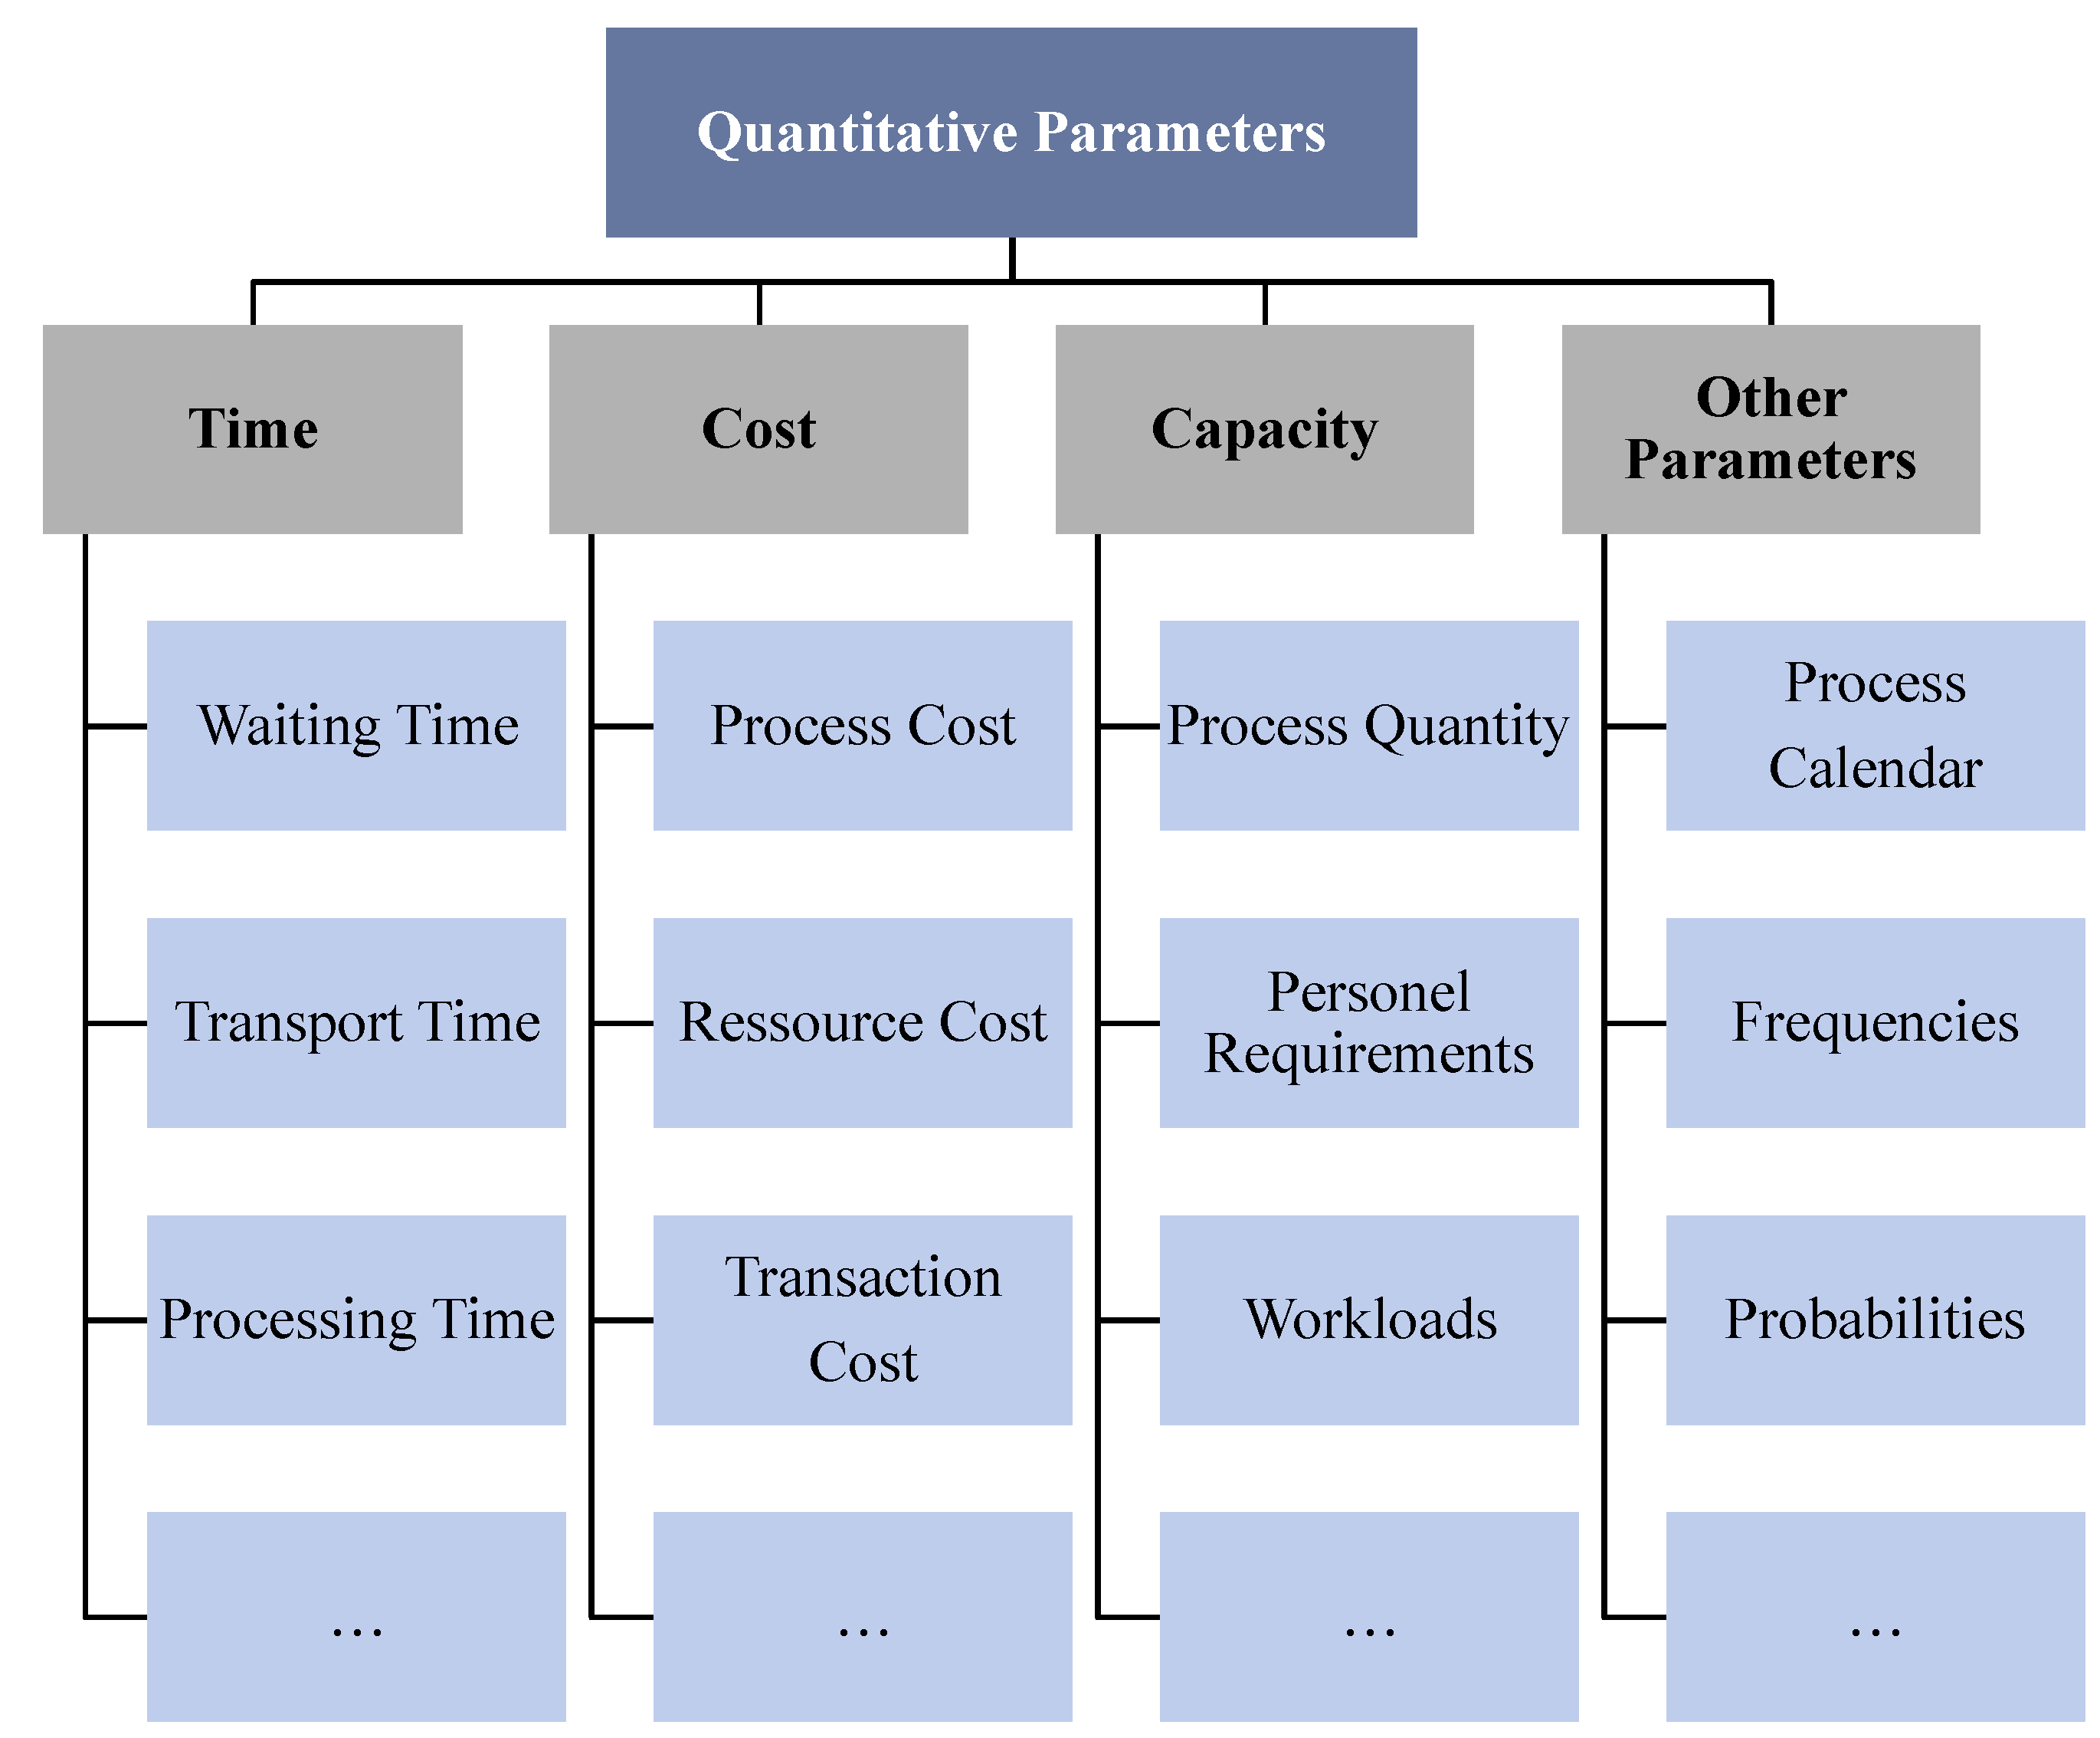
4.3.3. Phase 2: Process Evaluation
Goal and Results
Methods
- accrual of services, e.g., changing responsibility;
- defined output of a sub-process;
- distinct requirement profile or client–contractor relationship;
- defined individual-provided resources;
- autonomy with respect to subsequent units;
- performance goals for specified sub-processes.
Intermediate Summary
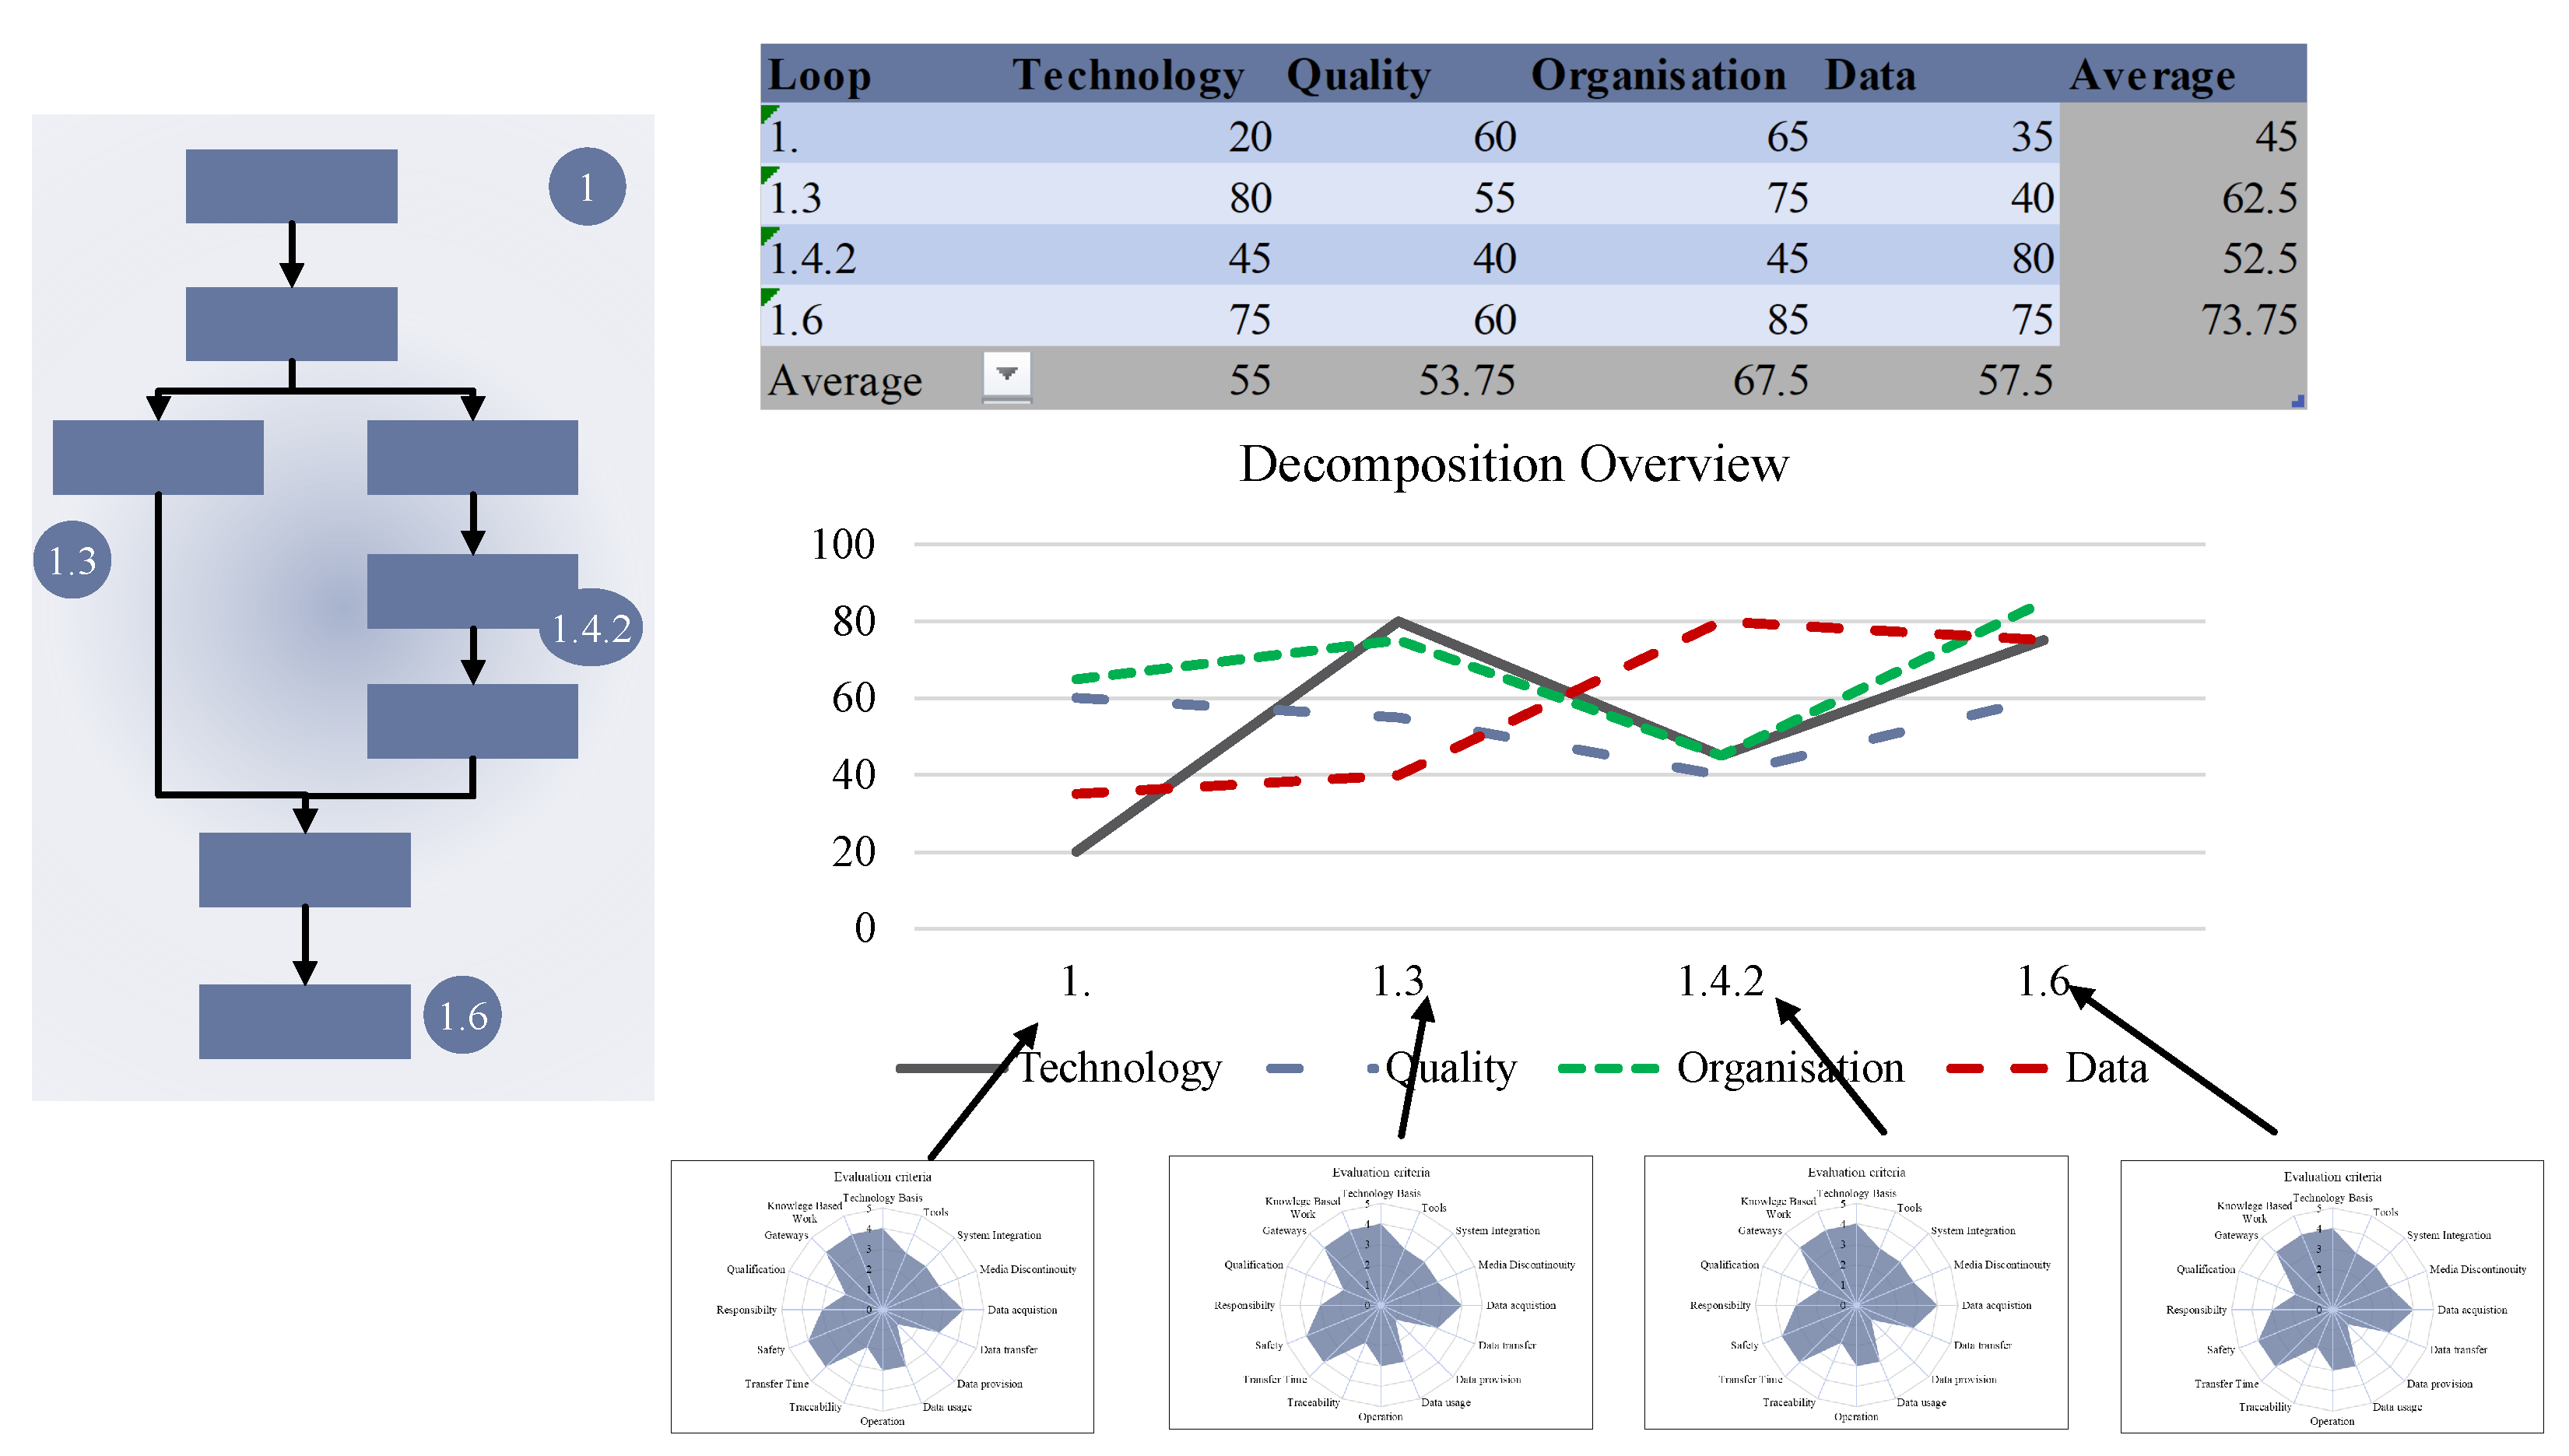
4.3.4. Phase 3: Potential Analysis
Goal and Results
Methods
- 1.
- Prediction of different values;
- 2.
- Identification of interrelationships and contexts;
- 3.
- Use of old data as a basis for new product generations;
- 4.
- Support for decisions.
Intermediate Summary
4.3.5. Phase 4: Process Redesign and Integration of Data-Driven Methods
Goal and Results
Methods
Intermediate Summary
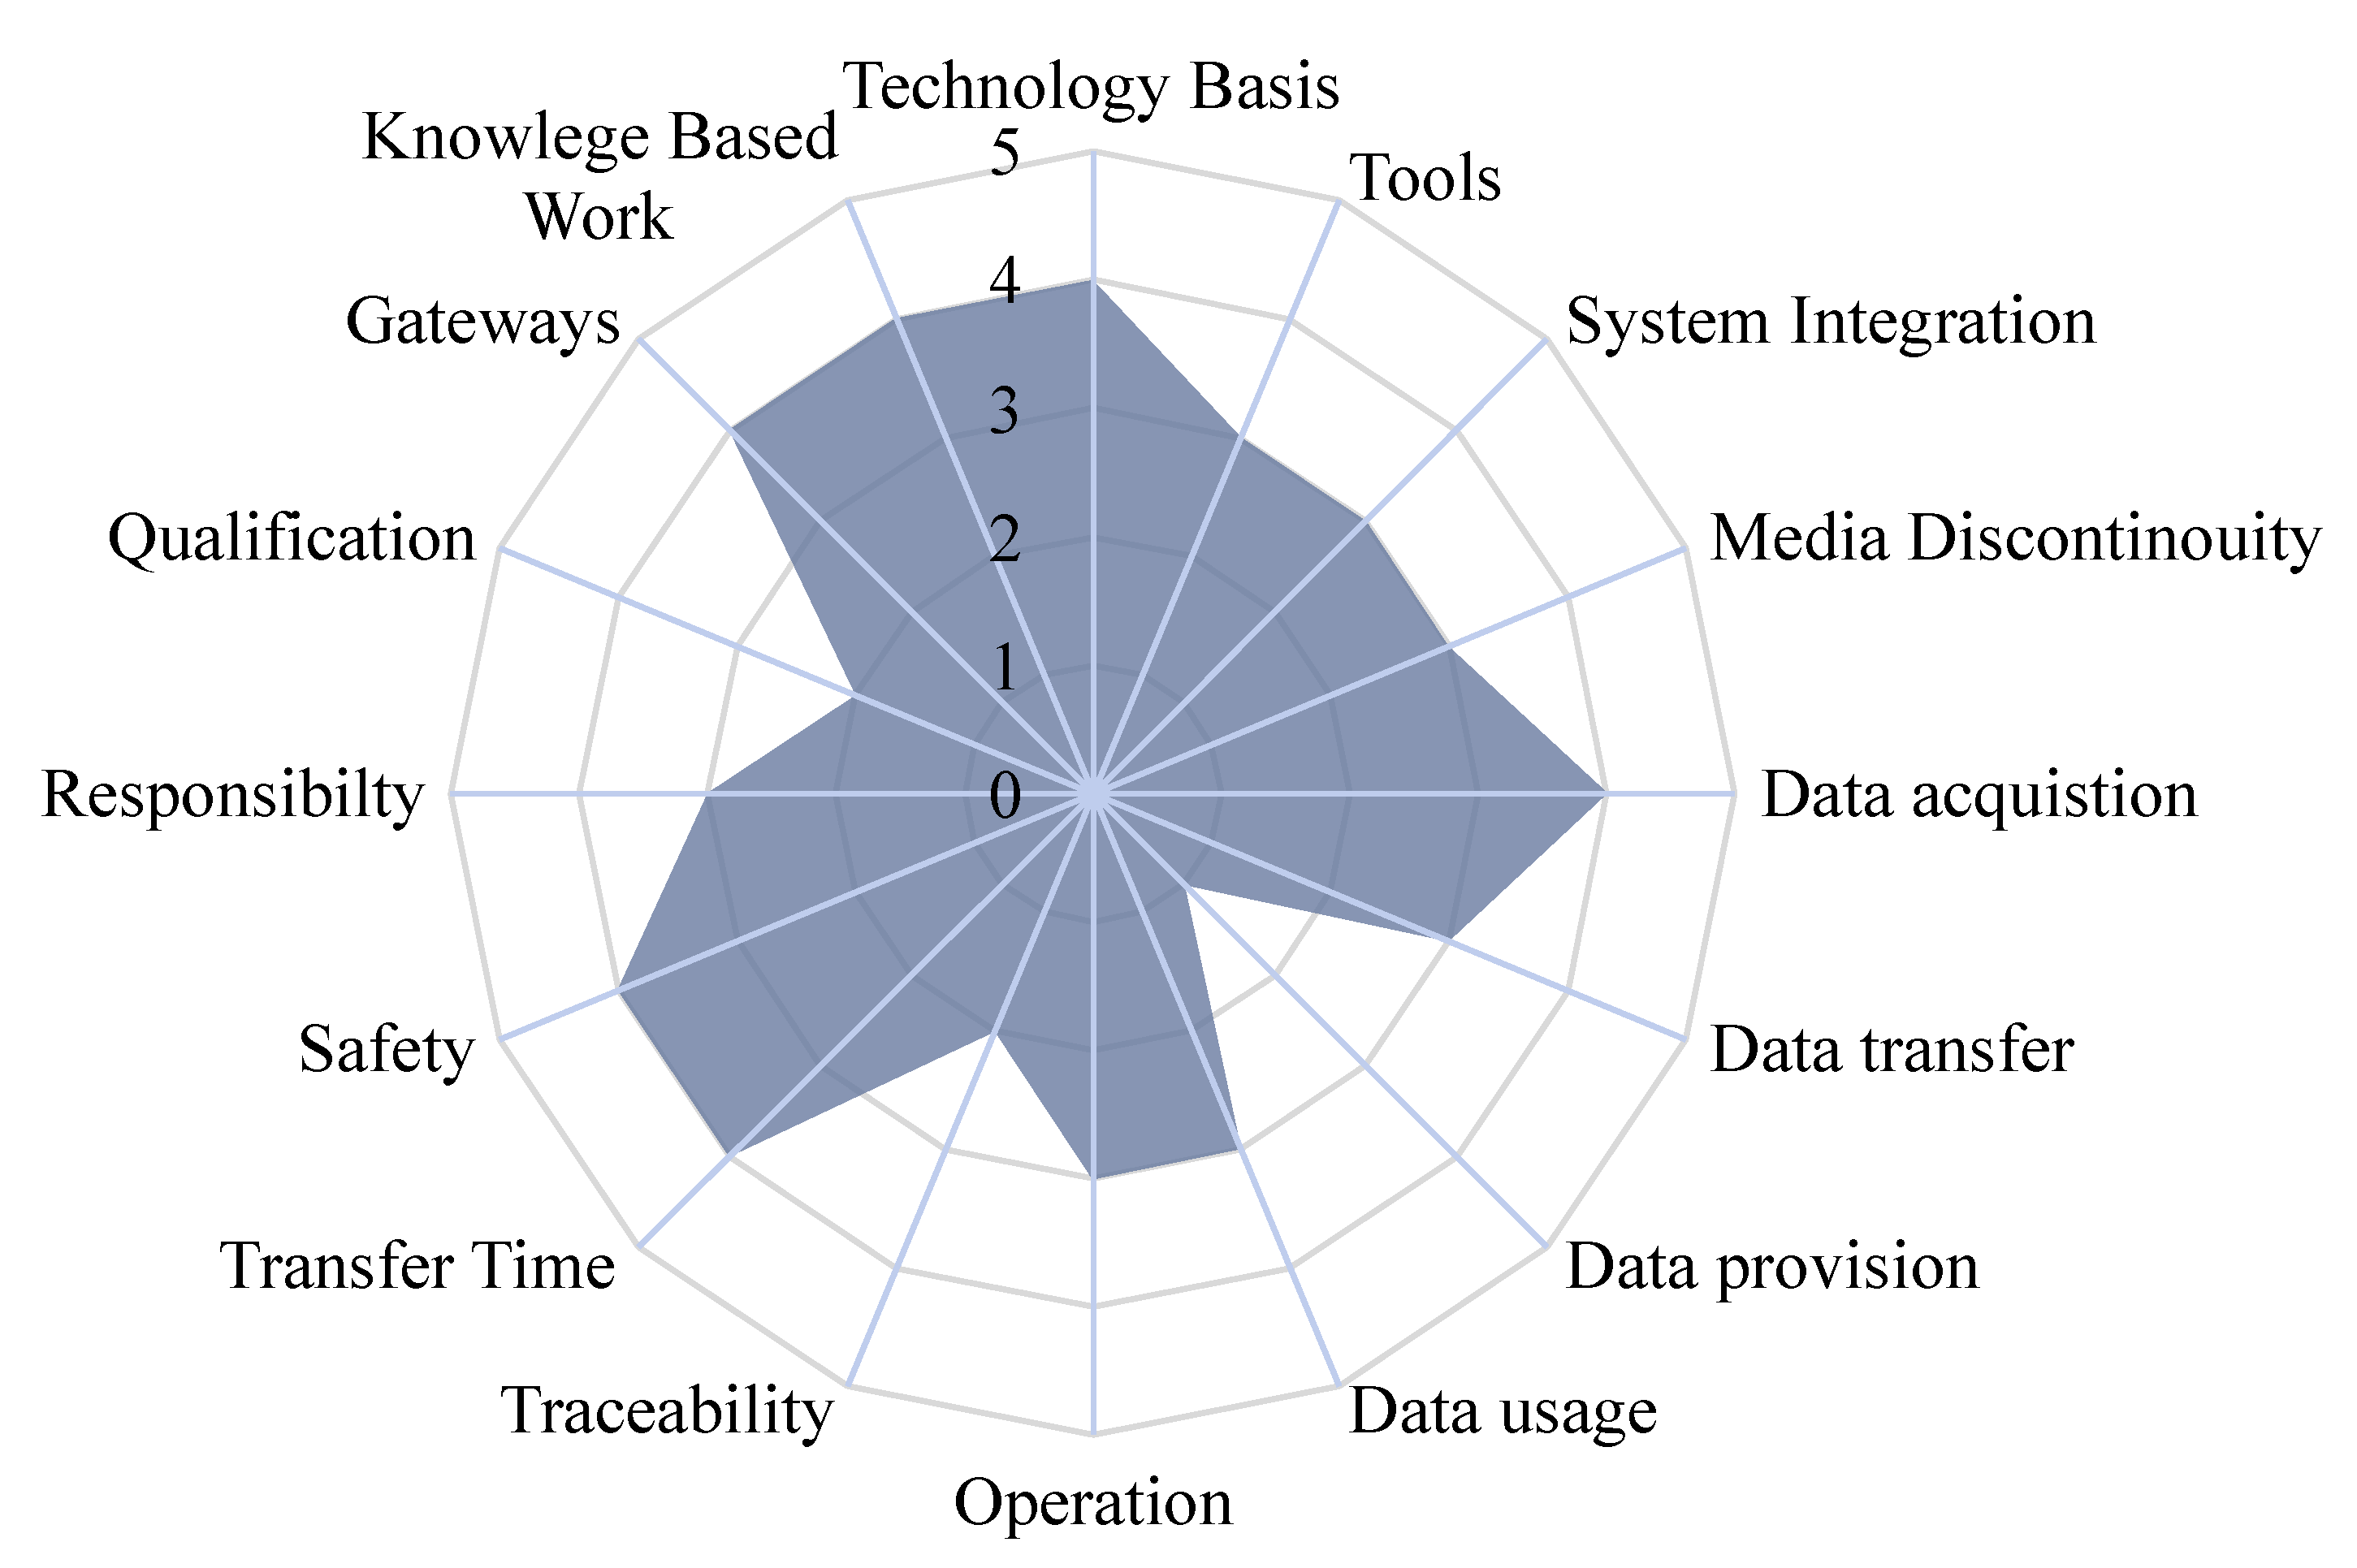
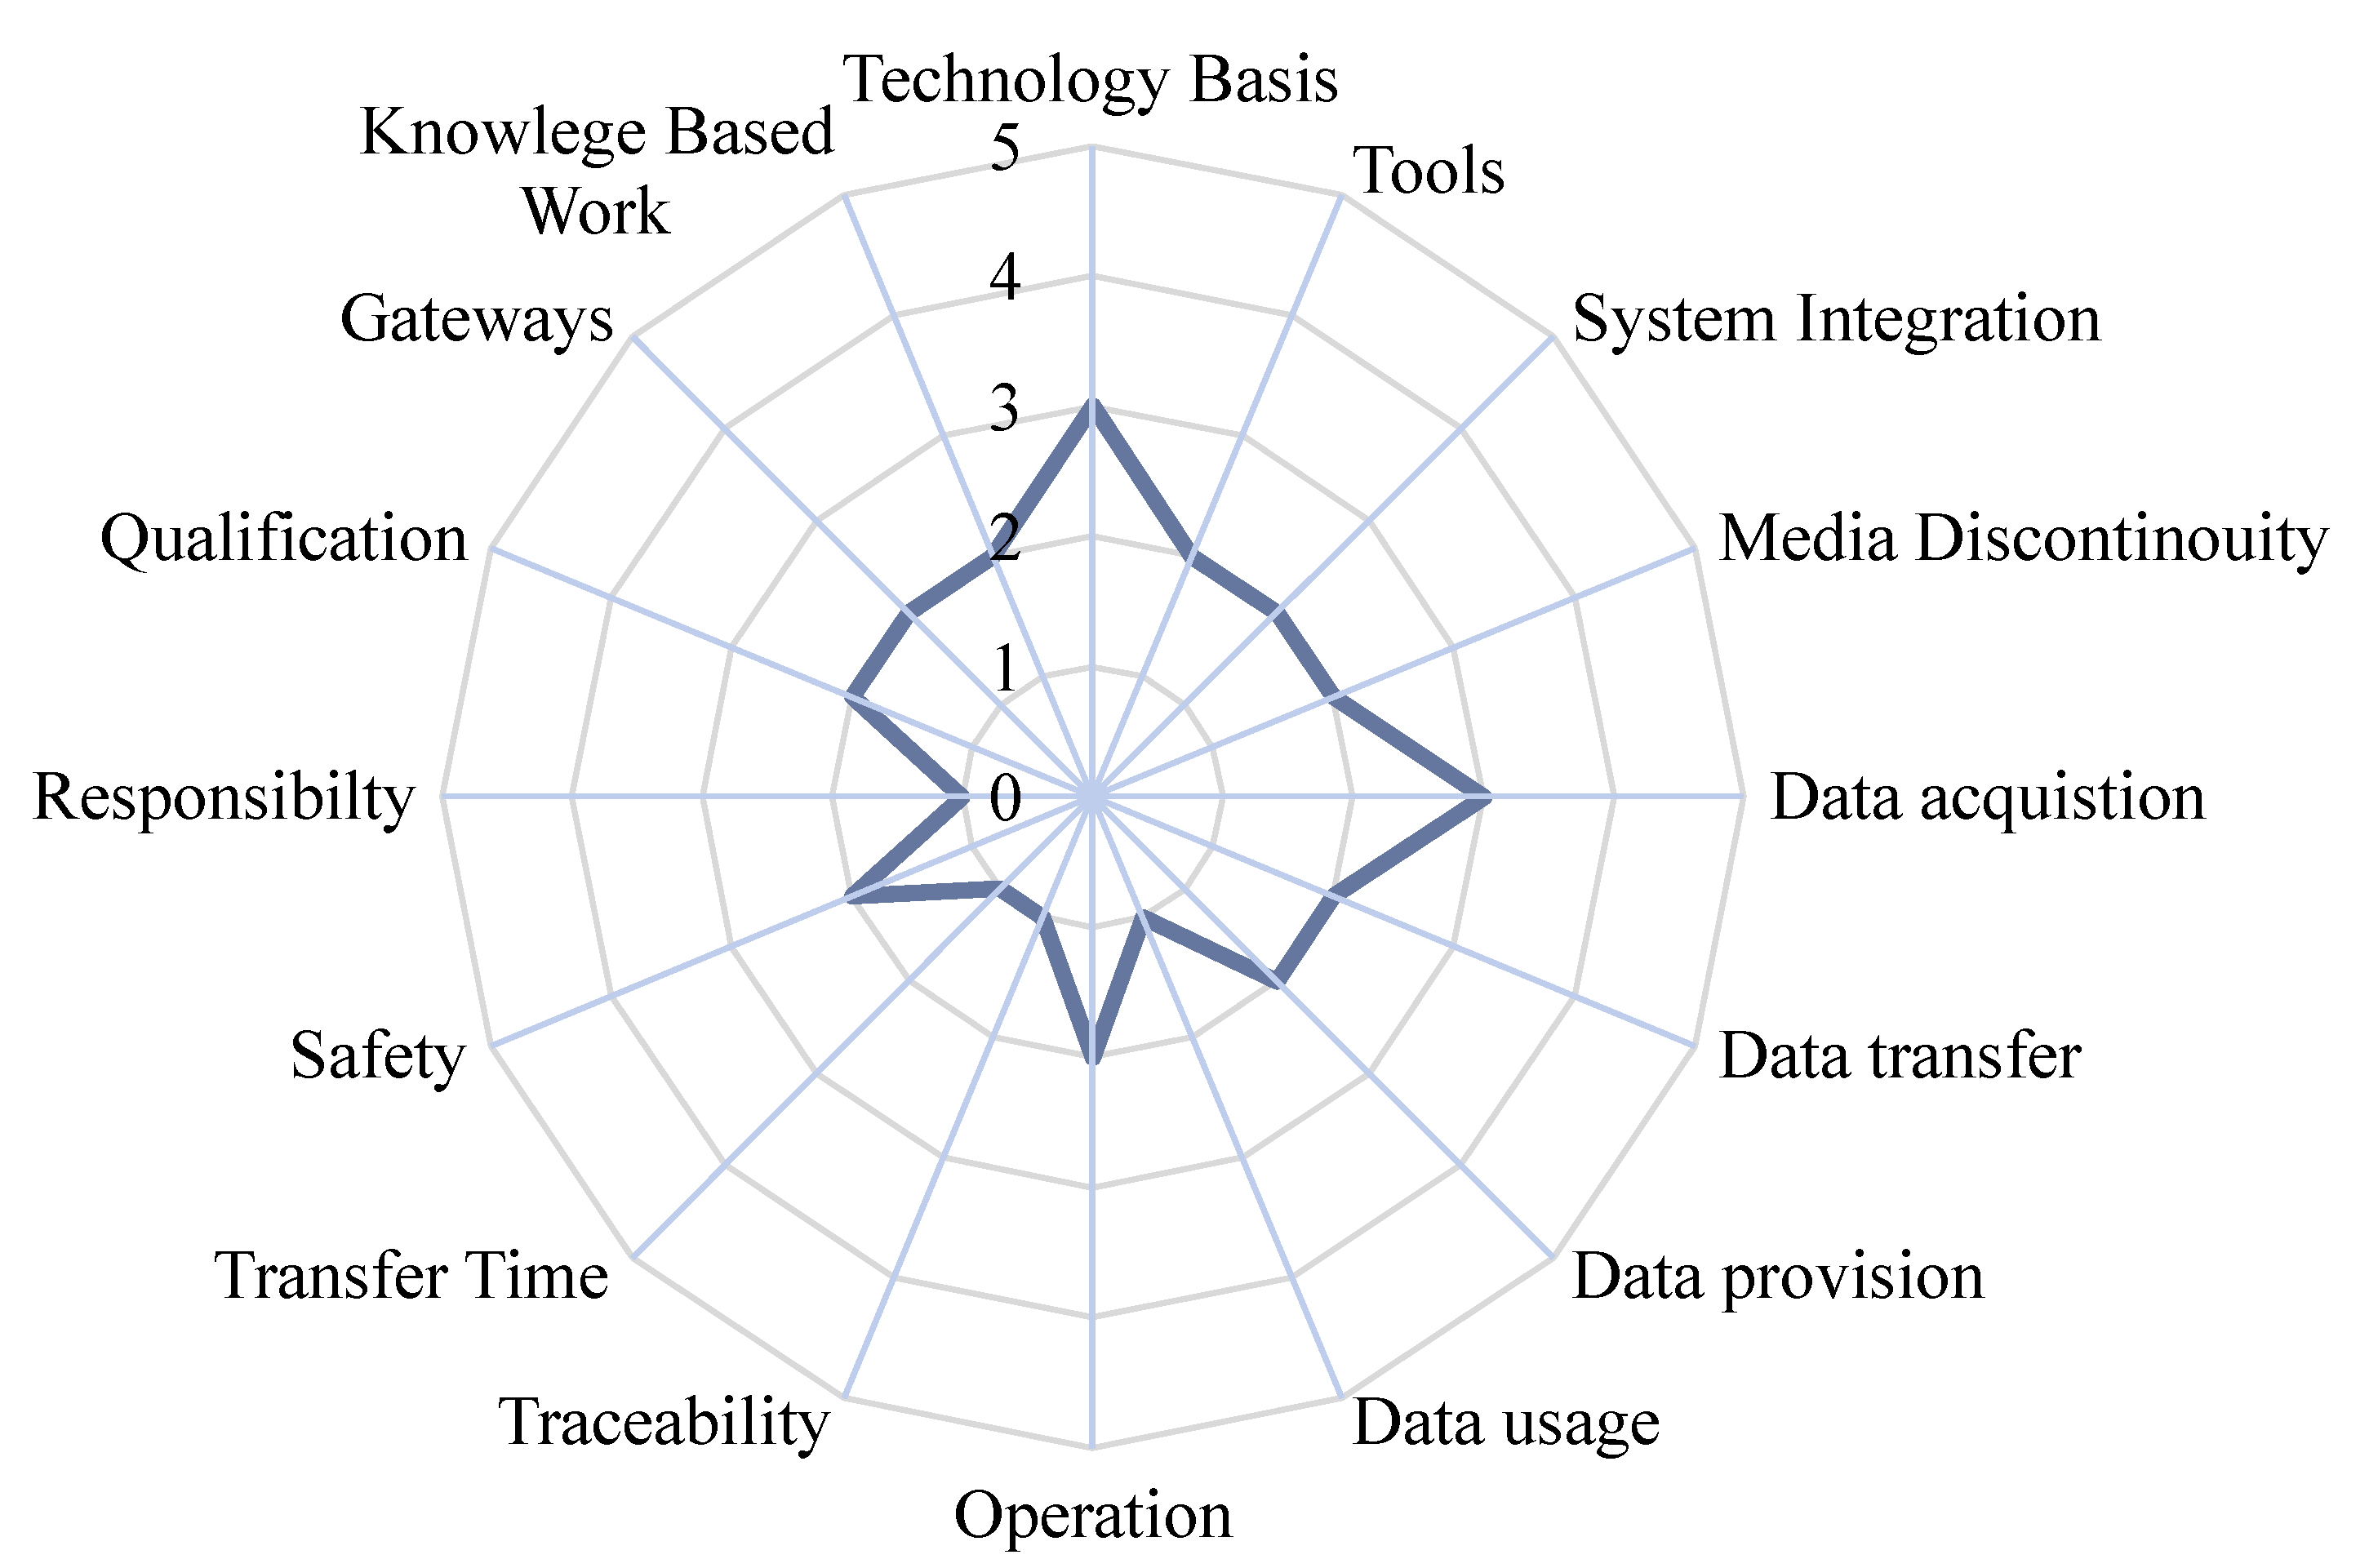
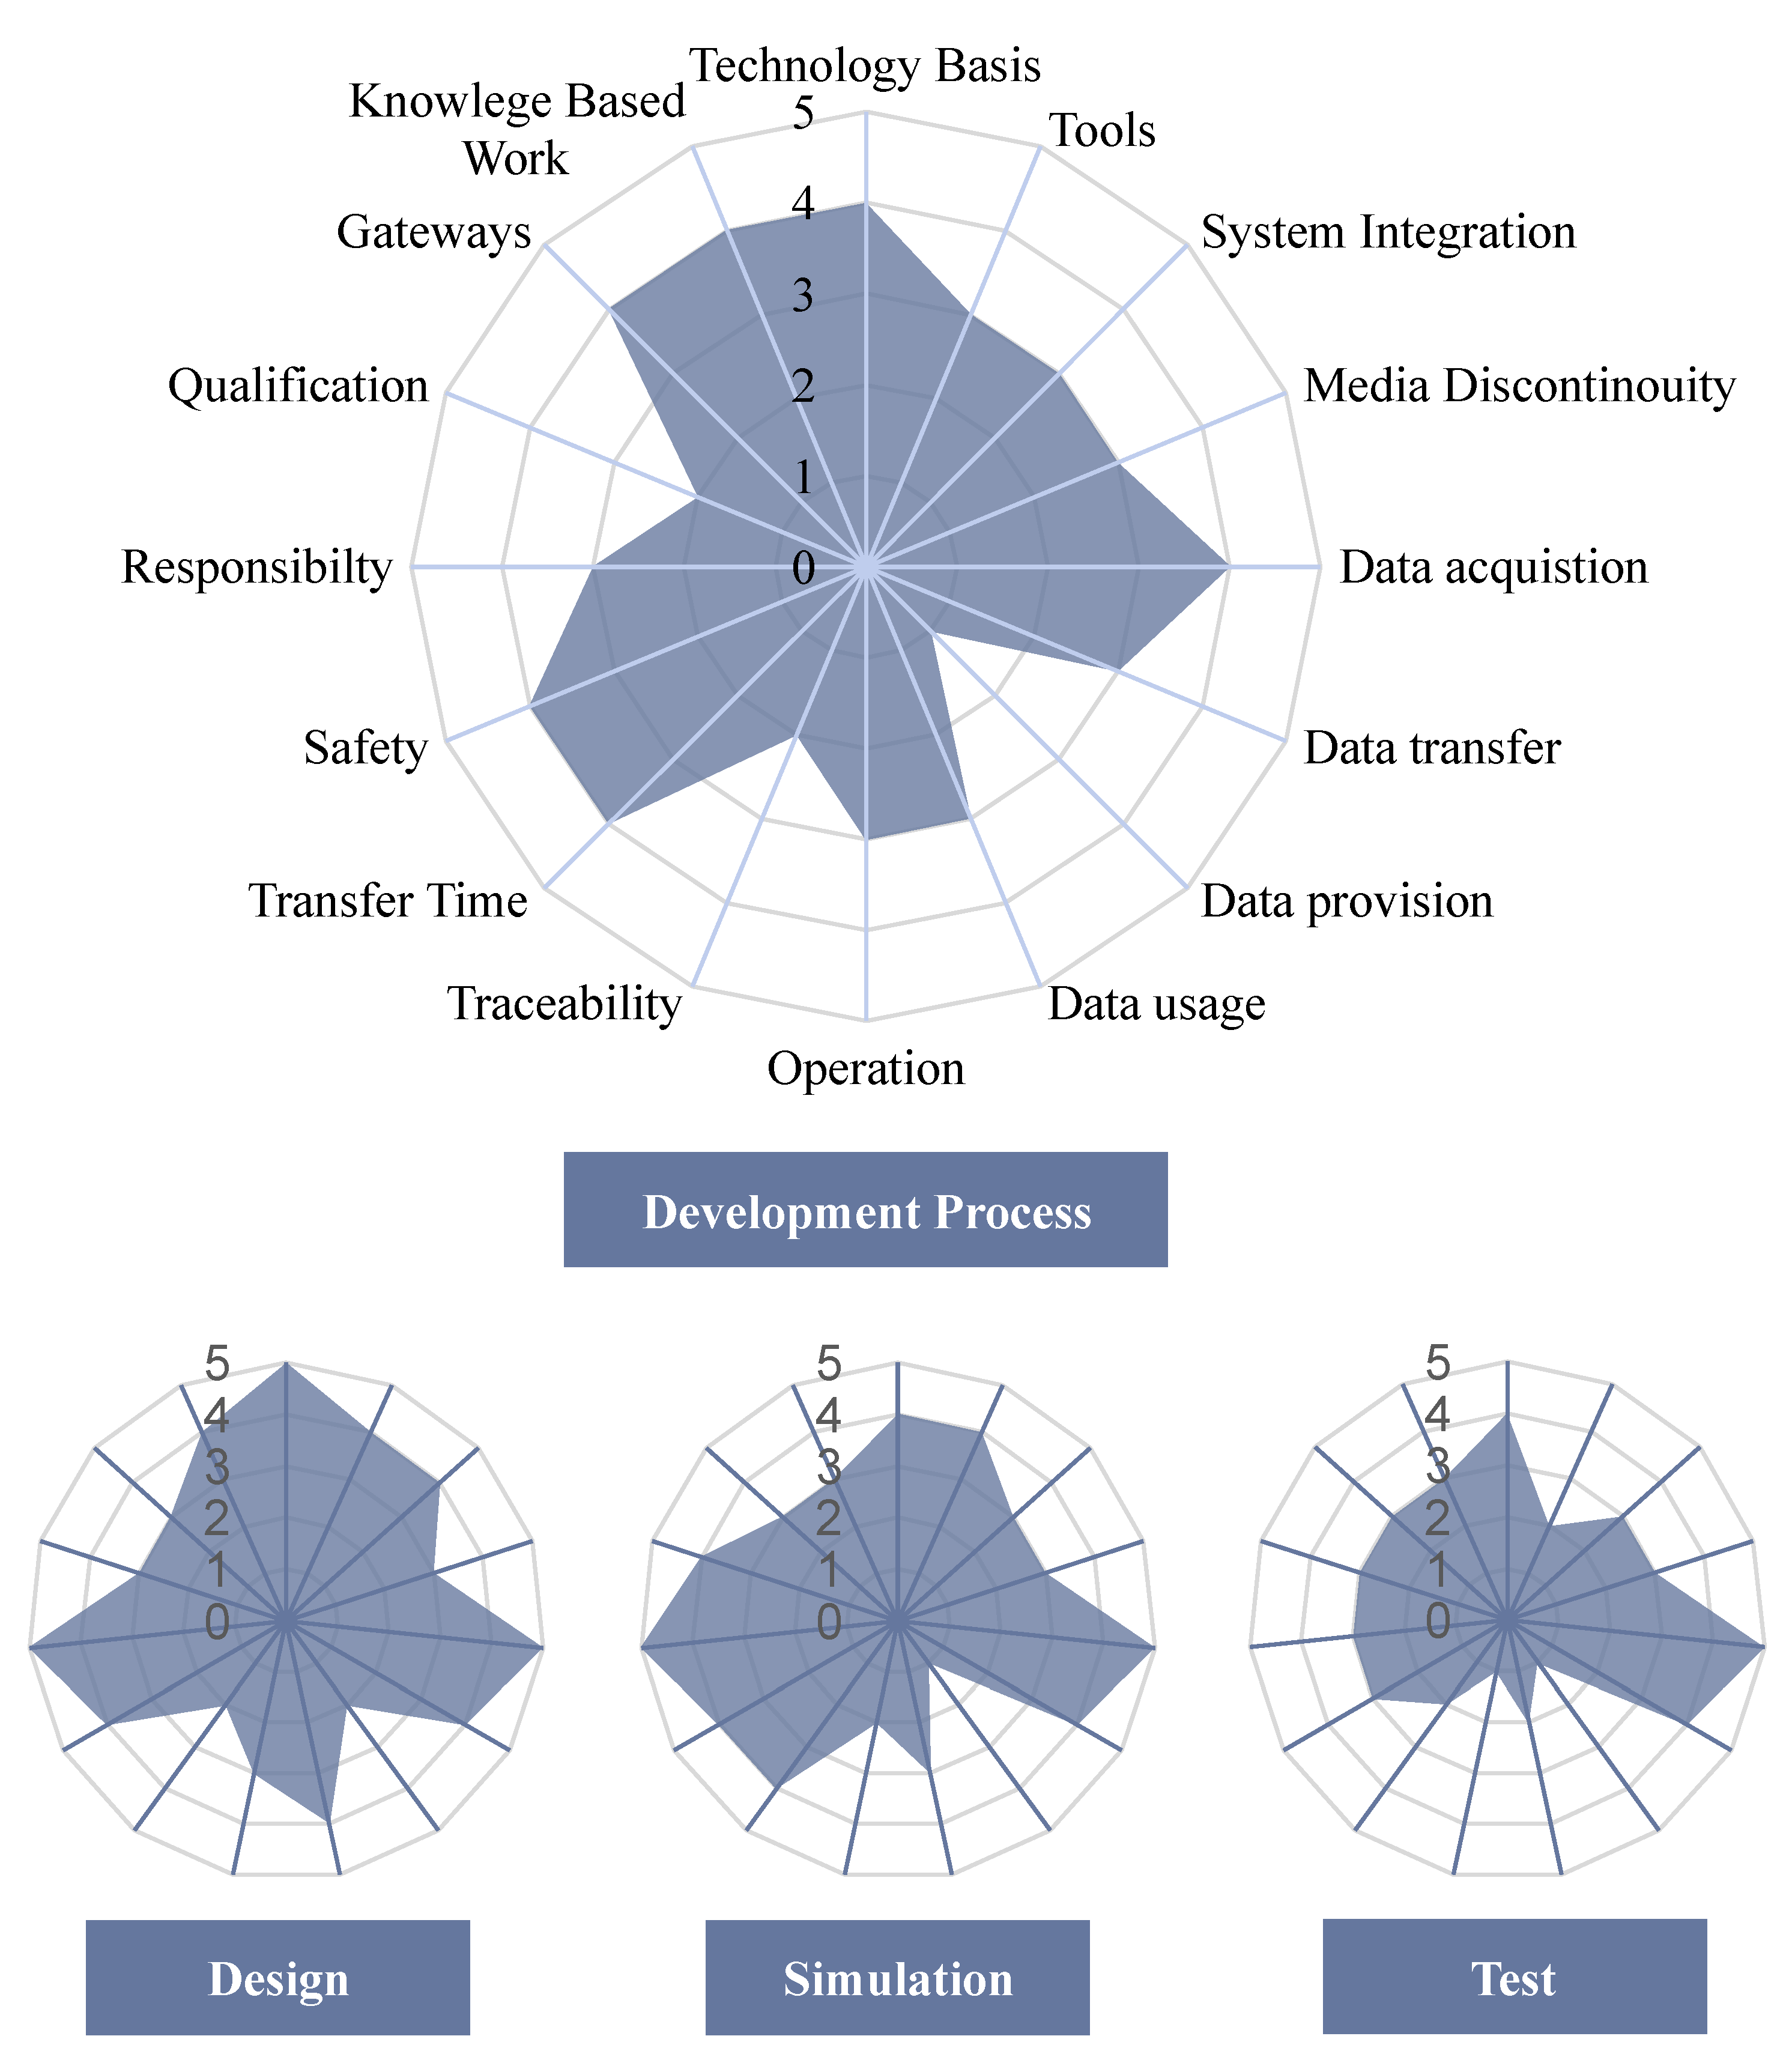
4.4. Technology-Readiness Framework
4.4.1. Technology
Technology Basis
Tools
System Integration
Media Discontinuity
4.4.2. Data
Data Acquisition
Data Transfer
Data Provision
Data Usage
4.4.3. Quality
Operation
Traceability
Transfer Time
Security
4.4.4. Organisation
Responsibility
Qualification
Gateways
Knowledge-Based Work
5. Case Study
5.1. Phase 0: Preparation
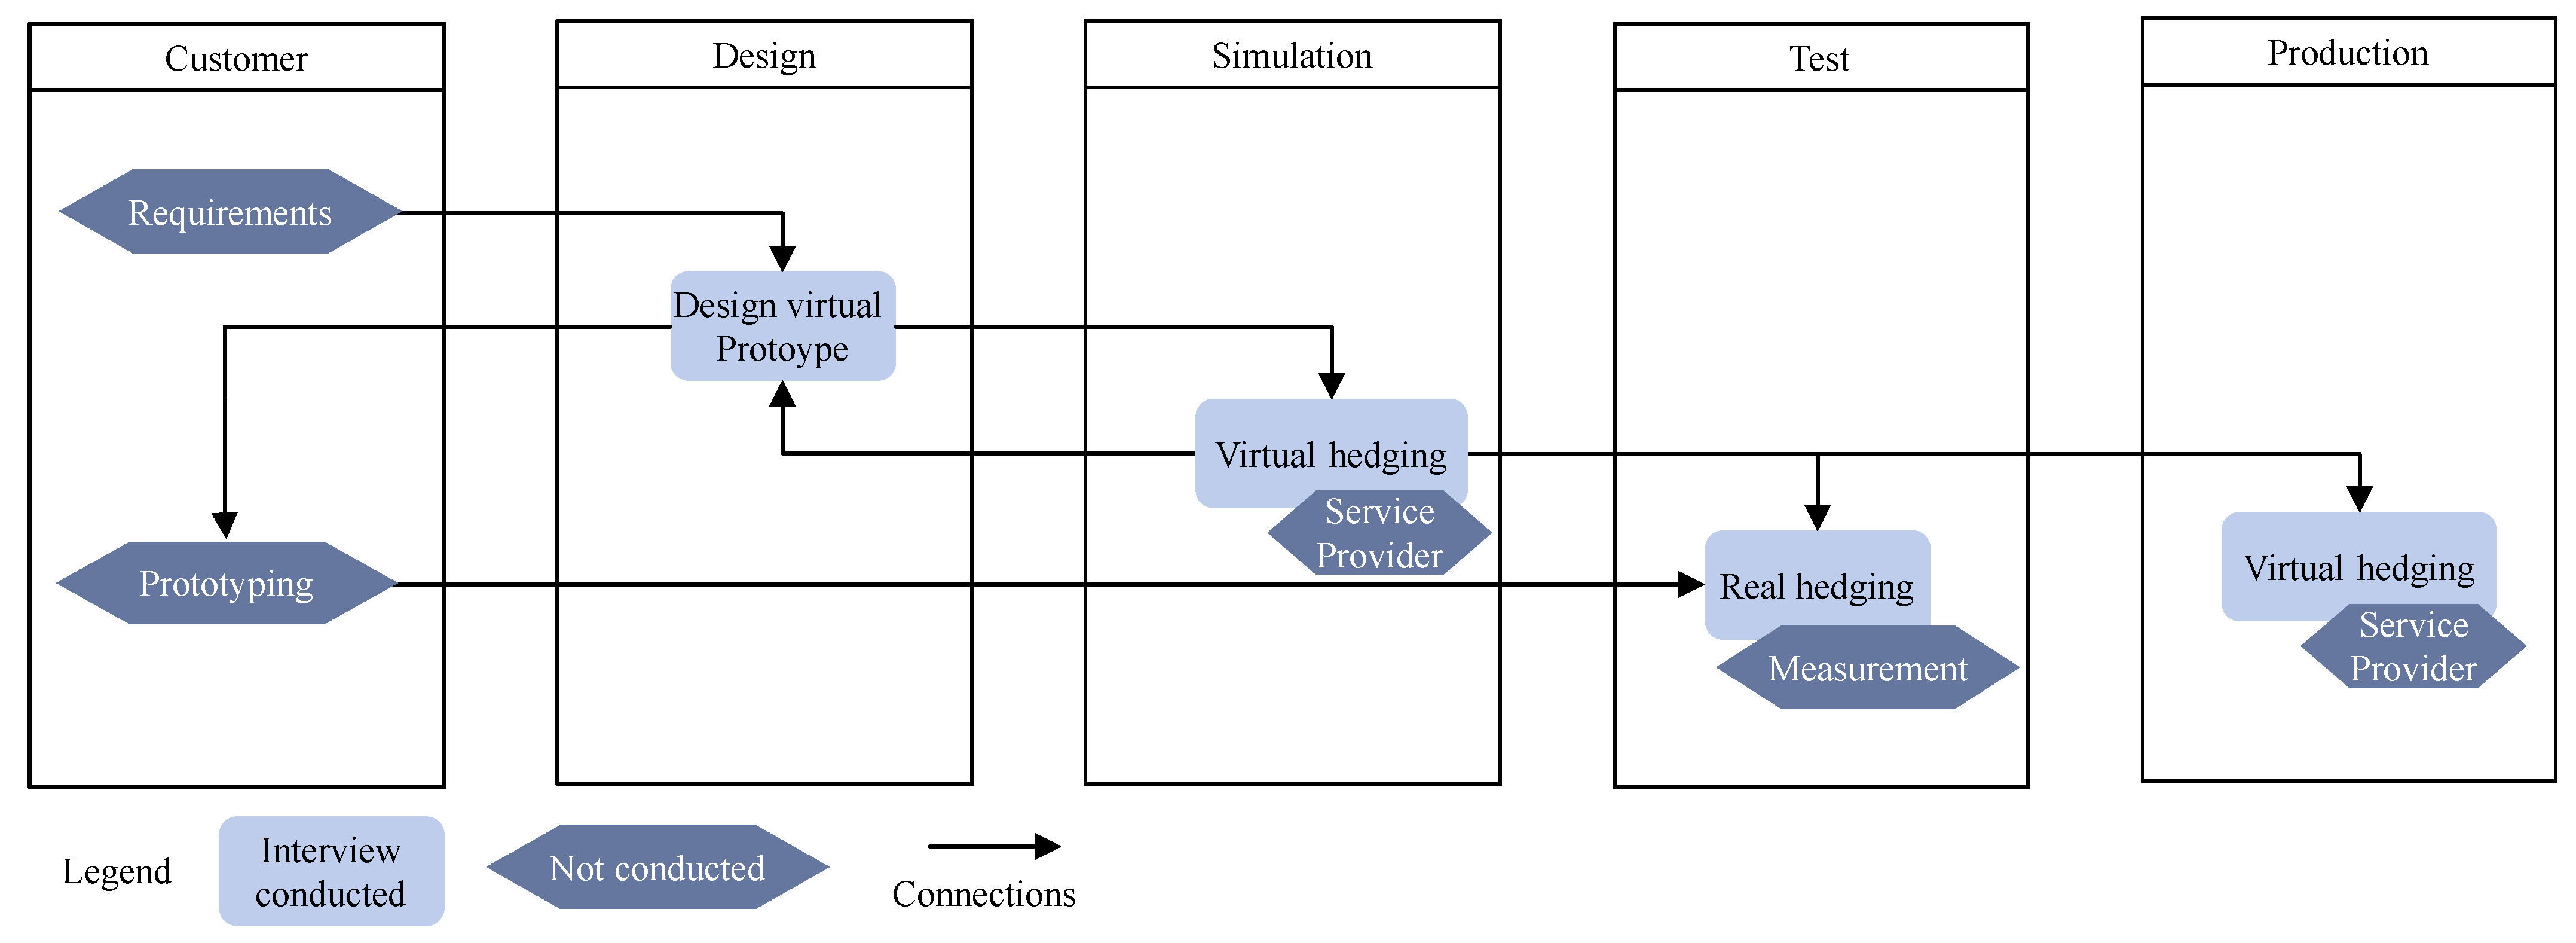
5.2. Phase 1: Process Capturing
- Many iterations and change requests in design processes. This leads to long development times and many repetitive work steps.
- High coordination requirement between departments, which results in many reconciliation meetings and a high number of iterations as well.
- Short timeframes combined with long waiting times, for example, for simulation or test results, during the design.
- Data retrieval from simulation to design is subject to media discontinuities, since simulations needs different data formats to design.
- Elaborate evaluation of simulation results requires a high level of staff expertise and time, which is not always available and results in a high workload in the department.
- Correction iterations with simulation service providers are necessary if there are errors in the simulation setup. The data check as well as the iterations cost time.
- Testing is the bottleneck in the approval process due to long timeframes. Therefore, test results are available not until two iteration loops ahead. This results in additional iteration loops being required to fix potential errors.
5.3. Phase 3: Potential Analysis
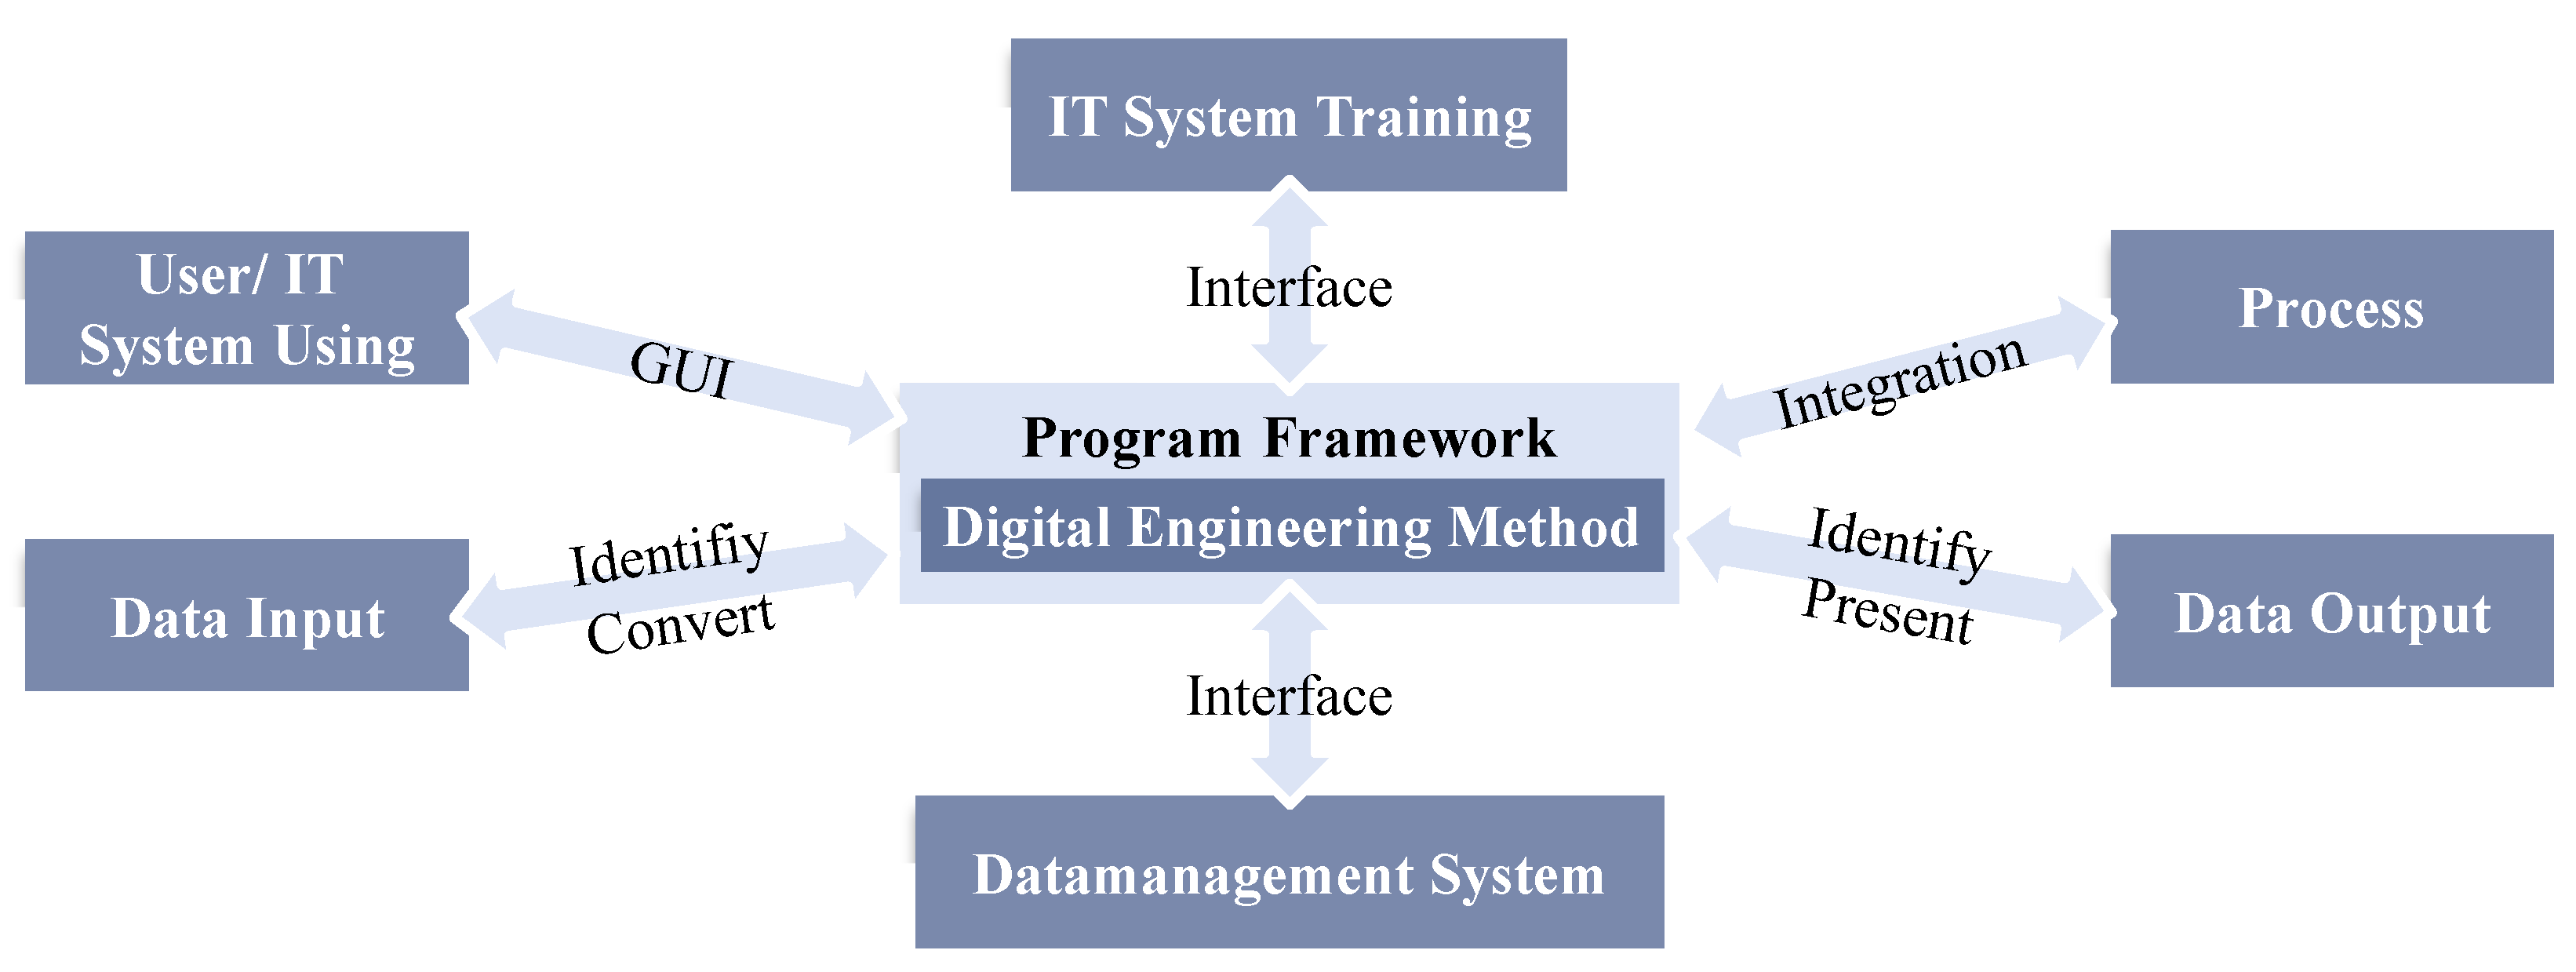
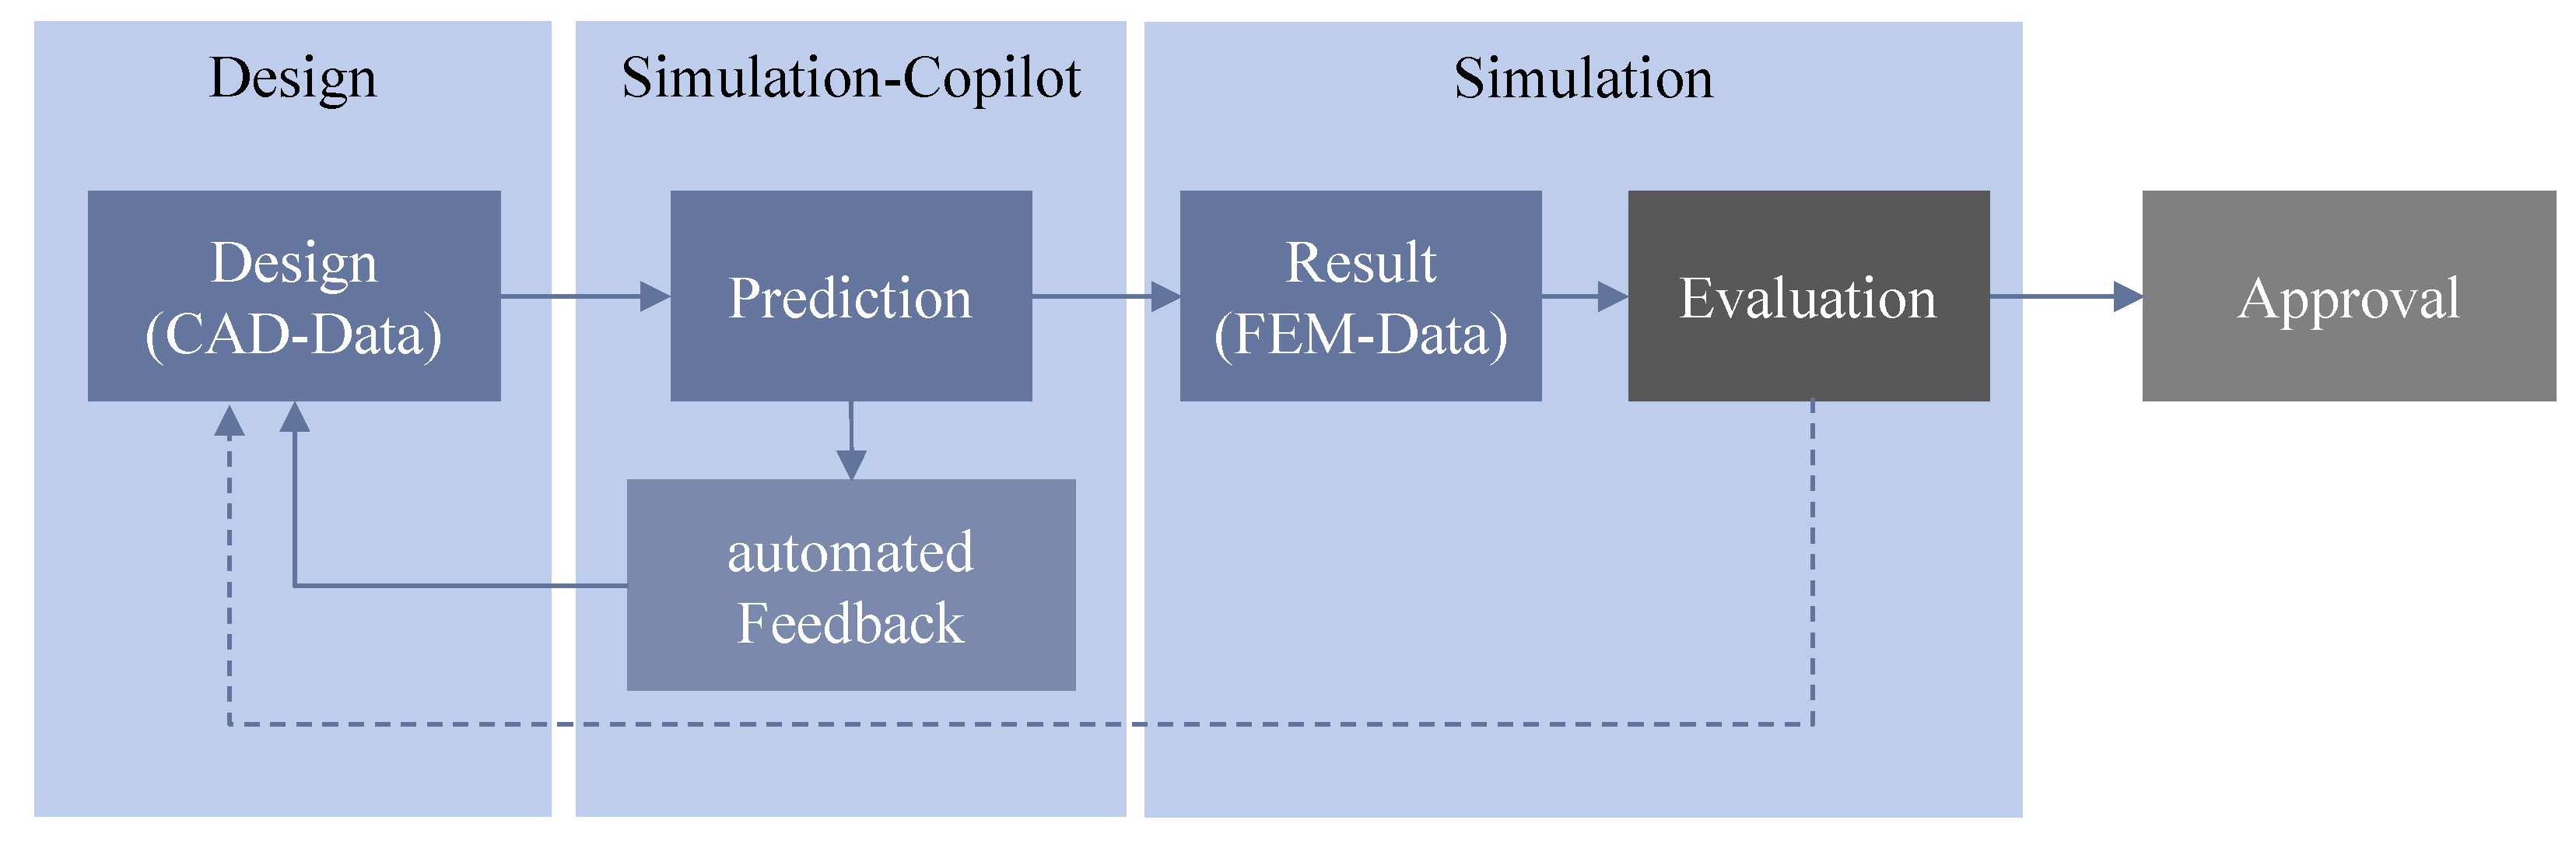
5.4. Phase 4: Process Redesign
5.4.1. IT System Training
5.4.2. IT System User
5.4.3. Data Management System
5.4.4. Data Input
5.4.5. Data Output
5.4.6. Process
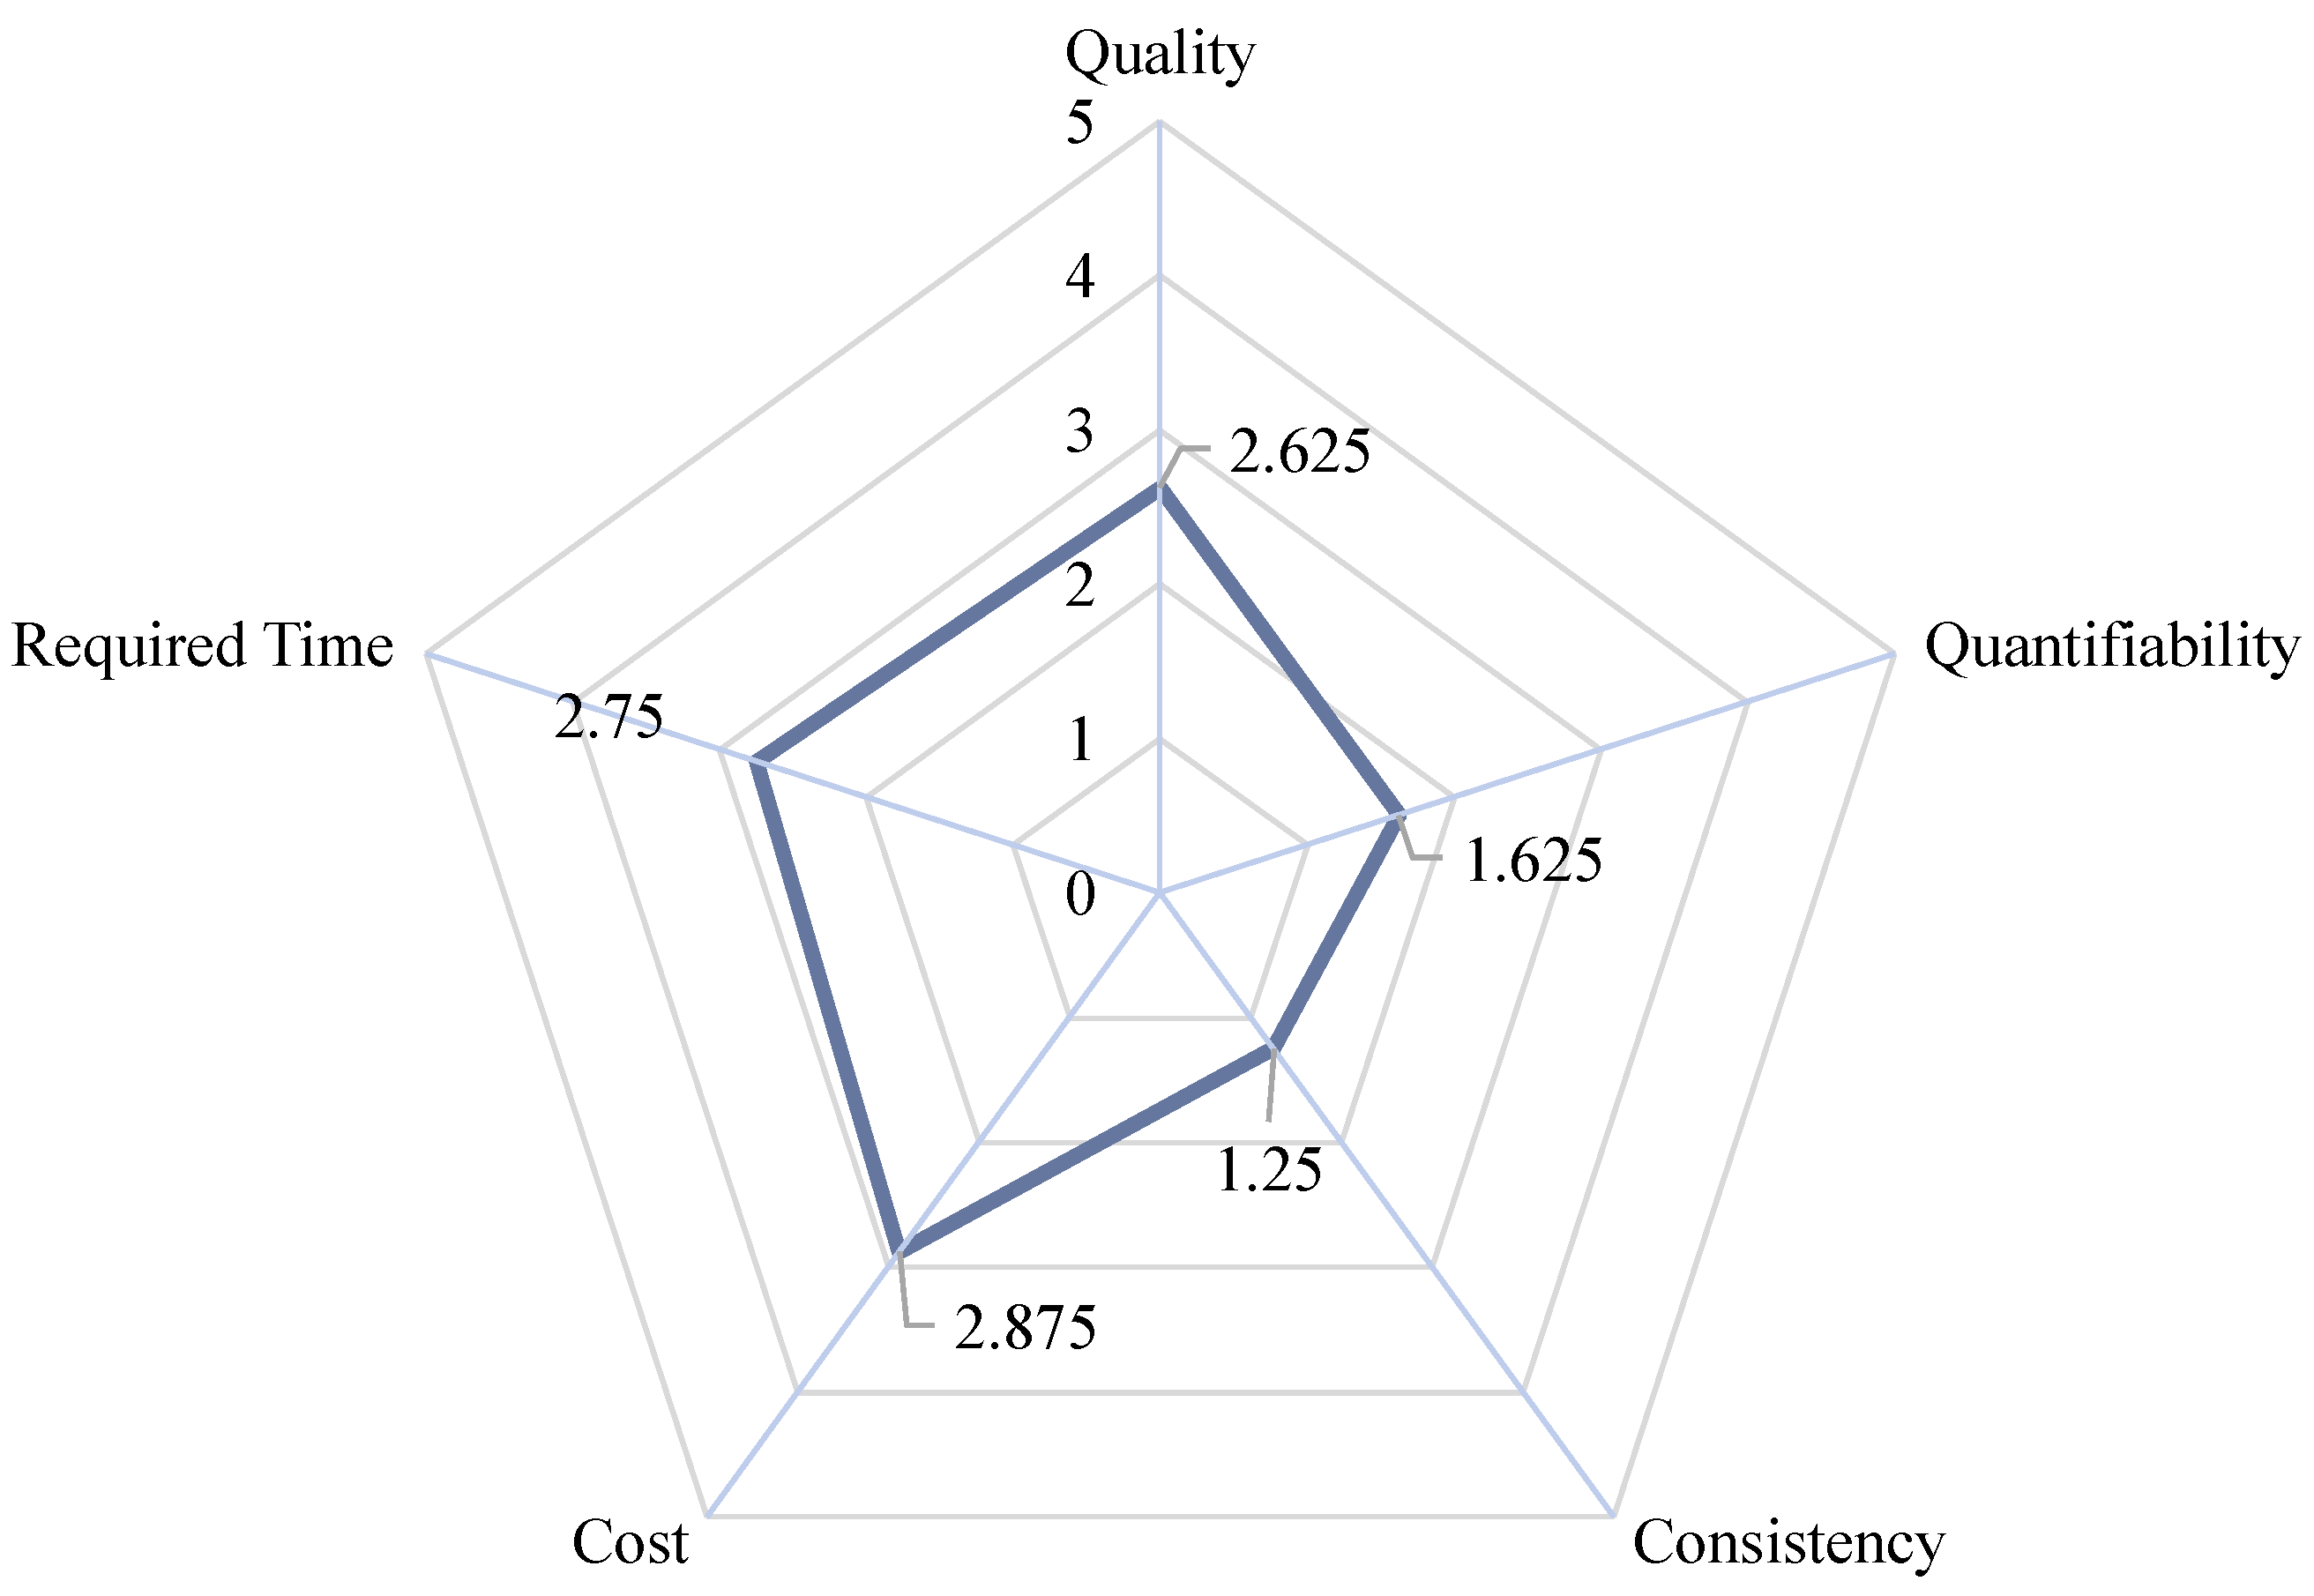
6. Discussion
6.1. Case Study
6.1.1. Economy
6.1.2. Quality
6.1.3. Quantifiability
6.1.4. Consistency
6.1.5. Representation of Data, Information, and Knowledge
6.2. Method
7. Summary and Outlook
Author Contributions
Funding
Data Availability Statement
Acknowledgments
Conflicts of Interest
Abbreviations
| ARIS | Architecture of Integrated Information System |
| BPM | Business process management |
| BPMN | Business process model and notation |
| BPR | Business process re-engineering |
| CAD | Computer-aided design |
| CAE | Computer-aided engineering |
| CRISP-DM | Cross-industry standard for data mining |
| DSM | Design structure matrix |
| EDM | Enterprise data management |
| EFQM | European Foundation for Quality Management |
| EPC | Event-driven process chain |
| IDEF | Integration definition for function modelling |
| KBE | Knowledge-based engineering |
| KDD | Knowledge discovery in databases |
| PADDME | Process analysis for digital development in mechanical engineering |
| PDCA | Plan–do–check–act |
| PDM | Product data management |
| SME | Small and medium enterprises |
| TCT | Total cycle time |
| VSM | Value-stream mapping |
Appendix A. Approaches for Integrating Data-Driven Methods
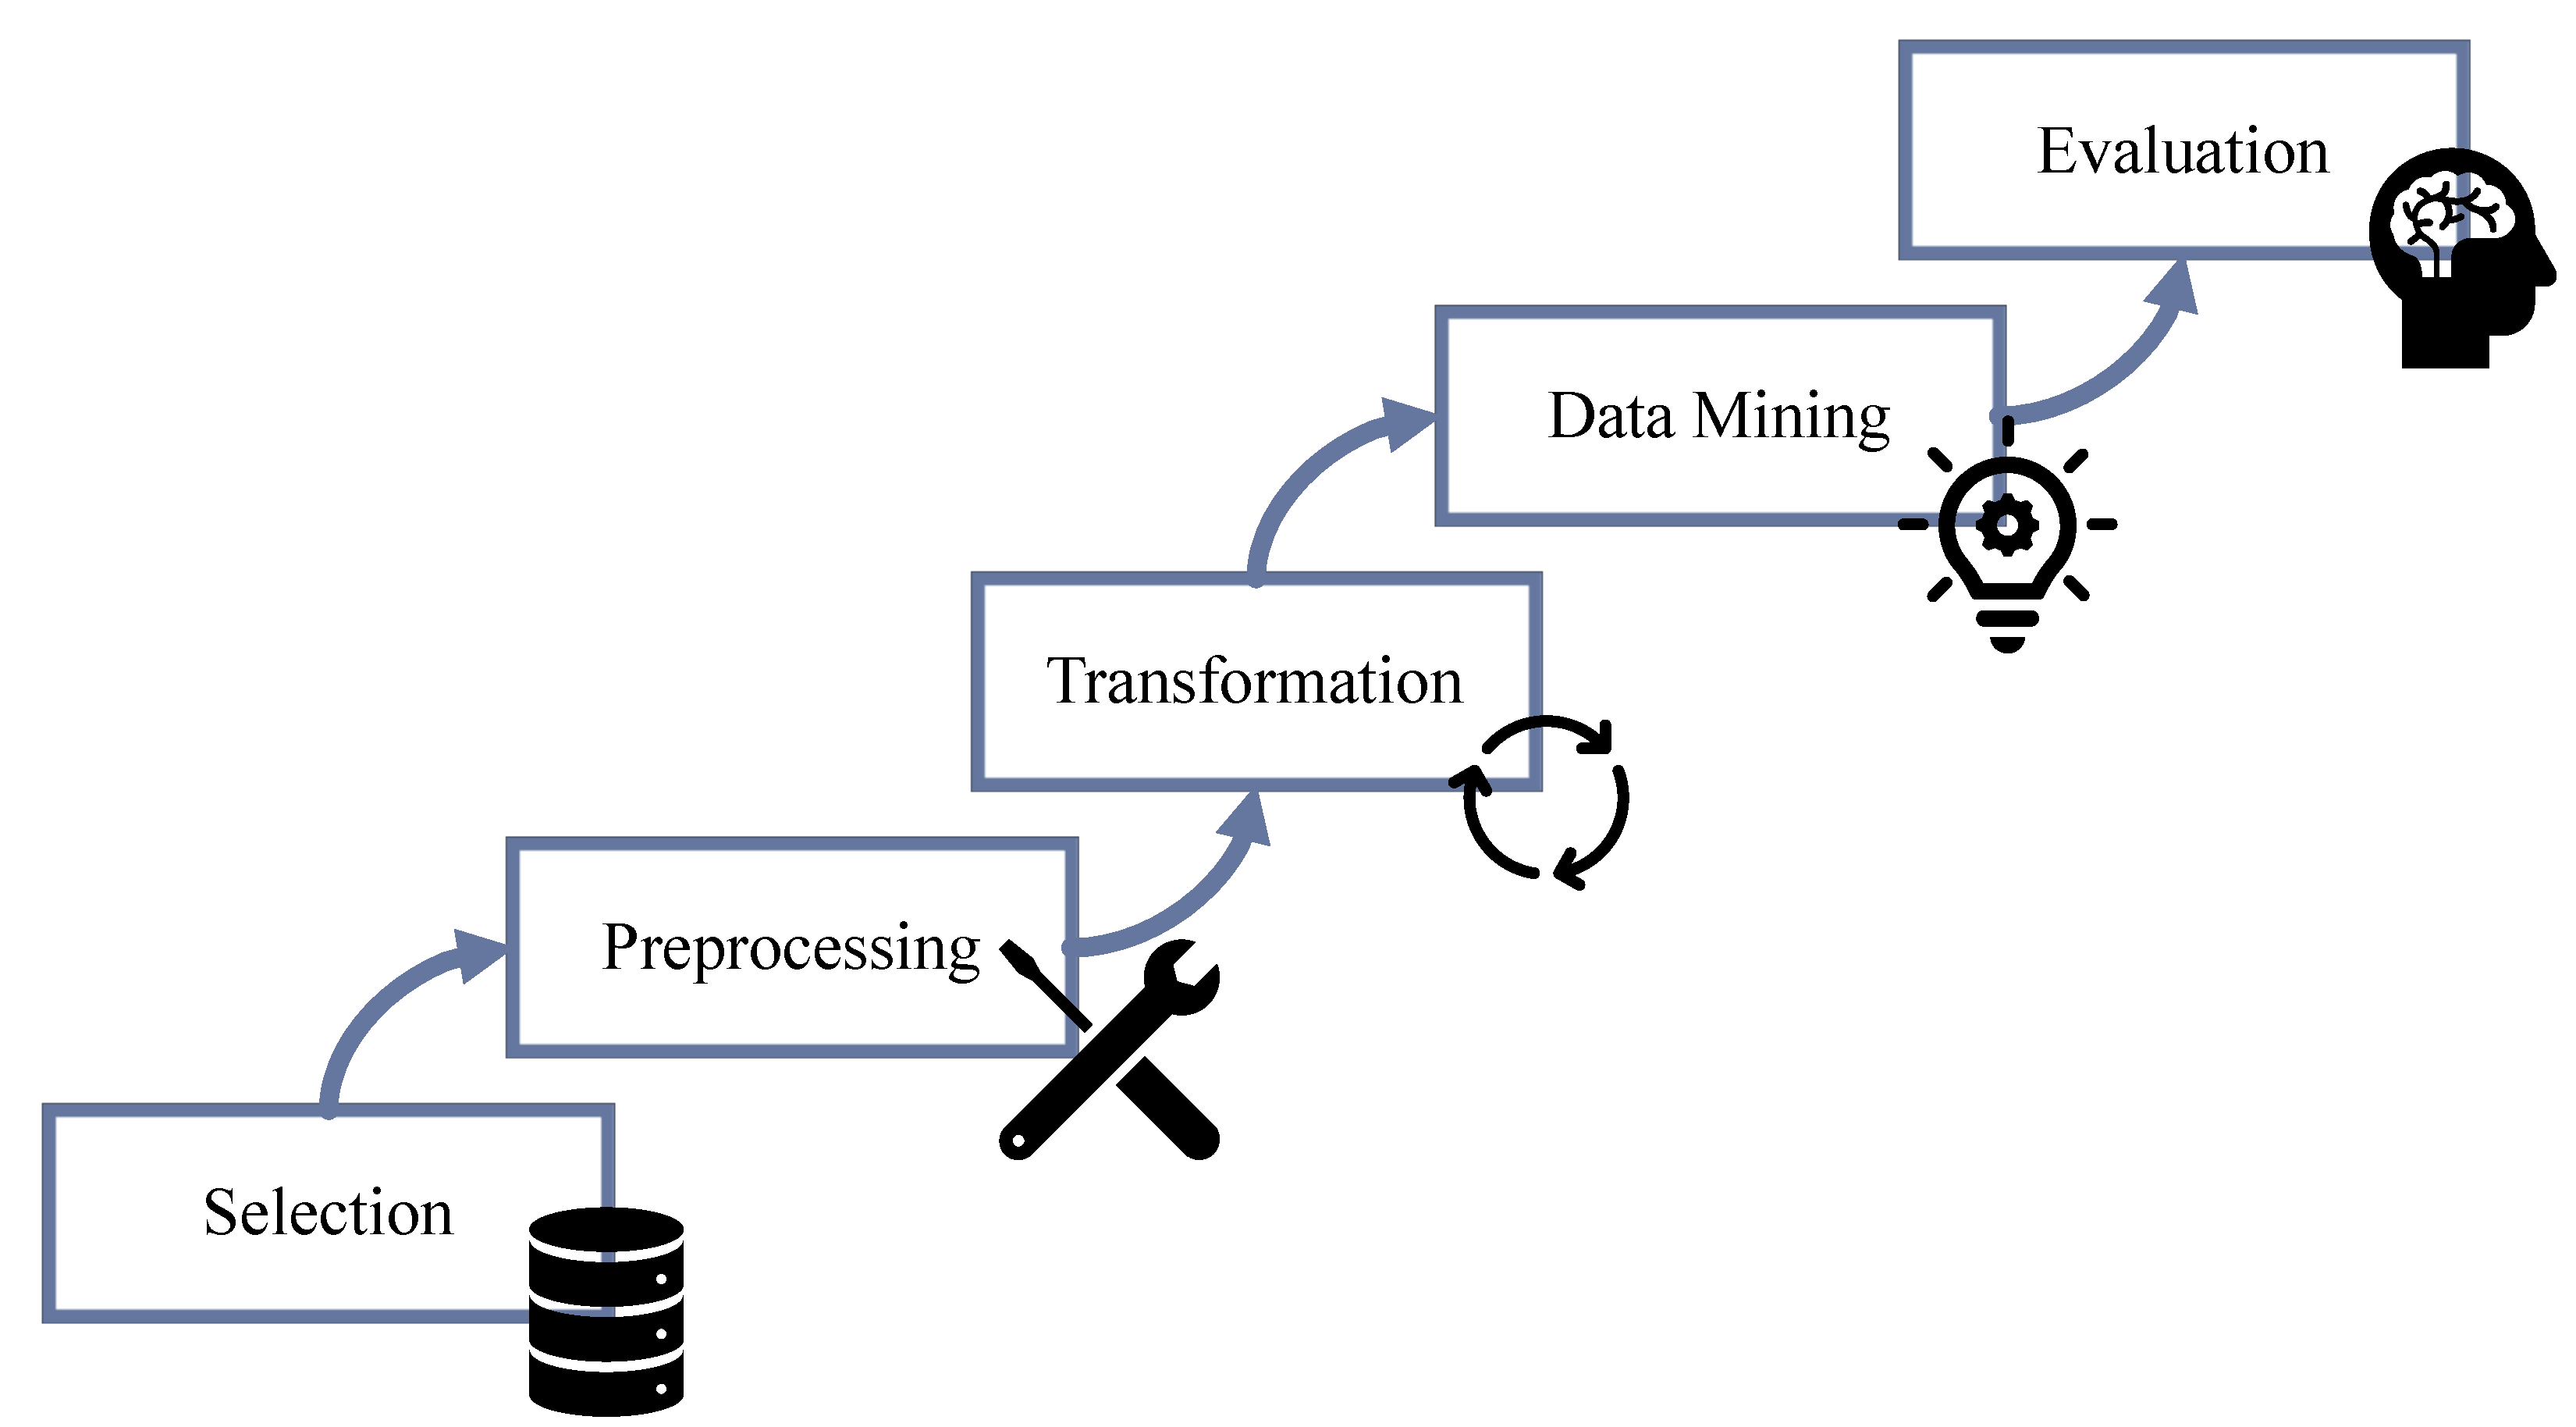
Appendix A.1. KDD Process
- 1.
- Data selection: In this initial phase, relevant data are identified and selected for analysis. The dataset is chosen based on the project’s objectives, domain knowledge, and data availability. The selected data should align with the specific problem or research question at hand.
- 2.
- Data preprocessing: Once the data are selected, they undergo preprocessing to prepare them for analysis. This phase involves cleaning the data by handling missing values, correcting errors, and resolving inconsistencies. Data integration may also be performed to combine multiple datasets into a unified format. Transformation techniques, such as normalisation or aggregation, can be applied to make the data suitable for further analysis.
- 3.
- Data transformation: In this phase, the preprocessed data are transformed into a suitable representation for analysis. This typically involves converting the data into a format that can be effectively processed using data mining algorithms. Feature selection or extraction techniques may be applied to reduce the dimensionality of the dataset and capture the most relevant information.
- 4.
- Data mining: The core of the KDD process lies in the data mining phase. Here, advanced algorithms and techniques are applied to extract patterns, relationships, and insights from the transformed data. Data mining algorithms can be categorised into various types, including classification, clustering, regression, association rule mining, and more. The choice of algorithm depends on the nature of the problem and the knowledge that is desired to be extracted.
- 5.
- Pattern evaluation: Once patterns and relationships have been discovered through data mining, they need to be evaluated for their quality, significance, and usefulness. This evaluation is performed based on domain expertise, statistical measures, and evaluation metrics specific to the problem domain. Patterns that meet the desired criteria are considered valuable and can be further analysed.

Appendix A.2. CRISP-DM Process
- 1.
- Business understanding: This initial phase focuses on understanding the project objectives, requirements, and constraints from a business perspective. It involves identifying the goals of the project, defining the problem statement, and forming a clear understanding of how the project outcomes will benefit the organisation.
- 2.
- Data understanding: In this phase, data sources are identified and collected. The data are then explored to gain a comprehensive understanding of their structure, quality, and potential limitations. Data issues and challenges are addressed, and initial insights are derived to determine the feasibility of the project.
- 3.
- Data preparation: This phase involves preparing the data for analysis. It includes data cleaning, transformation, and integration to ensure data quality and consistency. Data preprocessing techniques, such as handling missing values or outliers, are applied to create a clean and reliable dataset.
- 4.
- Modelling: In this phase, various data mining and machine learning techniques are applied to build and validate models. The appropriate modelling techniques are selected based on the project objectives and the nature of the data. Iterative experimentation and model refinement are performed to achieve the desired level of accuracy and performance.
- 5.
- Evaluation: The models developed in the previous phase are evaluated against the business objectives and criteria established in the first phase. Model performance and effectiveness are assessed using appropriate evaluation metrics. This phase helps determine if the models meet the project requirements and if further improvements are needed.
- 6.
- Deployment: The final phase focuses on deploying the data mining results into the operational environment. This involves integrating the models into existing systems or processes, creating user interfaces or reports for end-users, and providing documentation and training to ensure the successful implementation and adoption of the results.

References
- Tomiyama, T.; Lutters, E.; Stark, R.; Abramovici, M. Development Capabilities for Smart Products. CIRP Ann. 2019, 68, 727–750. [Google Scholar] [CrossRef]
- Stark, R.; Brandenburg, E.; Lindow, K. Characterization and Application of Assistance Systems in Digital Engineering. CIRP Ann. 2021, 70, 131–134. [Google Scholar] [CrossRef]
- Lunnemann, P.; Stark, R.; Wang, W.M.; Stark, R.; Manteca, P.I. Engineering Activities—Considering Value Creation from a Holistic Perspective. In Proceedings of the 2017 International Conference on Engineering, Technology and Innovation (ICE/ITMC), Madeira, Portugal, 27–29 June 2017; pp. 315–323. [Google Scholar] [CrossRef]
- Pahl, G.; Wallace, K.; Blessing, L.; Pahl, G. (Eds.) Engineering Design: A Systematic Approach, 3rd ed.; Springer: London, UK, 2007. [Google Scholar]
- VDI 2221 Blatt 1 Design of Technical Products and Systems—Model of Product Design; Beuth: Berlin, Germany, 2019.
- Beuth Verlang GmbH. VDI/VDE 2206:2021-11-Development of Mechatronic and Cyber-Physical Systems; Technical Report; Beuth Verlang GmbH: Berlin, Germany, 2021. [Google Scholar]
- Nattermann, R.; Anderl, R. The W-model—Using Systems Engineering for Adaptronics. Procedia Comput. Sci. 2013, 16, 937–946. [Google Scholar] [CrossRef][Green Version]
- Wickel, M.; Schenkl, S.A.; Schmidt, D.M.; Hense, J.U.; Mandl, H.; Maurer, M. Knowledge Structure Maps Based on Multiple Domain Matrices. Inimpact J. Innov. Impact 2013, 5, 5–16. [Google Scholar]
- Montáns, F.J.; Chinesta, F.; Gomez-Bombarelli, R.; Kutz, J.N. Data-Driven Modeling and Learning in Science and Engineering. Comptes Rendus Mec. 2019, 347, 845–855. [Google Scholar] [CrossRef]
- Bertoni, A. Data-Driven Design in Concept Development: Systematic Review and Missed Opportunities. Proc. Des. Soc. Des. Conf. 2020, 1, 101–110. [Google Scholar] [CrossRef]
- Schenk, M. Digitales Engineering und virtuelle Techniken zum Planen, Testen und Betreiben technischer Systeme. In Proceedings of the 13. IFF Wissenschaftstage, Magdeburg, Germany, 15–17 June 2010. [Google Scholar]
- Schumann, M.; Schenk, M.; Schmucker, U.; Saake, G. Digital Engineering-Herausforderungen, Ziele Und Lösungsbeispiele. In Proceedings of the 14. IFF Wissenschaftstage 2011, Magdeburg, Germany, 28–30 June 2011. [Google Scholar]
- Gerschütz, B.; Sauer, C.; Kormann, A.; Wallisch, A.; Mehlstäubl, J.; Alber-Laukant, B.; Schleich, B.; Paetzold, K.; Rieg, F.; Wartzack, S. Towards Customized Digital Engineering: Herausforderungen und Potentiale bei der Anpassung von Digital Engineering Methoden Für den Produktentwicklungsprozess. In Proceedings of the Stuttgarter Symposium für Produktentwicklung 2021 (SSP 2021), Stuttgart, Germany, 20 May 2021. [Google Scholar]
- Duigou, J.L.; Bernard, A.; Perry, N.; Delplace, J.C. Generic PLM System for SMEs: Application to an Equipment Manufacturer. Int. J. Prod. Lifecycle Manag. 2012, 6, 51. [Google Scholar] [CrossRef]
- Gerschütz, B.; Schleich, B.; Wartzack, S. A Semantic Web Approach for Structuring Data-Driven Methods in the Product Development Process. In Proceedings of the DS 111: Proceedings of the 32nd Symposium Design for X, Tutzing, Germany, 27–28 September 2021. [Google Scholar] [CrossRef]
- StackExchange. Distinction between AI, ML, Neural Networks, Deep Learning and Data Mining. 2019. Available online: https://softwareengineering.stackexchange.com/q/366996 (accessed on 7 January 2024).
- Fayyad, U.; Piatetsky-Shapiro, G.; Smyth, P. From Data Mining to Knowledge Discovery in Databases. AI Mag. 1996, 17, 37. [Google Scholar] [CrossRef]
- Samuel, A.L. Some Studies in Machine Learning Using the Game of Checkers. IBM J. Res. Dev. 2000, 44, 206–226. [Google Scholar] [CrossRef]
- Kulin, M.; Kazaz, T.; De Poorter, E.; Moerman, I. A Survey on Machine Learning-Based Performance Improvement of Wireless Networks: PHY, MAC and Network Layer. Electronics 2021, 10, 318. [Google Scholar] [CrossRef]
- Shabestari, S.S.; Herzog, M.; Bender, B. A Survey on the Applications of Machine Learning in the Early Phases of Product Development. Proc. Des. Soc. Int. Conf. Eng. Des. 2019, 1, 2437–2446. [Google Scholar] [CrossRef]
- Dworschak, F.; Kügler, P.; Schleich, B.; Wartzack, S. Integrating the Mechanical Domain into Seed Approach. In Proceedings of the Design Society: International Conference on Engineering Design, ICED, Delft, The Netherlands, 5–8 August 2019; Volume 2018, pp. 2587–2596. [Google Scholar] [CrossRef]
- Zirngibl, C.; Schleich, B.; Wartzack, S. Robust Estimation of Clinch Joint Characteristics Based on Data-Driven Methods. Int. J. Adv. Manuf. Technol. 2023, 124, 833–845. [Google Scholar] [CrossRef]
- Patel, A.R.; Ramaiya, K.K.; Bhatia, C.V.; Shah, H.N.; Bhavsar, S.N. Artificial Intelligence: Prospect in Mechanical Engineering Field—A Review. In Data Science and Intelligent Applications; Kotecha, K., Piuri, V., Shah, H.N., Patel, R., Eds.; Springer: Singapore, 2021; Volume 52, pp. 267–282. [Google Scholar] [CrossRef]
- Gerschütz, B.; Sauer, C.; Kormann, A.; Nicklas, S.J.; Goetz, S.; Roppel, M.; Tremmel, S.; Paetzold-Byhain, K.; Wartzack, S. Digital Engineering Methods in Practical Use during Mechatronic Design Processes. Designs 2023, 7, 93. [Google Scholar] [CrossRef]
- Azevedo, A.; Santos, M.F. KDD, SEMMA and CRISP-DM: A Parallel Overview. In Proceedings of the IADIS European Conference on Data Mining 2008, Amsterdam, The Netherlands, 24–26 July 2008; Abraham, A., Ed.; IADIS: Lisbon, Portugal, 2008; pp. 182–185. [Google Scholar]
- Chapman, P.; Clinton, J.; Kerber, R.; Khabaza, T.; Reinartz, T.; Shearer, C.; Wirth, R. CRISP-DM 1.0 Step-by-Step Data Mining Guide; The CRISP-DM Consortium: Chicago, IL, USA, 2000. [Google Scholar]
- Mehlstäubl, J.; Nicklas, S.; Gerschütz, B.; Sprogies, N.; Schleich, B.; Lohner, T.; Wartzack, S.; Stahl, K.; Paetzold, K. Voraussetzungen Für Den Einsatz Datengetriebener Methoden in Der Produktentwicklung. In Proceedings of the DS 111: Proceedings of the 32nd Symposium Design for X. The Design Society, Virtual, 27–28 September 2021. [Google Scholar] [CrossRef]
- ISO 9001:2015; Quality Management Systems. ISO: Geneva, Switzerland, 2015.
- Dumas, M.; La Rosa, M.; Mendling, J.; Reijers, H.A. Fundamentals of Business Process Management, 2nd ed.; Springer: Berlin/Heidelberg, Germany, 2018. [Google Scholar] [CrossRef]
- Scheer, A.W. ARIS—Business Process Modeling; Springer: Berlin/Heidelberg, Germany, 2000. [Google Scholar] [CrossRef]
- Grover, V.; Kettinger, W.J. (Eds.) Process Think: Winning Perspectives for Business Change in the Information Age; Idea Group Pub: Hershey, PA, USA, 2000. [Google Scholar]
- Weske, M. Business Process Management: Concepts, Languages, Architectures; Springer: Berlin/Heidelberg, Germany, 2007. [Google Scholar] [CrossRef]
- Schmelzer, H.J.; Sesselmann, W. Geschäftsprozessmanagement in der Praxis: Kunden Zufriedenstellen, Produktivität Steigern, Wert Erhöhen, 9th ed.; Hanser: München, Germany, 2020. [Google Scholar]
- Grover, V.; Malhotra, M.K. Business Process Reengineering: A Tutorial on the Concept, Evolution, Method, Technology and Application. J. Oper. Manag. 1997, 15, 193–213. [Google Scholar] [CrossRef]
- Susanto, H.; Fang-Yie, L.; Chen, C.K. Business Process Reengineering: An ICT Approach, 1st ed.; Apple Academic Press: Oakville, ON, Canada, 2019. [Google Scholar]
- Mason-Jones, R.; Towill, D.R. Total Cycle Time Compression and the Agile Supply Chain. Int. J. Prod. Econ. 1999, 62, 61–73. [Google Scholar] [CrossRef]
- Farris, J.A.; Van Aken, E.M.; Doolen, T.L.; Worley, J. Critical Success Factors for Human Resource Outcomes in Kaizen Events: An Empirical Study. Int. J. Prod. Econ. 2009, 117, 42–65. [Google Scholar] [CrossRef]
- Schroeder, R.G.; Linderman, K.; Liedtke, C.; Choo, A.S. Six Sigma: Definition and Underlying Theory. J. Oper. Manag. 2008, 26, 536–554. [Google Scholar] [CrossRef]
- Stacey, M.; Eckert, C.; Hillerbrand, R. Process Models: Plans, Predictions, Proclamations or Prophecies? Res. Eng. Des. 2020, 31, 83–102. [Google Scholar] [CrossRef]
- Sharp, A.; McDermott, P. Workflow Modeling Tools for Process Improvement and Applications Development; Artech House: Boston, MA, USA, 2009. [Google Scholar]
- Brenner, J. Lean Administration: Verschwendung in Büros Erkennen, Analysieren und Beseitigen; Praxisreihe Qualitätswissen; Hanser: München, Germany, 2018. [Google Scholar]
- Best, E.; Weth, M. Geschäftsprozesse Optimieren: Der Praxisleitfaden für Erfolgreiche Reorganisation; Gabler Verlag/GWV Fachverlage GmbH: Wiesbaden, Germany, 2009. [Google Scholar]
- Gerschütz, B.; Spießl, B.V.M.; Schleich, B.; Wartzack, S. An Adapted Method for Design Process Capturing to Meet the Challenges of Digital Product Development. In Proceedings of the International Conference on Engineering Design (ICED21), Gothenburg, Sweden, 16–20 August 2021; Volume 1, pp. 365–374. [Google Scholar] [CrossRef]
- Russell, N.; ter Hofstede, A.H.M.; Edmond, D.; van der Aalst, W.M.P. Workflow Data Patterns: Identification, Representation and Tool Support. In Conceptual Modeling—ER 2005, Proceedings of the 24th International Conference on Conceptual Modeling, Klagenfurt, Austria, 24–28 October 2005; Lecture Notes in Computer Science; Delcambre, L., Kop, C., Mayr, H.C., Mylopoulos, J., Pastor, O., Eds.; Springer: Berlin/Heidelberg, Germany, 2005; pp. 353–368. [Google Scholar] [CrossRef]
- van der Aalst, W.; ter Hofstede, A.; Kiepuszewski, B.; Barros, A. Workflow Patterns. Distrib. Parallel Databases 2003, 14, 5–51. [Google Scholar] [CrossRef]
- Booch, G.; Rumbaugh, J.; Jacobson, I. The Unified Modeling Language User Guide, 2nd ed.; Addison-Wesley: Upper Saddle River, NJ, USA, 2005. [Google Scholar]
- Business Process Model and Notation (BPMN), Version 2.0.2. 2013. Available online: https://www.omg.org/spec/BPMN/2.0.2/PDF (accessed on 7 January 2024).
- Scheer, A.W.; Thomas, O.; Adam, O. Process Modeling Using Event-Driven Process Chains. In Process-Aware Information Systems; Dumas, M., Van Der Aalst, W.M.P., Ter Hofstede, A.H.M., Eds.; John Wiley & Sons, Inc.: Hoboken, NJ, USA, 2005; pp. 119–145. [Google Scholar] [CrossRef]
- Rother, M.; Shook, J. Learning to See: Value-Stream Mapping to Create Value and Eliminate Muda, ; Version 1.5; 20th Anniversary Edition; Lean Enterprise Inst: Boston, MA, USA, 2018. [Google Scholar]
- Meyer, A.; Smirnov, S.; Weske, M. Data in Business Processes. EMISA Forum 2011, 31, 5–31. [Google Scholar]
- Trauer, J.; Wöhr, F.; Eckert, C.; Kannengiesser, U.; Knippenberg, S.; Sankowski, O.; Zimmermann, M. Criteria for Selecting Design Process Modelling Approaches. Proc. Des. Soc. 2021, 1, 791–800. [Google Scholar] [CrossRef]
- Wynn, D.C.; Clarkson, P.J. Process Models in Design and Development. Res. Eng. Des. 2018, 29, 161–202. [Google Scholar] [CrossRef]
- Eppinger, S.D.; Browning, T.R. Design Structure Matrix Methods and Applications; Engineering Systems; MIT Press: Cambridge, MA, USA, 2012. [Google Scholar]
- Smith, R.P.; Morrow, J.A. Product Development Process Modeling. Des. Stud. 1999, 20, 237–261. [Google Scholar] [CrossRef]
- Kossak, F.; Illibauer, C.; Geist, V.; Natschläger, C.; Ziebermayr, T.; Freudenthaler, B.; Kopetzky, T.; Schewe, K.D. Hagenberg Business Process Modelling Method; Springer International Publishing: Cham, Switzerland, 2016. [Google Scholar] [CrossRef]
- Kobayashi, I. 20 Keys to Workplace Improvement; rev. and expanded ed.; Productivity Press: Portland, OR, USA, 1995. [Google Scholar]
- Helmold, M. Quality Excellence Models. In Virtual and Innovative Quality Management across the Value Chain: Industry Insights, Case Studies and Best Practices; Springer International Publishing: Cham, Switzerland, 2023; pp. 87–97. [Google Scholar] [CrossRef]
- Appelfeller, W.; Feldmann, C. Die Digitale Transformation des Unternehmens: Systematischer Leitfaden mit Zehn Elementen zur Strukturierung und Reifegradmessung; Springer Gabler: Berlin/Heidelberg, Germany, 2018. [Google Scholar] [CrossRef]
- North, K.; Aramburu, N.; Lorenzo, O.J. Promoting Digitally Enabled Growth in SMEs: A Framework Proposal. J. Enterp. Inf. Manag. 2019, 33, 238–262. [Google Scholar] [CrossRef]
- Petzolt, S.; Hölzle, K.; Kullik, O.; Gergeleit, W.; Radunski, A. Organisational digital transformation of SMEs—Development and application of a digital transformation maturity model for business model transformation. Int. J. Innov. Manag. 2022, 26, 2240017. [Google Scholar] [CrossRef]
- Britze, N.; Schulze, A.; Fenge, K.; Woltering, M.; Gross, M.; Menge, F.; Mucke, A.; Ensinger, A.; Keller, H.; Oldenburg, L.; et al. Reifegradmodell Digitale Geschäftsprozesse; Bitkom: Berlin, Germany, 2020. [Google Scholar]
- Zhu, L.; Johnsson, C.; Varisco, M.; Schiraldi, M.M. Key Performance Indicators for Manufacturing Operations Management–Gap Analysis between Process Industrial Needs and ISO 22400 Standard. Procedia Manuf. 2018, 25, 82–88. [Google Scholar] [CrossRef]
- Vajna, S.; Weber, C.; Zeman, K.; Hehenberger, P.; Gerhard, D.; Wartzack, S. CAx für Ingenieure: Eine Praxisbezogene Einführung; 3rd, vollständig neu bearbeitete auflage ed.; Springer Vieweg: Berlin, Germany, 2018. [Google Scholar]
- Roelofsen, J.; Lindemann, U. An Approach Towards Planning Development Processes According to the Design Situation. In Modelling and Management of Engineering Processes; Heisig, P., Clarkson, P.J., Vajna, S., Eds.; Springer: London, UK, 2010; pp. 41–52. [Google Scholar] [CrossRef]
- Gonnet, S.; Henning, G.; Leone, H. A Model for Capturing and Representing the Engineering Design Process. Expert Syst. Appl. 2007, 33, 881–902. [Google Scholar] [CrossRef]
- Blessing, L.T.; Chakrabarti, A. DRM, a Design Research Methodology; Springer: London, UK, 2009. [Google Scholar] [CrossRef]
- Mehlstäubl, J.; Atzberger, A.; Paetzold, K. General Approach to Support Modelling of Data and Information Flows in Product Development. In Proceedings of the Balancing Innovation and Operation—The Design Society, Lyngby, Denmark, 12–14 August 2020. [Google Scholar] [CrossRef]
- Becker, J.; Rosemann, M.; von Uthmann, C. Guidelines of Business Process Modeling. In Business Process Management: Models, Techniques, and Empirical Studies; van der Aalst, W., Desel, J., Oberweis, A., Eds.; Springer: Berlin/Heidelberg, Germany, 2000; pp. 30–49. [Google Scholar] [CrossRef]
- Gerschütz, B.; Goetz, S.; Wartzack, S. Realization of the Digital Transformation in Product Development—Processes, Methods and Application. Z. Wirtsch. Fabr. 2023, 118, 163–168. [Google Scholar] [CrossRef]
- Gerschütz, B.; Goetz, S.; Wartzack, S. AI4PD—Towards a Standardized Interconnection of Artificial Intelligence Methods with Product Development Processes. Appl. Sci. 2023, 13, 3002. [Google Scholar] [CrossRef]
- International Electrotechnical Committee. DIN IEC 60050-351:2014-09, International Electrotechnical Vocabulary-Part 351: Control Technology (IEC 60050-351:2013); International Electrotechnical Committee: Geneva, Switzerland, 2014. [Google Scholar] [CrossRef]


| Scale | Level 1 | Level 2 | Level 3 | Level 4 | Level 5 |
|---|---|---|---|---|---|
| Likert | Not digital | Mostly not digital | Partly digital | Mostly digital | Fully digital |
| Percentage | Less than | 20– | 40– | 60– | More than |
| Consent | Not applicable | Mostly not applicable | Partly applicable | Mostly applicable | Applicable |
| Aspect | Likert | Percentage | Consent |
|---|---|---|---|
| Technology | |||
| Technology basis | x | ||
| Tools | x | ||
| System integration | x | ||
| Media discontinuity | x | ||
| Data | |||
| Data acquisition | x | ||
| Data transfer | x | ||
| Data provision | x | ||
| Data usage | x | ||
| Quality | |||
| Operation | x | ||
| Traceability | x | ||
| Transfer time | x | ||
| Security | x | ||
| Organisation | |||
| Responsibility | x | ||
| Qualification | x | ||
| Gateways | x | ||
| Knowledge-based work | x |
Disclaimer/Publisher’s Note: The statements, opinions and data contained in all publications are solely those of the individual author(s) and contributor(s) and not of MDPI and/or the editor(s). MDPI and/or the editor(s) disclaim responsibility for any injury to people or property resulting from any ideas, methods, instructions or products referred to in the content. |
© 2024 by the authors. Licensee MDPI, Basel, Switzerland. This article is an open access article distributed under the terms and conditions of the Creative Commons Attribution (CC BY) license (https://creativecommons.org/licenses/by/4.0/).
Share and Cite
Gerschütz, B.; Consten, Y.; Goetz, S.; Wartzack, S. PADDME—Process Analysis for Digital Development in Mechanical Engineering. Processes 2024, 12, 173. https://doi.org/10.3390/pr12010173
Gerschütz B, Consten Y, Goetz S, Wartzack S. PADDME—Process Analysis for Digital Development in Mechanical Engineering. Processes. 2024; 12(1):173. https://doi.org/10.3390/pr12010173
Chicago/Turabian StyleGerschütz, Benjamin, Yvonne Consten, Stefan Goetz, and Sandro Wartzack. 2024. "PADDME—Process Analysis for Digital Development in Mechanical Engineering" Processes 12, no. 1: 173. https://doi.org/10.3390/pr12010173
APA StyleGerschütz, B., Consten, Y., Goetz, S., & Wartzack, S. (2024). PADDME—Process Analysis for Digital Development in Mechanical Engineering. Processes, 12(1), 173. https://doi.org/10.3390/pr12010173