Article

Improving the Energy Efficiency of the Production of Pipes Welded with High-Frequency Induction

1
Steelworks HUTA ŁABĘDY S.A., 44-109 Gliwice, Poland
2
Faculty of Production Engineering and Materials Technology, Czestochowa University of Technology, Al. Armii Krajowej 19, 42-200 Częstochowa, Poland
3
Faculty of Mechanical Engineering, Silesian University of Technology, Konarskiego 18A, 44-100 Gliwice, Poland
*
Authors to whom correspondence should be addressed.
Processes 2023, 11(9), 2798; https://doi.org/10.3390/pr11092798
Submission received: 28 August 2023 / Revised: 16 September 2023 / Accepted: 18 September 2023 / Published: 20 September 2023
(This article belongs to the Special Issue Processing, Manufacturing and Properties of Metal and Alloys)

Abstract

:
This article presents the technical aspects that may reduce electric power consumption during the welding of pipes with the high-frequency induction (HFI) method. Experiments were carried out at Huta Łabędy S.A. Steelworks, during the test production of 323.9 × 5.6 mm pipes of P235GH steel grade. Two sets of HFI heating system settings were studied: with a variable squeeze force of the heated edges and a variable position of the inductor in relation to the welding point. It was proven that the temperature at the welding point increased due to the stronger squeeze of the heated edges, which reduced the electric power consumption. Reducing the distance of the inductor relative to the welding point had the same effect. By optimizing the squeeze force and the position of the inductor, energy consumption was reduced by about 5.5%. Microstructural studies of the welds did not show any adverse effects of the optimization.

1. Introduction

The high-frequency induction (HFI) method is mainly used to manufacture pipes from strips. The process is performed by a multiroll sheeting system. After leaving the last forming stand, the pipe has a longitudinal gap which is closed by welding. The joint is formed by metal-to-metal contact, with indirect melting. The edges of the strip are joined together by a pair of horizontal squeeze rolls to form a hot diffusion bond [1].
The essence of HFI heating is a very high energy density. Thanks to this, it is possible to cause local remelting of the metal before heat from the heating area spreads over its entire volume. Induction-heated materials usually have high coefficients of thermal conductivity, which promotes the spread of heat [2].
In the case of pipe welding, a current induced along the edges flows to the point of the edge bonding. This makes it possible to heat the metal quickly. Then, the squeeze force pushes all impurities outside the welded surface, resulting in a joint structure like that after forging, instead of the typical casting one, which arises in most welding processes [3,4,5,6].
The process of HFI welding of pipes is shown in Figure 1. In this diagram, appropriate letter markings are related to the following: A—the pipe diameter, B—the distance between the center of the inductor and the centers of the horizontal (side) squeeze rolls, C—the diameter of the squeeze rolls, D—the length of the inductor, E—the distance between the centers of the rolls of the squeeze stand and the centers of the rolls of the fin-pass stand, F—the length of the ferrites, G—the internal diameter of the inductor, and H—the distance between the end of the inductor and the rolls of the squeeze stand.
Heating occurs due to the flow in the pipe structure of source currents generated in the inductor (letter “D” in Figure 1) and eddy currents generated in the pipe material [7]. Ensuring the appropriate density of eddy currents in the welding area requires forcing the concentration of the magnetic field. For this purpose, an element concentrating the magnetic field, commonly referred to as an “impeder”, is used in the system [8,9]. It is a mandrel of ferromagnetic material placed inside the tube (letter “F” in Figure 1).
Particular attention should be paid to the heat-affected zone formed by the so-called “V”. Due to the skin effect and the proximity effect, dense high-frequency currents flow from the inductor, along the edge, to the closing point, and back through the opposite edge. This is the V-zone extending just in front of the closing point [10]. This means that the V-angle and the V-zone length in the HFI method must be as small as possible to maximize the current density and increase the resistive heating effect [11]. The heating capacity of HFI power sources can also be increased by taking advantage of stronger induced currents and higher resistance heating frequencies [12].
From the point of view of the efficiency and quality of the HFI pipe production process, the key parameter is the amount of heat generated to weld the pipe. This amount is set based on the wall thickness and production speed. The amount of heat generated is influenced by the way the pipe is formed, especially the force applied by the horizontal squeeze rolls (letter “C” in Figure 1) of the welding stand (squeeze stand). The amount of input heat, combined with the squeeze force control, affects the quality of the HFI weld. As the squeeze force increases, the angles of distortion of the metal also increase. A greater amount of input heat with a higher squeeze force results in high-strength and good-quality pipes [13]. Equally important for the amount of heat generated is the position of the inductor in relation to the welding point (letter “H” in Figure 1). In order to ensure the proper performance of the heating system, the diameter of the inductor should minimize the distance between the outer diameter of the pipe (letter “A” in Figure 1) and the inner surface of the inductor [14]. To ensure maximum efficiency, i.e., operation with the smallest possible welding energy, both the length of the inductor and its distance from the welding point should be as short as possible [15]. The correct positioning of the inductor increases impedance inside the tube, which can reduce the welding energy without compromising the production speed [16].
Manufacturers of HFI lines recommend setting the inductor so that it is possible to maintain safe operating conditions in the heating system, without specifying its exact position. They also do not specify the squeeze force for the squeeze stand. This force is assessed visually, based on the outer flash size.
The aim of this publication is to present the effect of the correlated parameters of the HFI heating system on electric power consumption and process quality. Reducing energy consumption in the welding process is very important for cutting down production costs. From this point of view, these experiments are important for pipe manufacturers using the HFI method because they can lead to savings, resulting in measurable economic benefits. However, a reduction in energy intake must not lead to flaws in welded pipes. Poorer quality can lead to huge losses and create life- or health-threatening situations. Therefore, HFI welding processes must be designed very precisely so that the weld does not have any discontinuities (defects) [17,18].
The key to minimizing electric power consumption in the HFI process is to use an appropriate configuration of the heating system, i.e., the squeeze force applied to the strip edges in the squeeze stand, and the position of the inductor in relation to the welding point and the welding power (P).
However, for the pipe manufacturer, the most important incentive for using the correct settings of the heating system in the HFI method is the economic aspect. Optimizing the parameters of the welding process can reduce energy consumption.

2. Materials and Methodology

Experiments were carried out on an existing HFI pipe production line at Huta Łabędy S.A. (Gliwice, Poland). This ERW 12¾″ pipe welding line with an API finishing line was manufactured by SMS Group GmbH (Monchengladbach, Germany). The process of production of the test tubes took into account 2 technical parameters, which were changed:
  • The squeeze of the heated edges at the welding point in the process of forming the strips into pipes (parameter 1);
  • The distance of the inductor from the horizontal squeeze rolls (parameter 2).
The tests were carried out on pipes made of the P235GH steel grade with 323.9 mm diameter and 5.6 mm wall thickness, using 4 different parameter sets of the HFI heating system. The energy parameters of the process used in the production of the test tubes were also taken into account: power P [kW] and HFI welding speed [m/min]. Table 1 and Table 2 show the properties of the steel used in the tests. The individual settings of the heating system are presented in Table 3 and Table 4 and a summary list for the 4 parameter sets is provided in Table 5.
The chemical composition of the pipes based on ladle analysis is shown in Table 1. Table 2 contains the results of the testing of the mechanical properties of the pipes. The tests were performed on flat samples taken from the body in the T180 direction in accordance with the EN-ISO 6892-1: 2020 standard [19] by the ZWICK/ROELL Z 330 RED machine (Zwick Roell, Ulm, Germany).
Table 1. Ladle analysis of the P235GH steel [%weight of chemical elements].
CMnSiPS
0.130.440.0060.0120.004
Table 2. Mechanical properties of the P235GH pipe.
Yield Point Re, MPaYield Strength Rm, MPaElongation A5, %
31442334.1
Both the chemical composition and mechanical properties of the steel met the requirements of the EN 10217-2 production standard [20] for the P235GH steel grade.

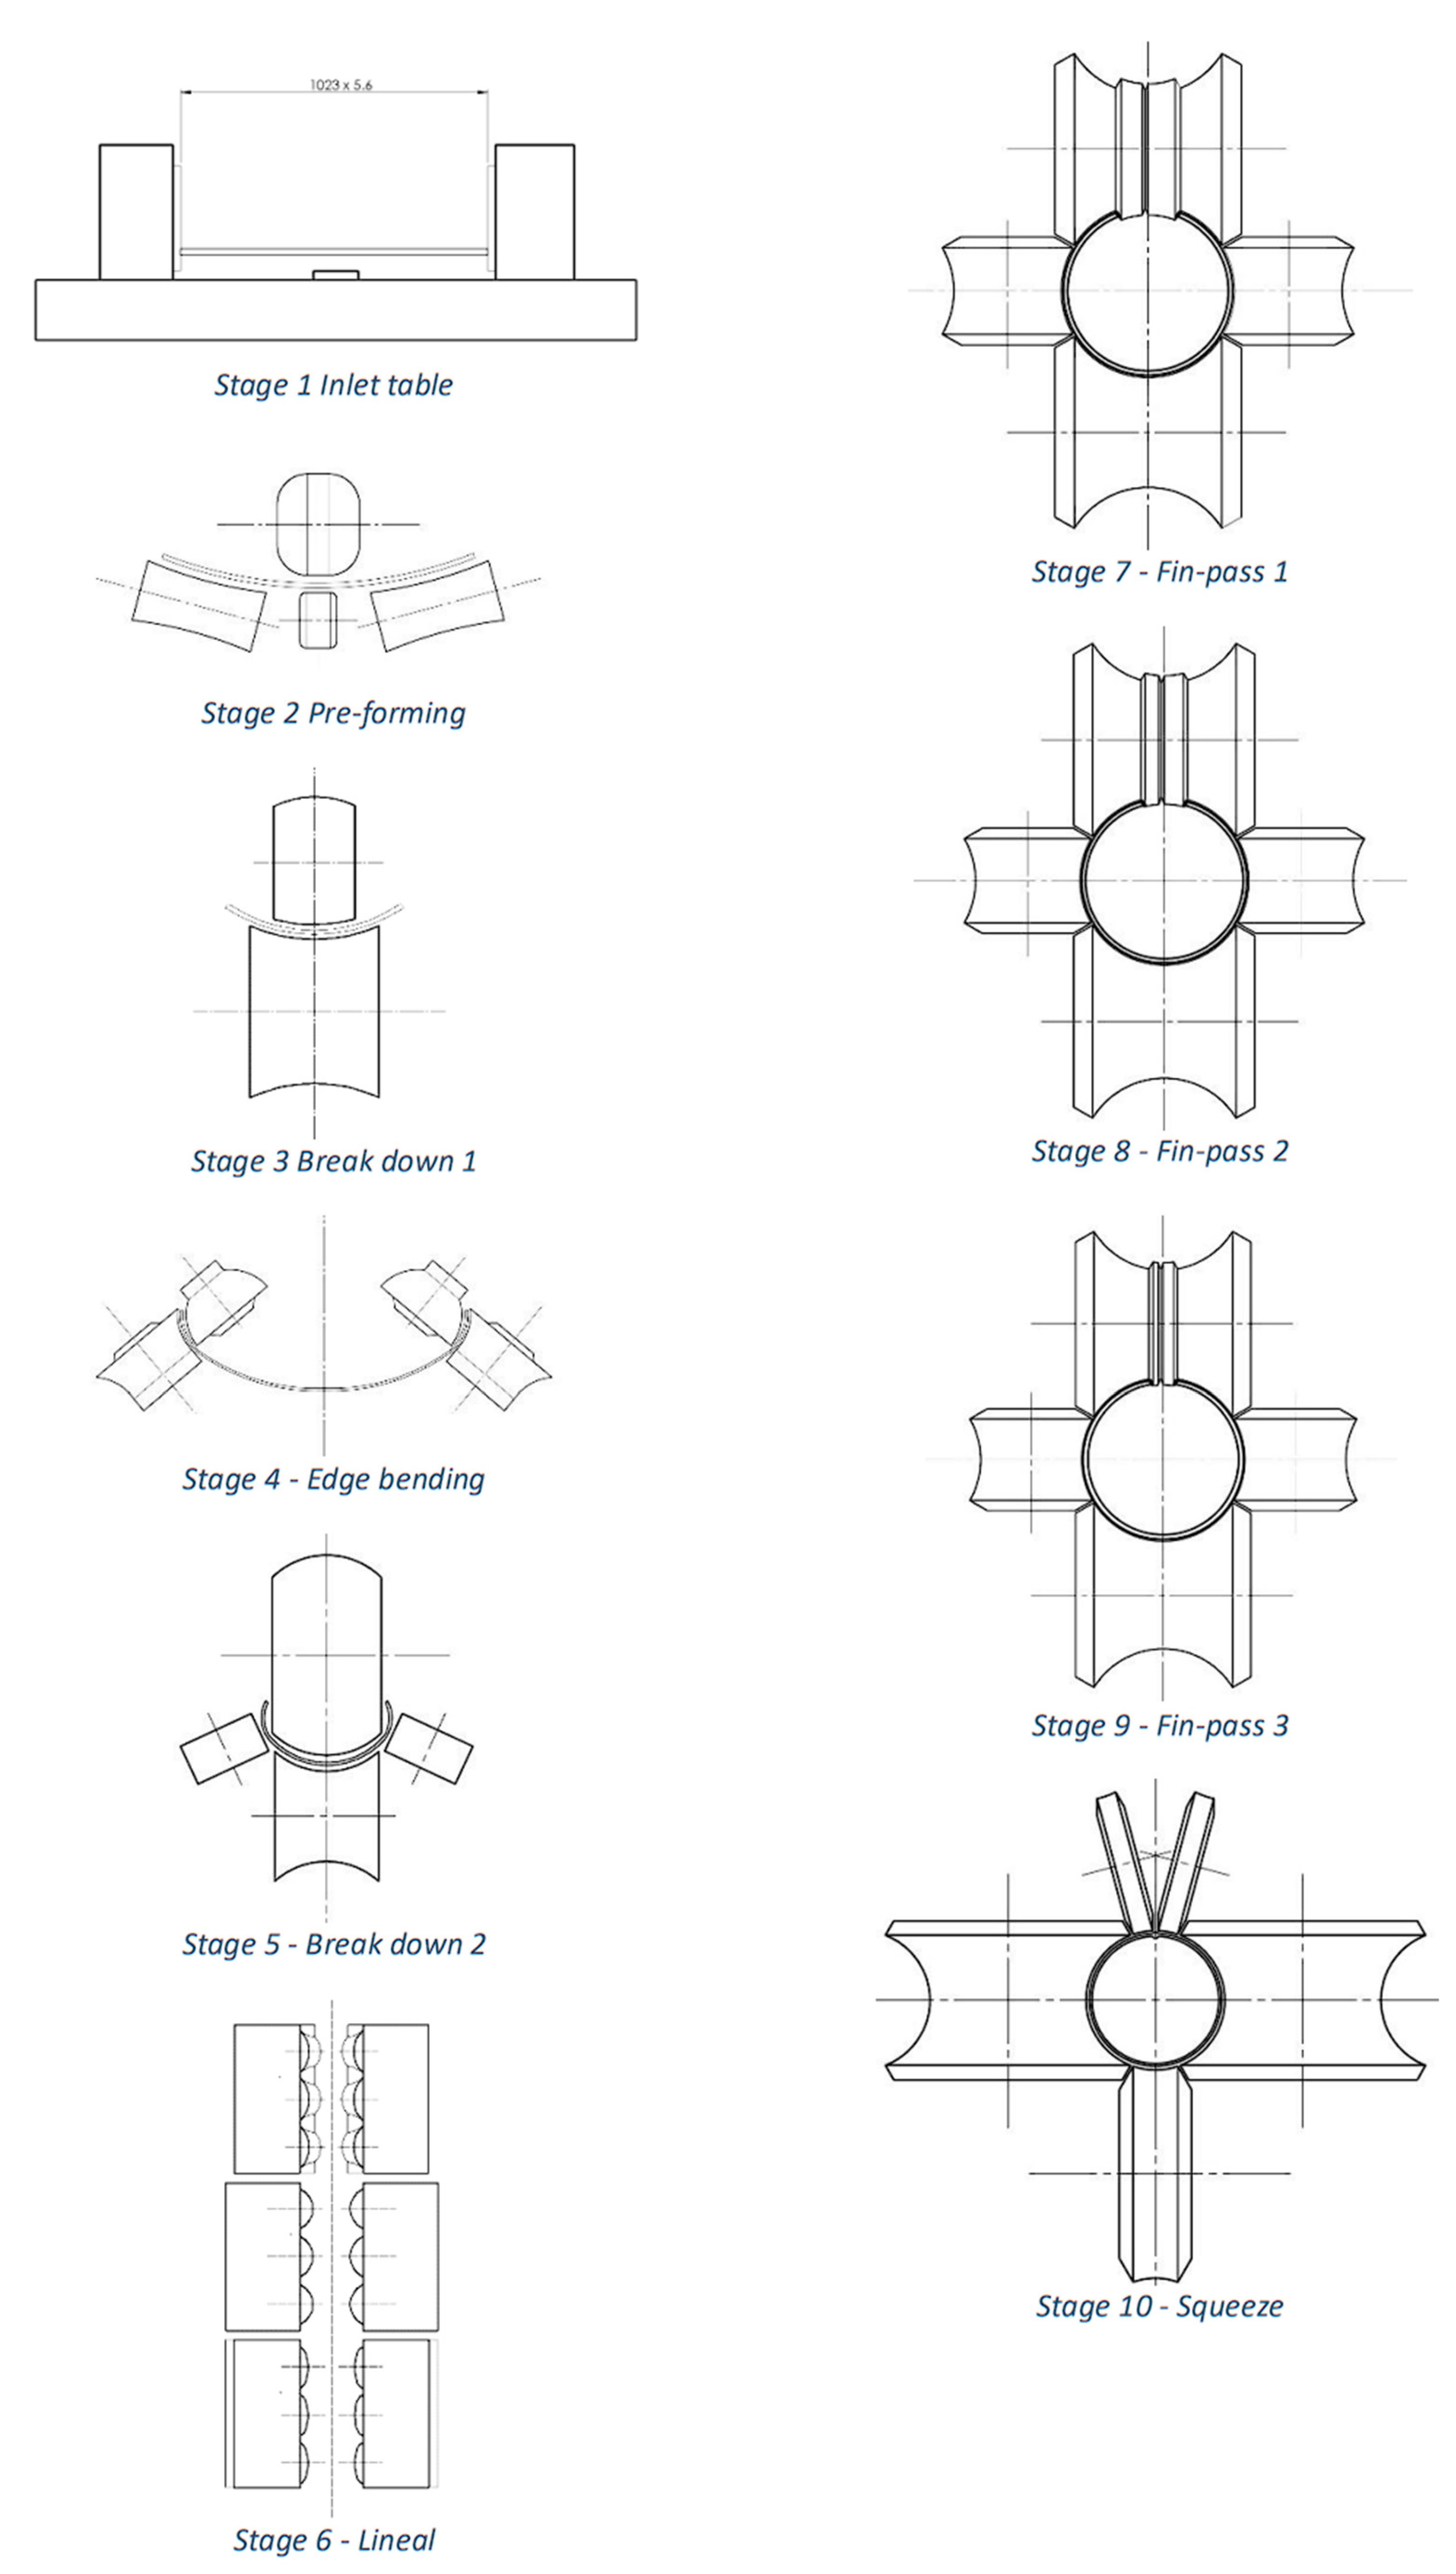
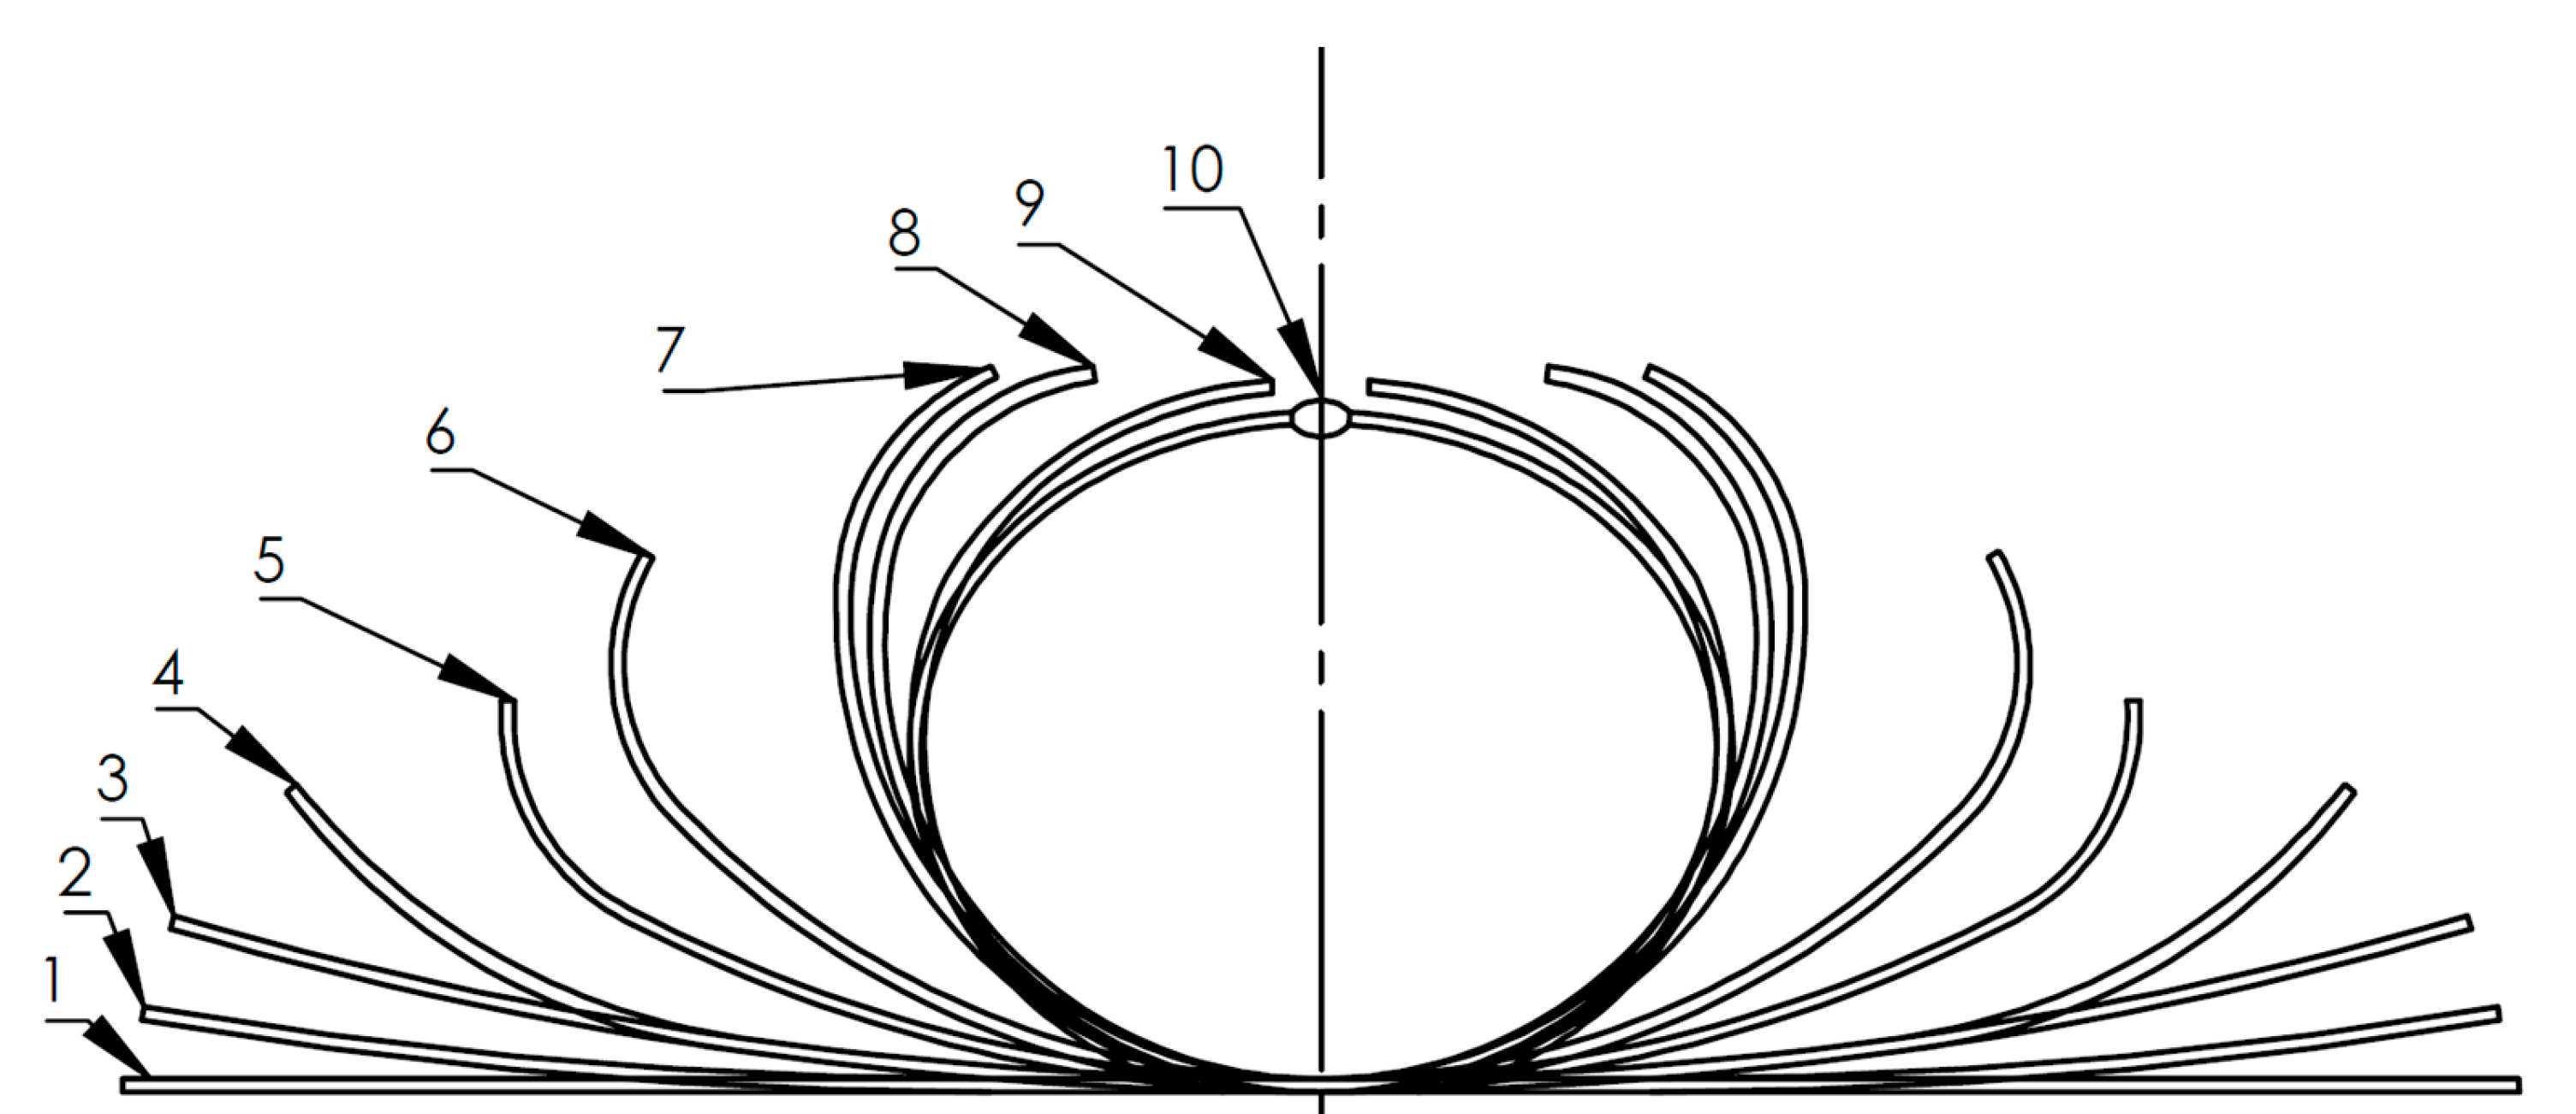
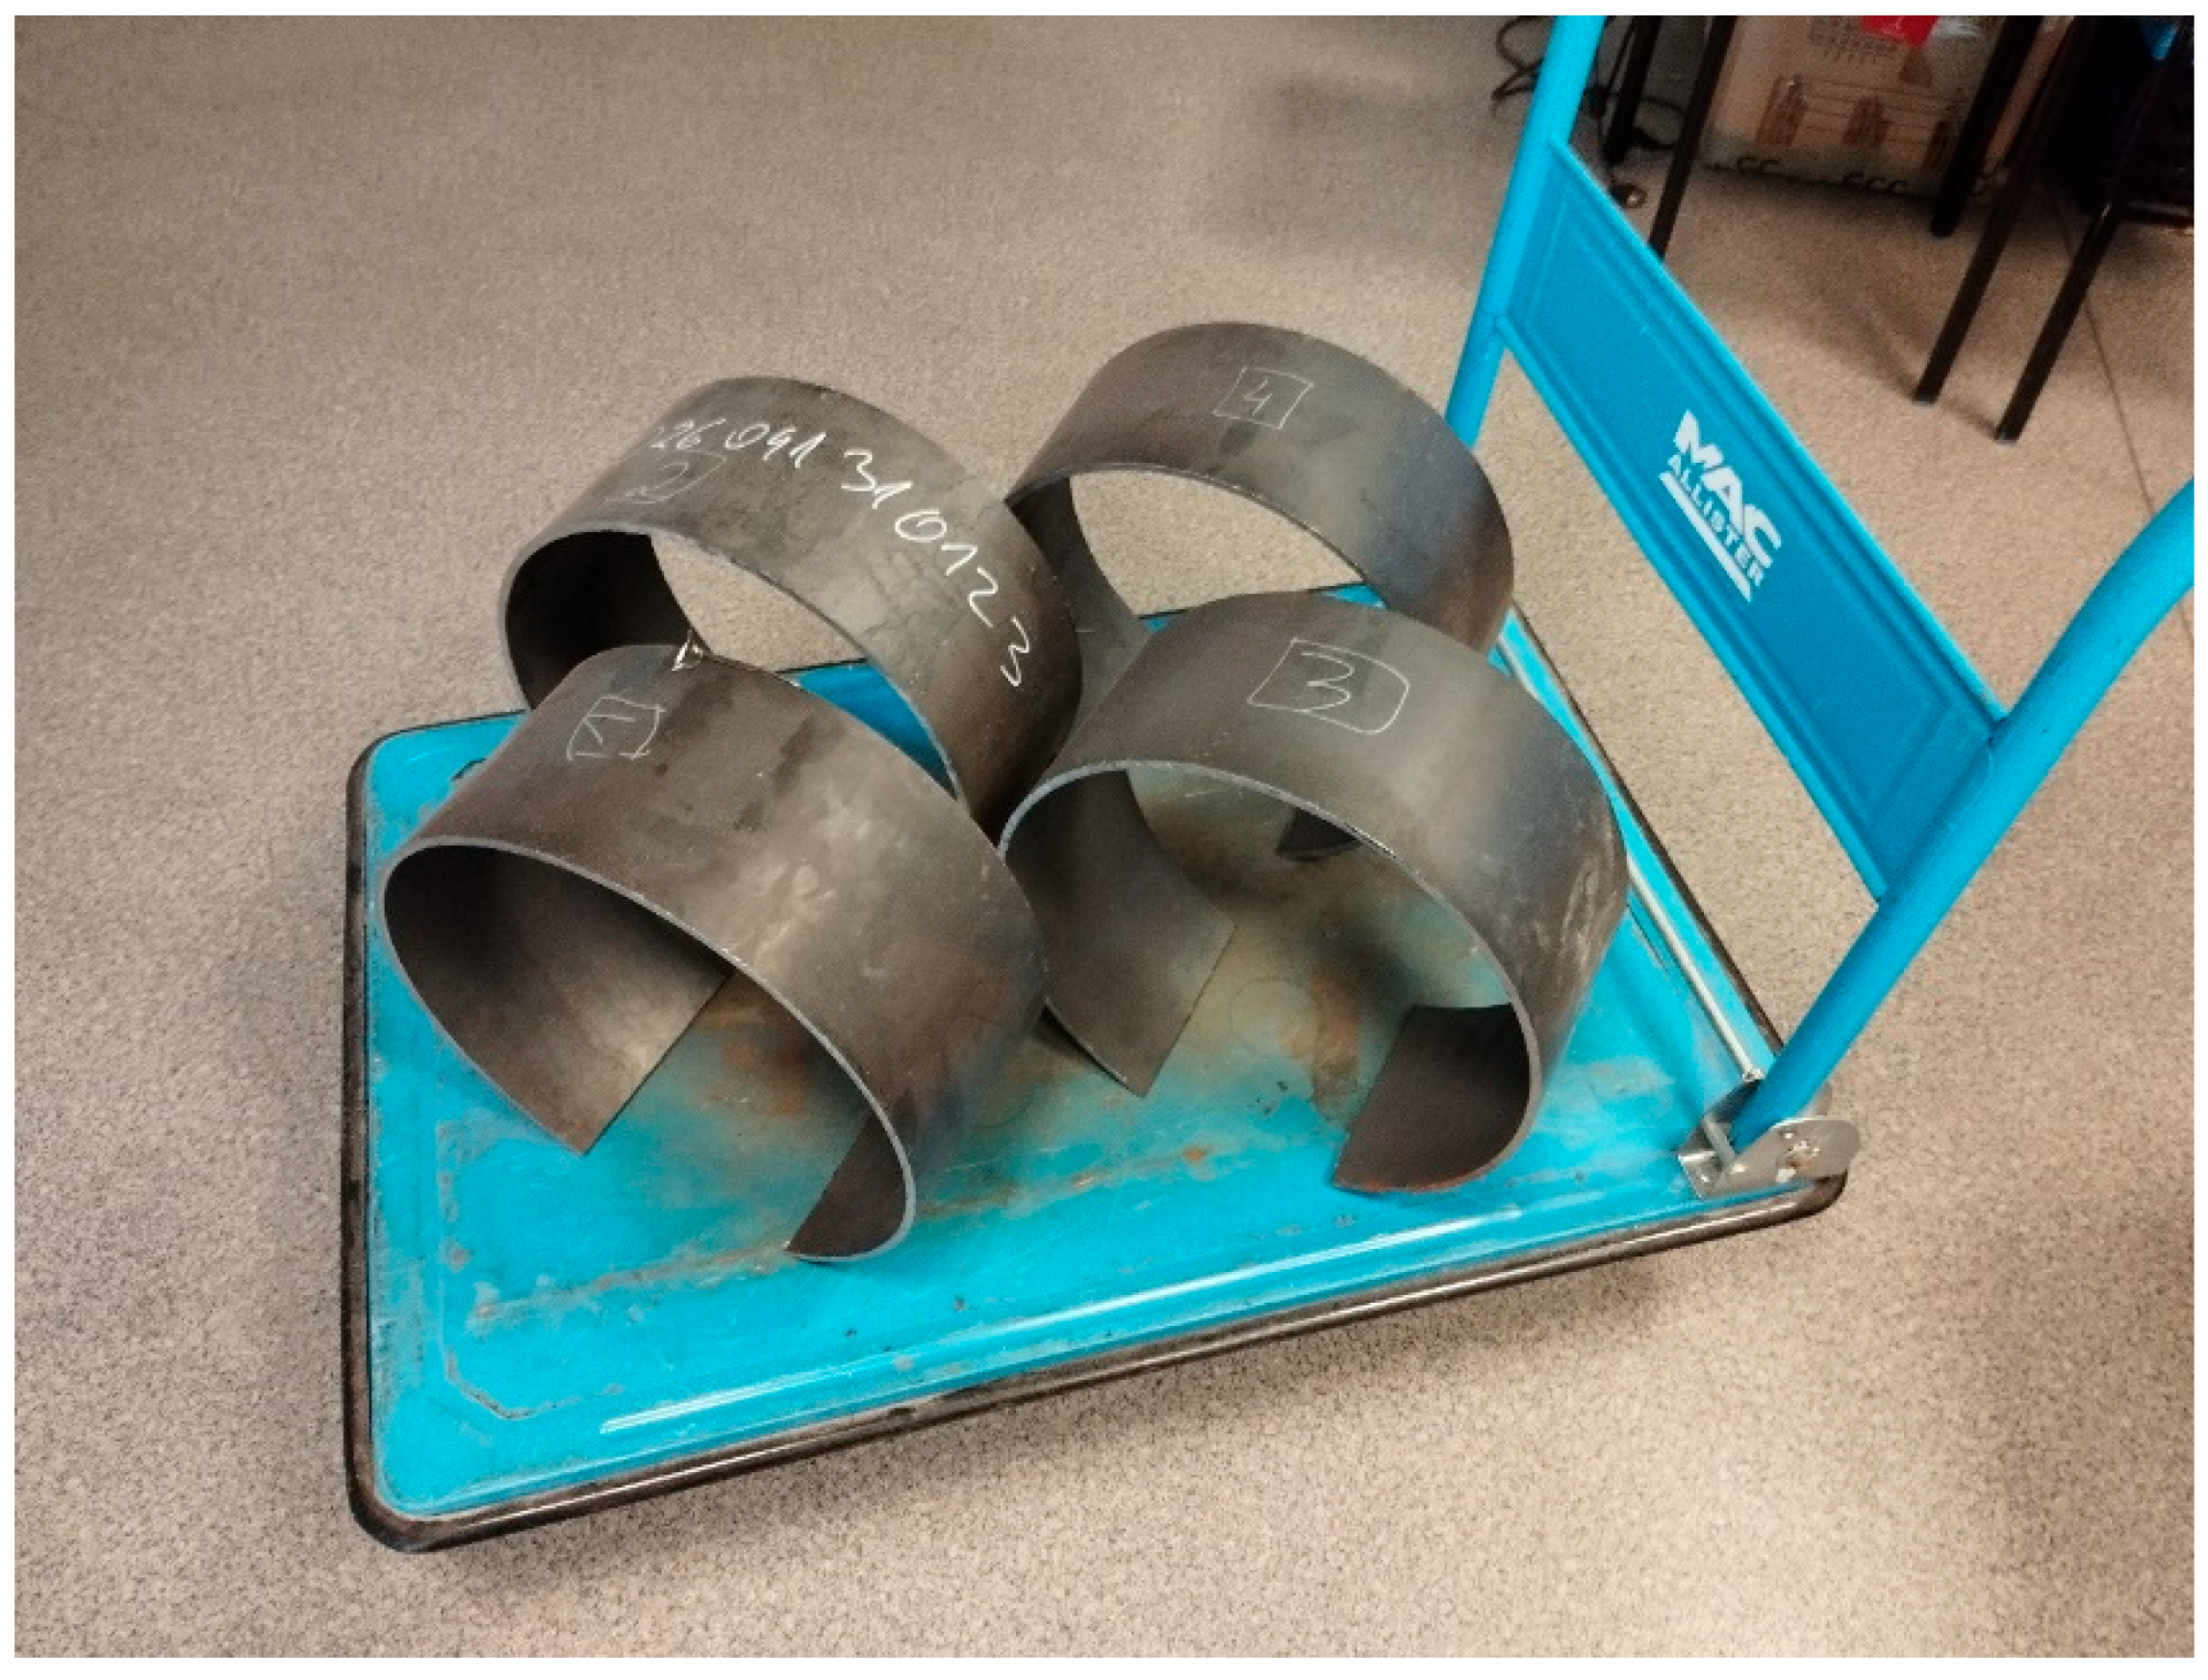
2.1. Shaping the Pipe from the Strip

The process of transforming the strip into the pipe, first open and then closed, is shown in Figure 2.
Before forming the pipe, the P235GH steel strip measuring 1023 × 5.6 mm was unrolled and transported to the strip accumulator section. In the first stage of forming, the strip was introduced into the inlet table (stage 1) and then transported to the preforming stand (stage 2). In stage 3, the strip passed through the breakdown 1 stand, where its central part was bent. In stage 4, the edges of the strip were bent on both sides, after which the strip was transported to the breakdown 2 stand where, in stage 5, it was given the “U” shape. Then, in stage 6, the process of closing the pipe in the lineal forming section began, in which a series of rolls gradually bent the still open tube further. This process continued in three fin-pass forming stands with distinctive fins on the top rolls. These were stages 7, 8, and 9 of the pipe forming. They continued the process of closing the pipe, rounding it, and shaping it to the exact target circumference and geometry. The top fin-pass rolls also prepared the edge surfaces for welding [21]. This is how an even circumference of the pipe with an open seam was created, and the edges of the pipe were precisely driven up to the point of contact in the squeeze stand. This was the last, 10th stage of forming, in which, after heating the edges using the HFI method, the edges were squeezed together, and the pipe was closed [22]. The whole process of changing the geometry of the strip into the pipe is shown in Figure 3.

2.1.1. The Force in the Squeeze Stand—Parameter 1
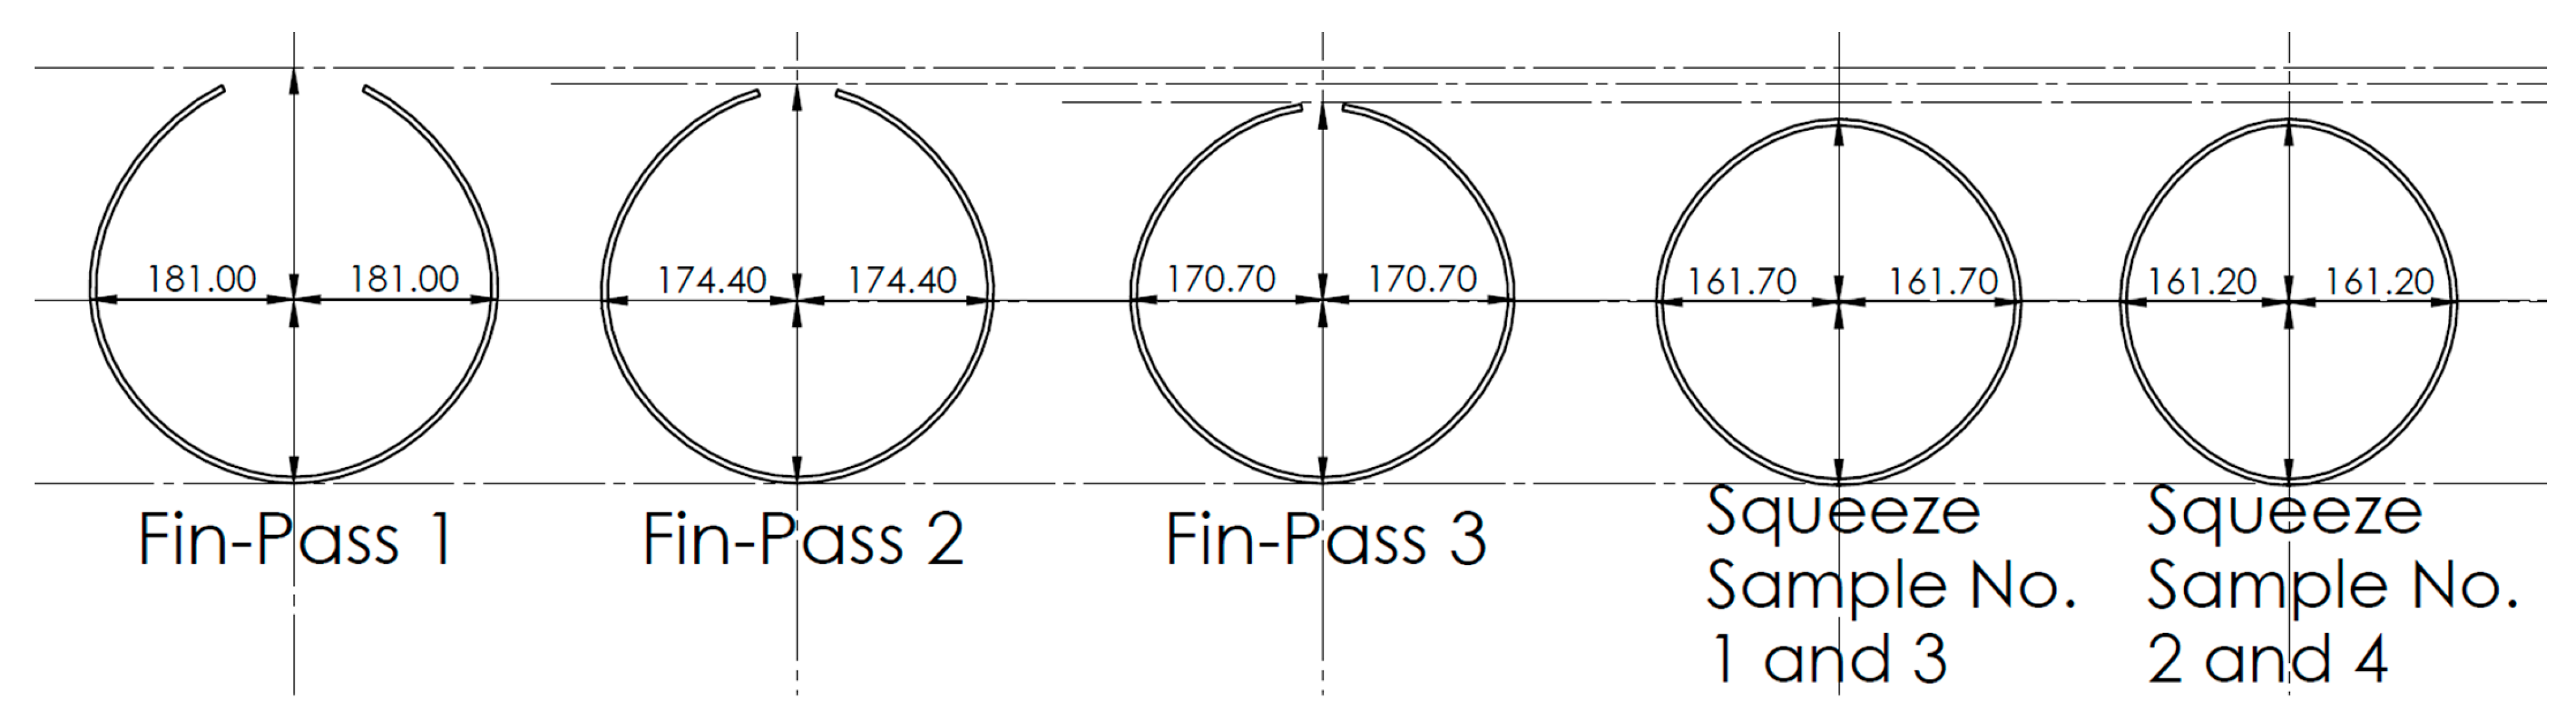
The squeeze stand is the most important element in the HFI pipe production process. In particular, the squeeze of the side rolls and its impact on the shape of the joint were verified. The squeeze stand is shown in Figure 4.
The squeeze at the welding point was expressed as the position of setting the distance of the 2 horizontal side rolls, i.e., W_DR [mm] and W_OP [mm] from the central line of the pipe. This value was calculated as the difference between the radius of the side roll and the working radius set during the tests. Two settings of the working radius of the horizontal squeeze rolls were verified, and the squeeze values are shown in Table 3.
Table 3. Squeeze values based on the horizontal squeeze roll settings.
Sample NoWorking Radius
[mm]
Roll’s Radius
[mm]
Calculated Squeeze [mm]
1, 3161.7163.551.85
2, 4161.2163.552.35
For test samples 1 and 3, the squeeze was 1.85 mm, and for samples 2 and 4, it was increased by 0.5 mm to 2.35 mm.
Figure 5 shows the final steps of the pipe formation in the fin-pass stands and the squeeze in the squeeze stand for the 4 samples.

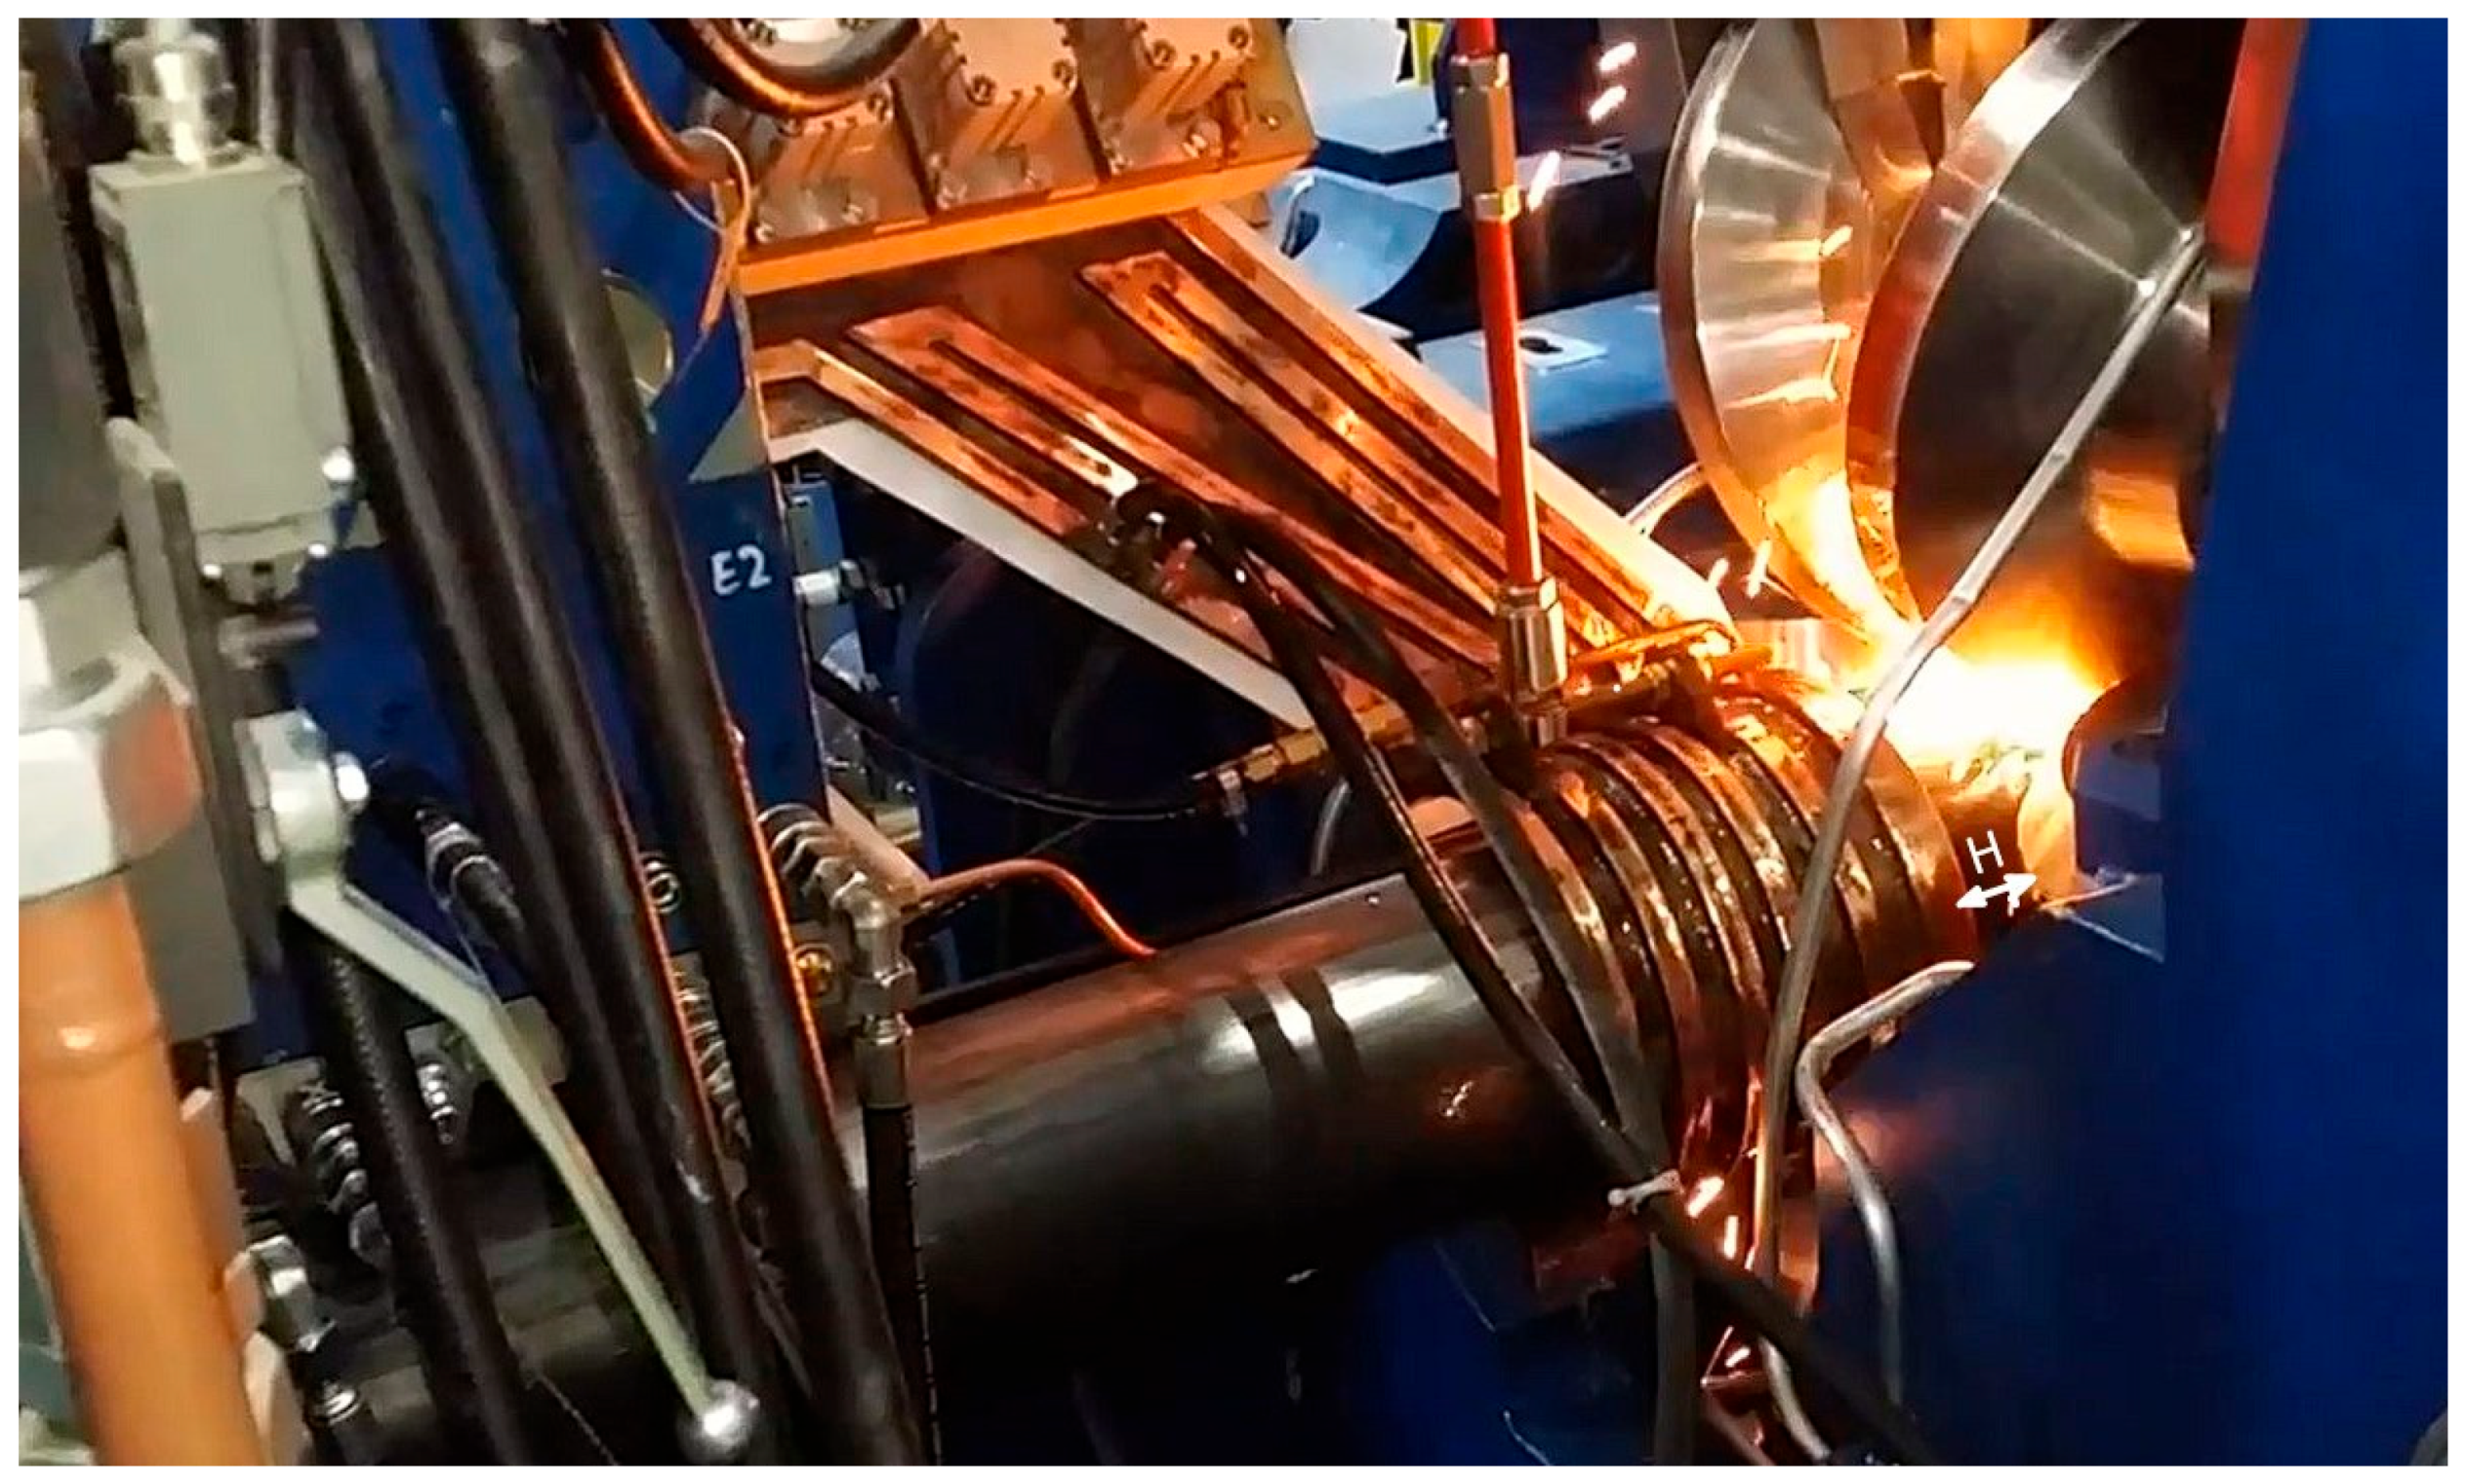
2.1.2. Inductor Position Setting—Parameter 2

After leaving the 3rd fin-pass stand, the open pipe passed through the inductor where high-frequency eddy currents were induced [23,24]. Thanks to this, the convergent edges of the open pipe were heated and squeezed together to form the joint. The inductor is the basic element of the heating system that can be positioned. This is why it was tested as the 2nd parameter. The setting of the inductor is defined by the distance of the end of the inductor from the horizontal rolls of the squeeze stand. This distance is marked with the letter “H” in Figure 6.
Two positions of the inductor in relation to the side squeeze rolls were verified during the tests. H was 50 mm for samples 1 and 2, and 20 mm for samples 3 and 4.

2.1.3. Correlation of the Inductor Position and the Squeeze with Energy Parameters

The samples, numbered from 1 to 4, were welded in different variants of the inductor position and the squeeze value.
Table 4 summarizes all the parameters of the test settings, i.e., the squeeze magnitude and the position of the inductor H, correlated with the HFI process parameters, i.e., power P, welding speed V, and temperature Twp (welding point). The temperature was measured at the surface of the welding lake using an optical pyrometer, and the data were read and processed using SpotViewer software v. Spot_01.
During pipe production, the quality of the obtained joint is tested using on-line ultrasonic tests. These tests are performed just behind the weld point to control the weld quality. In the analyzed case, the minimum temperature at which a high-quality weld could be obtained was approximately 1240 °C; therefore, the power value P presented in Table 4 was also adjusted slightly to maintain this temperature with the changes in position H. The same adjustment was applied for the increased squeeze.
Table 4. The test parameter settings for the 4 samples.
Sample No.P
[kW]
TWP
[°C]
V
[m/min]
H
[mm]
Squeeze
[mm]
1422124124.0201.85
2422129524.0202.35
3427124024.0501.85
4427129624.0502.35

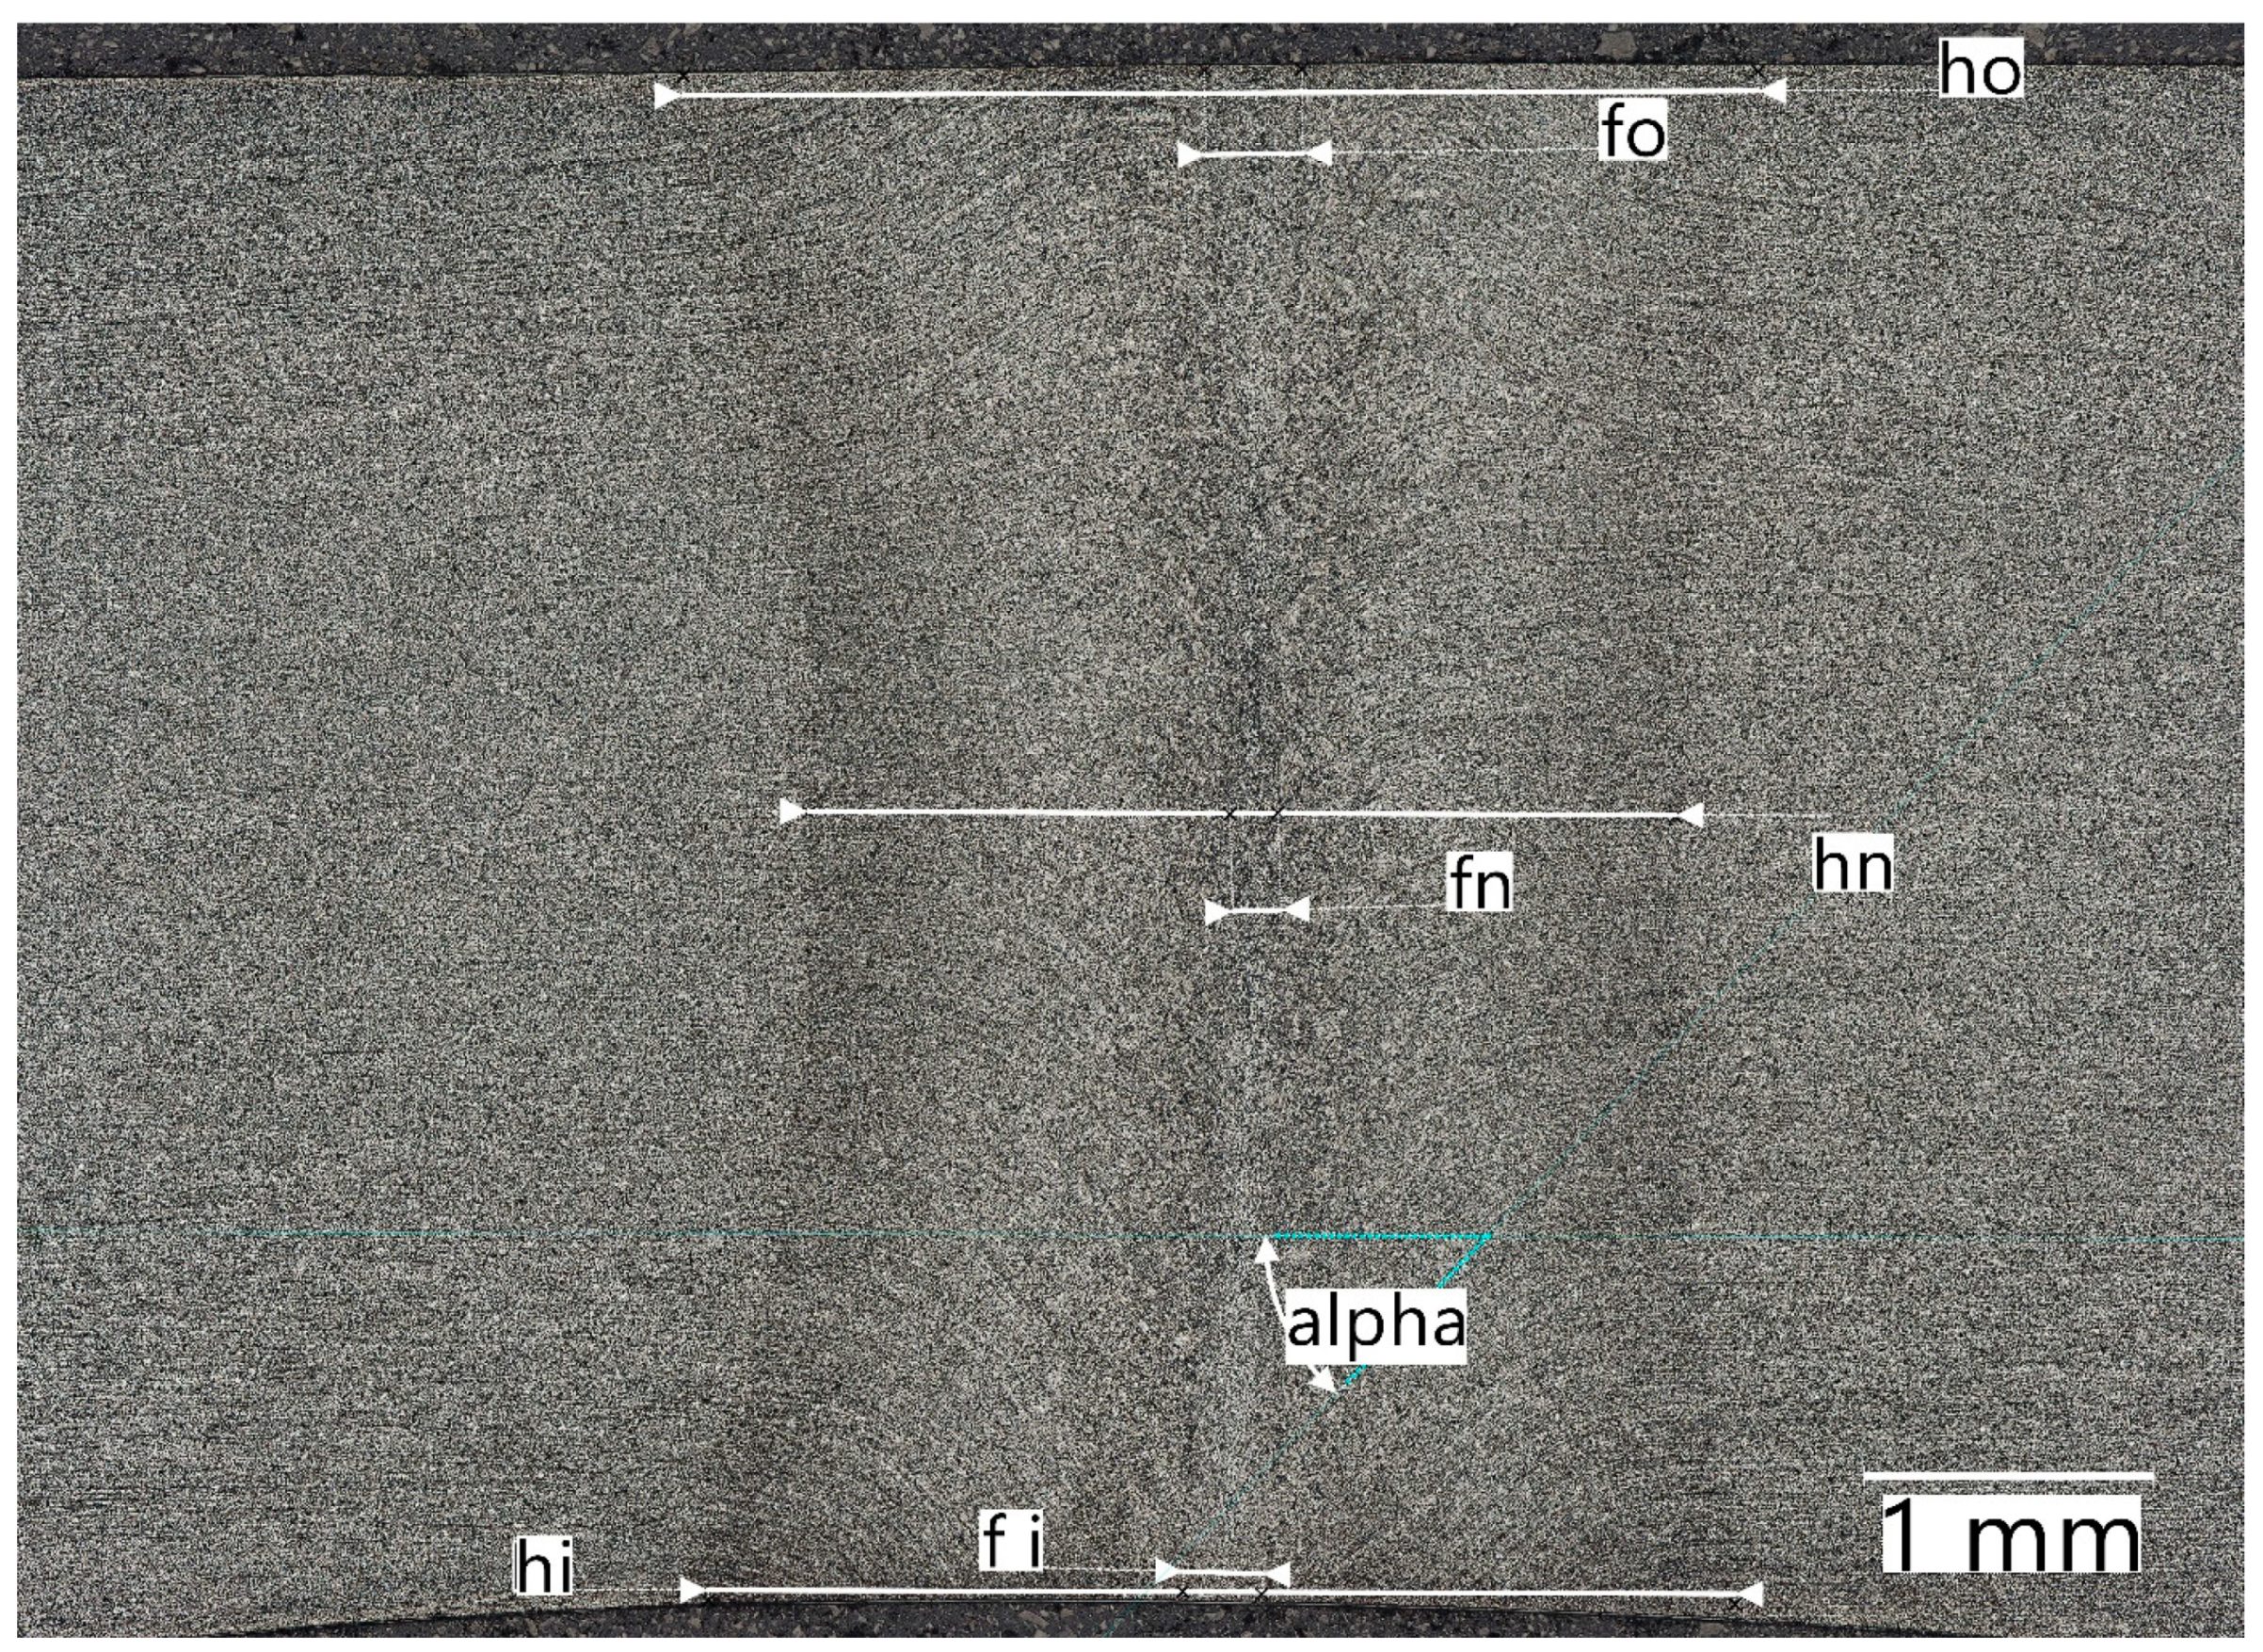
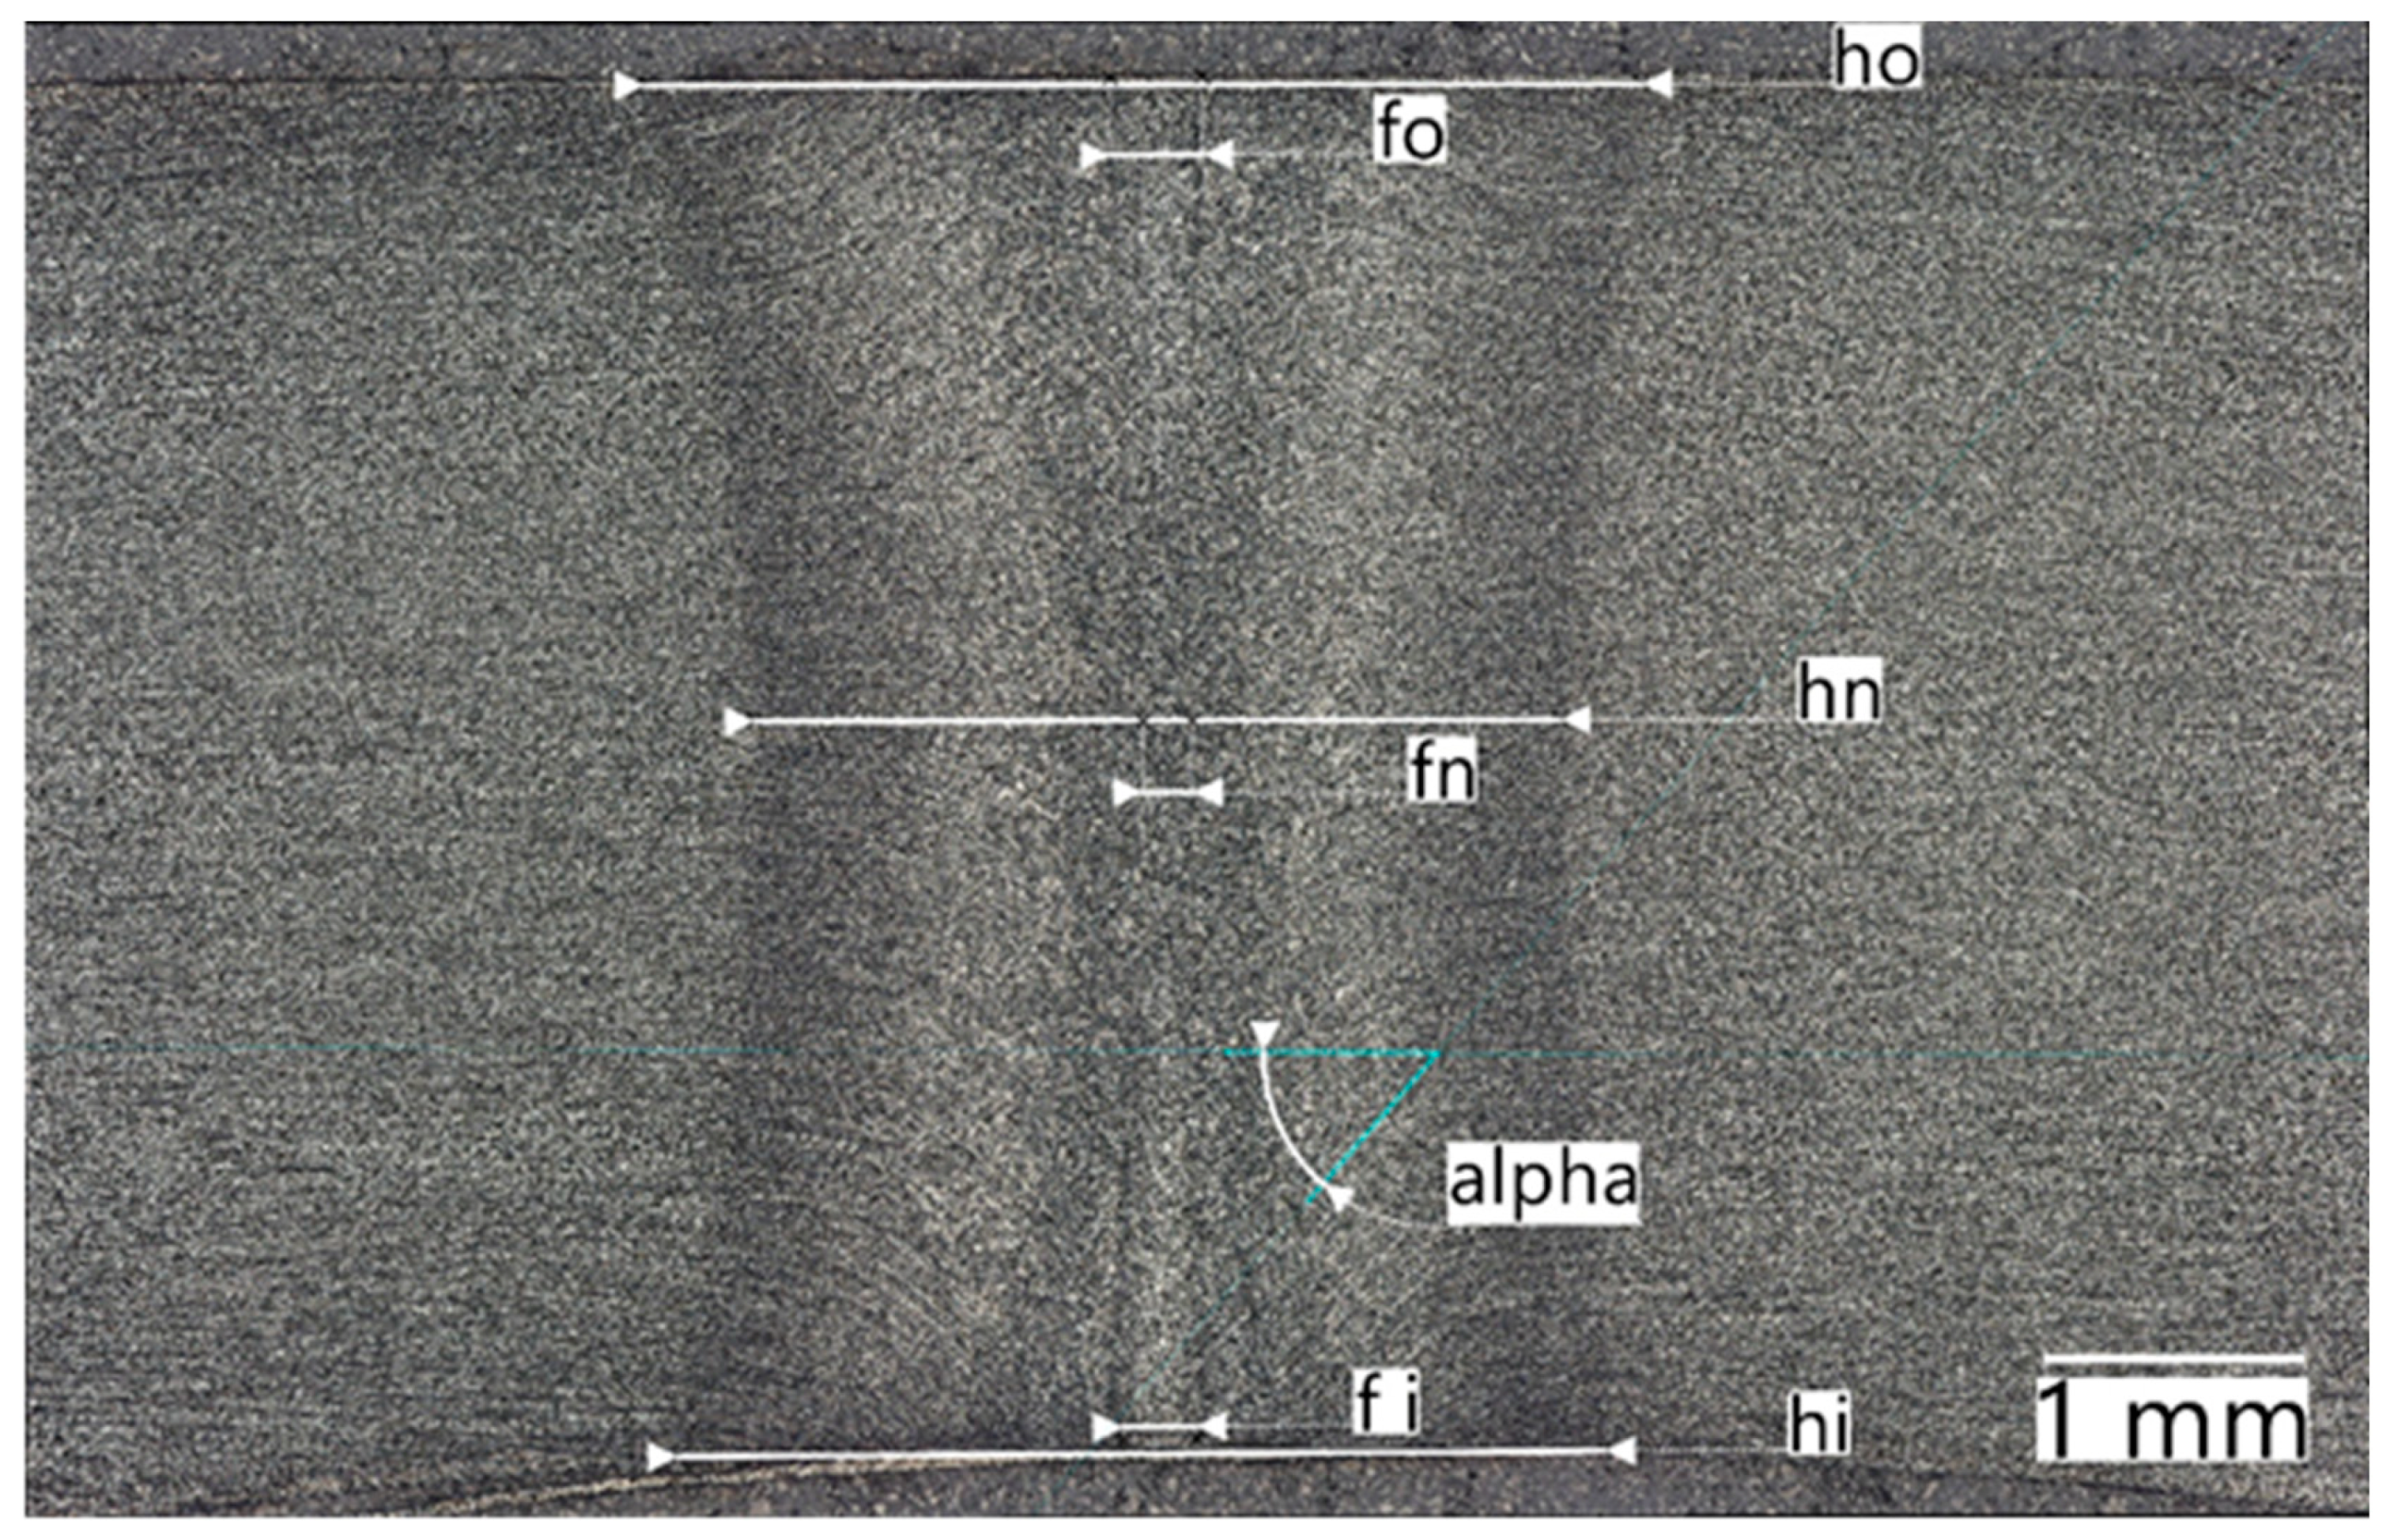
2.2. Metallographic Testing Methodology

Metallographic tests of the connection structures made in the process of longitudinal induction welding of the pipes sized 323.9 mm × 5.6 mm were carried out to determine the effect of the inductor position, the squeeze value, and the power on the geometry and internal quality of the joint. Samples were taken from the 4 test pipes and polished for the purpose of examination of the joints. The samples are shown in Figure 7 and the measurement sites are shown in Figure 8.
The following values were measured:
  • Ferritic line width: fn, fo, fi [mm];
  • Heat-affected zone width: hn, ho, hi [mm];
  • Flow line bend angle [°].
The amount of squeeze determines the flow line bend angle and was therefore included in the analysis.

3. Analysis of the Test Results

3.1. Effect of the Squeeze on Electric Power Consumption

Based on the data from Table 4, we found a relationship between the squeeze and the temperature at the welding point. Table 5 presents the analyzed data and the magnitude ΔT of the temperature increase.
Table 5. Temperature increase in the weld at the same power due to increased squeeze.
Squeeze [mm]T [°C]P [kW]Temperature Rise after Squeeze ΔT [°C]
1.85124142254
2.351295422
The increased squeeze (2.35 mm) caused an increase in the temperature at the welding point by 54 °C (1295 − 1241 °C) without an increase in power P, which is important. It can be calculated that the temperature increased by 3 °C per every 1 kW of energy input, because if the power was experimentally set to 427 kW, the temperature reached about 1310 °C. Therefore, if the temperature at the welding point increases, power P can be lowered according to the calculations shown in Table 6.
If we divide the temperature increment T of 54 °C by the temperature value per 1 kW, that is 3 °C, we obtain a power of 18 kW, by which we can reduce power P. Therefore, power P, when reduced, will be 422 kW − 18 kW = 404 kW. The savings in electric power consumption due to the increase in the squeeze force amounted to approximately 4.3%.
In the further course of the study, the influence of the position of the inductor was analyzed. Table 4 shows the relationship between power P and distance H in the inductor setting. If H = 20 mm, i.e., the inductor is shifted in the direction of the welding point, the heating system needs 5 kW less power P than in the case where H = 50 mm for reaching the same temperature. Table 7 presents the calculation of electric power savings related to the correct position of the inductor position in the HFI heating system.
The positioning of the inductor closer to the welding point can save the power input by 5 kW and obtain an approx. 1.2% extra reduction in electric power consumption during HFI welding.

3.2. Metallographic Test Results

After calculating the savings in electric power consumption, the quality of the joints was verified using metallographic tests. The analysis was carried out based on the characteristic values shown in Figure 7. Typical representative microstructures of the joints are shown in Figure 9, Figure 10, Figure 11 and Figure 12, corresponding, respectively, to the four test settings of the squeeze and the inductor.
Table 8 shows geometric measurements of the joints in the four samples.
All the tested joints were characterized by very good quality. They had a typical zonal structure consisting of the base material, zones with a predominant influence of mechanical deformation, zones of thermomechanical influence, dynamic recrystallization zones, and bonding zones of the so-called “ferritic line” [25].
The geometric measurements of the microstructures confirm the symmetrical structure of joints 1 to 4 with an hourglass shape characteristic of the HFI process. It can be stated (Table 8) that the dimensions of the heat-affected zone (ho, hi, hn, fo, fi, and fn) were smaller for the inductor position 50 mm away from the welding point (samples 3 and 4). There was also a visible relationship between the flow line bend angle and the amount of squeeze, i.e., with the squeeze increased by 0.5 mm, the angle also increased to 50°. The use of the larger squeeze affected the flow line bend angle and had a positive effect, not only on the increase in temperature, but also on the quality of the joint. The larger squeeze caused the proper arrangement of the flow line, thanks to which we can more effectively discard impurities from the ferritic line, which was also confirmed in study [26]. Placing the inductor closer to the welding point resulted in a wider ferritic line, which is not relevant in the case of heating pipes [27]. According to the authors of study [28], this may be important for pipes which need the ferritic line to be tested for impact resistance.

4. Summary

The results of the tests of parameter 1 confirm the temperature increase with an increase in the squeeze by 0.5 mm. For samples 2 and 4, the temperature increased by 54 °C—importantly, without an increase in power P. The temperature increase was made possible by increasing the proximity effect and additionally by the heat from the larger work of deformation, i.e., through plastic processing, at the welding point. The reduction in electric power consumption in this case was 4.3%.
The second tested parameter of the heating system was the distance of the inductor from the horizontal rolls of the squeeze stand (dimension “H” in Figure 1 and Figure 6).
The results of this study confirm that it is advisable to bring the inductor closer to the welding point, which leads to a reduction in electric power consumption. For the inductor set at a distance of H = 20 mm, the welding power, P, was 422 kW, and for H = 50 mm, P had to be increased to 427 kW. This increase in power was necessary due to the need to obtain the correct temperature at the welding point, and thus the high inner quality of the joint. Thus, by placing the inductor closer to the welding point, we can obtain energy savings of 1.2%.
In total, the savings from the optimal setting of both parameters will amount to 1.2% (parameter 2) + 4.3% (parameter 1) = 5.5%. Assuming an energy cost of EUR 0.5/kWh, for pipes welded with an average power of 400 kW for 50 h per week, the annual electric power costs will be EUR 520,000. By reducing consumption by 5.5%, we can achieve savings of EUR 28,600 per year without compromising the quality of welded pipes.

5. Conclusions

The test settings were verified in the production conditions of Huta Łabędy S.A., and their correctness was confirmed by tests of the connector microstructure. Based on this, we can draw the following conclusions:
(1)
The application of increased squeeze by the horizontal rolls of the squeeze stand produced an increase in the temperature at the welding point, thus reducing the required HFI power by 4.3%.
(2)
The maximum proximity of the inductor, depending on the design limitations of the squeeze stand, reduced the electrical energy input necessary to weld the HFI pipe by 1.2%.
(3)
The microstructure of the joints in all four samples was symmetrical and featured high metallurgical purity, which confirms that the settings used in the HFI heating system were correct.
(4)
The sizes of the joint zones were correlated with the power applied, the squeeze, and the distance of the inductor from the welding point:
  • The increased squeeze increased the flow line bend angle, resulting in better squeezing of impurities from the welding point;
  • Bringing the inductor closer to the welding point caused a minimal increase in the size of the heat-affected zone of the joint, including the width of the ferritic line. However, this did not adversely affect the inner quality of the joint.
(5)
The optimization of the squeeze force and the inductor position led to a reduction in the electric power consumption of approximately 5.5%.

Author Contributions

Z.T.—resources, supervision, control of data from Huta Łabędy; J.S. (Jacek Stępień)—conceptualization, methodology, validation, investigation, data curation, writing original draft preparation; T.G.—conceptualization, methodology, formal analysis, investigation, writing-original draft preparation; P.W.—conceptualization, methodology, investigation, writing—review and editing, visualization, metallography; G.G.—validation, investigation, data curation, preparation of data related to the mechanical properties; J.S. (Jan Supernak)—visualization, investigation, research, graphics. All authors have read and agreed to the published version of the manuscript.

Funding

The research presented in the article was carried out as part of the “INNOSTAL POIR.01.02.00-00-0216/17” project of the National Center for Research and Development (NCBR), which aims to develop technology for the production of welded steel tubes meeting safety requirements for liquid and gas transport under low working pressures in hard coal mines.

Data Availability Statement

Not applicable.

Acknowledgments

Thanks to Jerzy Kotula for his special contribution to the project.

Conflicts of Interest

The authors declare no conflict of interest.

References

  1. Cunat, P.-J. The Welding of Stainless Steels. In Materials and Applications Series, 3rd ed.; Euro Inox: Brussels, Belgium, 2007; Volume 3. [Google Scholar]
  2. Udhayakumar, T.; Mani, E. Effect of HF Welding Process Parameters and Post Heat Treatment in the Development of Micro Alloyed HSLA Steel Tubes for Torsional Applications. J. Mater. Sci. Eng. 2017, 6, 2. [Google Scholar] [CrossRef]
  3. Hannachi, M.T.; Djebail, H. Optimization of parameters of welding steel tubes by induction at high frequency. In Proceedings of the Conference “Metal 2013”, Brno, Czech Republic, 15–17 May 2013. [Google Scholar]
  4. Güngör, O.E.; Yan, P.; Thibaux, P.; Liebeherr, M.; Bhadeshia, H.K.D.H.; Quidort, D. Investigations into the Microstructure-Toughness Relation in High-Frequency Induction-Welded Pipes. In Proceedings of the 8th International Pipeline Conference, Calgary, AB, Canada, 27 September–1 October 2010. [Google Scholar]
  5. Sayed, A.M.; Alanazi, H. Performance of steel metal prepared using different welding cooling methods. Case Stud. Constr. Mater. 2022, 16, e00953. [Google Scholar] [CrossRef]
  6. Golański, G.; Garstka, T. Microstructure and analysis of Barkhausen noise in the area of the 7CrMoVTiB10-10 (T24) steel welded joint. Energetyka 2013, 2, 144–149. [Google Scholar]
  7. Wright, J. Optimizing Efficiency in HF Tube Welding Processes. In Tube & Pipe Technology; INTRAS Ltd.: Nottinghamshire, UK, 1999. [Google Scholar]
  8. Muyskens, S.M.; Eddir, T.I.; Goldstein, R.C. Improving Inductive Welding System Performance with Soft Magnetic Composites. In Proceedings of the 30th ASM Heat Treating Society Conference, Detroit, MI, USA, 15–17 October 2019. [Google Scholar]
  9. Milicevic, M.; Radakovic, Z. Quality Improvement of Steel Pipes Produced by Seam Welding with New Magneto-Dielectric Impeder. Mater. Trans. 2006, 47, 1464–1468. [Google Scholar] [CrossRef]
  10. Iatcheva, I.; Gigov, G.; Kunov, G.; Stancheva, R. Analysis of induction heating system for high frequency welding. Facta Univ.-Ser. Electron. Energ. 2012, 25, 183–191. [Google Scholar] [CrossRef]
  11. Kim, C.-M.; Kim, J.-K. The Effect of Heat Input on the Defect Phases in High Frequency Electric Resistance Welding. Met. Mater. Int. 2009, 15, 141–148. [Google Scholar] [CrossRef]
  12. Varbai, B.; Adonyi, Y.; Kristály, F.; Nagy, E.; Mertinger, V. Bondline Characterization in High Frequency Welding of Steels. 2020. Available online: https://www.researchgate.net/profile/Yoni-Adonyi/publication/347489540_Bondline_Characterization_in_High_Frequency_Welding_of_Steels/links/5fddeb5145851553a0cefeb6/Bondline-Characterization-in-High-Frequency-Welding-of-Steels.pdf (accessed on 15 June 2023).
  13. Alam, S.; Hassan, S.F. Heat-input factor effect on the quality of high-frequency induction welded pipe for oil and gas industry. Manuf. Lett. 2023, 36, 76–79. [Google Scholar] [CrossRef]
  14. Gao, K.; Dai, X.; Gong, J.; Ye, K.; Gu, H.; Li, K. Effect of inductor position on thermal characteristics during induction lap welding process for Fe/Al dissimilar metal. Int. J. Therm. Sci. 2023, 192, 108466. [Google Scholar] [CrossRef]
  15. Stępień, J.; Techmański, Z.; Stępień, M.; Mikno, Z. Analysis of Selected Properties of Welded Steel Pipes Manufactured in the Induction Welding Technology; No 5; Bulletin of the Welding Institute: Gliwice, Poland, 2021. [Google Scholar]
  16. Cvetkovski, S.; Brkovski, D. Optimising technology for production of high frequency welded pipes made of X60 steel. In XIII International Congress Machines. Technologies. Materials; Faculty of Technology and Metallurgy—Ss Cyril and Methodius University: Skopje, North Macedonia, 2016. [Google Scholar]
  17. Xia, Z.; Huang, Y.; Zhong, J.; Guan, K. Cracking failure analysis on a high-frequency electric resistance welding pipe in buried fire water pipeline. Eng. Fail. Anal. 2023, 146, 107072. [Google Scholar] [CrossRef]
  18. Kroll, M.; Birnbaum, P.; Ebel, W.; Gruner, J. Electro-thermo-mechanical simulation of the longitudinal HFI-welding process of carbon steel tubes, January 2021. In Proceedings of the XIX International UIE Congress on Evolution and New Trends in Electrothermal, Plzeň, Czech Republic, 1–3 September 2021. [Google Scholar]
  19. ISO 6892-1:2019; Metallic Materials—Tensile Testing—Part 1: Method of Test at Room Temperature. International Organization for Standardization: Geneva, Switzerland, 2019.
  20. EN 10217-2; Welded Steel Tubes for Pressure Purposes—Technical Delivery Conditions—Part 2: Electric Welded Non-Alloy and Alloy Steel Tubes with Specified Elevated Temperature Properties. ATTEC International: Düsseldorf, Germany, 2019.
  21. Ghaffarpour, M.; Akbari, D.; Naeeni, M.; Ghanbari, S. Improvement of the joint quality in the high-frequency induction welding of pipes by edge modification. Weld. World 2019, 63, 1561–1572. [Google Scholar] [CrossRef]
  22. Tazedakis, A.S.; Voudouris, N.G.; Musslewhite, M. Manufacturing of 25 mm heavy-wall Linepipe using the high frequency induction (HFI) welding technique, a challenge for a pipe manufacturer. In Proceedings of the 8th International Pipeline Conference, IPC2010, Calgary, AB, Canada, 27 September–1 October 2010. [Google Scholar]
  23. Egger, C.; Kroll, M.; Kern, K.; Steimer, Y.; Schreiner, M.; Tillmann, W. Experimental Investigation of Temperature and Contact Pressure Influence on HFI Welded Joint Properties. Materials 2022, 15, 3615. [Google Scholar] [CrossRef] [PubMed]
  24. Ravikiran, K.; Li, L.; Lehnhoff, G.; Sharma, N.K.; Kannan, R.; Saini, N.; Choudhury, S.D.; Lyu, Z. Microstructure and crystallographic texture of high frequency electric resistance welded X65 pipeline steel. Mater. Chem. Phys. 2023, 302, 127758. [Google Scholar] [CrossRef]
  25. Techmański, Z.; Stępień, J.; Garstka, T.; Wieczorek, P.; Nowak, J.; Kobielski, A. The Use of the Linear Energy Calculation Model in High-Frequency Induction (HFI) Tube Welding Technology to Obtain Optimal Microstructure and Weld Geometry. Metals 2023, 13, 1381. [Google Scholar] [CrossRef]
  26. Karani, A.; Koley, S.; Shome, M. Failure of electric resistance welded API pipes—Effect of centre line segregation. Eng. Fail. Anal. 2019, 96, 289–297. [Google Scholar] [CrossRef]
  27. Kannan, R.; Li, L.; Guo, L.; Anderson, N.; Rashid, M.; Collins, L.; Arafin, M. Bond Formation Mechanism for Resistance Welding of X70 Pipeline Steel. Weld. J. 2020, 99, 209s–223s. [Google Scholar] [CrossRef]
  28. Yu, H.; Wu, K.; Dong, B.; Liu, J.; Liu, Z.; Xiao, D.; Jin, X.; Liu, H.; Tai, M. Effect of Heat-Input on Microstructure and Toughness of CGHAZ in a High-Nb-Content Microalloyed HSLA Steel. Materials 2022, 15, 3588. [Google Scholar] [CrossRef] [PubMed]
Figure 1. Diagram of the HFI welding process.
Processes 11 02798 g001
Figure 2. The pipe forming process in 10 steps.
Processes 11 02798 g002
Figure 3. The change in geometry during the pipe formation in the individual stages: 1—inlet table; 2—preforming; 3—breakdown 1; 4—edge bending; 5—breakdown 2; 6—lineal; 7—fin-pass 1; 8—fin-pass 2; 9—fin-pass 3; 10—squeeze.
Processes 11 02798 g003
Figure 4. Squeeze stand. W_DR and W_OP—position of horizontal side rolls; HBottom—position of the bottom roll; Htop-DR and Htop-OP—positions of the inclined rolls operating independently of each other; Hbeam—position of jointly sliding inclined rolls.
Processes 11 02798 g004
Figure 5. Horizontal roll settings in the 3 fin-pass stands and in the squeeze stand.
Processes 11 02798 g005
Figure 6. The welding station used in the tests with the marked distance “H” of the end of the inductor from the horizontal squeeze rolls.
Processes 11 02798 g006
Figure 7. Pipe samples after sectioning for metallographic test.
Processes 11 02798 g007
Figure 8. Places of measurement of the parameters of the joints (t—thickness of the pipe).
Processes 11 02798 g008
Figure 9. Microstructure of the HFI-welded joint in sample 1: squeeze = 1.85 mm; H = 20 mm.
Processes 11 02798 g009
Figure 10. Microstructure of the HFI-welded joint in sample 2: squeeze = 2.35 mm; H = 20 mm.
Processes 11 02798 g010
Figure 11. Microstructure of the HFI-welded joint in sample 3: squeeze = 1.85 mm; H = 50 mm.
Processes 11 02798 g011
Figure 12. Microstructure of the HFI-welded joint in sample 4: squeeze = 2.35 mm; H = 50 mm.
Processes 11 02798 g012
Table 6. Reduction in the power demand due to the increased squeeze of the rolls.
k
[°C/kW]
Temperature Increment, ΔT [°C]Unit Reduction in P, ΔP
[kW]
Welding Power at Increased Squeeze, P [kW]Power Reduction, δP [%]
354184044.3
Table 7. Calculation of savings on power P resulting from bringing the inductor closer to the welding point.
H
[mm]
P
[kW]
Difference in Power, ΔP
[kW]
Reduction in Power δP
[%]
2042251.2
50427
Table 8. Joint measurement results for the 4 samples/variants.
Sample No.ho
[mm]
hi
[mm]
hn
[mm]
fo
[mm]
fi
[mm]
fn
[mm]
A
[°]
14.03.93.20.30.30.249
24.14.03.20.30.30.250
33.73.83.00.20.20.148
43.63.63.10.20.20.150
Disclaimer/Publisher’s Note: The statements, opinions and data contained in all publications are solely those of the individual author(s) and contributor(s) and not of MDPI and/or the editor(s). MDPI and/or the editor(s) disclaim responsibility for any injury to people or property resulting from any ideas, methods, instructions or products referred to in the content.

