Article

Reservoir Space Characterization of Ordovician Wulalike Formation in Northwestern Ordos Basin, China

1
PetroChina Research Institute of Petroleum Exploration and Development, Beijing 100083, China
2
Institute of Petroleum Exploration and Development, PetroChina Changqing Oilfield Company, Xi’an 710018, China
3
PetroChina Hangzhou Research Institute of Geology, Hangzhou 310023, China
*
Author to whom correspondence should be addressed.
Processes 2023, 11(9), 2791; https://doi.org/10.3390/pr11092791
Submission received: 11 August 2023 / Revised: 11 September 2023 / Accepted: 11 September 2023 / Published: 19 September 2023

Abstract

:
The Ordovician Wulalike Formation in the northwestern Ordos Basin is a new prospect for exploring marine shale gas in China, facing prominent problems such as unclear reservoir conditions and the distribution of enrichment areas. The types of reservoir space, fracture development, porosity composition, and physical properties of the lower Wulalike Formation are discussed through the multi-method identification and quantitative evaluation of reservoir space for appraisal wells. The Wulalike Formation in the study area contained fractured shale reservoirs with matrix pores (mainly inorganic pores) and permeable fractures. The fracture system of the lower Wulalike Formation is dominated by open bed-parallel fractures that are intermittent or continuous individually, with a width of 0.1–0.2 mm and spacing of 0.5–14.0 cm. The fracture-developed intervals generally exhibit bimodal or multimodal features on NMR T2 spectra and have a dual-track feature with a positive amplitude difference in deep and shallow resistivity logs. The length and fracture porosity of fracture-developed intervals varied greatly in different parts of the study area. In the Majiatan-Gufengzhuang area in the southern part of the study area, the fracture development degree generally decreased from west to east. In the Shanghaimiao area in the central part of the study area, fractures were extremely developed, the continuous thickness of the fracture-developed interval was generally more than 20 m, and the average fracture porosity was higher than 1.3%. In the Tiekesumiao area in the northern part of the study area, the fracture development degree was generally lower than that in the central and southern parts of the study area and also showed a decreasing trend from west to east. The lower Wulalike Formation had a total porosity of 2.46–7.08% (avg. 4.71%), roughly similar to the Longmaxi Formation in the Sichuan Basin, of which matrix porosity accounts for 34.0–90.0% (avg. 61.1%) and fracture porosity accounts for 10.0–66.0% (avg. 38.9%). From this, it could be inferred that the shale gas accumulation type of the lower Wulalike Formation in the northwest margin of the basin is mainly a fractured shale gas reservoir controlled by structure, and its “sweet spot area” is mainly controlled by tectonic setting and preservation conditions. This indicates that the Wulalike Formation in the northwestern Ordos Basin has good shale gas exploration prospects, and a large number of fault anticlines or fault noses formed by reverse dipping faults have the potential of favorable exploration targets.

1. Introduction

Over the past decade, economic drivers, energy insecurity, and ever-growing energy demands have led to a boom in global shale gas exploration, including China [1,2,3]. In the global exploration of prospective shale gas formations, the petroleum systems context [4] plays a decisive role [5,6], demonstrating that the characteristics of source rocks and reservoirs are essential geological factors that must be taken into account in unconventional oil and gas exploration. The characteristics of hydrocarbon source rocks generally include understanding the thermal maturity, organic matter abundance, and organic matter quality of source rocks and, ultimately, understanding the hydrocarbon generation potential of conventional or unconventional source rocks [7,8,9,10]. Reservoir characteristics require an understanding of reservoir quality, including the sedimentary environment and petrology, pore and fracture systems, porosity, permeability, faulting, fracturing, and general rock physical properties [8,11,12,13]. In summary, the characterization of hydrocarbon source rocks and reservoir properties is a key aspect of shale gas exploration, making a significant contribution to improving the success rate of exploration.
The Ordovician Wulalike Formation in the northwestern Ordos Basin is a new prospect for exploring shale gas in foreland basins within China. Up until now, five shale gas appraisal wells have been drilled; typically, Wells ZP1 and L86 in the Majiatan-Dashuikeng block achieved gas flow rates of 26.48 × 10⁴ m3/d and 15.22 × 10⁴ m3/d, respectively, implying encouraging exploration potential [14,15,16,17]. Exploration and research have confirmed that the lower Wulalike Formation in the northwestern Ordos Basin comprises shale gas beds with an organic matter abundance of <1.5 wt.% TOC and a formation pressure coefficient of <1.2 generally [14,18,19,20,21,22]. The high production of some wells from the Wulalike Formation is commonly believed to be attributed to a key factor—the presence of pores and (especially) fractures—in the study area that is located in a foreland thrust sheet [14,17,20]. However, the types and development characteristics of these pores and fractures have not been understood adequately and quantitatively, impeding scientific judgment on the distribution feature and exploration prospect of shale gas in the study area.
Fractures and pores are good reservoir spaces for highly productive shale gas reservoirs. Their effective identification and quantitative evaluation are crucial and important in the characterization of marine shale reservoirs [23,24,25,26,27]. Based on the geological data (e.g., core, well logging, nuclear magnetic resonance, and analytical testing) of several appraisal wells, including L105, NP1, and E102 in the northwestern Ordos Basin, the fractures and pores in the Wulalike Formation are characterized, and then the reservoir space is qualitatively identified and quantitatively analyzed using multiple methods to clarify the development characteristics and main components of high-quality reservoir space in the marine shale. The study results are expected to provide a geological basis for shale gas exploration and core area selection in foreland basins.

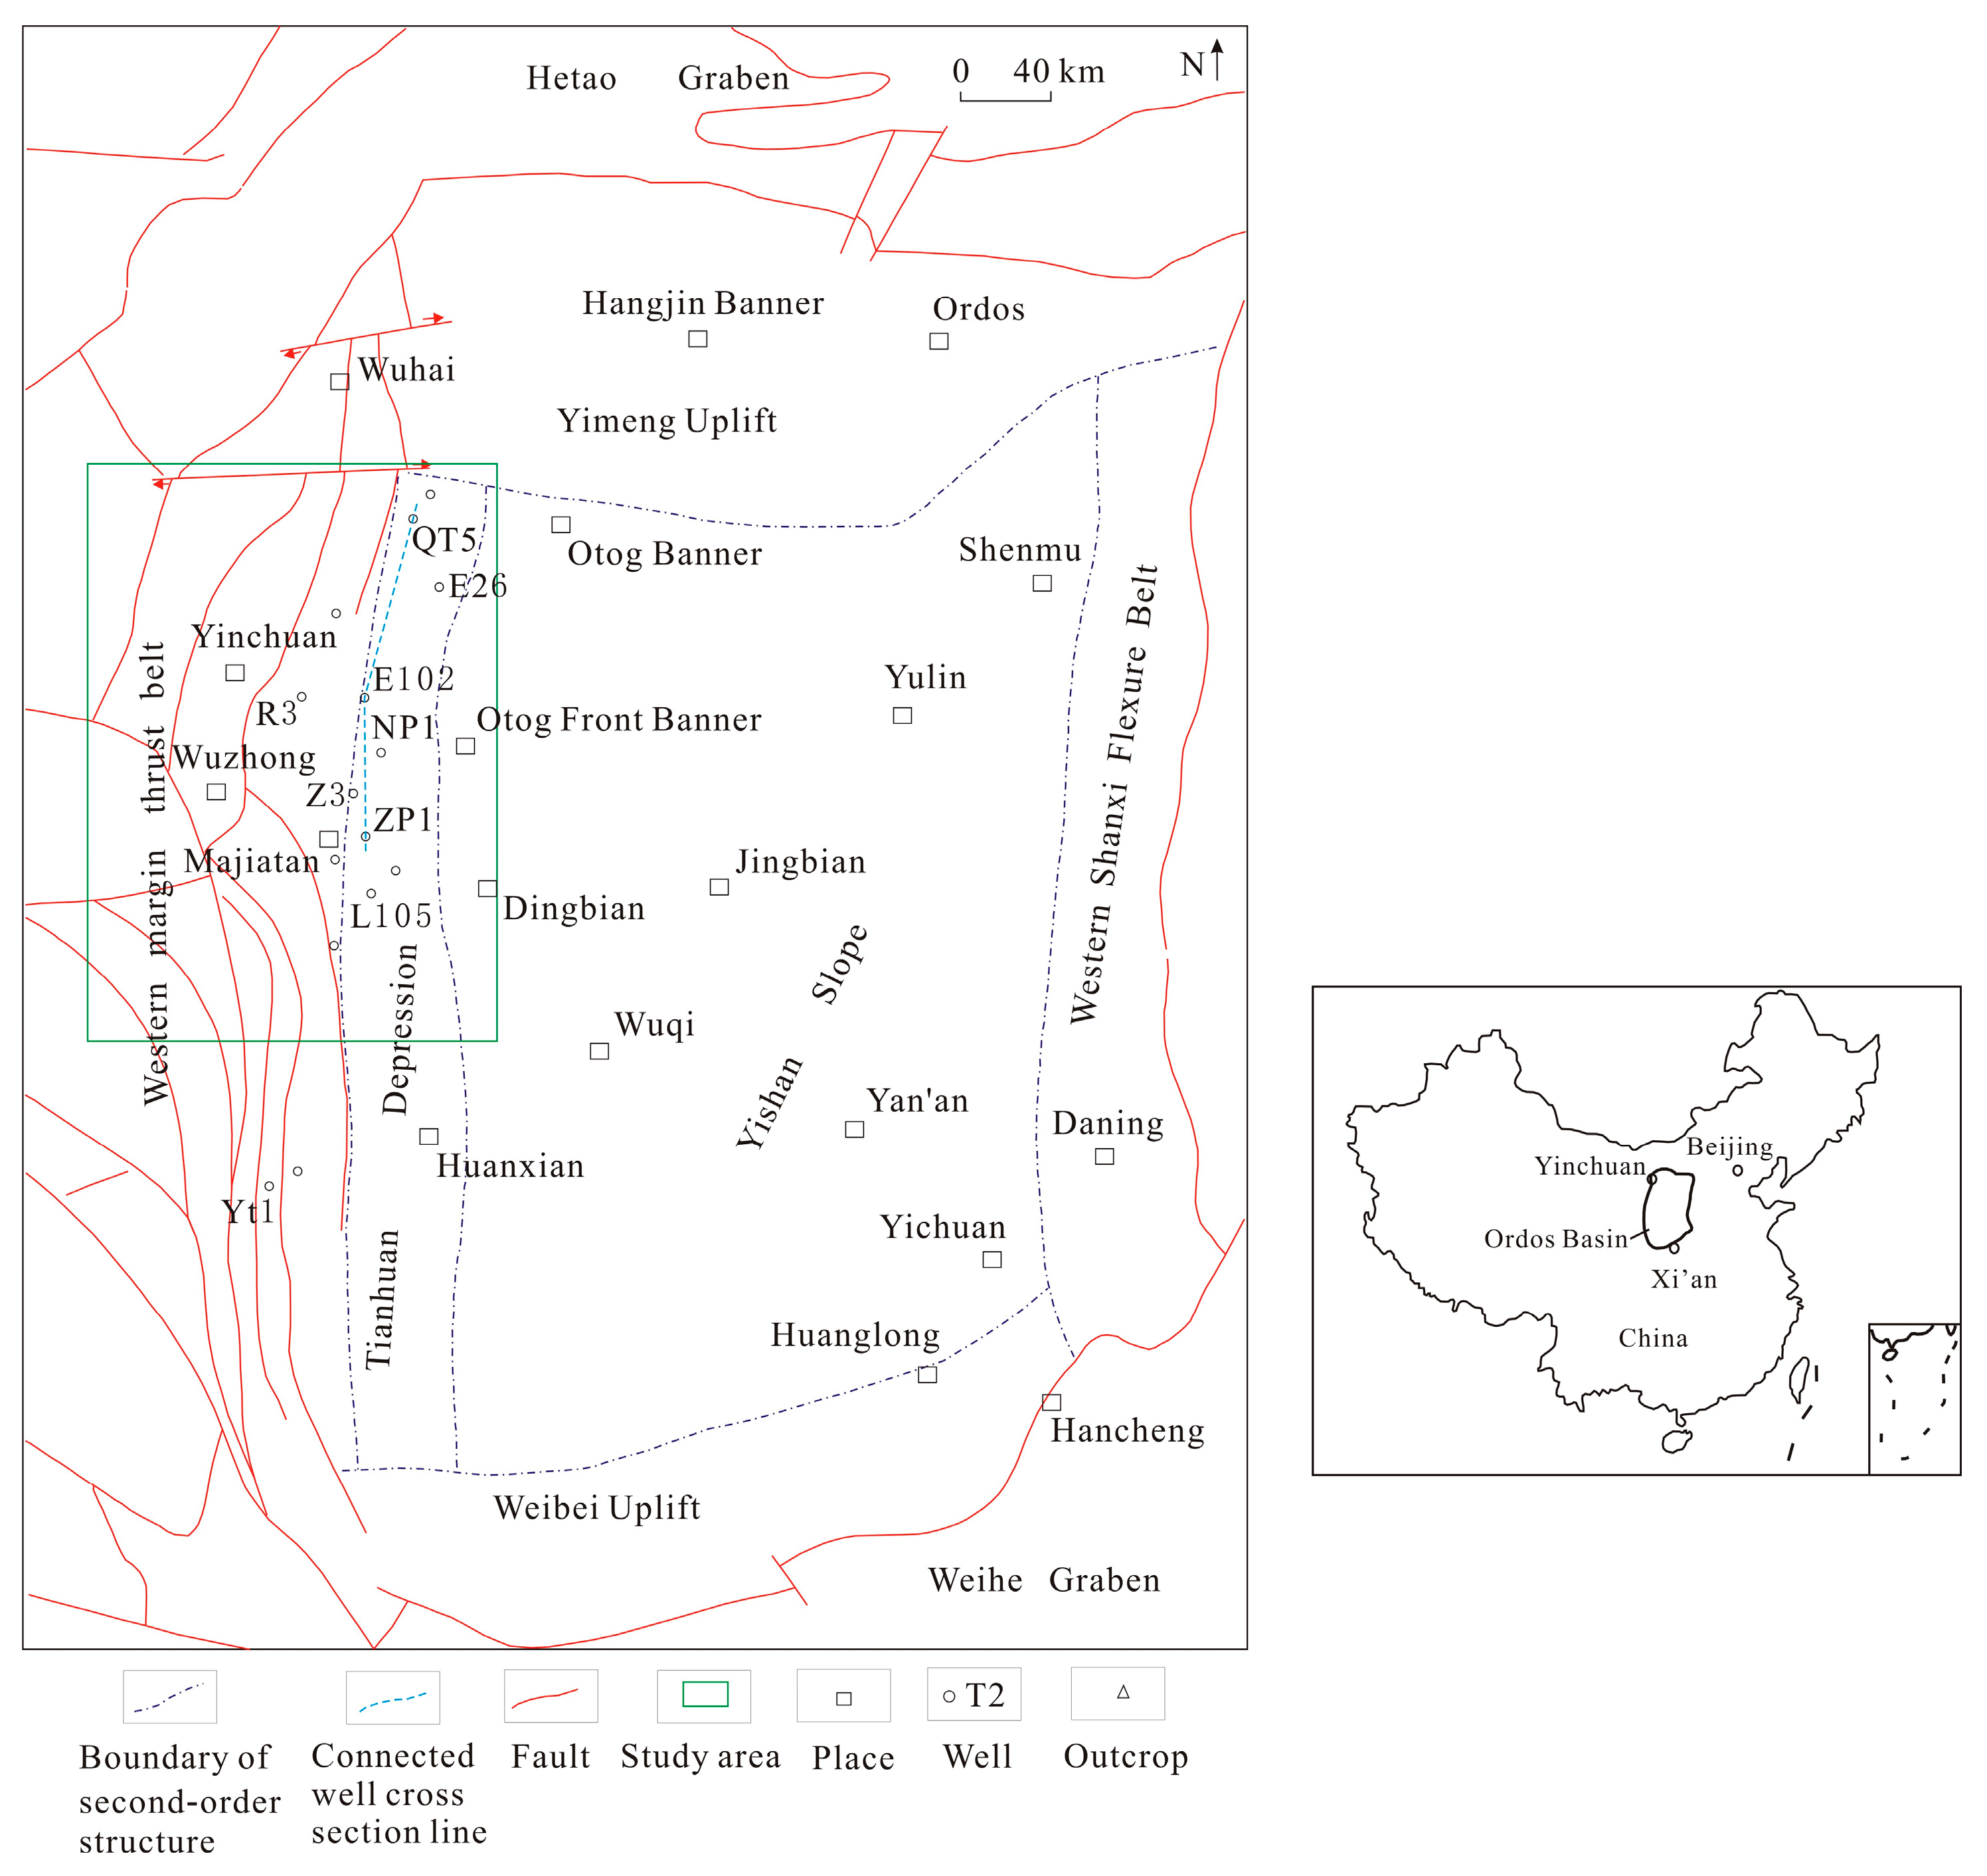
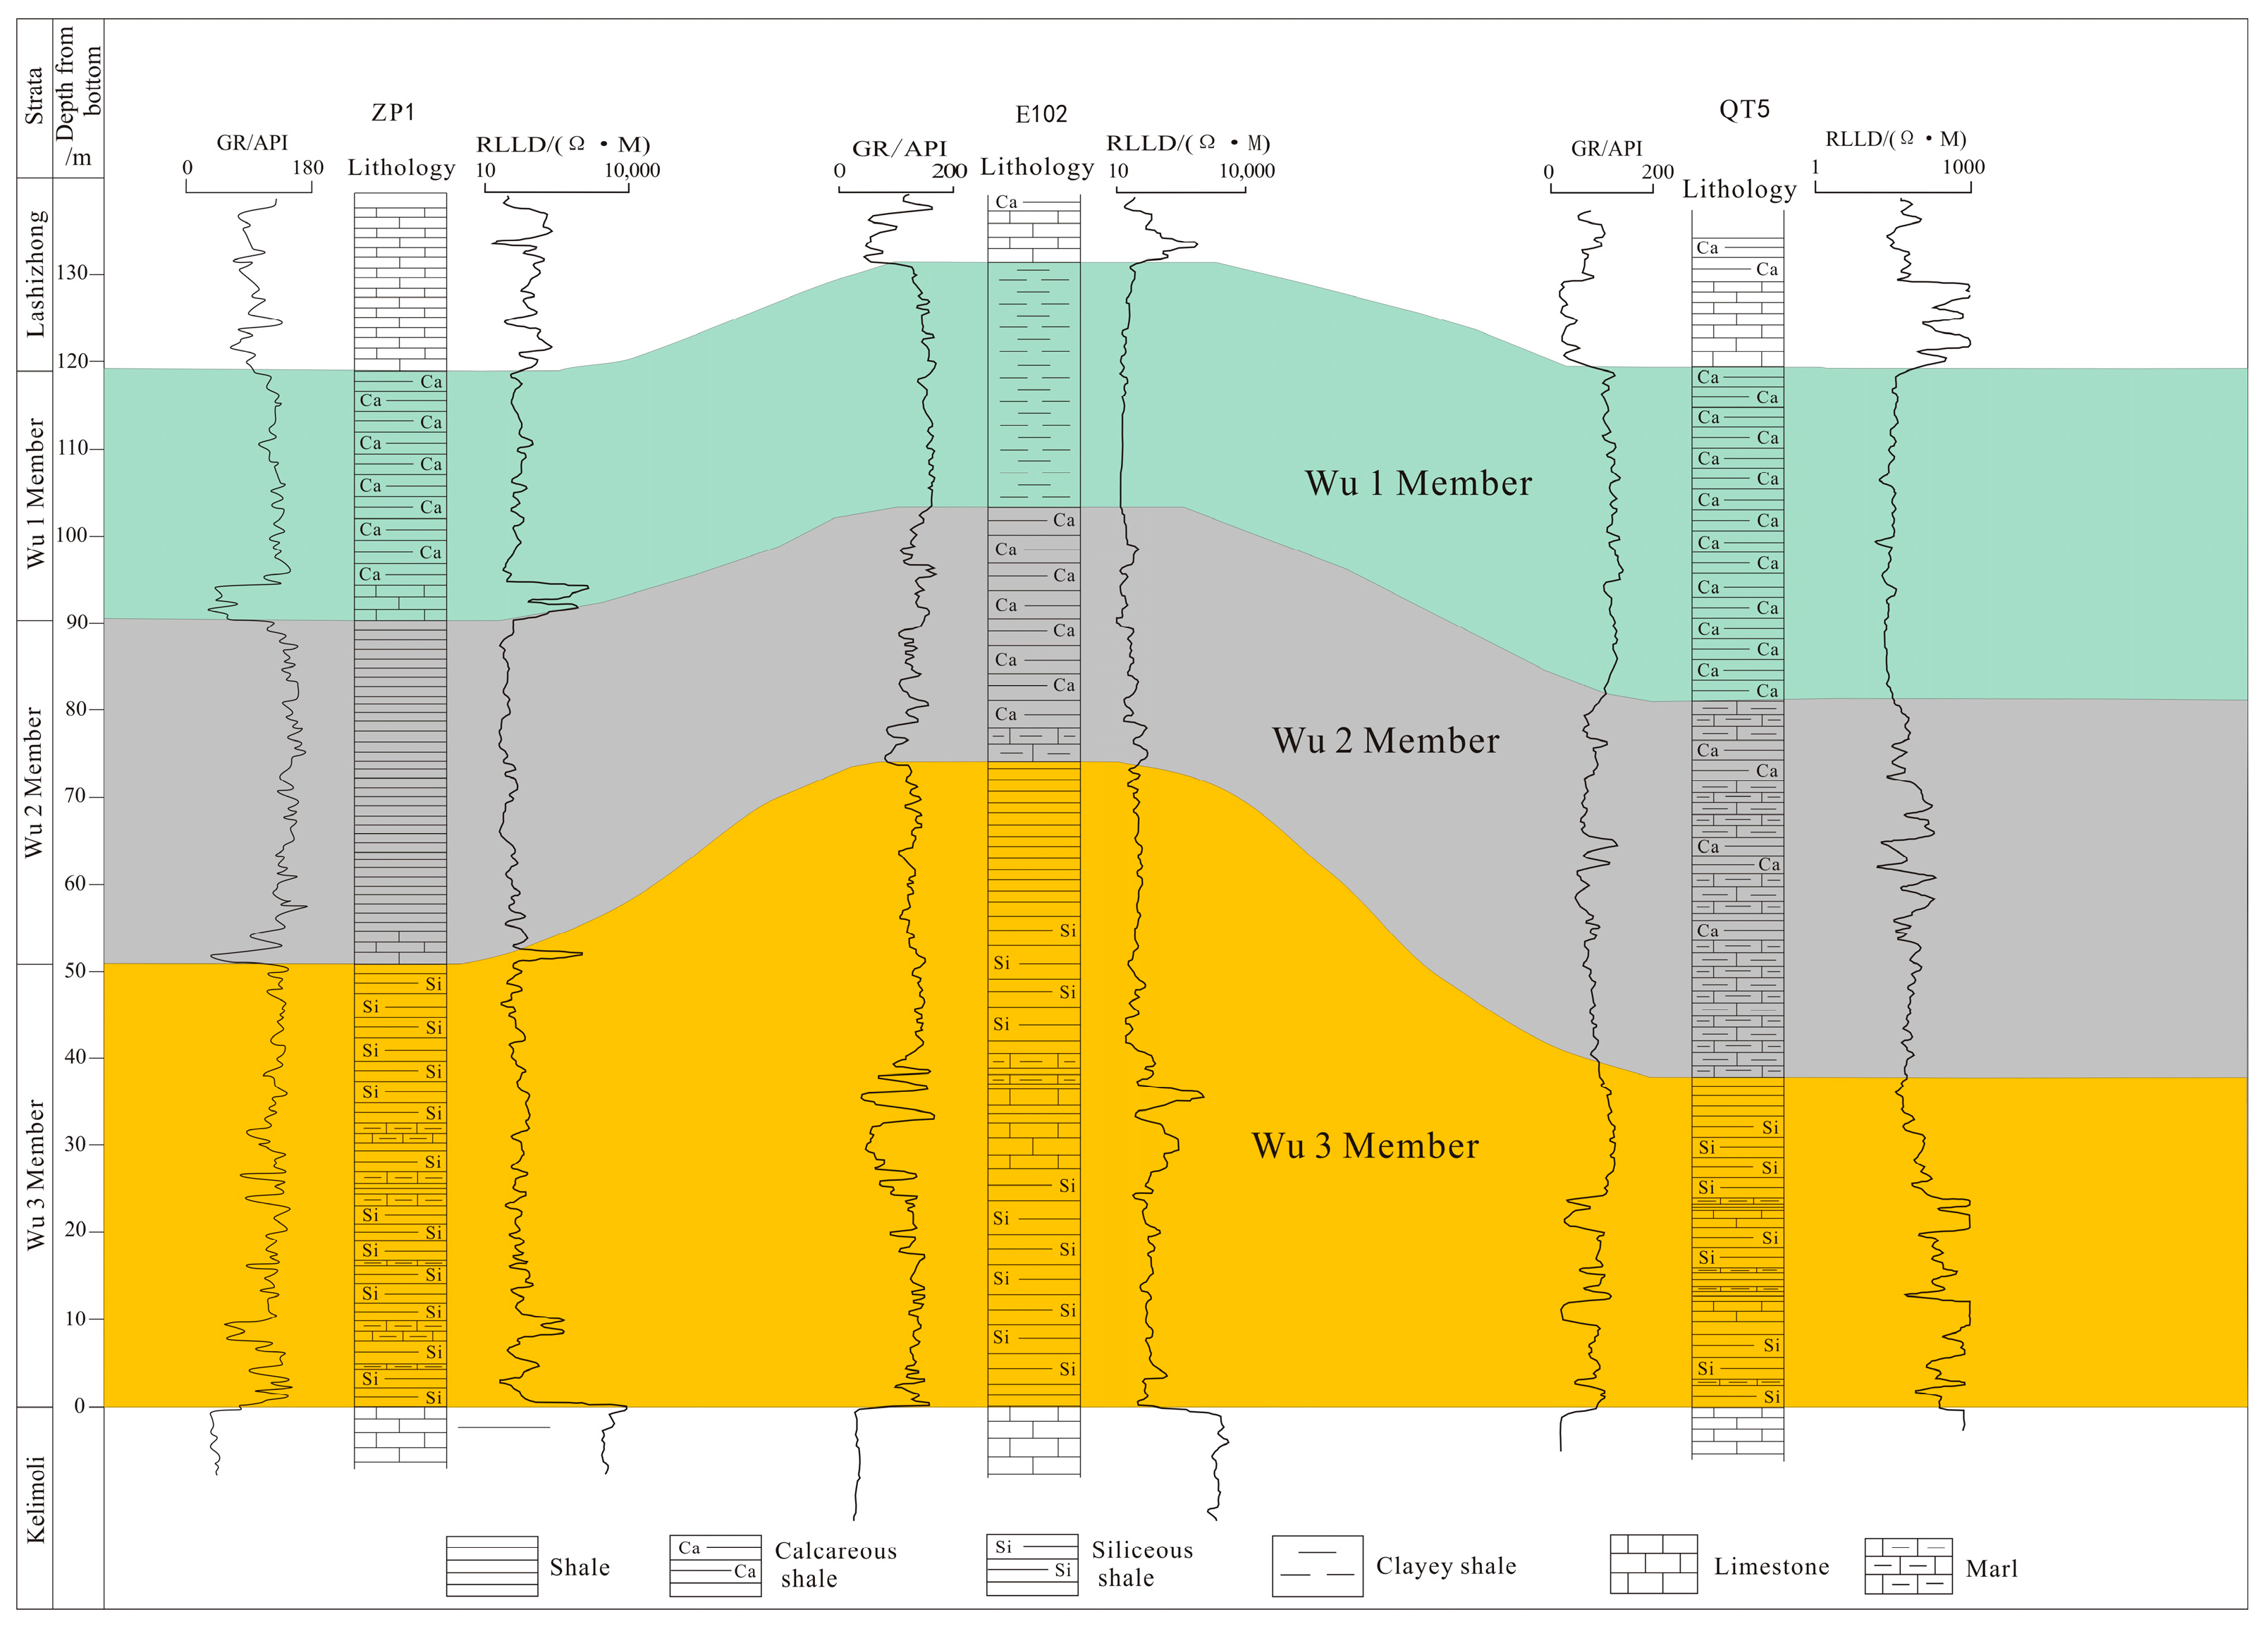
2. Geological Setting

The western Ordos Basin is mainly occupied by the foreland thrust sheet, including the western margin thrust belt and the Tianhuan depression from west to east. Overall, it spreads in a north–south direction, with an E-W width of about 50–200 km and a N-S length of about 600 km [14,17] (Figure 1). The study area is structurally complex, showing relatively strong tectonic activity in the western margin thrust belt and stability in the Tianhuan depression [14,17]. In the western margin thrust belt, there are multiple large S-N thrust faults and nearly E-W strike-slip faults. Morphologically, the thrust faults extend eastward and are separated into several small structural zones by the E-W faults that present dextral strike-slip, with the characteristic of regulating faults [14,17,20]. The Tianhuan depression is dominated by a depression and a westward-dipping slope, with a relatively simple structural configuration and fewer large faults (Figure 1) [14,17].
The northwestern Ordos Basin spans across Ningxia, Shanxi, and Inner Mongolia, with an area of 3.7 × 10⁴ km2 approximately (Figure 1). The Ordovician Wulalike Formation in the study area primarily contains normal-pressure shale gas reservoirs with a low organic matter abundance [14,15,16]. Considering lithofacies characteristics, the Wulalike Formation can be divided into first, second, and third members (Wu 1 Member, Wu 2 Member, and Wu 3 Member) from top to bottom. The Wu 1 Member and Wu 2 Member are mainly composed of clayey shale, calcareous shale, and marl, while the Wu 3 Member is mainly composed of siliceous shale and black shale intercalated with marl (Figure 2 and Figure 3). Shale gas pay zones are discovered in the middle-lower Wulalike Formation (mainly in the Wu 3 Member and as a source-reservoir entity), with a thickness of 20–80 m [14,15,16]. They are distributed as strips in the S-N direction (that is, thicker in the north than in the south and thicker in the west than in the east) [14,15,16]. They are rich in silica and calcium (with an average quartz content of >37% and calcite + dolomite content of >25%), with an average three-mineral brittleness index (i.e., the percentage of quartz, dolomite and pyrite in total rock minerals) >50% [23] (Figure 2), and the organic matter abundance(TOC content) of 0.43%–1.52 wt.% (avg. 0.86 wt.%; average TOC of 1.13 wt.% in the northern part and 0.82 wt.% in the central-southern part of the study area). These cores revealed a porosity of 1–7.89% and permeability of (0.01–0.1) × 10−3 μm2 (avg. 0.07 × 10⁻³ μm2) [14], which is higher than that of the Longmaxi Formation in the Changning gas field of the Sichuan Basin by two to three orders of magnitude [23]. According to the regional geological conditions, the Wu 3 Member was found with significant characteristics as fractured shale reservoirs. Here, it is specifically discussed in terms of reservoir space.

3. Materials and Methods

3.1. Materials for Fracture Identification and Characterization

This study involves geological data from 16 wells in the northwestern Ordos Basin, including Z15, Z5, Z2, ZP 1, YT 1, E102, NP 1, L 56, L 82, L 52, L 64, L 99, L 105, QT 10, QT 9, and QT 5. These wells have complete logging data, including Z15, ZP 1, E102, L99, and L105 wells, which have geological data such as the core, TOC content, mineral composition, SEM, thin rock sections, and nuclear magnetic resonance of Wulalike Formation.

3.2. Methods for Fracture Identification and Characterization

Common methods for the multiscale characterization of fractures in shale reservoirs include section/core observation, image logging, conventional resistivity logging (mainly RLLD/RLLS dual-track method), rock thin section/high-precision SEM, helium gas/mercury injection porosimetry, nuclear magnetic resonance (NMR), and the dual-porosity media model [23,24,25,26,27,28,29,30,31,32,33] (Table 1). In the study area, the severely fractured and fragmented Wulalike Formation cores disabled sample plug preparation; meanwhile, due to generally low TOC and other factors, the helium gas/mercury injection porosimetry and dual-porosity medium model methods were not applicable. Therefore, in this study, core observation, conventional resistivity logging, NMR, and rock thin section/high-precision SEM were adopted to investigate the reservoir conditions of the Wulalike Formation in the northwestern Ordos Basin.
Core observation is a common method to identify macrofractures in research on conventional–unconventional petroleum geology (Table 1). It qualitatively determines the types, width/opening, intensity, filling degree, and other parameters of in situ fractures in strata using geological information such as rock occurrence status and fracture occurrence in cores and roughly estimate the fracture porosity. This is so the types of in situ pores in underground shale, followed by the types of gas reservoirs, can be determined. Fractures in shale generally have a width/opening of less than 0.3 mm, allowing them to be macroscopic and difficult to measure accurately on site. In this study, image recognition was used to measure fracture width/opening. First, high-definition photos (with a scale) of cores with fractures were taken. The scale had a centimeter or millimeter marking and was placed perpendicular to the fracture orientation. Then, the core photos were copied into a computer and magnified more than 10 times on screen to directly measure and calculate the fracture width with a ruler, or the mapping software such as CAD 2020 or Adobe Acrobat DC 2017 to measure functions were adopted for the accurate calculation of fracture width/opening.
NMR is a new technology that has been developed in recent years for the rapid measurement of rock porosity and permeability. Essentially, depending upon the positive correlation between the NMR signal of hydrogen atoms in the pore fluid of the rock sample and the pore volume, the physical properties of the rock were measured, and the types of rock pores/fractures were qualitatively determined. In standard NMR T2 spectra, the signal intensity reflects the pore volume, and the relaxation time reflects the pore throat size and indirectly reflects the fractures [23]. Previous studies have established standard NMR T2 spectra based on matrix-porous and matrix-porous + fractured reservoirs for the Longmaxi Formation in the southern Sichuan Basin; namely, the NMR T2 spectrum of matrix-porous shale was monomodal, while the NMR T2 spectrum of porous + fractured shale was bimodalor polymodal [23]. These achievements are of great significance when understanding the fracture/pore characteristics of the Wulalike Formation. In this study, the testing instrument was a nuclear magnetic resonance analyzer (MesoMR23-060H-I, Newman Analytical Instruments Co., Suzhou, China), and the experimental conditions were infiltration detections, which were tested according to the petroleum industry standard of China (SY/T 6490-2014) [34].
Deep and shallow resistivity and acoustic loggings are the most popular and best-performed conventional logging techniques for the evaluation of fracture zones in tight strata [24,25,26]. Deep and shallow resistivity dual-track method (Equation (1)) and uniform parameter values were attempted to quantitatively study the fracture porosity of shale in key exploration wells so as to reveal the distribution pattern and main controlling factors of fracture zones in the Wulalike Formation of northwestern Ordos Basin. Equation (1) is a formula for calculating the fracture porosity of tight rocks proposed by Schlumberger in 1982. Its theoretical model is based on a fracture system parallel to tight rock beds (i.e., a bed-parallel fracture system) [24]. Thus, it is suitable for the fracture system in the lower Wulalike Formation.
Φ f r = R m f × ( 1 R L L S 1 R L L D ) m
where Φfr is the fracture porosity, %; Rmf is the resistivity of the mud filtrate, Ω·m; m is the fracture porosity index (1.3–1.5; the median is usually taken, i.e., m = 1.4); RLLD and RLLS are, respectively, the deep and shallow resistivity response values of the fracture zone, Ω·m.
Clearly, Rmf is a key parameter in this model. According to the logging interpretation standard, Rmf is generally estimated from field mud resistivity and formation temperature [24,25]; however, this method is inapplicable to the Wulalike Formation for which the field data of mud resistivity is generally unavailable. In this study, reliable data points in the fracture zone within the evaluation area were used to calibrate Rmf.
In addition, testing methods, including SEM, and the thin section were used to reveal reservoir space types of the Wulalike Formation. The SEM is a Backscattered Electron imager (Apreo 2S, Thermo Scientific Co., Brno, Czech). The testing wasbased on the petroleum industry standard of China (SY/T 5162-2021) [35], with an ambient temperature of 20 °C and the use of gas N2. The shale sample is a flaky sample with a diameter of less than 25 mm. The thin section testing instrument and its number are OLYMPUS BX53 (Olympus Co., Tokyo, Japan). The testing wasbased on the petroleum industry standard of China (SY/T 5368-2016) [36] for rock-thin section identification, and the sample wasmade into cast-thin sections.

4. Results

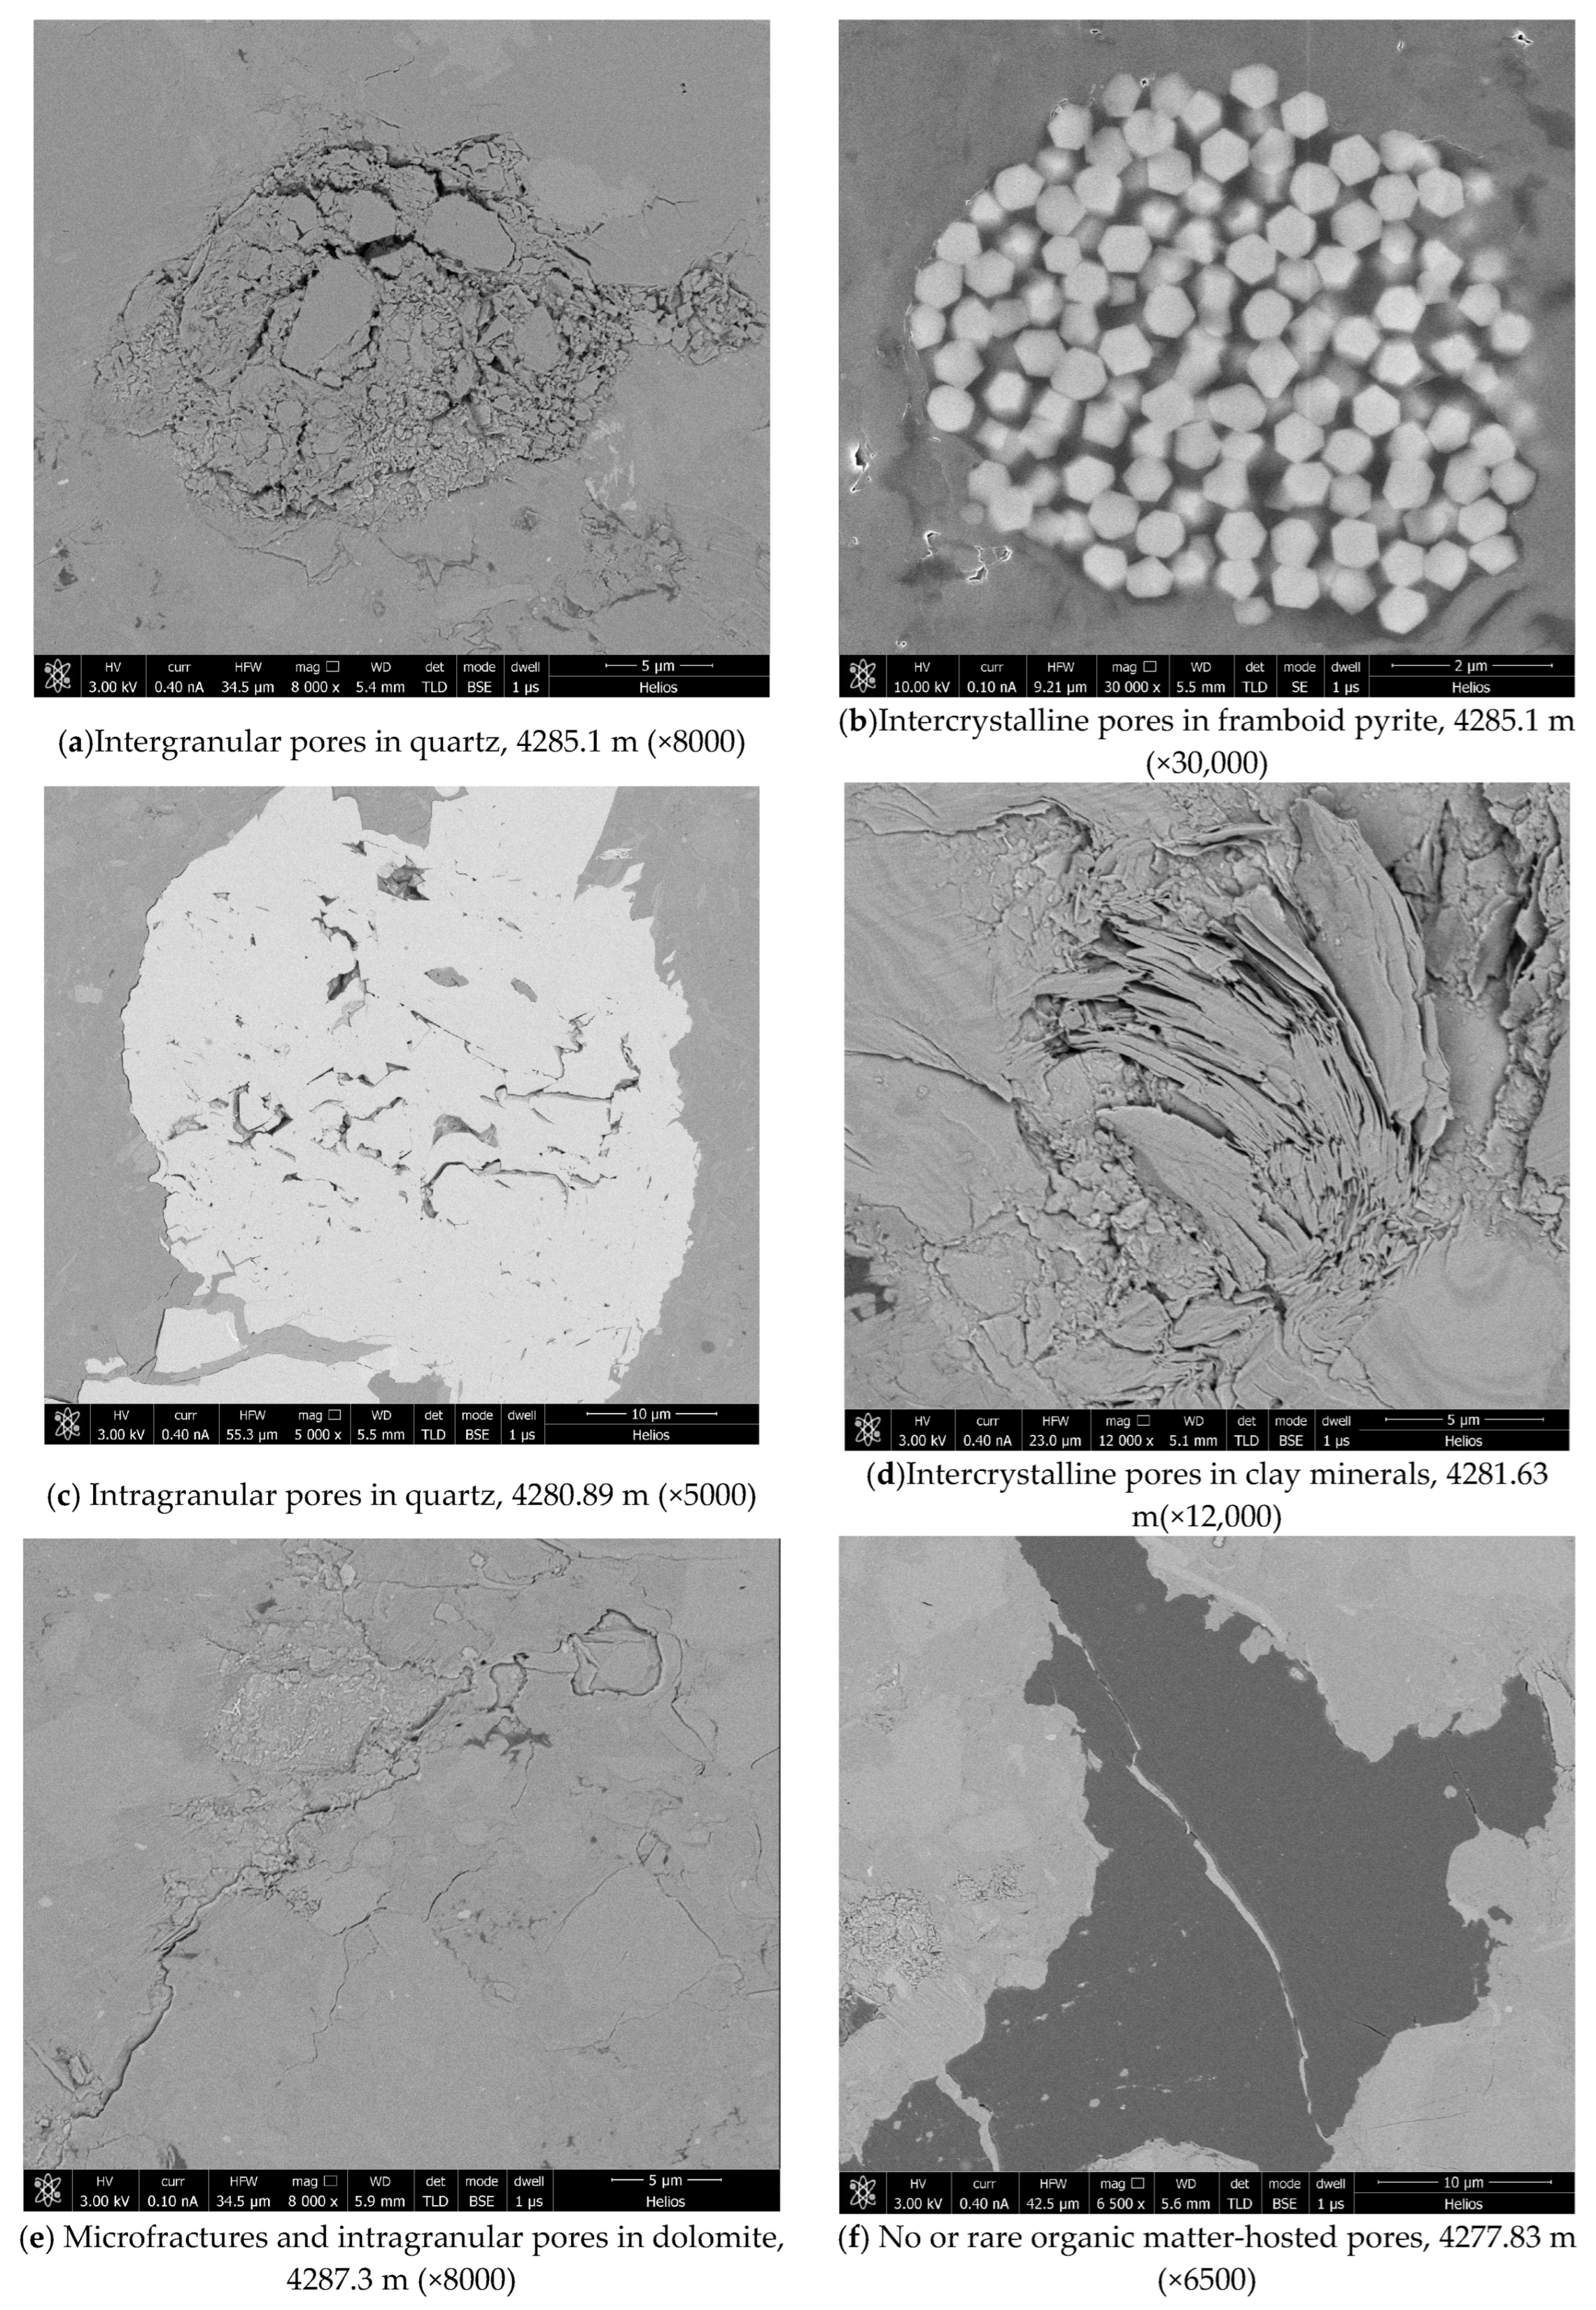
4.1. Reservoir Space Types

High-precision SEM and thin section data from Well L105 indicate that the pore/fracture system of Wulalike Formation mainly includes intergranular/intercrystalline pores and intragranular (dissolution) pores in brittle minerals (e.g., quartz, feldspar, dolomite, and pyrite), intercrystalline pores in clay minerals, organic matter-hosted pores, and fractures, with inorganic pores and (micro) fractures appearing dominant, with no or rare organic matter-hosted pores (Figure 4). According to the thin section identification in rock samples from Well L105 (Figure 2 and Figure 4g,h), fractures were found in all 40 shale core thin sections under the microscope, with 1–10 fractures in each section. These fractures were mainly bed-parallel, with a width of about 0.02–0.20 mm. A total of 134 fractures were observed, including 104 unfilled and partially analcime-filled fractures (89.1%) (Figure 5). This suggests that the Wulalike Formation in the northwestern Ordos Basin contains matrix pores (mainly inorganic pores) but also a widely developed fracture system with good permeability. The presence of fractures/pores is undoubtedly a significant characteristic of the Wulalike Formation reservoir. Here, fractures/pores in the lower Wulalike Formation are characterized to further reveal the fracture types, development characteristics, and regional variation in fracture porosity in this shale section.

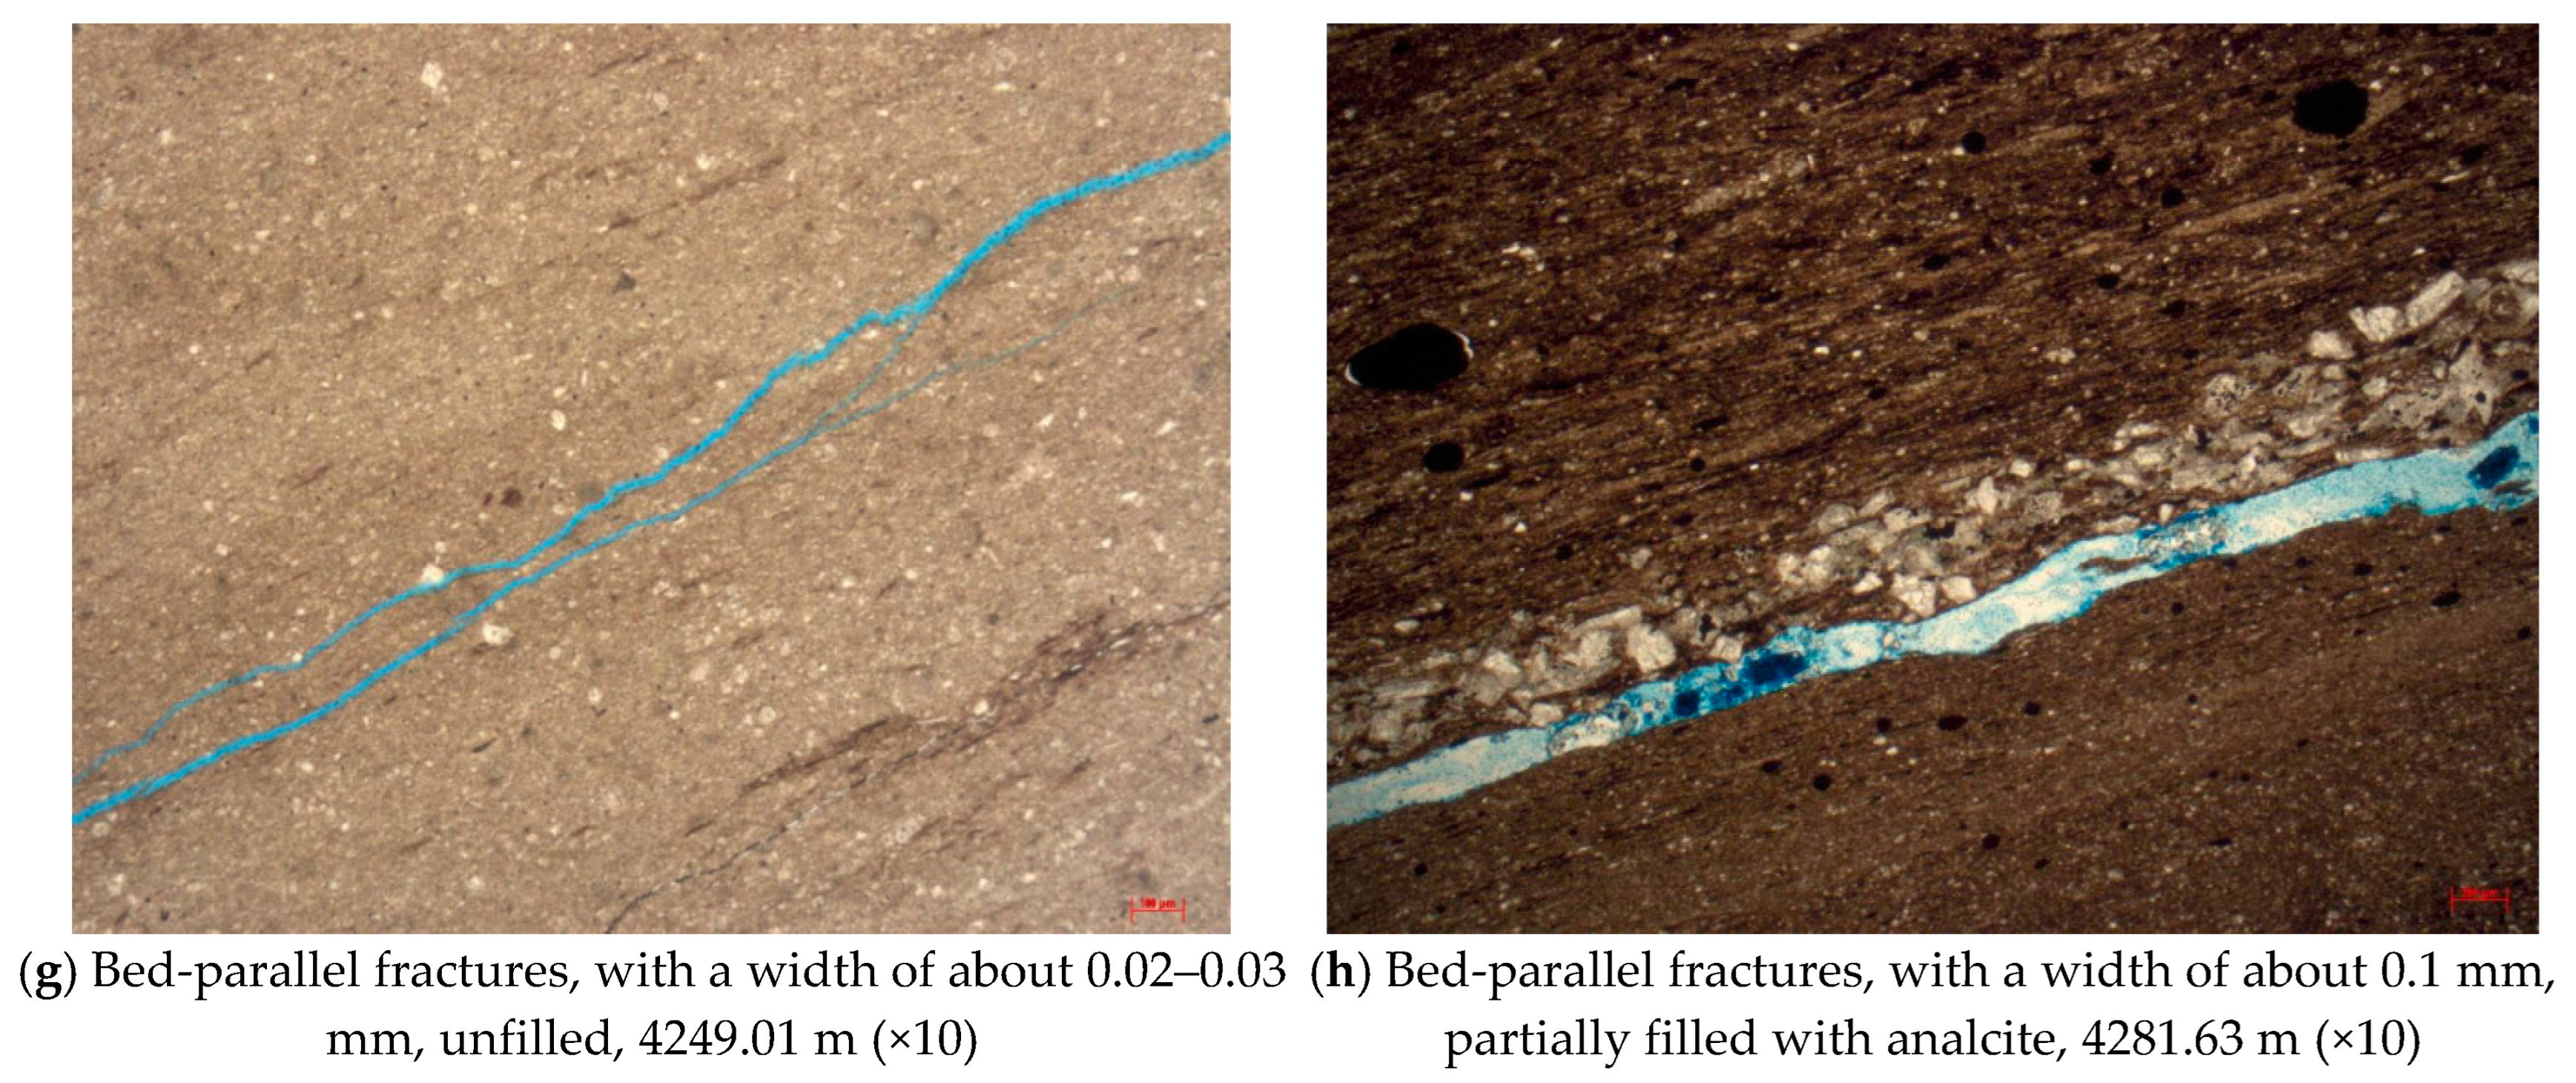
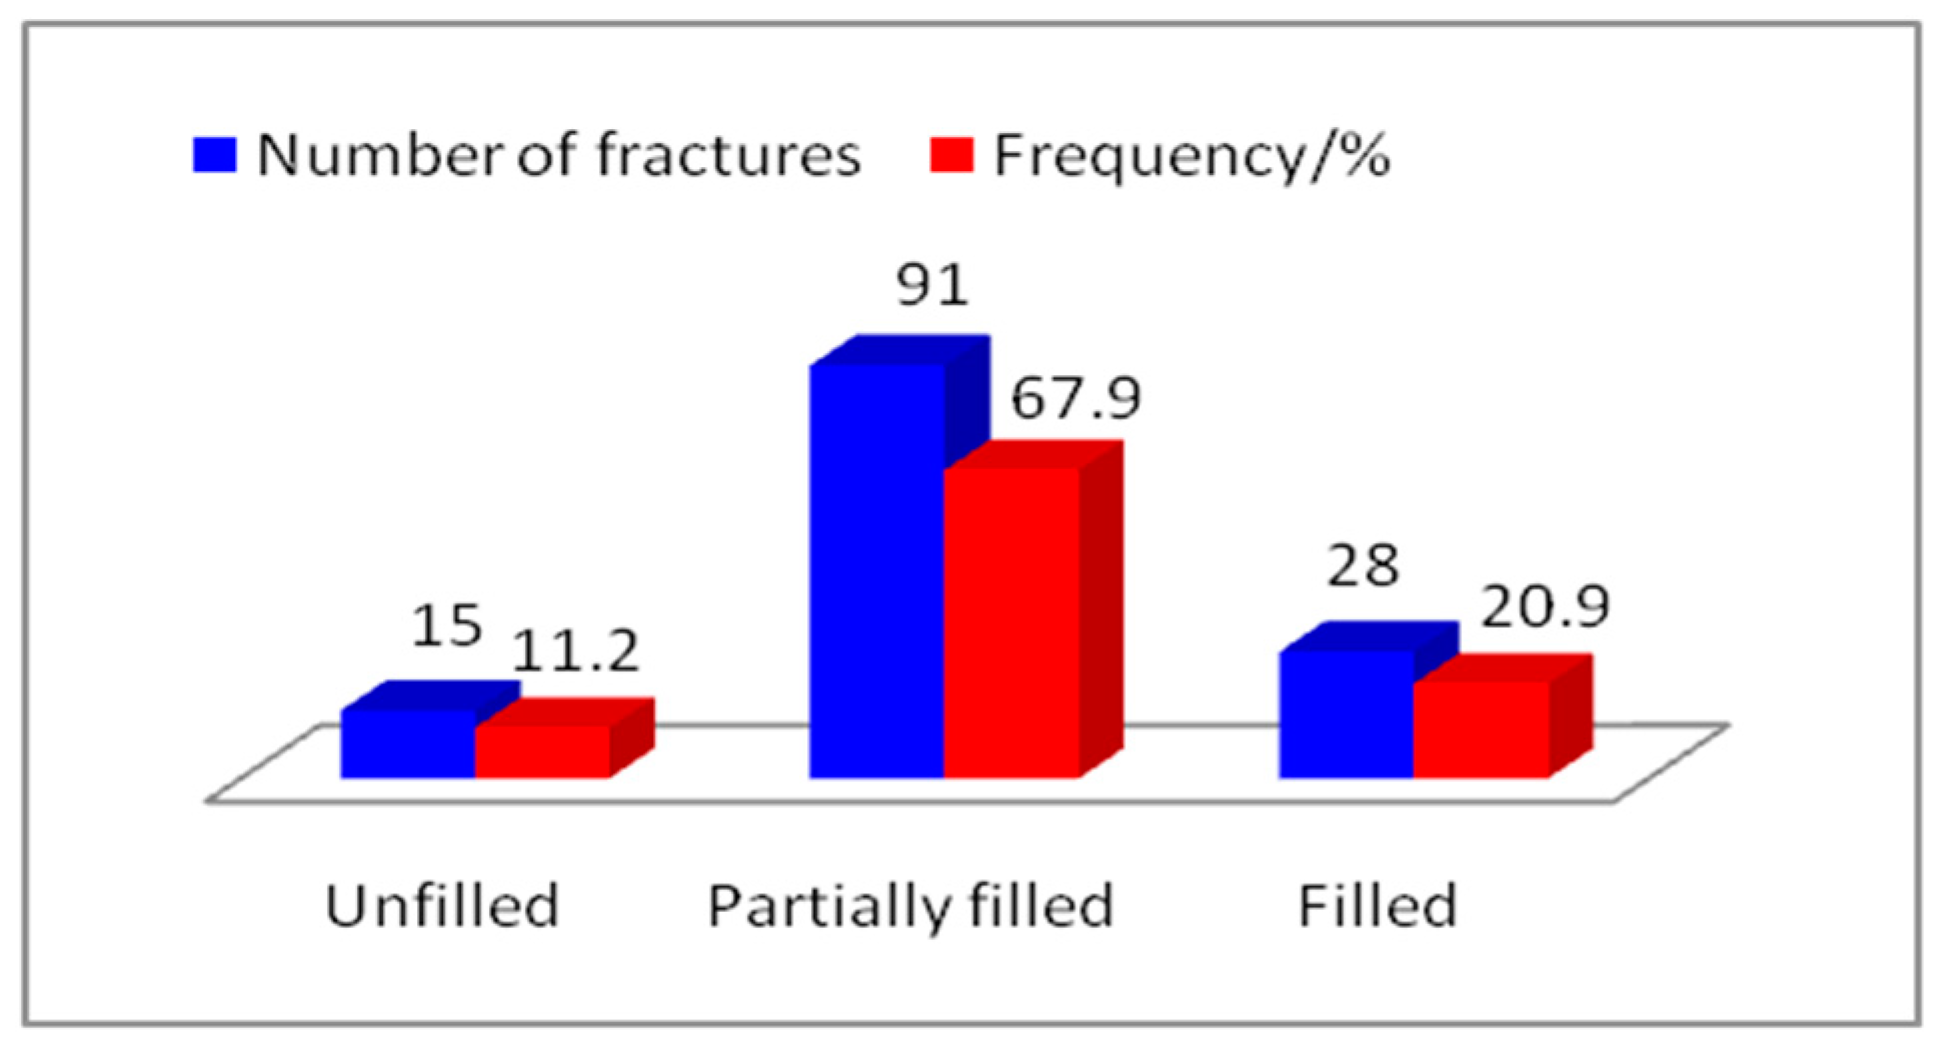
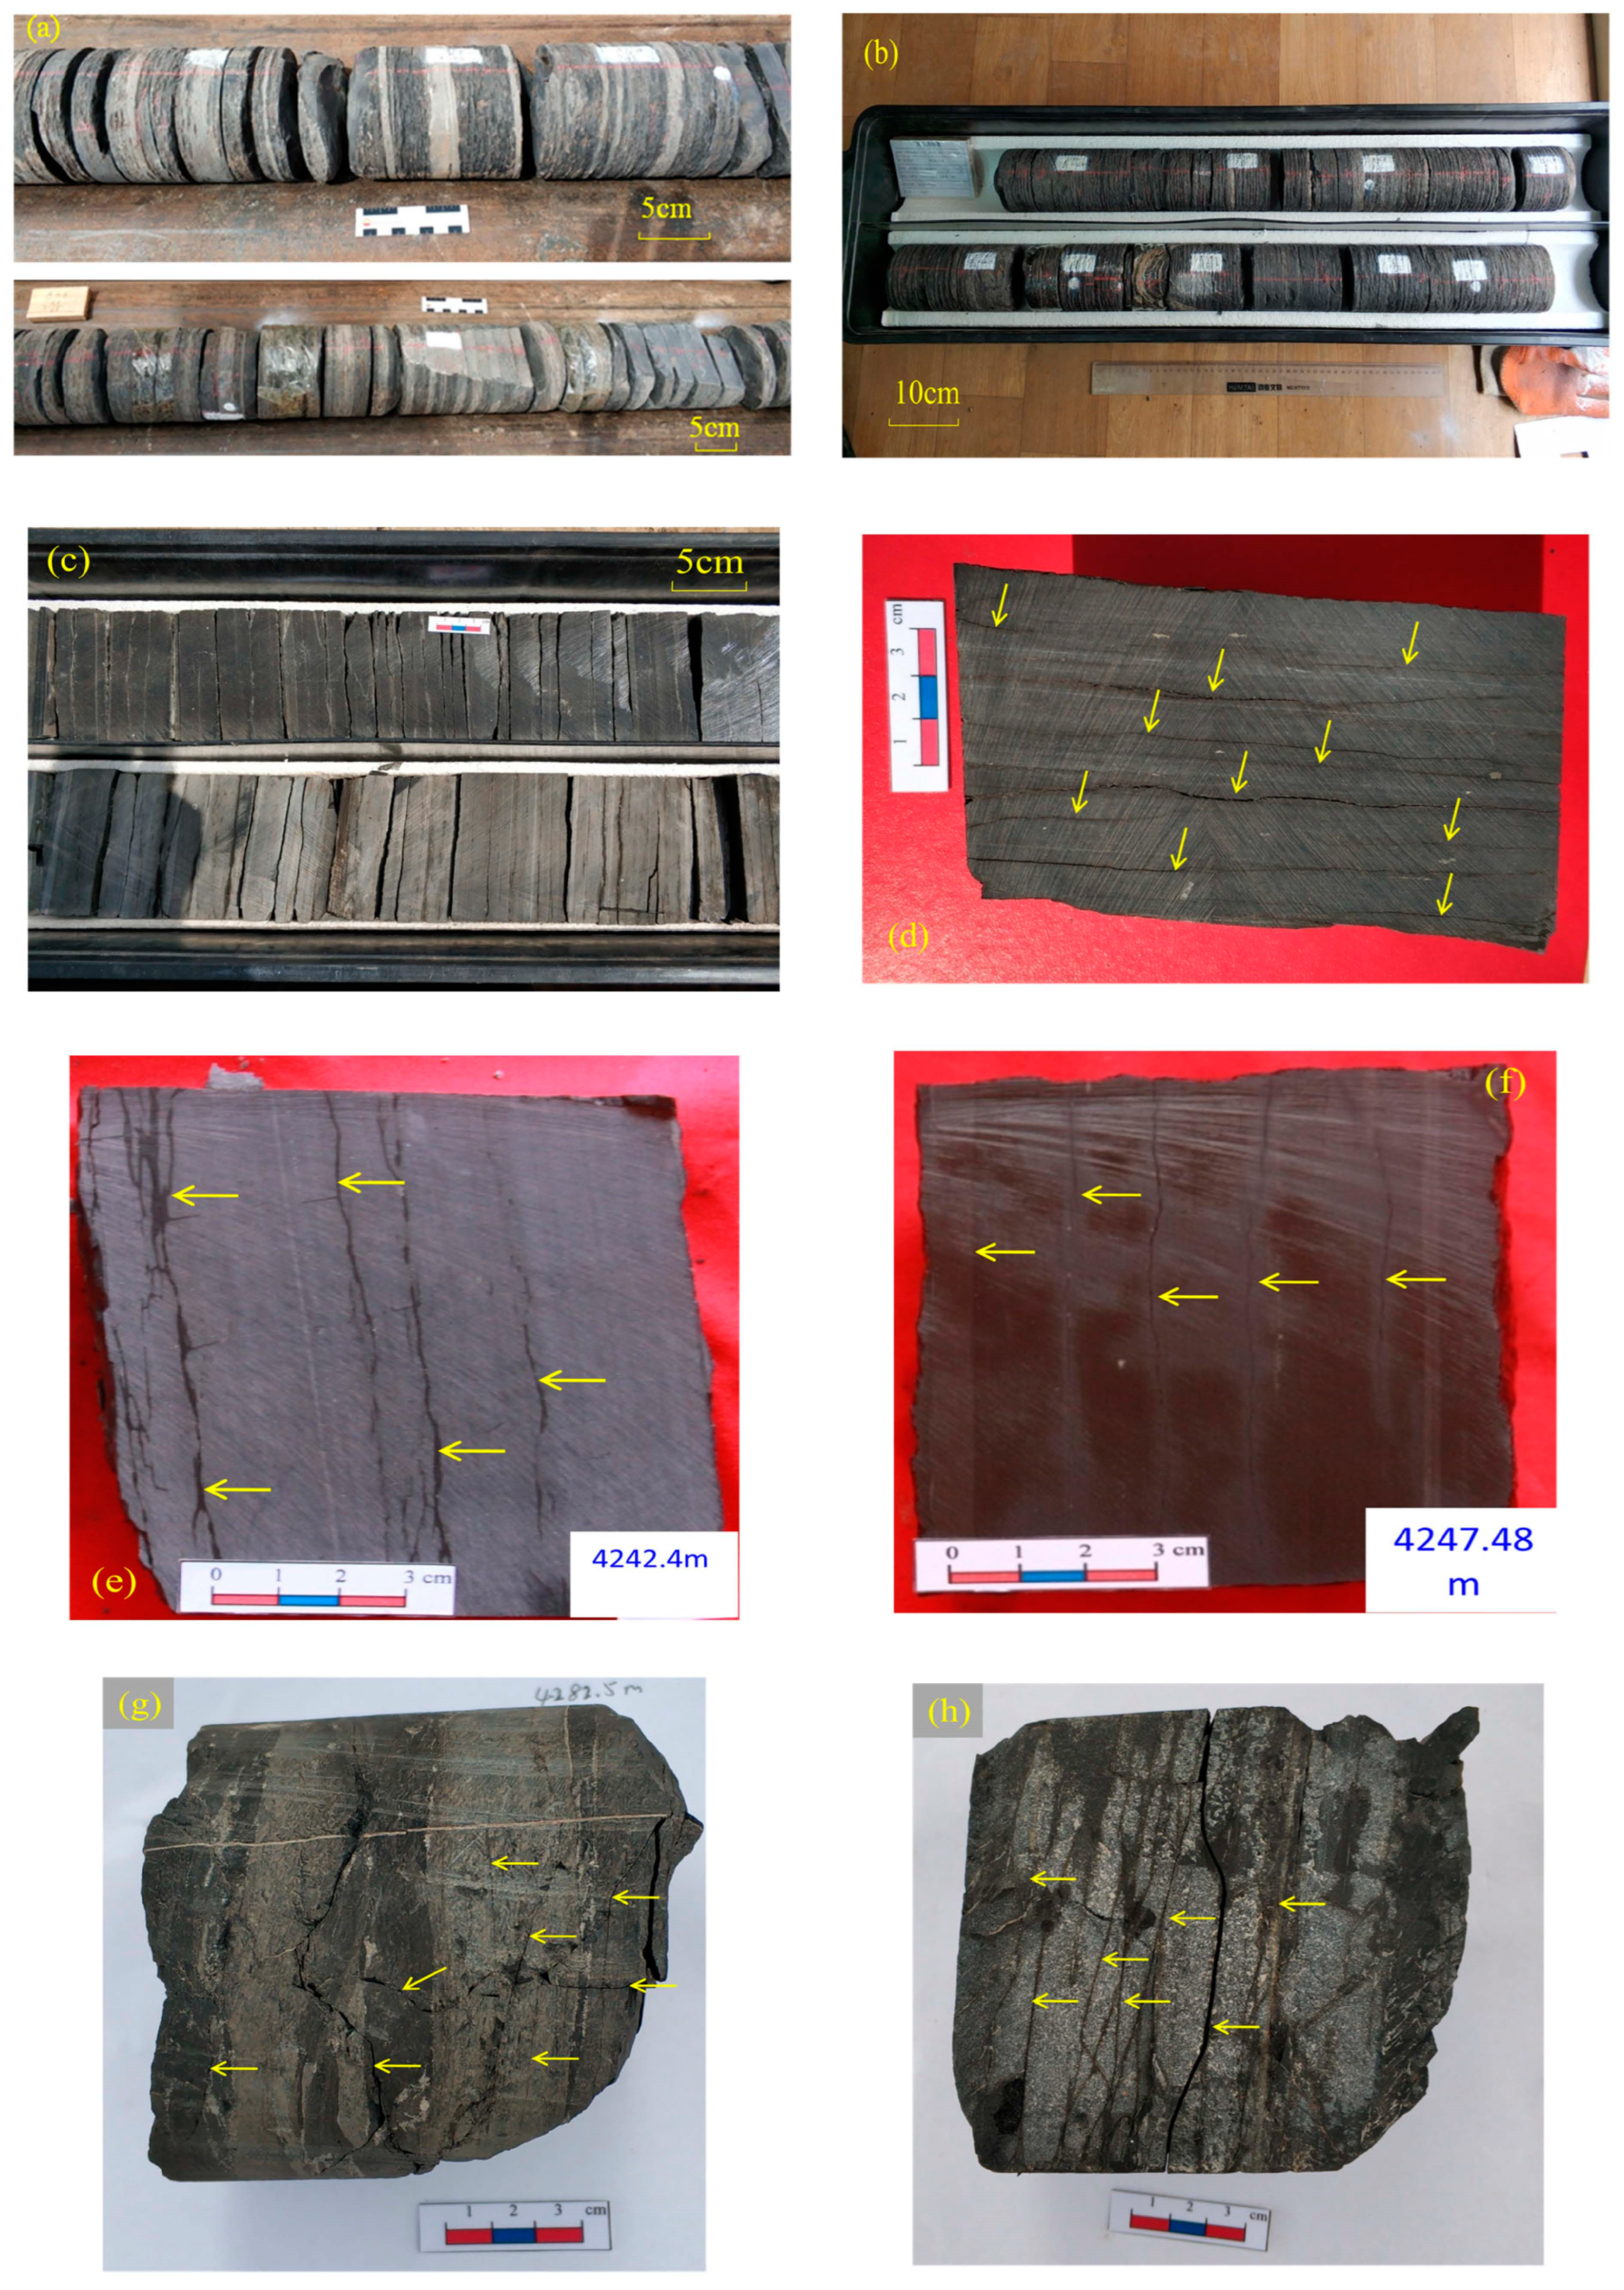
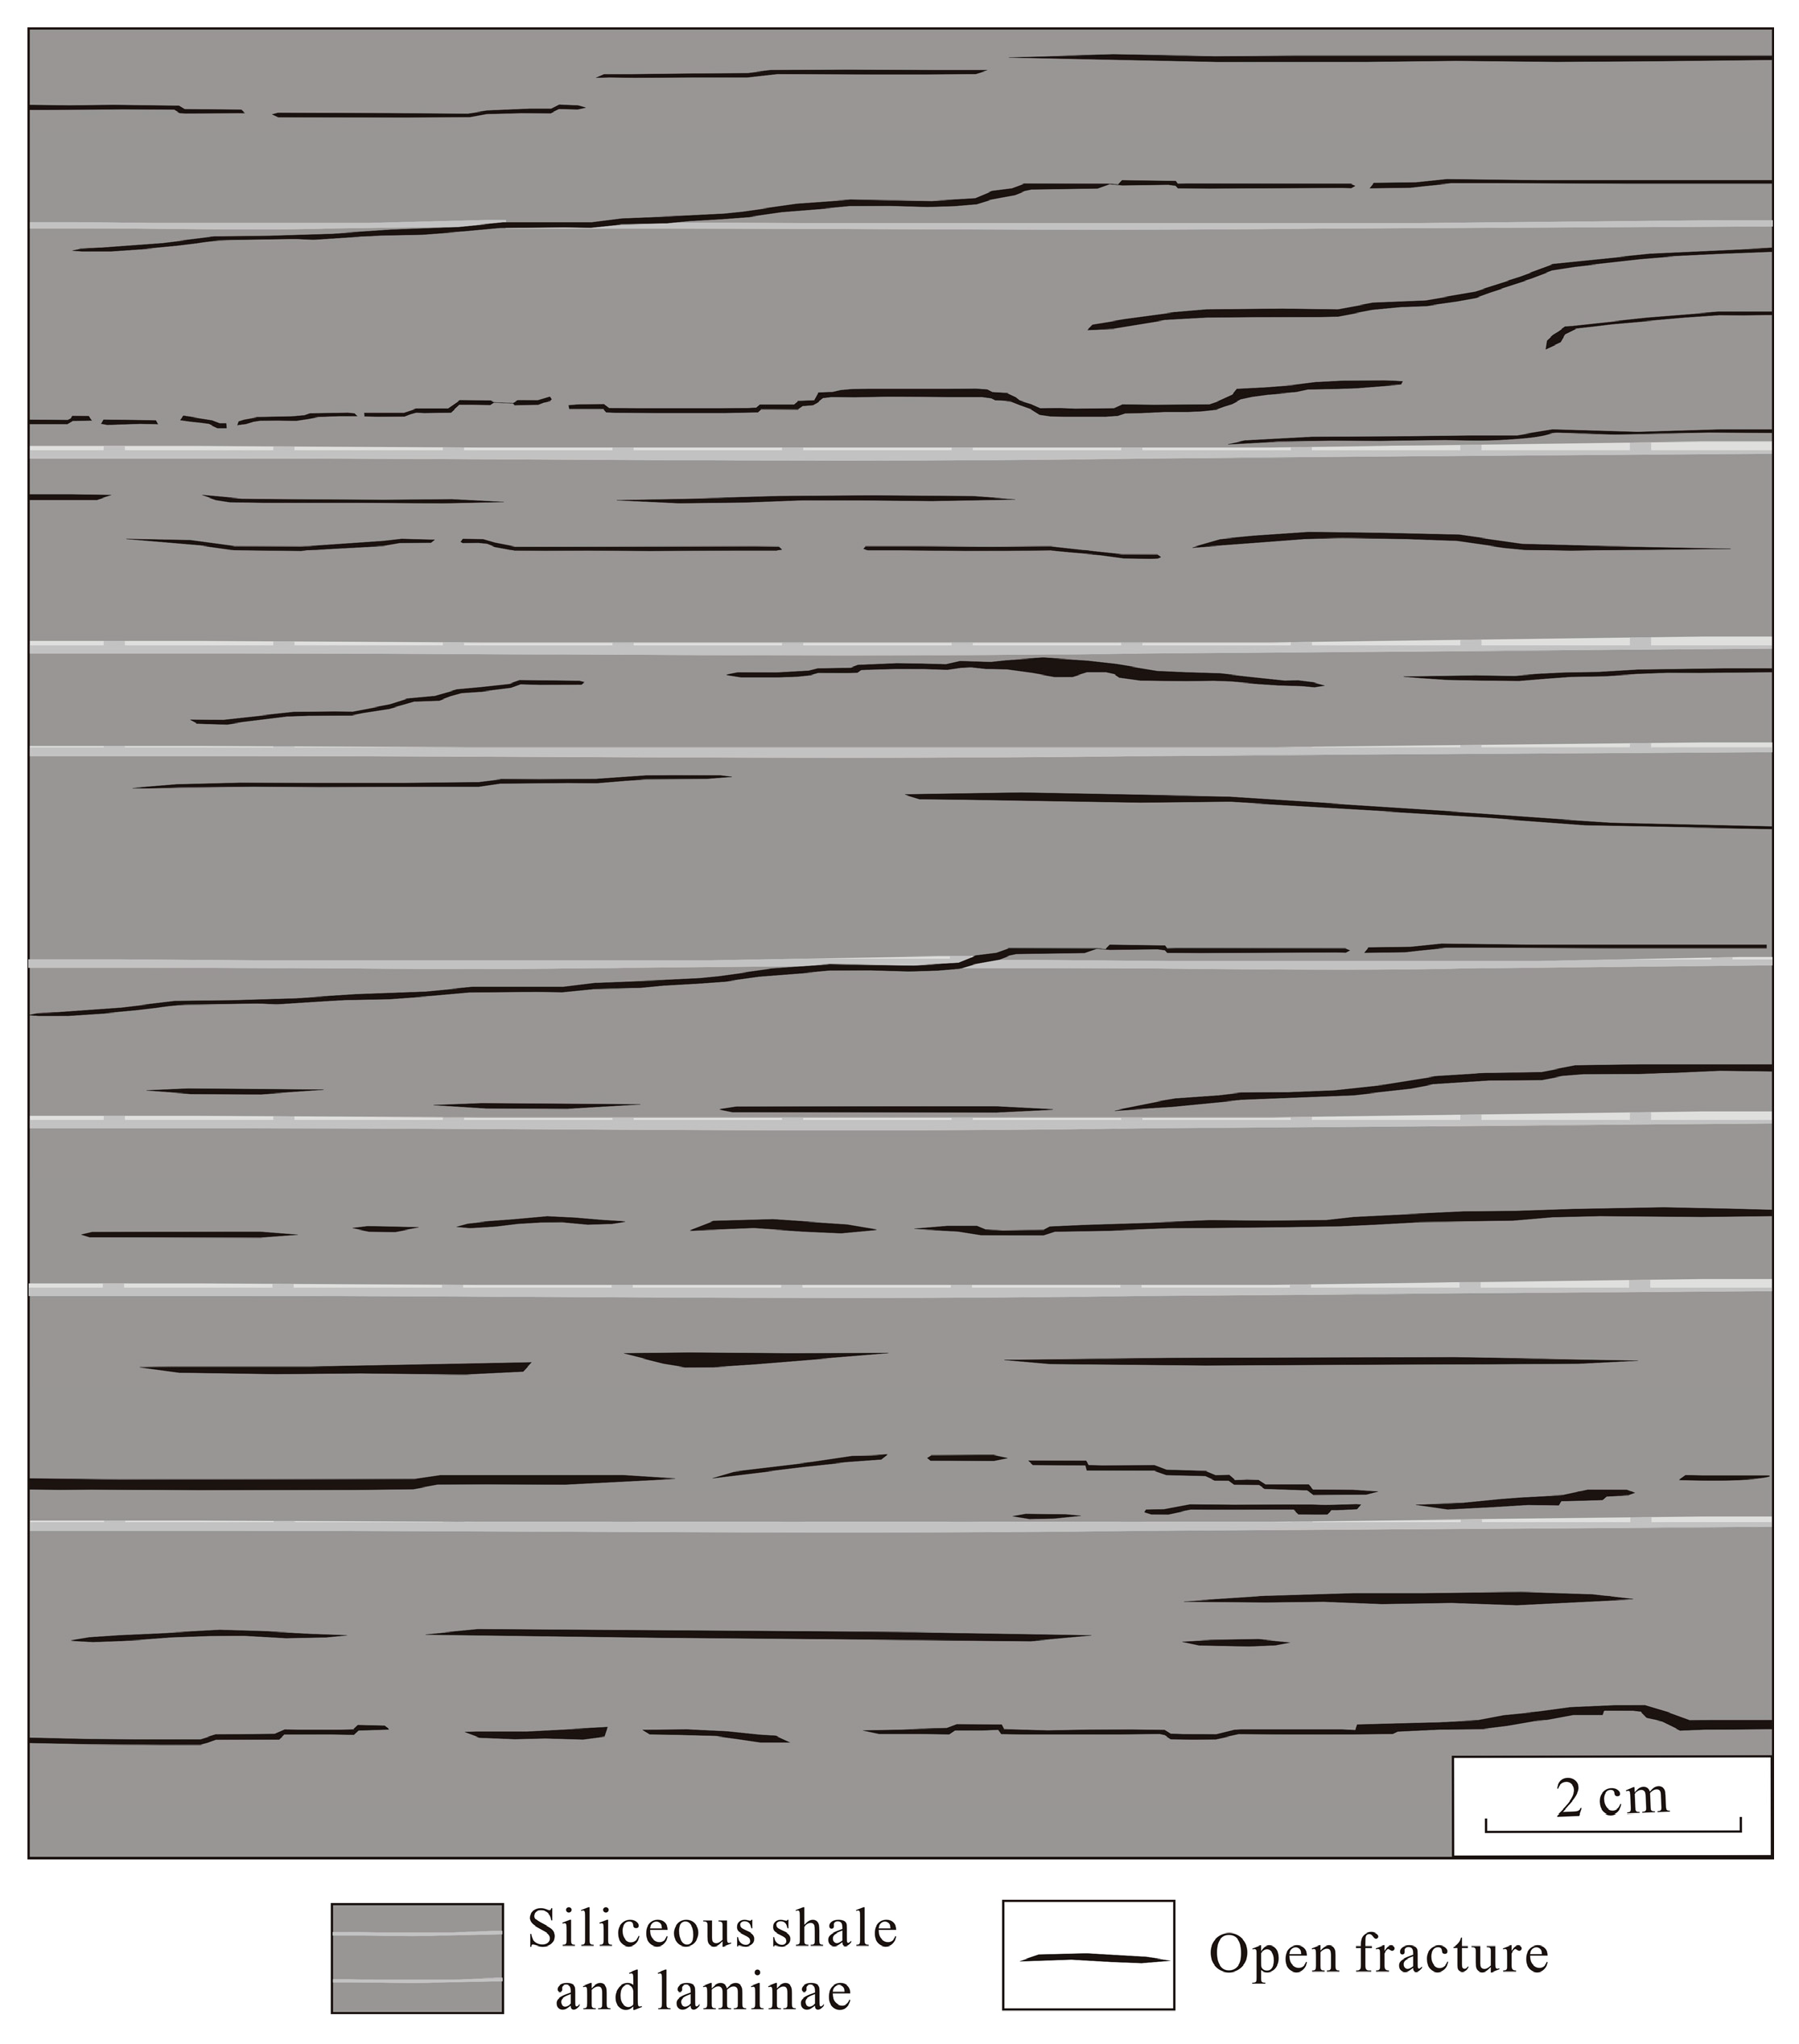
4.2. Fracture Characteristic from Core Observation

In Well Z15, the Wulalike Formation was about 99 m thick (4178.5–4277 m), from which eight barrels of cores were taken with 51.6 m footage from 4182 m. The 4182–4190 m and 4225.8–4231.8 m intervals are specifically described (in Figure 6a,b). The 4182–4190 interval, in the upper Wulalike Formation contained calcareous shale intercalated with marl. These cores were severely fractured at 1.5–8.5 cm long individually, indicating the extreme development of in situ bed-parallel fractures, which were mostly open fractures. The 4225.8–4231.8 m interval in the lower Wulalike Formation, consists of gray-black shale that is relatively pure and mingled with calcareous bands occasionally. These cores are severely fractured and 2–14 cm long individually, indicating the reduced presence of in situ bed-parallel fractures compared to the upper Wulalike Formation.
In Well L99, only 27 m cores were taken from the lower Wulalike Formation (4422–4449 m). The core recovery in the 4432–4449 m interval was less than 50% due to the presence of fractures and core breakage (Figure 6c). Meanwhile, 10 m long cores were obtained at 4422–4432 m, with a recovery of 100% (Figure 6d). The lower 7 m part of the 4422–4432 m interval consisted of a siliceous shale with calcareous bands (2–5 mm individually) occasionally, from which the cores taken were severely fractured and 1.5–3.0 cm long individually, containing a large quantity of graptolites (incl. orthograptus, dicellograptus, and dendrograptus). A large number of open fractures were observed on the longitudinal section of cores, including mainly horizontal fractures (or bed-parallel fractures), with an average width of 0.1 mm and spacing of 0.5–0.8 cm. The upper 3 m part consisted of laminated siliceous shale and gravity-flow conglomeratic, limestone, with similar siliceous shale and fracture characteristics to the lower 7 m part where a 50 cm-thick gravity flow from limestone (containing breccia with a particle size of 0.5–1.0 cm at the bottom, and a mud boulder with a particle size of 0.2–0.5 cm in the middle) was seen.
In Well ZP1, cores from the 4226.5 to 4281.8 m interval in the lower Wulalike Formation were fractured to a similar extent to that in Wells L99 and Z15. For example, cores at 4242.40 m developed multiple bed-parallel fractures with a width of 0.1–0.2 mm and spacing of 0.8–2.5 cm reflecting an RLLD/RLLS ratio of 1.17; cores at 4247.48 m contained four bed-parallel fractures with a width of 0.l mm and spacing of l–2 cm, reflecting an RLLD/RLLS ratio of 1.19 (Figure 6e,f).
In Well L105, the Wulalike Formation, 45 m thick (4244.0–4289.0 m), was fully cored. Cores from the lower Wulalike Formation were severely fractured. For example, cores at 4282.5 m exhibited a fracture extent equivalent to that in Well L99, mainly containing open bed-parallel fractures with a width of 0.1–0.3 mm and high-angle fractures that locally did not cut through the shale, reflecting the RLLD/RLLS ratio of 1.41 while cores at 4284.05 m revealed siliceous shale with extremely developed fractures. These were mainly open bed-parallel fractures with a width of 0.1–0.2 mm and spacing of 0.5–2.0 cm, reflecting an RLLD/RLLS ratio of 1.44 (Figure 6g,h).
Based on the core observations above, the fracture distribution pattern of the lower Wulalike Formation in the Majiatan area was established. As shown in Figure 7, the lower Wulalike Formation was dominated by siliceous shale with abundant laminae, where open bed-parallel fractures were widely developed longitudinally. The single fracture spread at both a low angle and horizontally in an intermittent or continuous distribution, with a width of 0.1–0.2 mm, spacing of 0.5–2.5 cm, and the RLLD/RLLS ratio of 1.17–1.44. In addition, the distribution of fractures in the lower Wulalike Formation in the Majiatan area was dense and regular. According to this fracture distribution pattern, fracture porosity was estimated on seven rock samples from Wells L99, L105, and ZP1 (Table 2). The results show that the fracture porosity of the lower Wulalike Formation generally ranged from 0.50% to 2.00% (avg. 1.07%), 0.50–2.00% (avg. 1.15%) for the four cores from Well L99, 1.00% for the one core from Well L105, and 0.60–1.33% for the two cores from Well ZP1.

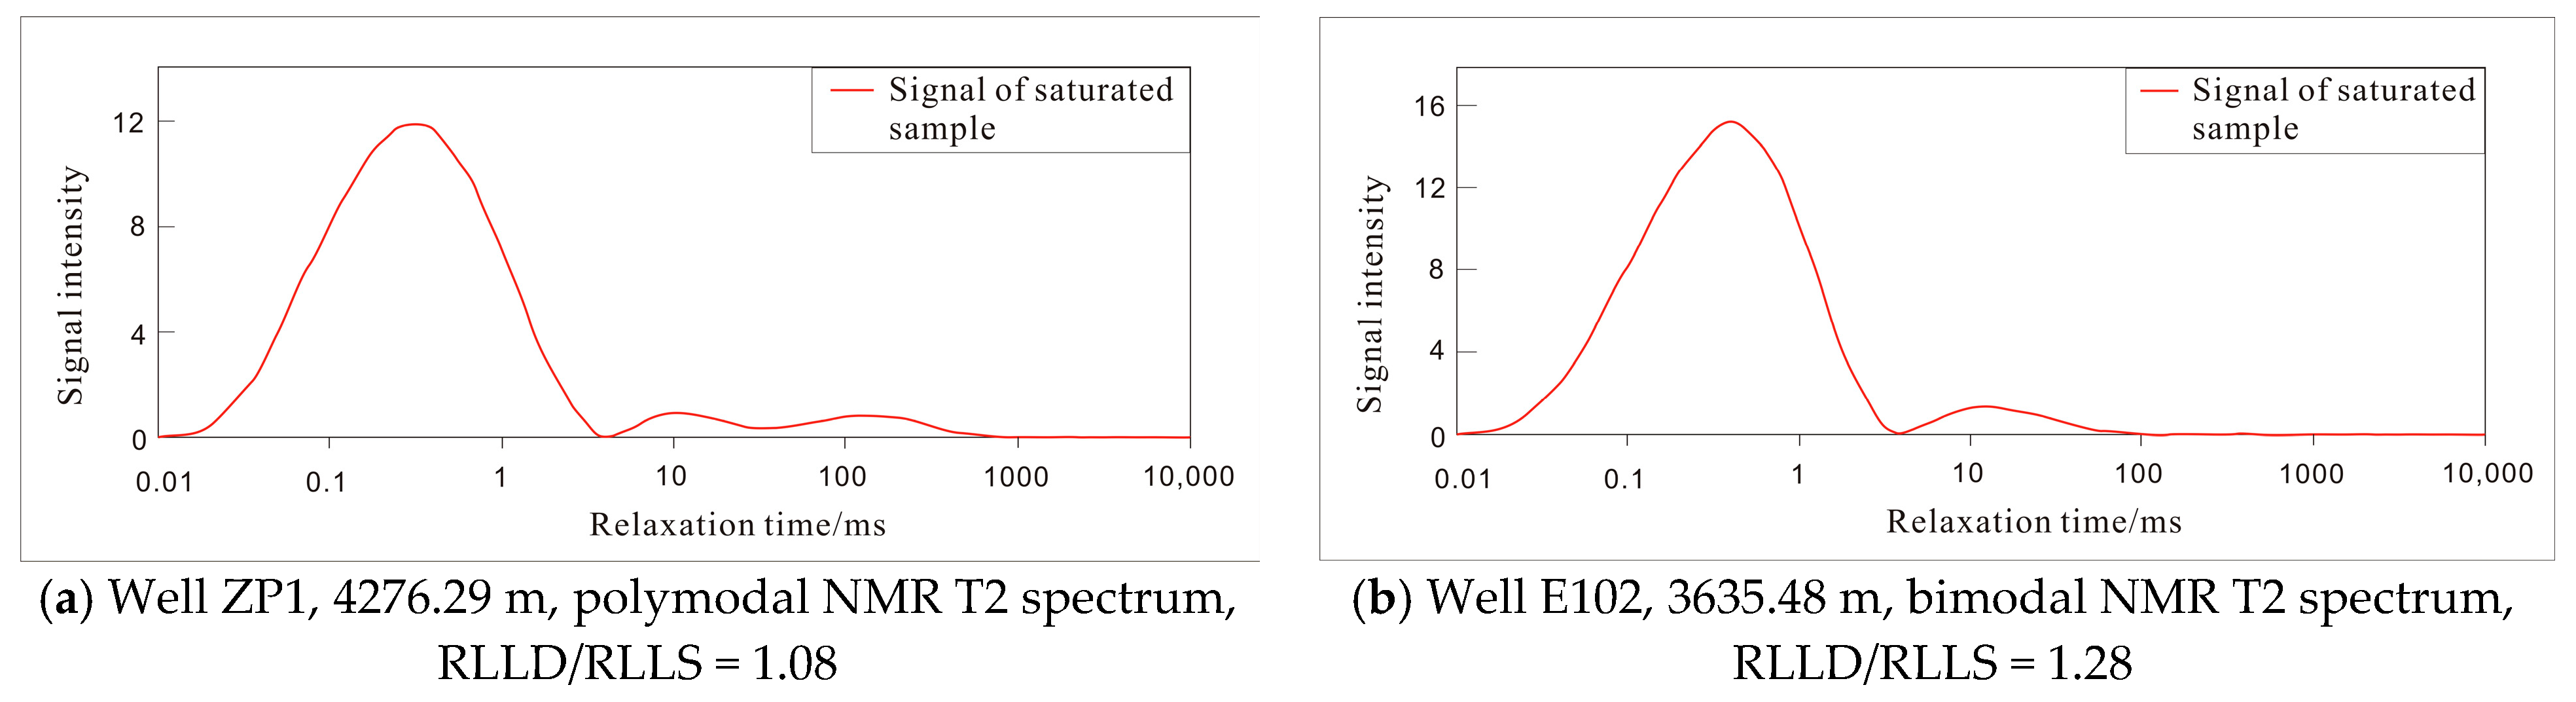
4.3. Fracture Characteristic in NMR Spectra

In this study, NMR was used to analyze and test the core samples from the lower Wulalike Formation in Well ZP1 and Well E102. The test results are shown in Figure 8.
The standard NMR T2 spectra of cores from Well ZP1 (4276.29 m) showed polymodal features, with a relaxation time of 4 ms and a main peak amplitude of about 12 (Figure 8a), corresponding to a total porosity of 3.70% and permeability of 1.48 × 10⁻⁵ μm2. The standard NMR T2 spectra of cores from Well E102 (3635.48 m) showed bimodal features with a relaxation time of 4 ms and a main peak amplitude of about 16 (Figure 8b), corresponding to a total porosity of 3.87% and permeability of 6.70 × 10⁻⁷ μm2. According to the available drilling results, the NMR spectra of the lower Wulalike Formation in the Majiatan and surrounding areas generally showed bimodal or polymodal features, further confirming that the lower Wulalike Formation contains well-developed fractures/pores, which are mostly open and consistent with the core occurrence.

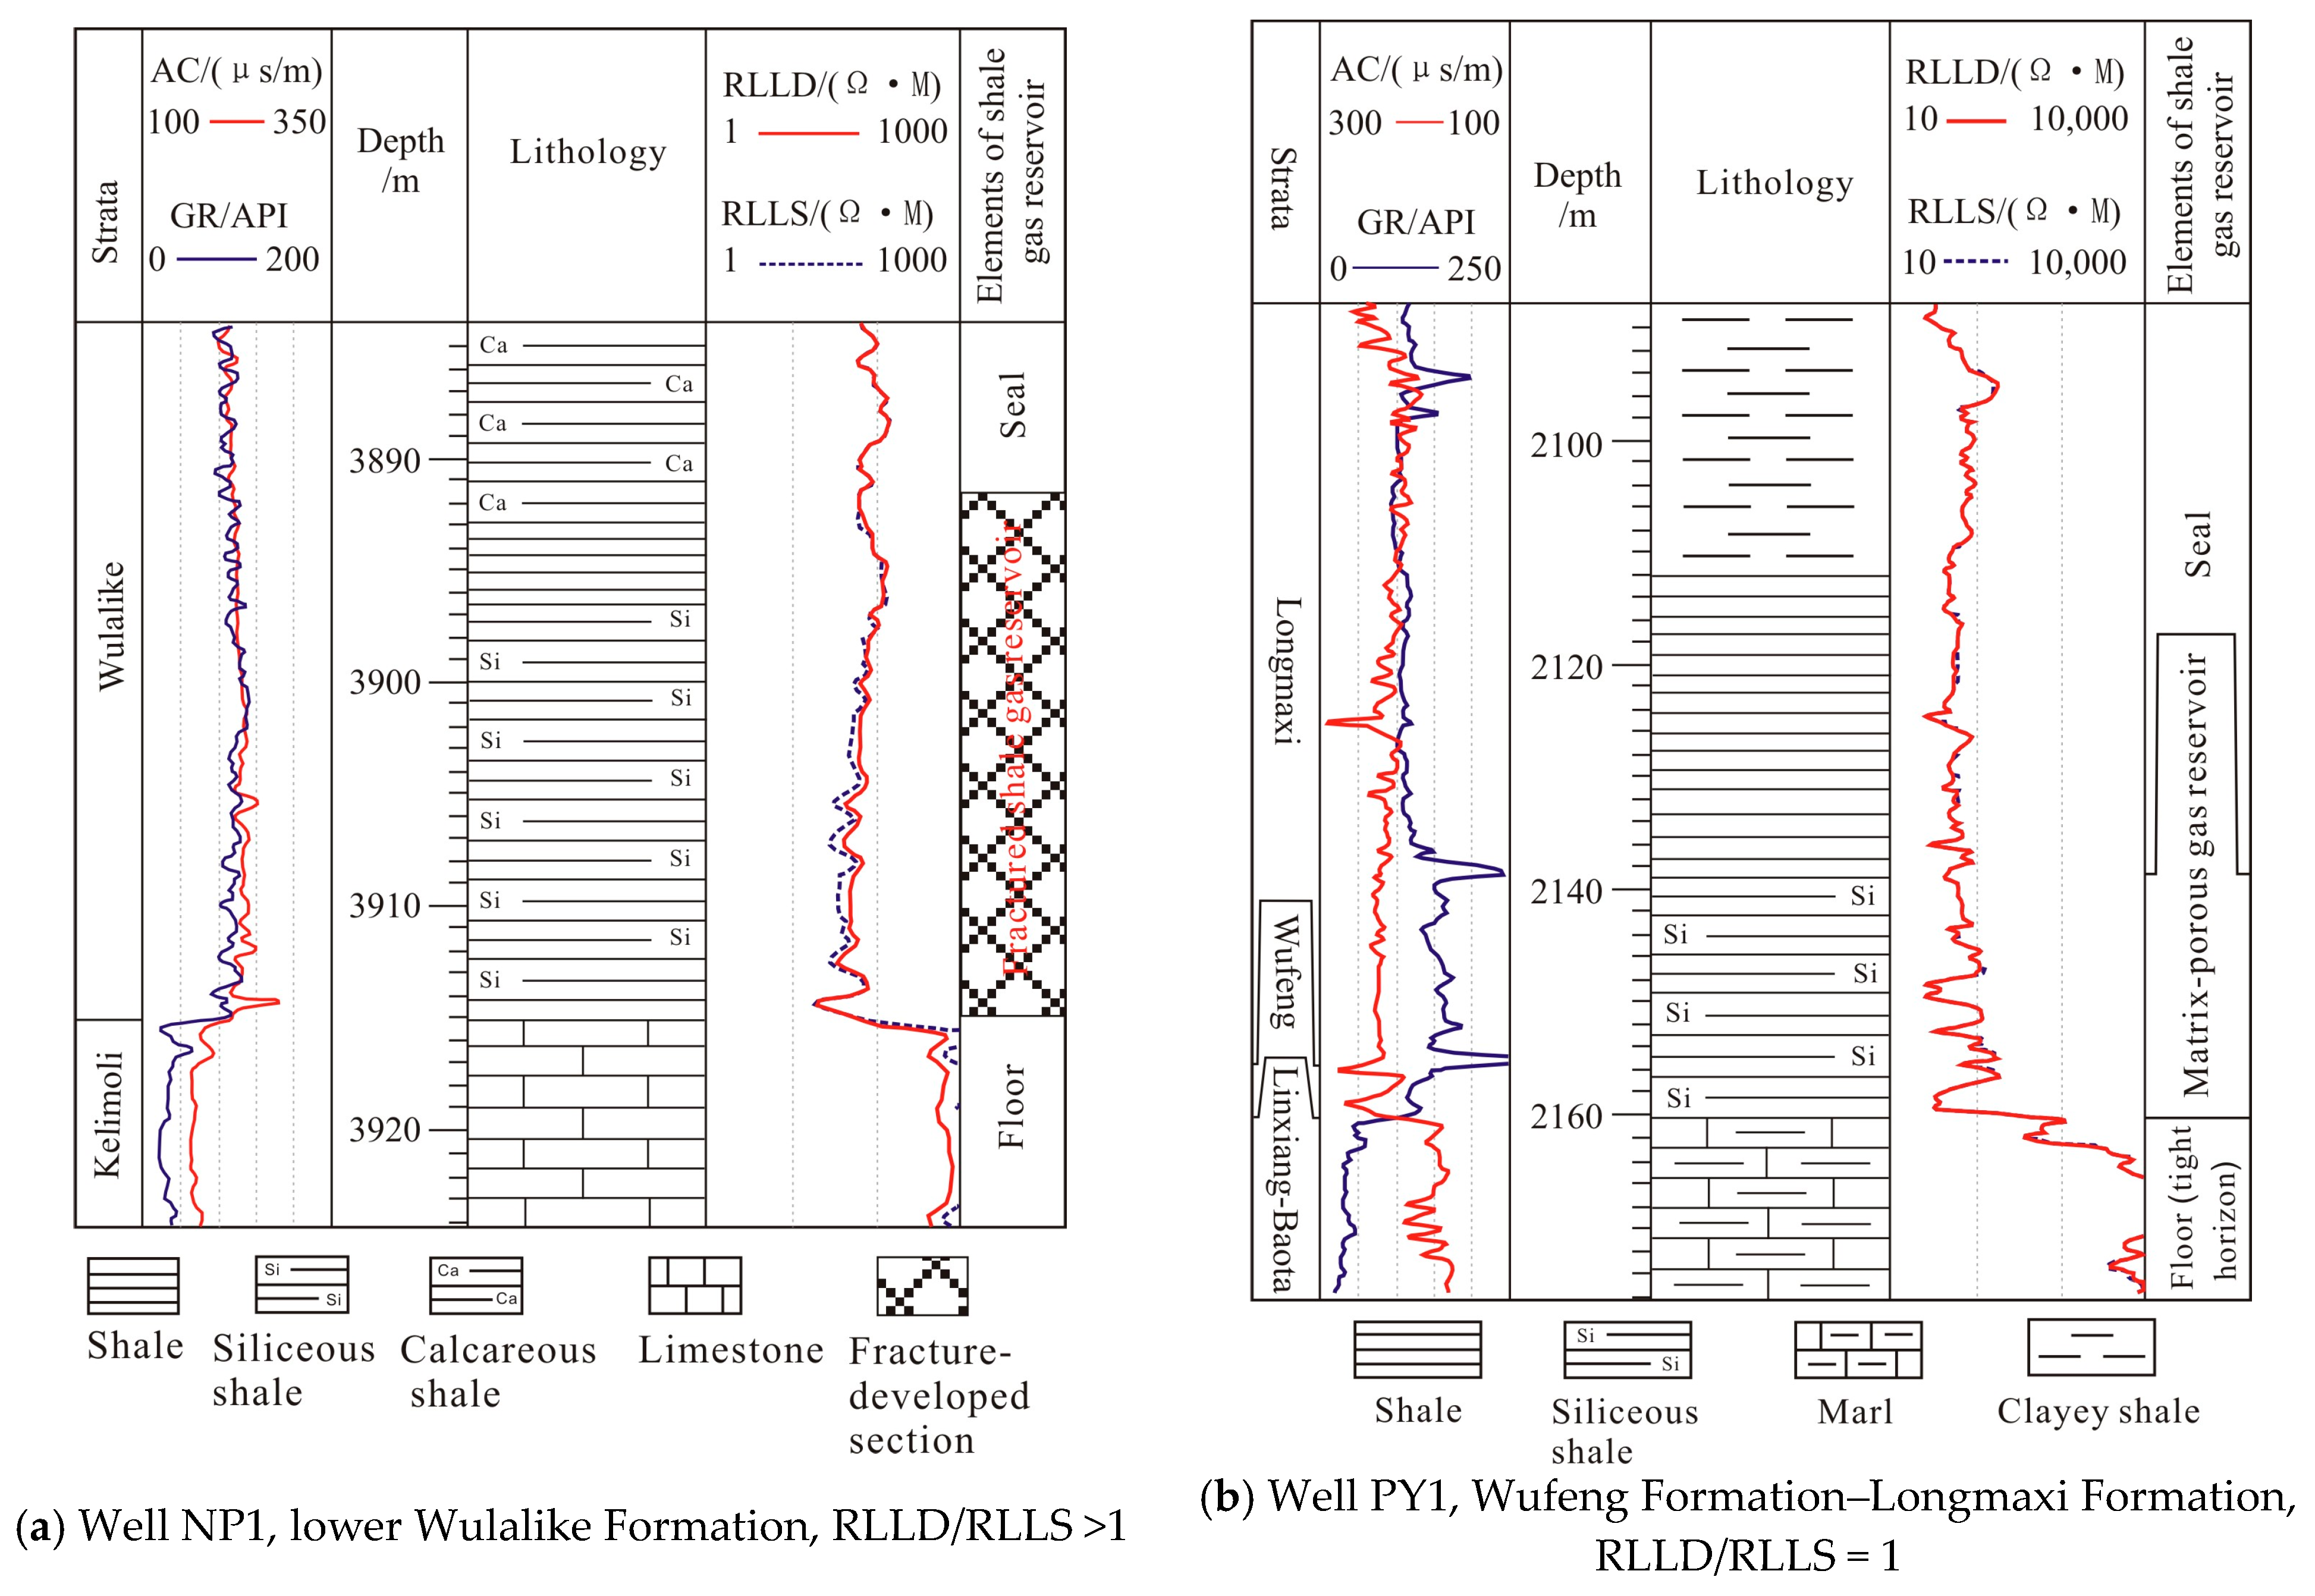
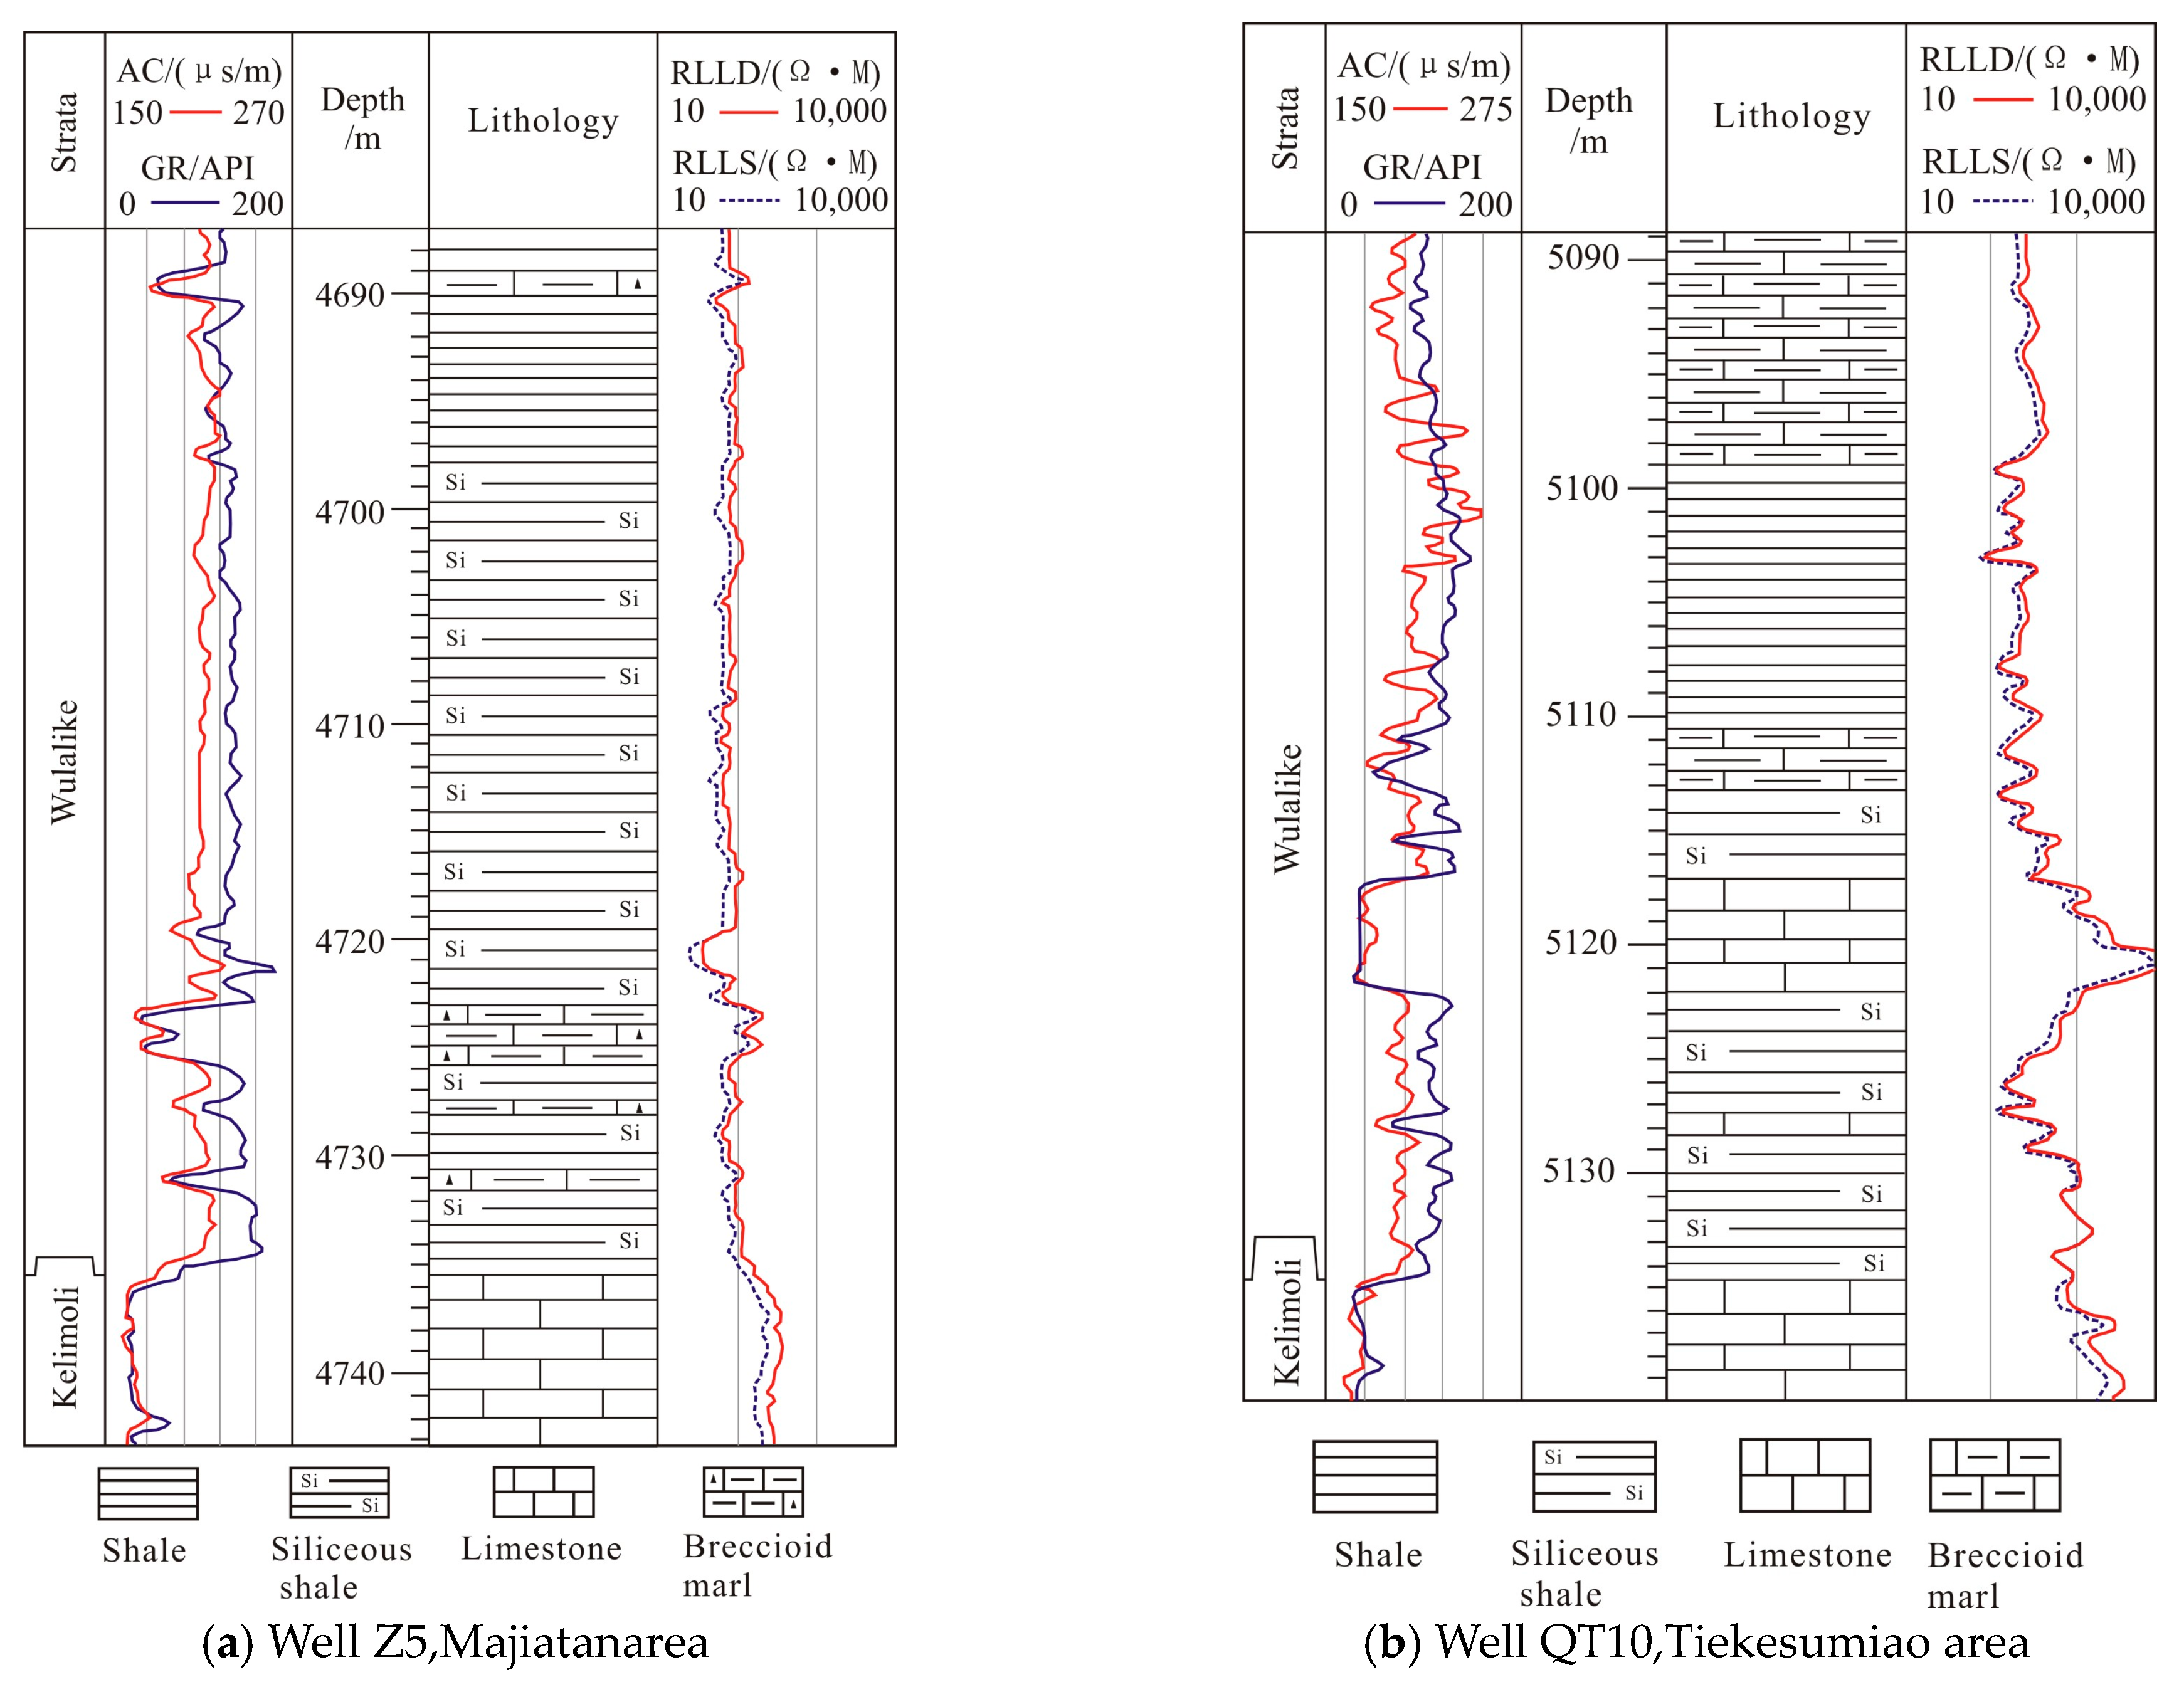
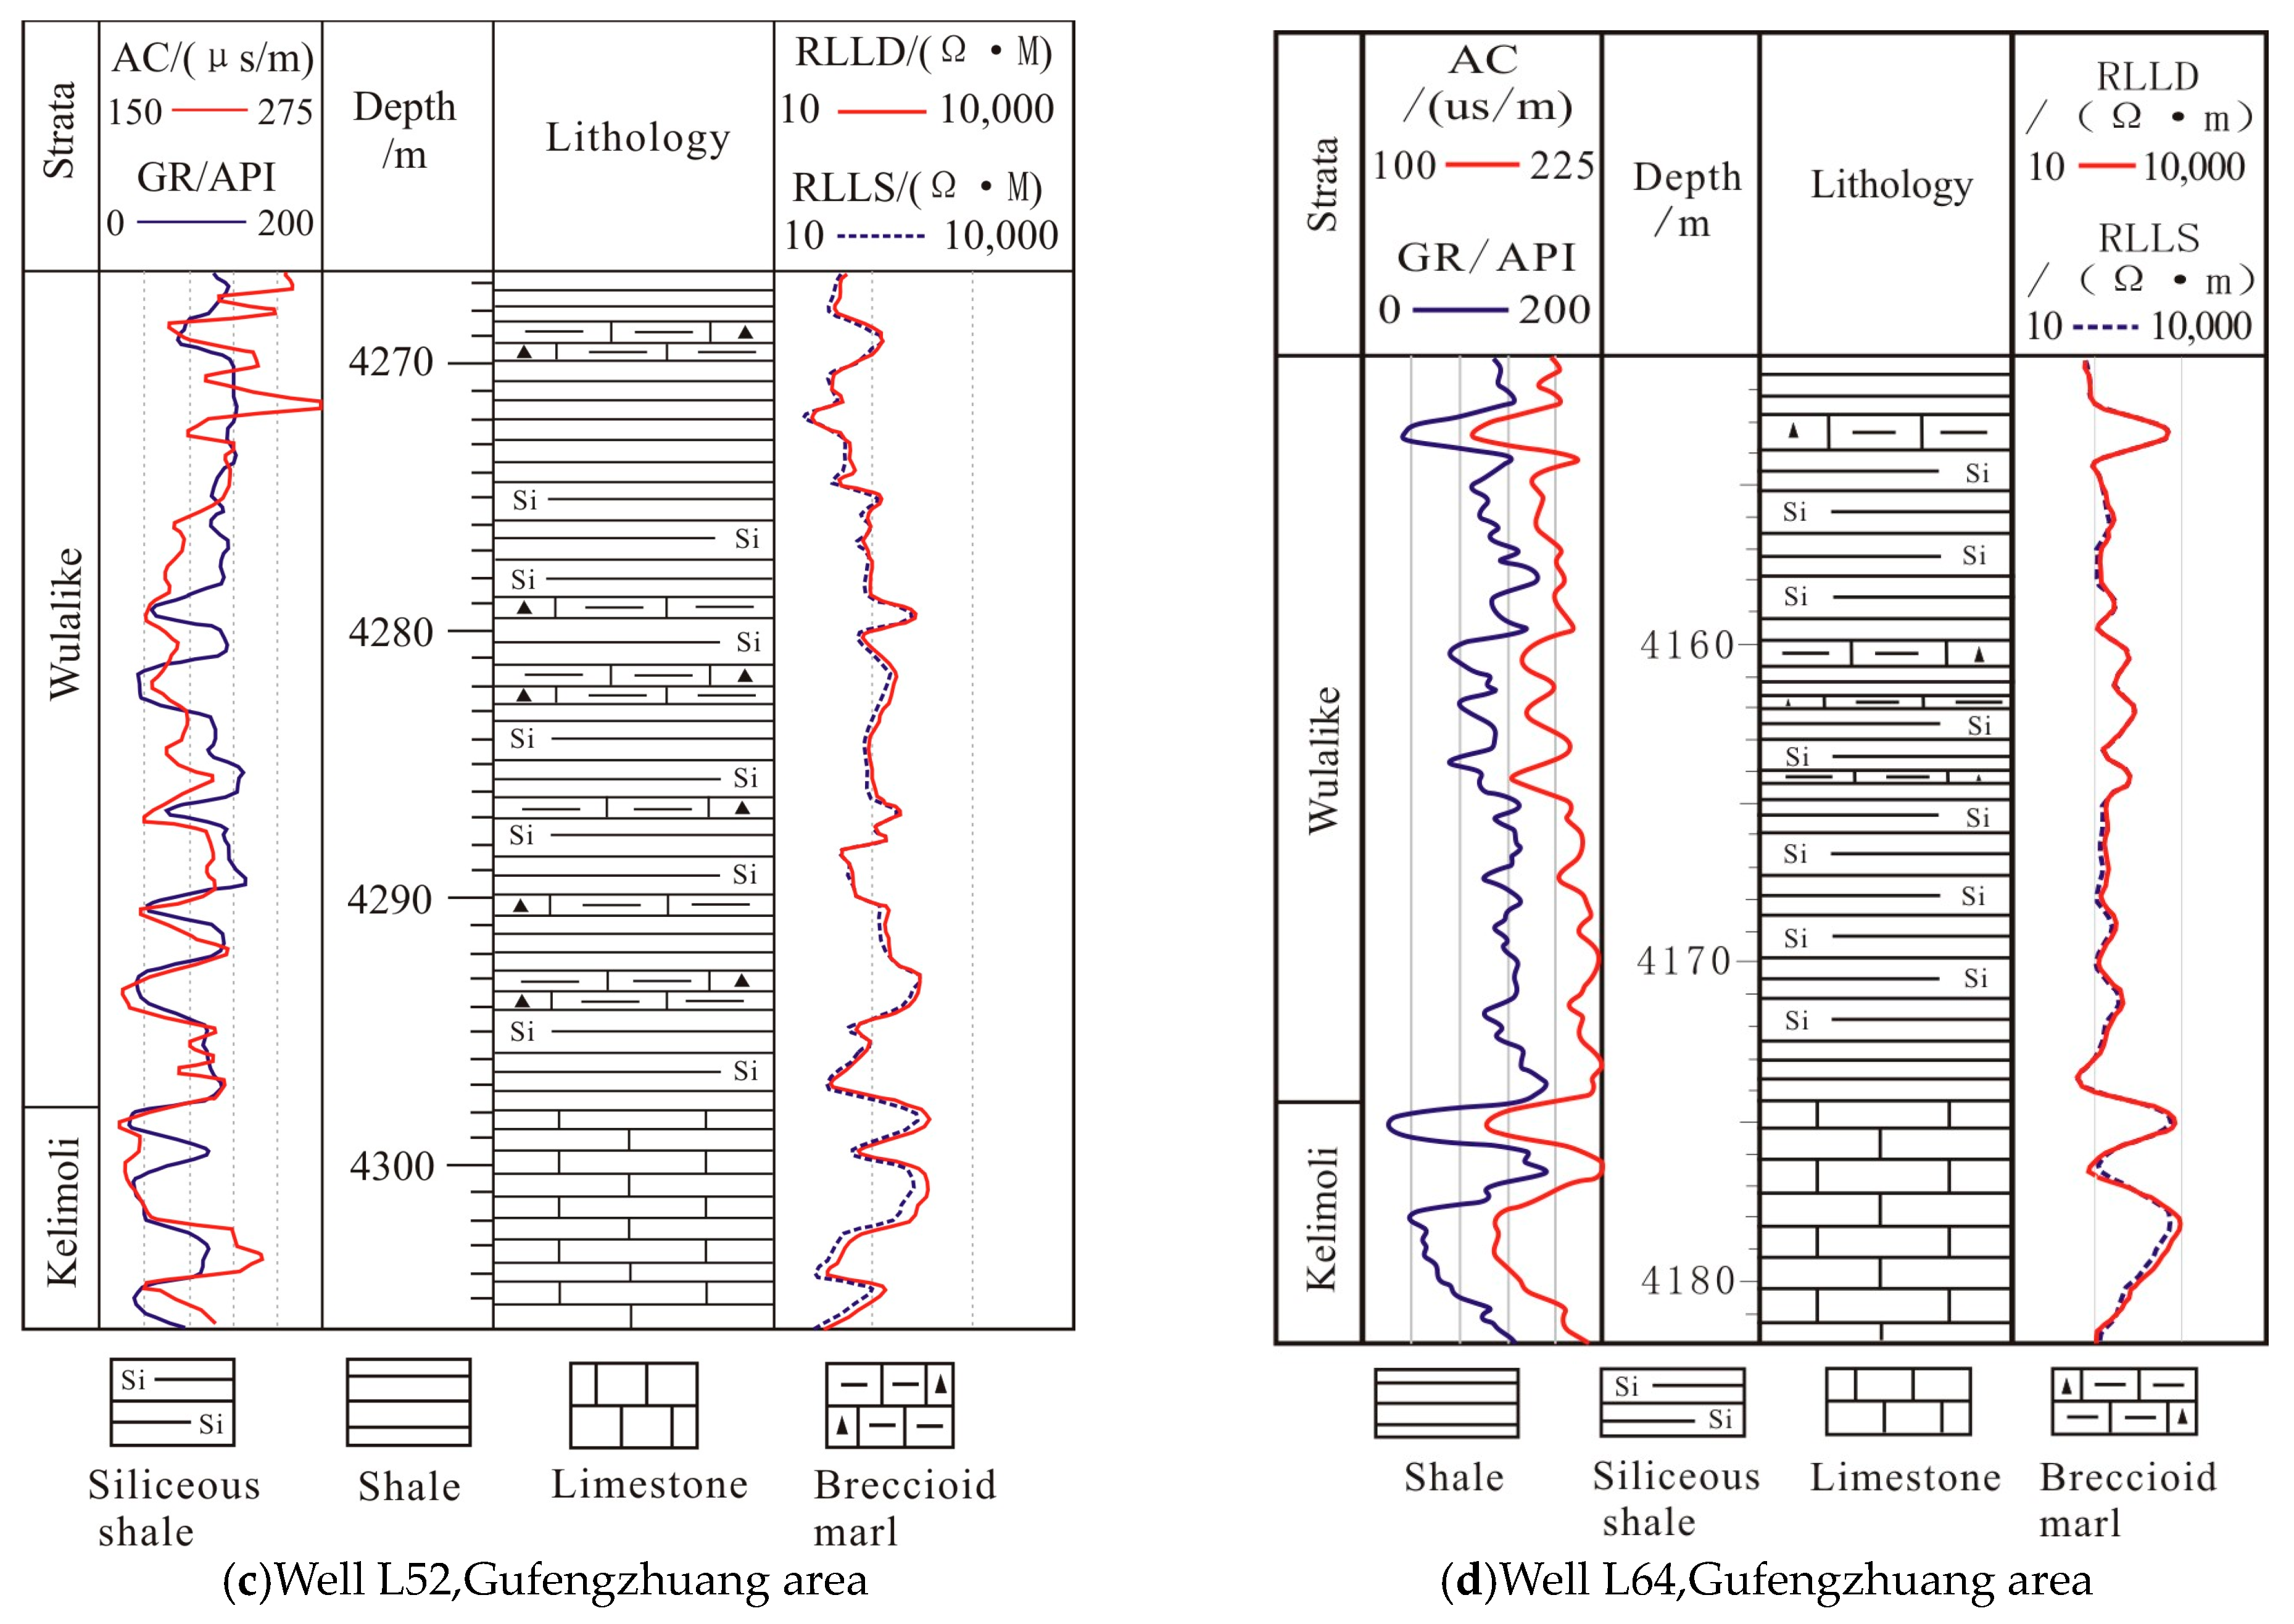
4.4. Fracture Characteristic from Deep and Shallow Resistivity Responses

An analysis of drilling-derived electrical characteristics of the Wulalike Formation in northwestern Ordos Basin revealed that the deep and shallow resistivity (RLLD and RLLS) logs of the lower Wulalike Formation (where fracture zones exist) generally exhibited dual-track features with a positive amplitude difference (Figure 9a). In other words, at the same depth point/section, the RLLD value was generally greater than the RLLS value, with an RLLD/RLLS of 1.05–1.44, indicating a strong contrast with the single-track feature of deep and shallow resistivity logs of the Wufeng Formation–Longmaxi Formation (where matrix pores are dominant and fractures are undeveloped) in the Sichuan Basin (Figure 9b). In the dual-track interval with RLLD > RLLS, the RLLD/RLLS ratio was generally positively correlated with the AC anomaly of amplitude (Figure 10), indicating that fractures/pores are highly developed.
The dual-track feature of deep and shallow resistivity logs is very common in the fracture intervals of deep (>3500 m) shales in the Bohai Bay Basin, Tuha Basin, and other basins [26]. In the organic-bearing mudstones of the third member of the Shahejie Formation (Sha 3 Member) in the Dongpu Sag of the Bohai Bay Basin, a fracture zone with a single-layer thickness of 2–12 m and a cumulative thickness of more than 70 m was found. Influenced by mud invasion, the deep and shallow resistivity logs of this fracture zone generally showed positive amplitude differences, with similar envelope features to that of permeable sandstones, that is, RLLD > RLLS, and the RLLD/RLLS ratio of 1.05–2.00 in general. It was confirmed that such fractures were mainly produced by diagenetic or hydrocarbon generation and expulsion processes and were mainly horizontal fractures. The dual-track interval with positive amplitude difference was interpreted to have a total porosity (matrix porosity + fracture porosity) of 7–15% and the permeability of (0.4–10) × 10−3 μm2, which is a significant sign of fractured gas reservoirs [26]. Occasionally, a dual-track interval with the negative amplitude difference of deep and shallow resistivity logs (RLLD < RLLS) was found in the thick mudstones of the Sha 3 Member, but it was small in size—with a single layer thickness of 1–3 m. The significant distribution and exploration of such sections have not been clearly understood and are rarely reported [24,25,26]. This study deals with the dual-track interval and positive amplitude difference.
The dual-track interval of the Wulalike Formation is believed to be caused by the presence of open bed-parallel fractures and mud invasion during later drilling in the shale formation. The lower Wulalike Formation is generally composed of brittle siliceous shale, which can easily generate a large number of bed-parallel fractures under the action of detachment and along the strata in the foreland thrust sheet (Figure 7), forming filtration channels. During drilling, the mud filtrate flows heavily along the fractures, giving rise to a mud invasion zone. Since the resistivity of the mud filtrate (Rmf) is generally lower than the resistivity of formation fluids, the response value of the mud invasion zone (RLLS) is lower than the true response value of shale formation (RLLD), that is, the dual-track feature has a positive amplitude difference on deep and shallow resistivity logs. This indicates that such a dual-track feature is a direct reflection of the dense development of bed-parallel fractures in the Wulalike Formation, which is consistent with the results of core observation.
Below, the deep and shallow resistivity dual-track method is used to quantitatively calculate the fracture porosity of Wulalike Formation in the key wells.
Firstly, the RLLD, RLLS, and fracture porosity values of three depth points in Well L105 and Well ZP1 (Table 2) were used to calibrate Rmf, which was determined to be 0.19–2.60 Ω·m (Table 3). Considering the limited core data of the Wulalike Formation in the study area, the range of 0.19–2.60 Ω·m was used as the control condition for Rmf. Through parameter tuning, simulation, and verification in several wells (by comparing the calculated results with the fracture porosity of marine shales in similar basins, such as the Woodford gas field in the Arkoma Foreland Basin [23], the expected value of Rmf was determined to be 0.75 Ω·m, which was adopted as the Rmf value in this study.
Then, using the above model and the Rmf value, the fracture porosity of the lower Wulalike Formation was evaluated for 14 wells in the Majiatan, Shanghaimiao, Gufengzhuang, and Tiekesumiao areas. The results show that fractures were well developed in the lower Wulalike Formation in the foreland depression, northwestern Ordos Basin, with the average fracture porosity ranging from 0.25% to 2.43% and varying greatly in these areas (Table 4 and Figure 2, Figure 9, Figure 11 and Figure 12). These results are consistent with the estimation by the core observation method in Table 2, indicating that the calculation results agree with the actual geological conditions of marine shale in the foreland basin and, thus, can be used as an important basis for evaluating the fracture porosity of the lower Wulalike Formation. Details are described below.
In the Majiatan-Gufengzhuang area in the southern part of the study area, eight wells (Z5, Z2, ZP1, L56, L82, L52, L64, and L105) were evaluated. The length and amplitude of the dual-track interval for the lower Wulalike Formation showed high values across the western thrust belt but generally decreased in the eastern uplift, depression, or slope areas (Table 4 and Figure 11 and Figure 12). In the Z5 area in the western margin thrust belt, the Dual-track interval was distributed continuously, with a thickness exceeding 35 m and an RLLD/RLLS ratio of 1.25–1.38 (avg. 1.31), corresponding to a high level of fracture porosity, which was calculated to be 0.84–2.91% (avg. 1.58%) (Table 4 and Figure 11a). Eastward, in the Z2 and ZP1 areas in the central uplift zone, the dual-track interval intermittently appeared in the lower Wulalike Formation—in three sections in the Z2 area—with a single layer thickness of 2–11 m, an average RLLD/RLLS ratio of 1.12–1.41, and an average fracture porosity of 0.65–1.17%. In two sections of the ZP1 area, with a single layer thickness of 17–21 m, an average RLLD/RLLS ratio of 1.06–1.17 and an average fracture porosity of 0.65–1.34% (Table 4) was observed. In the Gufengzhuang area in the eastern slope zone, the length and amplitude of the dual-track interval of the lower Wulalike Formation decreased from northwest to southeast. Specifically, in most well areas such as L56, L82, L64 and L105, the dual-track interval only appeared in local shale sections, with a thickness of 2–13 m individually, which was distributed continuously only in the L52 area (with a thickness of 24 m); the average RLLD/RLLS ratio mostly ranged between 1.08 and 1.12 (only up to 1.31 in the 13 m section at the bottom of Well L105); the calculated average fracture porosity mostly ranged between 0.38% and 0.71% (only up to 2.00% at the bottom of Well L105) (Table 4 and Figure 11c,d).
In the Shanghaimiao area in the middle part of the study area, three wells (YT1, E102, and NP1) were evaluated. The length and amplitude of the dual-track interval of the lower Wulalike Formation were generally large, while the calculated fracture porosity was high (Table 4 and Figure 9a). In the YT1 area, the dual-track interval was mainly found at the bottom of the Wulalike Formation from 3976 m to 3999.5 m, with a thickness of 23.5 m, a greatly variable amplitude (1.07–2.53, or 1.60 on average), which decreased downward with a fracture porosity of 0.49–2.49% (avg. 1.46%) (Table 4). In the E102 area, separated by marl, the dual-track interval was mainly distributed into two shale sections (3622–3645 m and 3664–3689 m), with thicknesses of 23 m and 25 m, an amplitude of 1.13–1.30 (avg. 1.20) and 1.03–1.24 (avg. 1.18), and a fracture porosity of 1.53–3.14% (avg. 2.43%) and 0.35–2.09% (avg. 1.38%), respectively (Table 4). In the NP1 area, the dual-track interval was continuously distributed in the 3897–3914 m section, with an amplitude of 1.06–1.28 (avg. 1.19) for the upper 8 m part and 1.03–1.39 (avg. 1.25) the lower 9 m part alongside a fracture porosity of 0.45–1.61% (avg. 1.14%) and 0.37–2.84% (avg. 1.81%) for the upper and lower parts, respectively (Table 4 and Figure 9a).
In the Tiekesumiao area in the northern part of the study area, three wells (QT10, QT9, and QT5) were evaluated. The length and amplitude of the dual-track interval for the lower Wulalike Formation decreased from west to east as a whole (Table 4 and Figure 11 and Figure 12). In the QT10 area adjacent to the western fault zone, the dual-track feature was found in the entire 5090–5131 m section and in the lower Wulalike Formation, with a thickness exceeding 41 m. In this study, two shale sections, 5099–5117 m, and 5122–5131 m, were treated. Their dual-track amplitudes were 1.04–1.31 (avg. 1.21) and 1.03–1.32 (avg. 1.17), respectively (Figure 11b), with a fracture porosity of 0.21–0.88% (avg. 0.53%) and 0.06–0.88% (avg. 0.27%), respectively (Table 4). In the QT9 area on the slope northeast to Well QT10, dual-track features of the shallow and deep resistivity were only found in the lower Wulalike Formation from 4717 to 4739, with an amplitude of 1.00–1.17 (avg. 1.06), and the calculated fracture porosity was 0% to 0.63% (avg. 0.31%) (Table 4). In the Well QT5 area located east of the Well QT10, the dual-track interval of shallow and deep resistivity appeared intermittently in three shale sections, namely 4670–4677 m, 4682.5–4688.5 m, and 4693.0–4702.5 m, with a single thickness of 6–9.5 m. The dual-track amplitudes were 1.01–1.20 (avg. 1.10), 1.02–1.17 (avg. 1.08), and 1.03–1.27 (avg. 1.15), respectively, and the calculated fracture’s porosity was 0.13% to 0.80% (avg. 0.52%), 0.12% to 0.36% (avg. 0.25%), and 0.25% to 0.41% (avg. 0.30%), respectively (Table 4).
The study area is an elongated foreland basin formed in the Mesozoic and finally shaped in the late Yanshanian. It includes a thrust-fold belt, a foreland depression, and a slope from west to east (Figure 1). Various structures such as thrust, nappe, and detachment are developed to a weaker extent in the north and east than in the south and west [14,17]. The lower Wulalike Formation in the study area exhibited lower fracture porosity in the north and east than in the south and west; this agrees well with the trends of structures, suggesting that the regional difference in fracture development is mainly controlled by structures.

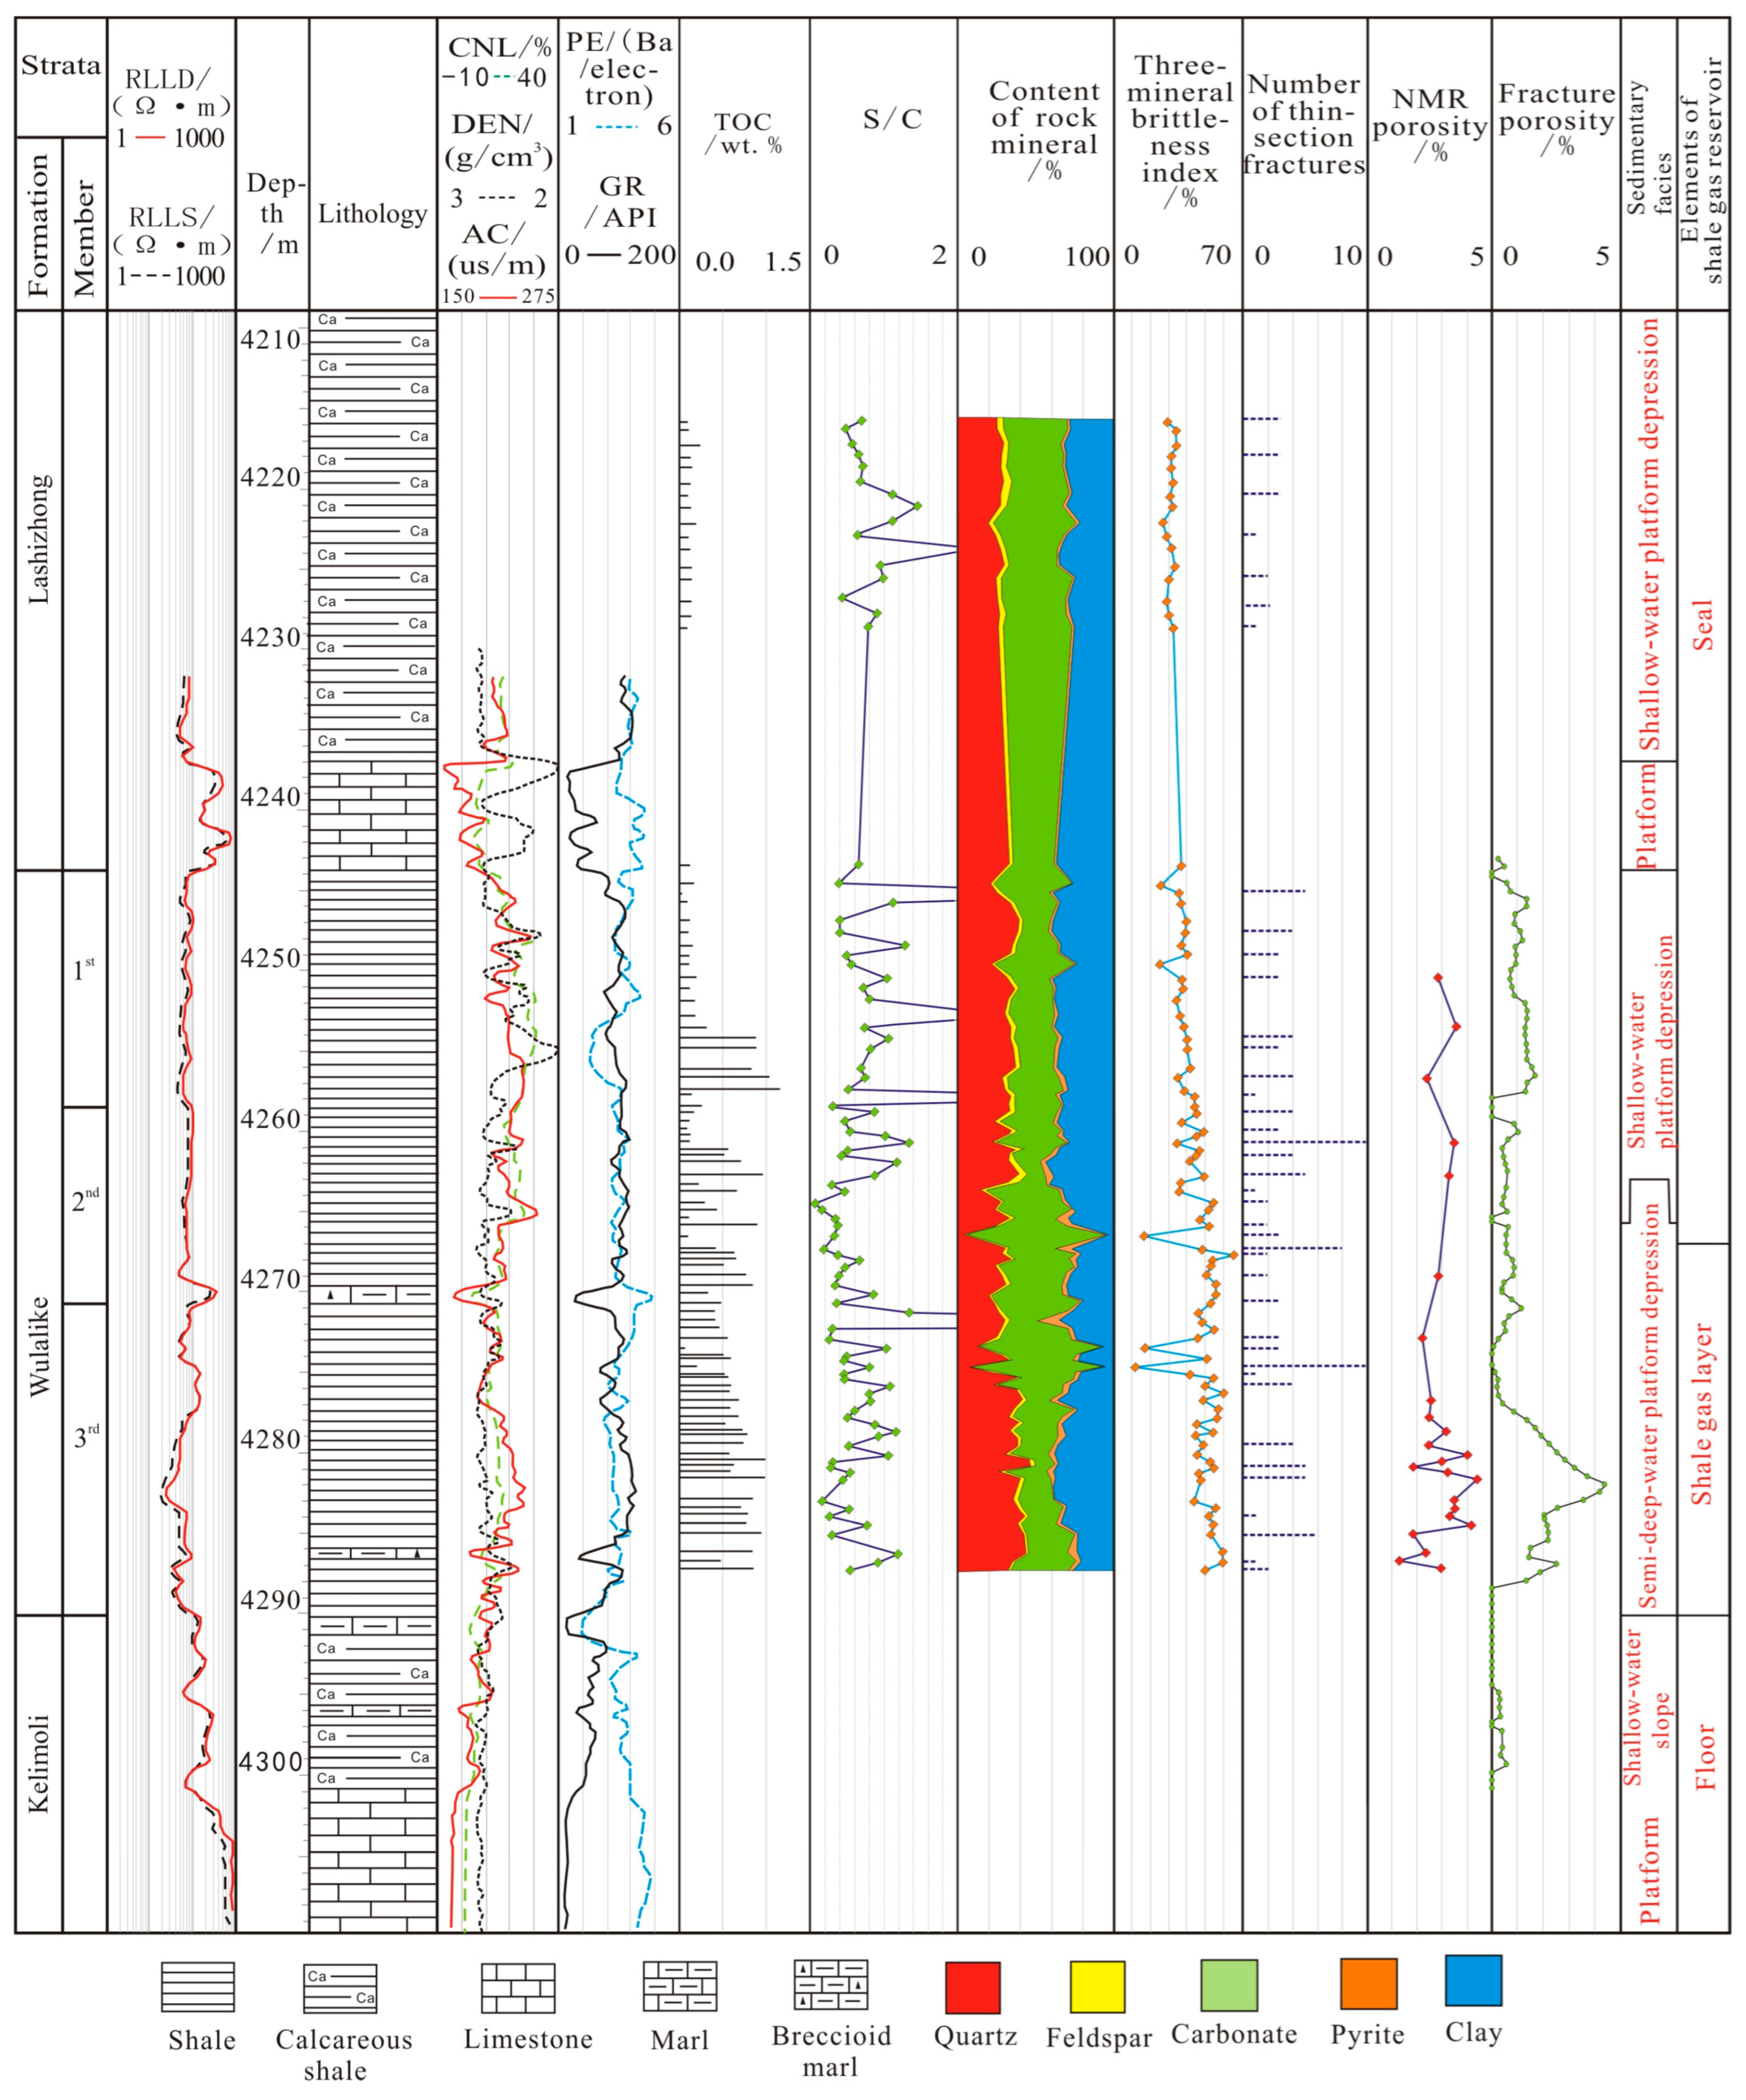
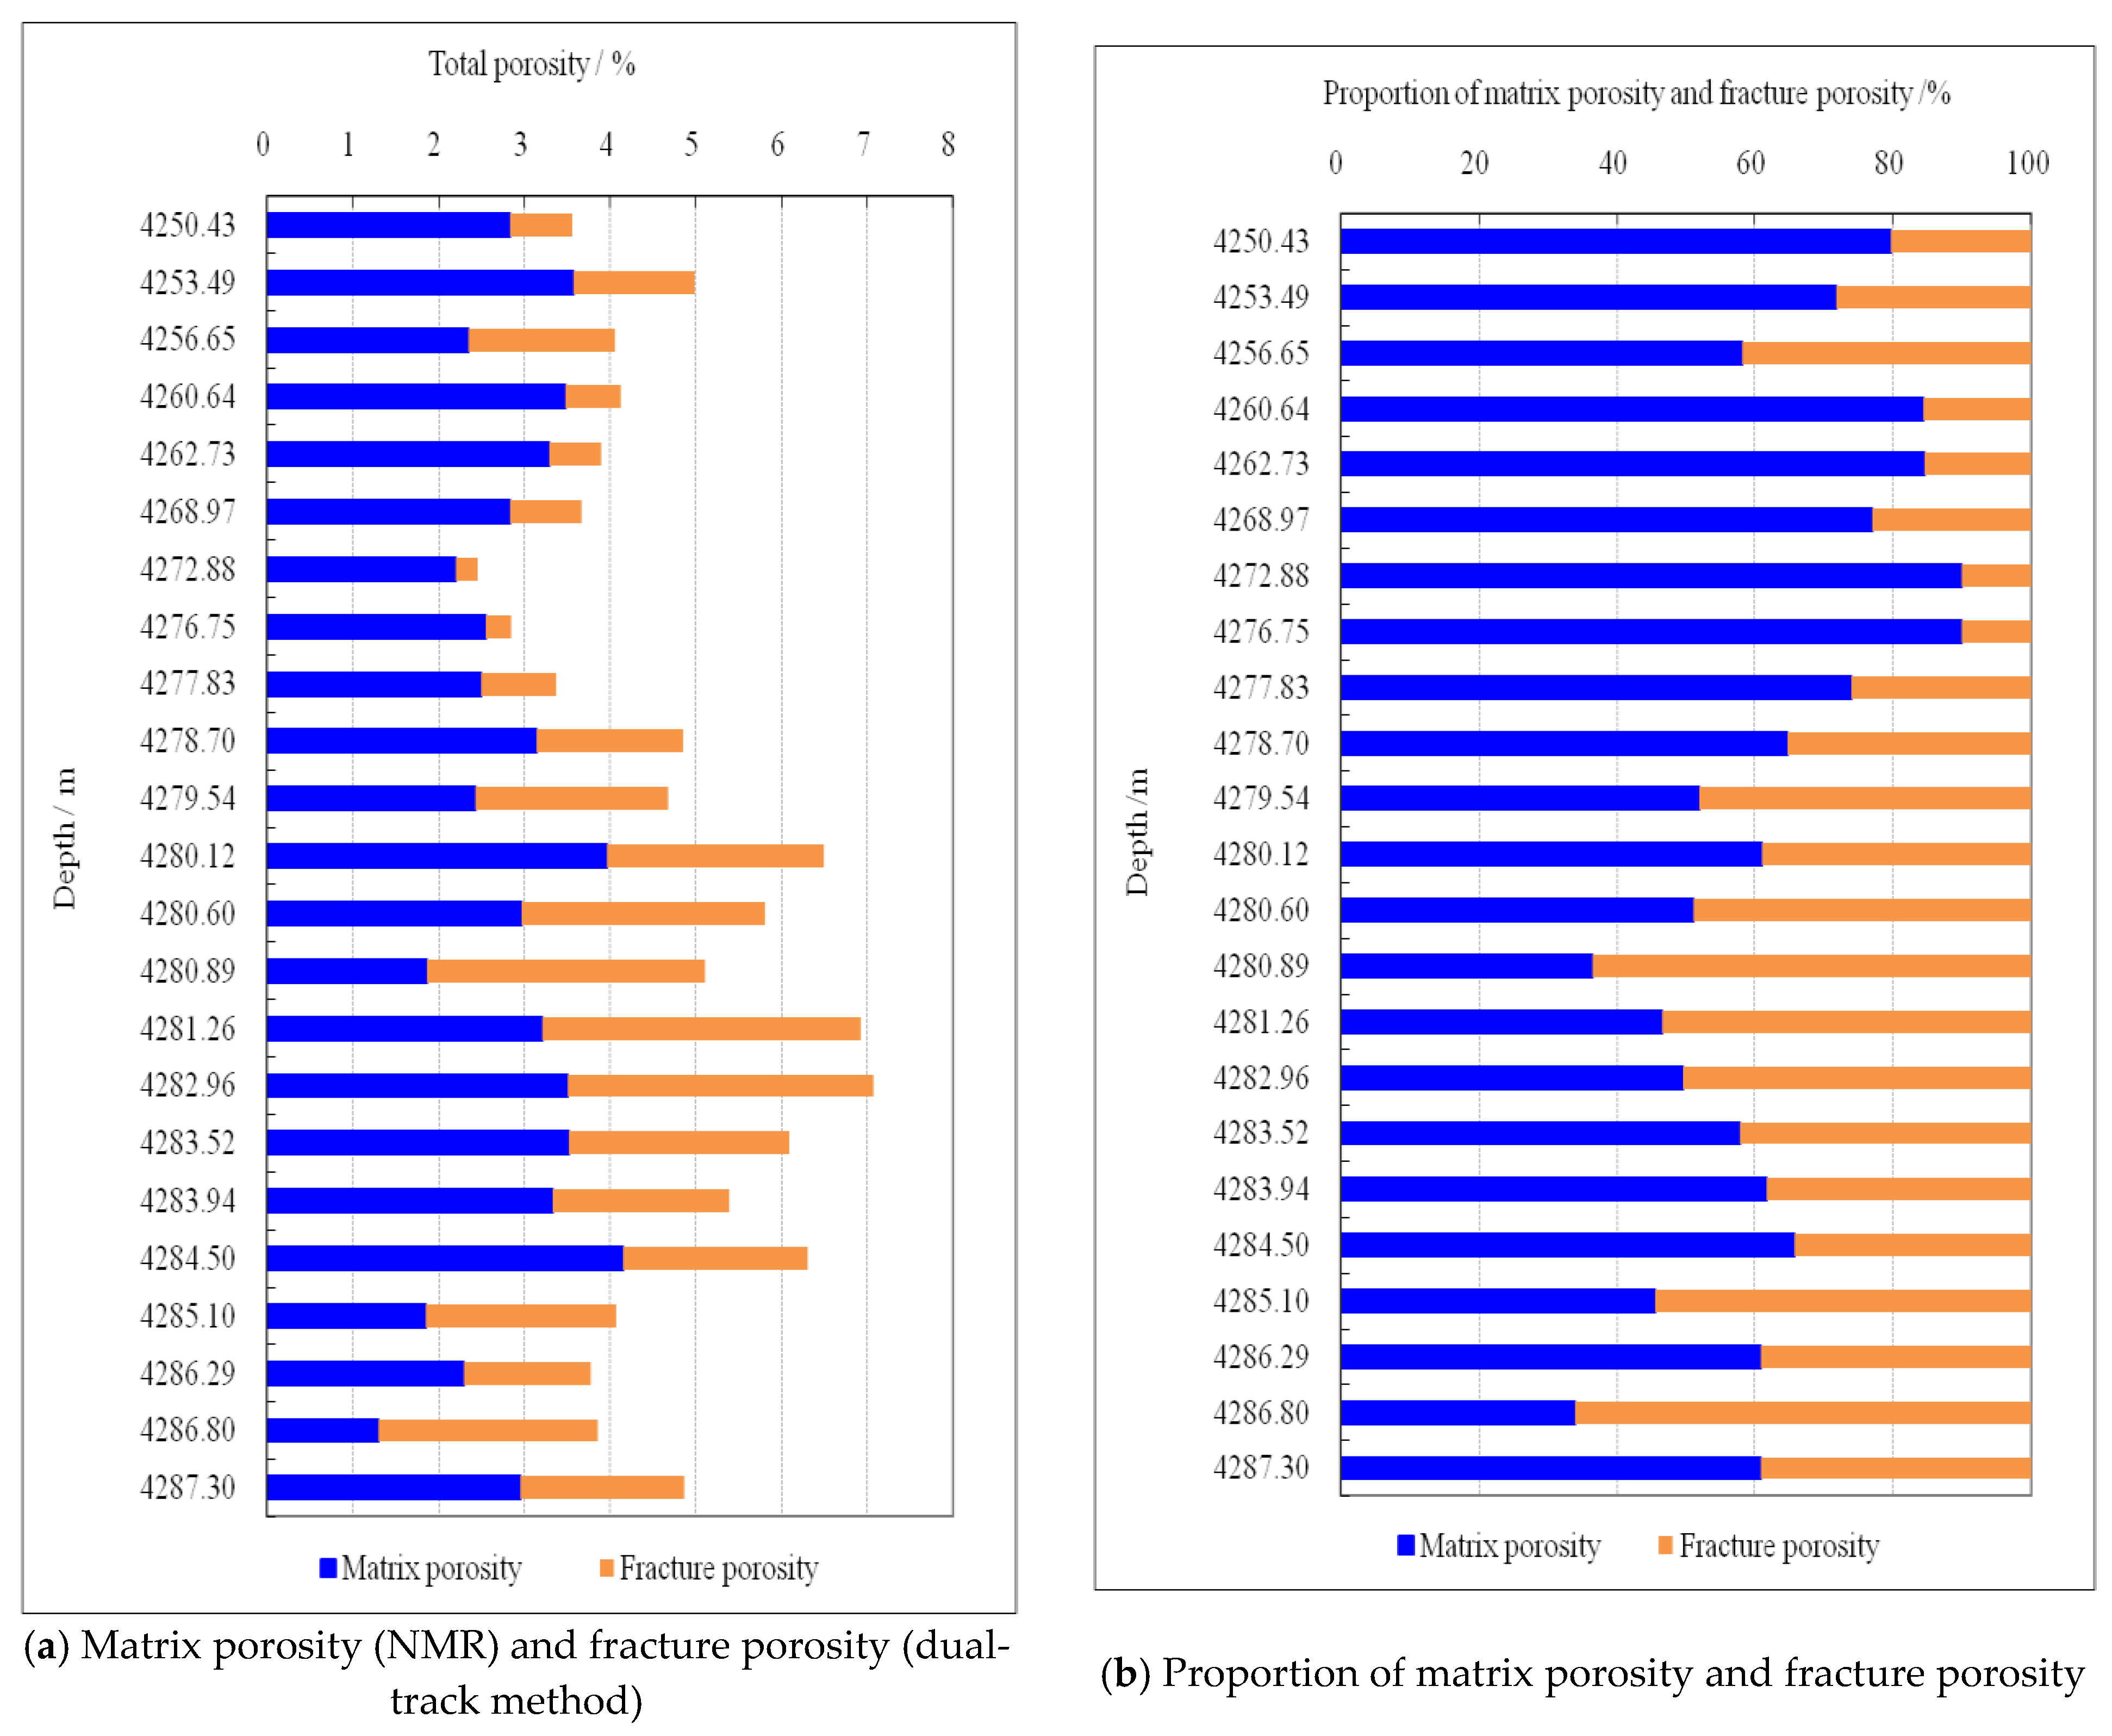
4.5. Reservoir Space Composition

To systematically reveal the reservoir space’s composition and the petrophysical characteristics of the Wulalike Formation, Well L105 in the Majiatan-Dashuikeng area, relatively more appraisal wells were chosen for analysis. This is a newly drilled appraisal well, with complete geological data such as core, logging, and analysis. The NMR and deep and shallow resistivity dual-track method were used to quantify the matrix porosity and fracture porosity of the Wulalike Formation in the L105 area. The fracture porosity calculation results of Well L105 are shown in Figure 2 and Table 4.
The calculation of matrix porosity was relatively simple. The NMR test was conducted on 24 core samples from the 4250–4288 m section of Well L105. These cores were severely fractured. Before the test, each core was pre-processed into a 1–3 thick tight sample without bed-parallel fractures. The test results revealed the dominance of matrix porosity. Finally, the matrix porosity of the 4250–4288 m section of Well L105 was obtained as 1.31–4.39% (avg. 2.96%) (Figure 2).
Combining the above NMR test results and the calculation results of the dual-track method, the total porosity of the Wulalike Formation in Well L105 was determined (Figure 13a). Specifically, the total porosity of the 4250–4288 m interval of Well L105 was 2.46–7.08% (avg. 4.71%), in which the matrix porosity accounted for 34.0–90.0% (avg. 61.1%) and the fracture porosity accounted for 10.0–66.0% (avg. 38.9%) (Figure 13b).
The above values indicate that, in the Majiatan-Dashuikeng area, the total porosity of the lower Wulalike Formation was similar to that of the Longmaxi Formation, especially with a large number of bed-parallel fractures, providing high-quality reservoir space and flow channels for shale gas accumulation.

5. Implications

The development of open bedding fractures and high permeability in the lower Wulalike Formation has become a significant feature of shale gas reservoirs in this region. Therefore, it is necessary to pay attention to the impact that the development of fractures has on the Wulalike Formation for the formation and enrichment of shale gas in order to guide the research and exploration of shale gas in this region.
In the northwest margin of the Ordos Basin, the Wulalike Formation was located in the control area of the foreland thrust sheet as a whole [14,17]. Its storage and permeability space are mainly composed of inorganic pores and bedding fracture systems, which determines the shale gas in this layer to be mainly free gas (accounting for over 50% [14]). Therefore, there must be natural gas migration or a loss in the inorganic pores and bedding fracture systems of this layer. This accumulation mode of self-generation and self-storage within the siliceous shale layer with bedding migration has certain similarities with conventional natural gas migration and accumulation, even methane hydrate systems [37,38], and is not completely the same as the continuous accumulation mode of Changning-Weiyuan [33] and Barnett shale gas fields [39,40,41]. The latter has basically no bedding migration due to the lack of open bedding fractures [1,2,3,33], and its “sweet spot area” is widely distributed in the syncline area and is little associated with local structure [33,39]. From this, it can be inferred that the shale gas accumulation type of the Wulalike Formation in the northwest margin of the basin is mainly structurally controlled with fractured shale gas reservoirs, and its “sweet spot area” is mainly controlled by the tectonic setting and preservation conditions, with fault anticlines or fault noses formed mainly by reverse dipping faults.
Therefore, in the deployment of shale gas exploration in the region, it is necessary to strengthen the interpretation and evaluation of tectonic settings, fractures, and preservation conditions.

6. Conclusions

The Wulalike Formation in the northwestern Ordos Basin contains fractured shale reservoirs with matrix pores (mainly inorganic pores) and permeable fractures.
The fracture system of the lower Wulalike Formation is dominated by open bed-parallel fractures, which are intermittent or continuous individually, with a width of 0.1–0.2 mm and spacing of 0.5–14.0 cm. These fracture-developed sections generally exhibit bimodal or multimodal features on NMR T2 spectra and have dual-track features with a positive amplitude difference on deep and shallow resistivity logs.
The lower Wulalike Formation generally exhibits a dual-track feature with positive amplitude difference on deep and shallow resistivity logs, with length and amplitude varying greatly from area to area, which decreases from west to east, reflecting that the length of the fracture-developed section and the fracture porosity are very different in areas and decrease eastward. In the western margin thrust belt, the dual-track interval is generally distributed continuously, with high amplitude, revealing that this fracture-developed section has a continuous thickness of more than 27 m and an average fracture porosity ranging from 0.53% to 1.58%. In the eastern uplift and slope zone of the Tianhuan depression, dual-track intervals occur intermittently or only locally, with significantly reduced thickness and amplitude, by which the fracture-developed interval interpreted has a continuous thickness of 2–24 m and an average fracture porosity of 0.38–1.17% mostly. In the Shanghaimiao area, a relatively special case, the lower Wulalike Formation contains a dual-track interval and continuous thickness of more than 20 m while the average amplitude is above 1.11, reflecting the extremely developed fractures in this area. In the Tiekesumiao area, the amplitude of the dual-track interval is generally smaller than that in the other four areas, reflecting a lower development degree of fractures in the northern part than in the central and southern parts of the study area.
The lower Wulalike Formation has a total porosity of 2.46–7.08%, which is roughly similar to the Longmaxi Formation in the Sichuan Basin, of which matrix porosity accounts for 34.0–90.0% (avg. 61.1%) and fracture porosity accounts for 10.0–66.0% (avg. 38.9%).
Research suggests that the shale gas accumulation type of the Wulalike Formation in the northwest margin of the basin is mainly a fractured shale gas reservoir controlled by its structure, and its “sweet spot area” is mainly controlled by tectonic setting and preservation conditions.

Author Contributions

Conceptualization, Z.H. and W.Y.; Methodology, Y.W., S.Z. and F.L.; Formal analysis, Y.W. and S.Z.; Investigation, Y.W., Z.H. and W.L.; Resources, S.Z., F.L., Z.H., W.L., W.Y. and W.G.; Data curation, S.Z., Z.H., W.L., W.Y. and W.G.; Writing—original draft, Y.W.; Writing—review & editing, Y.W., S.Z. and F.L.; Project administration, S.Z. and Z.H. All authors have read and agreed to the published version of the manuscript.

Funding

This study was funded by the PetroChina basic technology research project (2021DJ1904).

Acknowledgments

Our study was supported by the PetroChina basic technology research project (2021DJ1904). The editors and anonymous reviewers are gratefully acknowledged. We also want to express our great gratitude to the staff of the National Energy Shale Gas R&D (Experiment) Centre for their hard work.

Conflicts of Interest

The authors declare no conflict of interest.

References

  1. Zou, C.; Dong, D.; Wang, S.; Li, J.; Li, X.; Wang, Y.; Li, D.; Cheng, K. Geological characteristics and resource potential of shale gas in China. Pet. Explor. Dev. 2010, 37, 641–653. [Google Scholar] [CrossRef]
  2. Ma, Y.; Cai, X.; Zhao, P. China’s shale gas exploration and development: Understanding and practice. Pet. Explor. Dev. 2018, 45, 589–603. [Google Scholar] [CrossRef]
  3. Zhao, W.; Jia, A.; Wei, Y.; Wang, J.; Zhu, H. Progress in shale gas exploration in China and prospects for future development. China Pet. Explor. 2020, 25, 31. [Google Scholar]
  4. Magoon, L.B.; Dow, W.G. (Eds.) The petroleum system. In The Petroleum System—From Source to Trap; American Association of Petroleum Geologists Memoir: Tulsa, OK, USA, 1994; pp. 3–24. [Google Scholar]
  5. Law, B.E.; Curtis, J.B. Introduction to unconventional petroleum systems. AAPG Bull. 2002, 86, 1851–1852. [Google Scholar]
  6. Katz, B.; Gao, L.; Little, J.; Zhao, Y. Geology still matters—Unconventional petroleum system disappointments and failures. Unconv. Resour. 2021, 1, 18–38. [Google Scholar] [CrossRef]
  7. Peters, K.E.; Cassa, M.R. Applied source rock geochemistry. In The Petroleum System—From Source to Trap; Magoon, L.B., Dow, W.G., Eds.; American Association of Petroleum Geologists Memoir: Tulsa, OK, USA, 1994; pp. 93–120. [Google Scholar]
  8. Passey, Q.R.; Bohacs, K.M.; Esch, W.L.; Klimentidis, R.; Sinha, S. From oil-prone source rock to gas-producing shale reservoir—Geologic and petrophysical characterization of unconventional shale-gas reservoirs. In SPE International Oil and Gas Conference and Exhibition in China; SPE: Calgary, AB, Canada, 2010; p. SPE-131350. [Google Scholar]
  9. Burton, Z.F.; Moldowan, J.M.; Sykes, R.; Graham, S.A. Unraveling petroleum degradation, maturity, and mixing and addressing impact on petroleum prospectivity: Insights from frontier exploration regions in New Zealand. Energy Fuels 2018, 32, 1287–1296. [Google Scholar] [CrossRef]
  10. Burton, Z.F.M.; Moldowan, J.M.; Magoon, L.B.; Sykes, R.; Graham, S.A. Interpretation of source rock depositional environment and age from seep oil, east coast of New Zealand. Int. J. Earth Sci. 2019, 108, 1079–1091. [Google Scholar] [CrossRef]
  11. Singh, P.; Slatt, R.; Borges, G.; Perez, R.; Portas, R.; Marfurt, K.; Ammerman, M.; Coffey, W. Reservoir Characterization of Unconventional Gas Shale Reservoirs: Example from the Barnett Shale, Texas, USA; AAPG: Tulsa, OK, USA, 2009; Viingepet 2008 EXPL-1-RS-124. [Google Scholar]
  12. Burton, Z.F.; McHargue, T.; Kremer, C.H.; Bloch, R.B.; Gooley, J.T.; Jaikla, C.; Harrington, J.; Graham, S.A. Peak Cenozoic warmth enabled deep-sea sand deposition. Sci. Rep. 2023, 13, 1276. [Google Scholar] [CrossRef]
  13. Pang, M.; Ba, J.; Deng, J.; Müller, T.M.; Saenger, E.H. Rock-physics Template Based on Differential Diagenesis for the characterization of shale gas reservoirs. Arab. J. Sci. Eng. 2023, 48, 677–693. [Google Scholar] [CrossRef]
  14. Xi, S.; Liu, X.; Huang, Z.; Zhao, H.; Zhang, C.; Liu, Y. Enrichment characteristics and exploration direction of shale oil and gas in Wulalike Formation of Middle Ordovician in the Ordos Basin. Nat. Gas Ind. 2023, 43, 12–22. [Google Scholar]
  15. Wu, D.; Wu, X.; Li, C.; Yu, Z.; Li, W.; Cai, J.; Li, G. Sedimentary model and hydrocarbon-generation potential of source rock of the Ordovician Ulalik Formation in western Ordos Basin. Mar. Oil Gas Geol. 2021, 26, 123–130. [Google Scholar]
  16. Zhang, Y.; Guo, Y.; Hou, W.; Zhao, Z.; Gao, J. Geochemical Characteristics and Exploration Potential of the Middle-Upper Ordovician Source Rocks on the Western and Southern Margin of Ordos Basin. Nat. Gas Geosci. 2013, 24, 894–904. [Google Scholar]
  17. He, Z. Tectonic Evolution and Oil and Gas Resources in Ordos Basin; Petroleum Industry Press: Beijing, China, 2003; pp. 3–152. [Google Scholar]
  18. Deng, K.; Zhou, W.; Deng, H.; Wan, Y.; Deng, H.; Xie, R.; Chen, W. Geological conditions for accumulation of shale gas in Middle Ordovician Pingliang Formation of Ordos Basin, China. J. Chengdu Univ. Technol. (Sci. Technol. Ed.) 2013, 40, 595–602. [Google Scholar]
  19. Sun, Y.; Wang, C.; Wang, Y.; Yang, W.; Xu, H.; Liu, W.; Wu, T. Geochemical characteristics and exploration potential of Middle Ordovician Pingliang Formation in the Ordos Basin. Pet. Geol. Exp. 2008, 30, 162–168. [Google Scholar]
  20. Zhao, J.; Wang, D.; Sun, L.; Bao, H.; Xiao, H.; Wu, W.; Chen, Y. Origin of the Ordovician gas and its accumulation patterns in northwestern Ordos Basin. Oil Gas Geol. 2015, 36, 711–720. [Google Scholar]
  21. Deng, K.; Zhou, W.; Zhou, L.; Wan, Y.; Deng, H.; Xie, R.; Chen, W. Influencing factors of micropores in the graptolite shale of Ordovician Pingliang Formation in Ordos Basin, China. Pet. Explor. Dev. 2016, 43, 378–385. [Google Scholar] [CrossRef]
  22. Du, J.; Li, X.; Bao, H.; Xu, W.; Wang, Y.; Huang, J.; Wang, H.; Rong, W.; Wang, J. Geological conditions of natural gas accumulation and new exploration areas in the Mesoproterozoic to Lower Paleozoic of Ordos Basin, NW China. Pet. Explor. Dev. 2019, 46, 820–835. [Google Scholar] [CrossRef]
  23. Wang, Y.; Wang, H.; Zhang, C.; Li, X.; Dong, D. Fracture pore evaluation of the Upper Ordovician Wufeng to Lower Silurian Longmaxi Formations in southern Sichuan Basin, SW China. Pet. Explor. Dev. 2017, 44, 531–539. [Google Scholar] [CrossRef]
  24. Sierra, O. Petroleum Science Development 15B-Geological Interpretation of Logging Data; Petroleum Industry Press: Beijing, China, 1992; pp. 622–656. (In Chinese) [Google Scholar]
  25. Yong, S.; Zhang, C. Data Processing and Comprehensive Interpretation of Well Logging; China University of Petroleum Press: Beijing, China, 2006; pp. 203–220. [Google Scholar]
  26. Li, G.; Wang, S.; Zhao, X. New Technology of Well Logging Geology and Oil-Gas Evaluation; Petroleum Industry Press: Beijing, China, 1995; pp. 1–111. [Google Scholar]
  27. Ding, W.; Li, C.; Li, C.; Xu, C.; Jiu, K.; Zeng, W. Dominant factor of fracture development in shale and its relationship to gas accumulation. Earth Sci. Front. 2012, 19, 212–220. [Google Scholar]
  28. Zagorski, W.A.; Bowman, D.C.; Emery, M.; Wrightstone, G.R. An Overview of Some Key Factors Controlling Well Productivity in Core Areas of the Appalachian Basin Marcellus Shale Play[EB/OL]. (2011-11-01)[2015-06-01]. Available online: http://www.searchanddiscovery.com/pdfz/documents/2011/110147zagorski/ndx_zagorski.pdf.html (accessed on 1 January 2022).
  29. Gillespie, P.; Hagen, J.; Wessels, S.; Lynch, D. Hierarchical kink band development in the Appalachian Plateau decollement sheet. AAPG Bull. 2015, 99, 51–76. [Google Scholar] [CrossRef]
  30. Jacobi, D.; Breig, J.; LeCompte, B.; Kopal, M.; Hursan, G.; Mendez, F.; Bliven, S.; Longo, J. Effective Geochemical and Geomechanical Characterization of Shale Gas Reservoirs from the Wellbore Environment: Caney and the Woodford Shale. In Proceedings of the SPE Annual Technical Conference and Exhibition, New Orleans, LA, USA, 4–7 October 2009. SPE124231.2009. [Google Scholar]
  31. Hammes, U.; Hamlin, H.S.; Ewing, T.E. Geologic analysis of the Upper Jurassic Haynesville Shale in east Texas and west Louisiana. AAPG Bull. 2011, 95, 1643–1666. [Google Scholar] [CrossRef]
  32. LeCompte, B.; Franquet, J.A.; Jacobi, D. Evaluation of Haynesville Shale Vertical Well Completions with Mineralogy Based Approach to Reservoir Geomechanics. In Proceedings of the SPE Annual Technical Conference and Exhibition, New Orleans, LA, USA, 4–7 October 2009. SPE124227.2009. [Google Scholar]
  33. Zou, C.; Dong, D.; Wang, Y.; Li, X.; Huang, J.; Wang, S.; Guan, Q.; Zhang, C.; Wang, H.; Liu, H.; et al. Shale gas in China: Characteristics, challenges and prospects (I). Pet. Explor. Dev. 2015, 42, 689–701. [Google Scholar] [CrossRef]
  34. No. SY/T 6490-2014; The Petroleum Industry Standard of China—Specification for Measurement of Rock NMR Parameter Laboratory. Petroleum Industry Press: Beijing, China, 2015; pp. 1–16.
  35. No. SY/T 5162-2021; The Petroleum Industry Standard of China—Analytical Method for Rock Samples by Scanning Electron Microscope. Petroleum Industry Press: Beijing, China, 2022; pp. 1–8.
  36. SY/T 5368-2016; The Petroleum Industry Standard of China—Identification for Thin Section of Rocks. Petroleum Industry Press: Beijing, China, 2017; pp. 1–43.
  37. Burton, Z.F.; Dafov, L.N. Testing the sediment organic contents required for biogenic gas hydrate formation: Insights from synthetic 3-D basin and hydrocarbon system modelling. Fuels 2022, 3, 555–562. [Google Scholar] [CrossRef]
  38. Burton, Z.F.; Dafov, L.N. Salt Diapir-Driven Recycling of Gas Hydrate. Geochem. Geophys. Geosyst. 2023, 24, e2022GC010704. [Google Scholar] [CrossRef]
  39. Bowker, K.A. Barnett shale gas production, Fort Worth Basin: Issues and discussion. AAPG Bull. 2007, 91, 523–533. [Google Scholar] [CrossRef]
  40. Hill, R.J.; Zhang, E.; Katz, B.J.; Tang, Y. Modeling of gas generation from the Barnett shale, Fort Worth Basin, Texas. AAPG Bull. 2007, 91, 501–521. [Google Scholar] [CrossRef]
  41. Han, Y.; Mahlstedt, N.; Horsfield, B. The Barnett Shale: Compositional fractionation associated with intraformational petroleum migration, retention, and expulsion. AAPG Bull. 2015, 99, 2173–2202. [Google Scholar] [CrossRef]
Figure 1. Distribution of tectonic units in the Ordos Basin.
Processes 11 02791 g001
Figure 2. Stratigraphic column of Wulalike Formation of Well L105 in the northwestern Ordos Basin (the division scheme of the strata sourced from references [14,15]).
Processes 11 02791 g002
Figure 3. Cross-section of Wulalike Formation across ZP1–E102–QT5 in northwestern Ordos Basin (the division scheme of the strata sourced from references [14,15]).
Processes 11 02791 g003
Figure 4. Microscopic characteristics of fractures/pores in the lower Wulalike Formation of Well L105.
Processes 11 02791 g004aProcesses 11 02791 g004b
Figure 5. Microscopic filling status of fractures in the lower Wulalike Formation of Well L105.
Processes 11 02791 g005
Figure 6. Core photographs from the Wulalike Formation in the Majiatan area, northwestern Ordos Basin. (a) Well Z15, calcareous shale intercalated with marl with severely fractured cores 1.5–8.5 cm long individually, 4182–4190 m; (b) Well Z15, relatively pure gray-black shale, with calcareous bands occasionally and severely fractured cores 2–14 cm long individually, 4225.8–4231.8 m; (c) Well L99 with a single core length of 1.5–3.0 cm, 4422–4424 m; (d) Well L99, siliceous shale with dominantly open bed-parallel fractures with a width of 0.1–0.2 mm and spacing of 0.5–0.8 cm, 4423.5 m; (e) Well ZP1, multiple open bed-parallel fractures (spacing of 0.8–2.5 cm, indicated by arrows), RLLD/RLLS = 1.17, 4242.40 m; (f) Well ZP1, 5 open bed-parallel fractures (spacing of 1–2 cm, indicated by arrows), RLLD/RLLS = 1.19, 4247.48 m; (g) Well L105, dominantly open bed-parallel fractures with a width of 0.1–0.3 mm and high-angle fractures which locally did not cut through the shale (indicated by arrows), RLLD/RLLS = 1.41, 4282.5 m; (h) Well L105, siliceous shale containing dominantly open bed-parallel fractures with a width of 0.1–0.2 mm and spacing of 0.5–2 cm (indicated by arrows), RLLD/RLLS = 1.44, 4284.05 m.
Processes 11 02791 g006
Figure 7. Fracture distribution pattern of lower Wulalike dormation siliceous shale in the Majiatan area, northwestern Ordos Basin.
Processes 11 02791 g007
Figure 8. NMR spectra of the lower Wulalike Formation in Majiatan and Shanghaimiao areas.
Processes 11 02791 g008
Figure 9. Deep and shallow resistivity responses of the lower Wulalike Formation and the Wufeng Formation–Longmaxi Formation in the Shanghaimiao area.
Processes 11 02791 g009
Figure 10. RLLD/RLLS vs. AC for Wulalike Formation.
Processes 11 02791 g010
Figure 11. Electrical logs of the lower Wulalike Formation in northwestern Ordos Basin.
Processes 11 02791 g011aProcesses 11 02791 g011b
Figure 12. Distribution of siliceous shale and fracture porosity of key wells in the lower Wukalike Formation in northwestern Ordos Basin.
Processes 11 02791 g012
Figure 13. Porosity composition of the lower Wulalike Formation in Well L105.
Processes 11 02791 g013
Table 1. Common methods for shale fracture identification.
No.MethodDescriptionAdvantagesDisadvantages
1Section/core observationUsed to visually observe the dimension (length and width), occurrence, and filling of fractures in rock samples and calculate fracture densitySuitable for describing macrofractures with a width of 0.1 mm or more and estimating fracture porosityDifficult to identify and characterize microfractures with a width of ˂0.1 mm and their filling status
2Imaging loggingUsed to identify the dimension (length and width), occurrence, and filling of fractures by using imaging techniques such as microresistivity and array acoustic, and calculate fracture densitySuitable for describing macrofractures with a width of >5 mm Not applicable to identify fractures with a width of ˂1 mm and calculate fracture porosity
3Conventional resistivity loggingUsed to identify the length of fracture zone in tight rocks according to the significant difference in response values of deep and shallow resistivities caused by mud invasion during drilling (known as RLLD/RLLS dual-track anomaly) and calculate fracture porositySuitable for fracture zones in tight rocks with severe mud intrusionNot applicable to fracture zones in tight rocks without mud invasion
4Rock thin section/high-precision SEMUsed to visually observe the dimension (length and width) and filling of microfractures and calculate fracture densitySuitable for describing microfractures and determining pore typesHighly dependent upon observation points and does not quantitatively calculate the fracture porosity
5Porosity-permeability chart Used to measure the porosity and permeability of rock samples using methods such as helium gas and mercury injection and qualitatively determine the type of pores/fractures based on the correlation between porosity and permeability and the degree of pore permeabilityQualitatively identify microfractures, determine pore types, and generate reliable resultsCannot calculate fracture porosity; high requirement for sample size
6NMRUsed to measure the porosity and permeability of rock using NMR signals of hydrogen atoms of pore fluids in rock samples and indirectly determine the pore/fracture types according to the features of standard T2 spectra.Qualitatively identify microfractures, determine pore types, and generate reliable results; low requirement for sample size Cannot calculate fracture porosity
7Dual-porosity media modelUsed to establish a petrophysical model of pore composition based on experimental data and calculate the rock porosity and its main componentsQuantitatively obtain the fracture porosity, determine the type of gas reservoir, and identify the main pay zones.
Especially suitable for shale formations with TOC >2%
Highly dependent upon data points and test results, as well as key parameter calibration values.
Difficult to characterize shale with an average TOC of ˂1%
Table 2. Estimation of fracture porosity for Wulalike Formation in Majiatan area by core observation.
CoreWellDepth/mAvg. Fracture Width/mmAvg. Fracture Spacing/
cm
Fracture Number per Cubic Meter of Shale Fracture Volume per Cubic Meter of Shale/(m3)Fracture Porosity/
%
1L994422–44320.12500.00500.50
2L994422–44320.10.81250.01251.25
3L994422–44320.10.52000.02002.00
4L994422–44320.11.2830.00830.83
5L1054284–42850.111000.01001.00
6ZP14273–42740.10.751330.01331.33
7ZP14247–42,7480.152.5400.00600.60
Table 3. Calibration results of key parameters for dual-track method.
WellDepth/mmRLLS/(Ω·m)RLLD/(Ω·m)Φfr/%Rmf/(Ω·m)
L105 4284–42851.452.7075.981.000.27
ZP1 4273–42741.484.05791.011.332.60
4247–42,7481.440.06447.6850.600.19
Table 4. Calculation of fracture porosity of lower Wulalike Formation in key wells in northwestern Ordos Basin.
AreaWellDepth/mThickness/mRLLS/(Ω·m)RLLD/(Ω·m)RLLD/RLLSΦfr/%Remarks
MajiatanZ54700–47353524.7–148.6/62.632.2–197.5/82.31.25–1.38/1.310.84–2.91/1.58Dual-track interval occurs continuously, with large thickness and high amplitude
Z24111–41221156.7–174.1/108.566.8–246.8/153.61.04–1.91/1.410.29–1.82/1.17Dual-track interval is intermittent, mainly in three sections
4129–4132.53.533.6–111.8/83.246.0–126.5/92.71.00–1.37/1.140.06–2.60/0.87
4137–4139262.7–125.5/91.873.3–144.6/103.11.02–1.17/1.120.17–1.06/0.65
ZP14235–42521719.9–87.7/47.524.0–90.8/54.21.02–1.27/1.160.31–2.71/1.34The dual-track feature is mainly found in two sections
4262–42832132.2–221.2/70.134.8–239.5/75.31.00–1.09/1.070.01–1.09/0.65
ShanghaimiaoYT13976–3999.523.542.1–184.9/86.849.2–450.2/145.91.07–2.53/1.600.49–2.49/1.46Dual-track interval mainly appears at the bottom, with greatly variable amplitude, which decreases downward
E1023622–36452317.3–38.9/24.620.4–45.8/29.61.13–1.30/1.201.53–3.14/2.43Separated by marl, the dual-track interval is mainly distributed in the upper and lower parts
3664–36892522.6–77.9/45.823.5–95.9/53.91.03–1.24/1.180.35–2.09/1.38
NP13897–3905848.9–97.2/64.460.3–109.4/75.61.06–1.28/1.190.45–1.61/1.14Dual-track interval distributes continuously, with the amplitude increasing downward
3905–3914927.9–75.7/42.433.6–79.0/75.71.03–1.39/1.250.37–2.84/1.81
GufengzhuangL564187–4189245.0–98.0/70.047.0–100.0/76.01.04–1.25/1.090.19–1.38/0.57Dual-track interval only appears in local shales, with a thickness of 2 m
L824364–4368419.0–50.0/38.022.0–60.0/40.01.02–1.20/1.120.30–1.85/0.71Dual-track interval only appears in local shales, with a thickness of 4 m
L524275–42982436.3–265.4/117.639.0–290.9/129.51.03–1.44/1.090.13–1.20/0.50Dual-track interval distributes continuously, with a large thickness but relatively low amplitude
L644155–4158.53.5105.0–150.0/120.0120.0–170.0/130.01.01–1.14/1.080.10–0.66/0.43The dual-track interval appears intermittently, mainly in two sections
4165–41738100.0–200.0/130.0110.0–210.0/140.01.01–1.10/1.080.21–0.55/0.38
L1054275–42881318.6–146.8/61.026.4–155.1/74.81.02–1.52/1.310.14–4.38/2.00Dual-track interval mainly occurs at the bottom, with a thickness of 13 m
TiekesumiaoQT105099–511718103.3–407.0/212.6112.3–533.4/261.01.04–1.31/1.210.21–0.88/0.53Dual-track feature is observed in all black shales, with a cumulative thickness of 27 m and high amplitude
5122–51319133.3–1009.3/522.8149.2–1193.0/613.31.03–1.32/1.170.06–0.50/0.27
QT94717–47392268.4–440.2/135.672.2–498.9/145.21.00–1.17/1.060.00–0.63/0.31Dual-track interval only occurs in local shales with low amplitude
QT54670–4677746.2–163.3/95.846.5–183.5/106.31.01–1.20/1.100.13–0.80/0.52Dual-track interval occurs intermittently in three shale sections, 6–9.5 m thick in each section, with low amplitude
4682.5–4688.56100.6–419.5/232.8104.3–473.6/253.61.02–1.17/1.080.12–0.36/0.25
4693.0–4702.59.5124.0–692.9/336.1130.5–881.0/410.01.03–1.27/1.150.25–0.41/0.30
Note: 0.29–1.82/1.17 = Min.–Max./Avg.
Disclaimer/Publisher’s Note: The statements, opinions and data contained in all publications are solely those of the individual author(s) and contributor(s) and not of MDPI and/or the editor(s). MDPI and/or the editor(s) disclaim responsibility for any injury to people or property resulting from any ideas, methods, instructions or products referred to in the content.

