Article

Low-Carbon Economic Dispatch of Electricity and Cooling Energy System

1
Beijing Smartchip Microelectronics Technology Company Limited, Beijing 102200, China
2
Department of Electrical Engineering, Tsinghua University, Beijing 100084, China
3
State Key Laboratory of Power System Operation and Control, Department of Electrical Engineering, Tsinghua University, Beijing 100084, China
4
Key Laboratory of Thermal Science and Power Engineering of Ministry of Education, Department of Engineering Mechanics, Tsinghua University, Beijing 100084, China
*
Author to whom correspondence should be addressed.
Processes 2023, 11(9), 2787; https://doi.org/10.3390/pr11092787
Submission received: 29 July 2023 / Revised: 26 August 2023 / Accepted: 6 September 2023 / Published: 18 September 2023

Abstract

:
In response to the issue of the hydropower consumption of run-of-river hydropower stations in Southwest China, the district cooling system can provide regulation capacity for hydropower utilization and suppress fluctuations caused by the uncertainty of hydropower. The innovative method is to utilize the thermal characteristics of pipelines and buildings, as well as the thermal comfort elasticity to shift the cooling and electricity loads, which helps to consume the surplus hydroelectric power generation. Taking the minimum total cost of coal consumption in thermal power units, hydropower abandonment penalty, and the carbon trading cost as the objective function, models were established for power supply balance constraints, heat transport constraints, and unit output constraints. The hybrid integer linear programming algorithm was used to achieve the low-carbon economic dispatch of the electric-cooling system. The calculation examples indicate that compared to the traditional real-time balance of cooling supply, the comprehensive consideration of thermal characteristics in a cooling system and flexible thermal comfort have a better operational performance. The carbon trading cost, coal consumption cost, and abandoned hydropower rate of a typical day was reduced by 4.25% (approximately CNY 7.55 × 10⁴), 4.47% (approximately CNY 22.23 × 10⁴), and 3.66%, respectively. Therefore, the electric-cooling dispatch model considering the thermal characteristics in cooling networks, building thermal inertia, and thermal comfort elasticity is more conducive to the hydropower utilization of run-of-river stations.

1. Introduction

The deep integration of power and thermal systems can promote the flexibility improvement of integrated energy systems and the consumption of renewable energy [1,2,3]. The electric-thermal deep integration involves two typical scenarios, namely the electric- heating combined supply and the electric-cooling combined supply [4,5,6]. Fully tapping into the thermal characteristics of heating/cooling systems and buildings, and utilizing the flexibility space contained in user thermal comfort elasticity, is a deep mechanism problem for achieving renewable energy consumption under the electric-thermal integration [7,8,9].
At present, the coordinated electric-thermal dispatching research is focused on the deep integration of power systems and district heating systems for wind and photovoltaic power consumption [10,11,12,13,14,15,16,17,18,19]. Dai et al. [10] proposed two heat storage schemes and models, namely the active heat storage and the passive heat storage, in thermal power plants to increase the wind power accommodation. The passive heat storage capacity was provided by pipelines and building envelopes. Yang et al. [11] carried out integrated electric-heating research; the demand-side model considered the thermal inertia of buildings and the thermal comfort, which helped to integrate the wind power into the power grid and reduced the heating coal consumption. Hassine et al. [12] analyzed the effects of load structure and solar thermal energy on the district heating network, and the effects of consumer distribution on heat loss and the load redistribution were considered, which had a prominent impact on the primary energy utilization and carbon dioxide emissions. Li et al. [13] performed a combined electric-heating dispatch considering the heat storage of a district heating network. This heat storage improved the system flexibility and the wind power utilization. Gu et al. [14] established the transmission delay model and the building thermal storage model for the integrated energy system and found that the thermal inertia of a district heating network and buildings enhanced the wind power absorption. Lin et al. [15] proposed an electric-heating dispatch model that takes into account both the heat transfer mechanism of the heating network and the flexible thermal comfort. The heating network characteristics changed the overlapped range of high heat load and high wind power, while the flexible thermal comfort increased the space for wind power utilization. Yi et al. [16] used the flexibility space provided by the thermal storage of a heating network and the thermal inertia of buildings to increase the wind power consumption. The larger these two factors, the more effective they were in reducing the abandoned wind power. Dong et al. [17] introduced the comprehensive outdoor meteorological information to develop an electric-thermal dispatching model under the flexible thermal comfort. The flexible thermal comfort provided an elastic utilization space for the photovoltaic energy. Yuan et al. [18] proposed a supply-water temperature prediction model based on the building thermal inertia, which had a remarkable energy-saving effect. Xu et al. [19] proposed an electric-heating dispatch model that considered the return temperature feedback and the thermal inertia of a heating network: the former led to the increased wind power curtailment, and the latter helped with the wind power consumption. The optimization dispatching research on the deep integration of power system and district cooling system for hydroelectric power consumption focuses less on the thermal characteristics of pipeline networks and the thermal comfort elasticity [20,21,22,23]. Hao et al. [24] proposed the regional cooling model with ice storage equipment; this model considered the characteristics of ice storage and a cooling network, which provided more space for the hydropower consumption at night. Ghilardi et al. [25] established a combinatorial optimization model for a multi power supply system, district heating/cooling network, and building thermal comfort. When the heat demand did not match the availability of renewable energy, the load transfer capacity of buildings played a major role. Wirtz et al. [26] proposed models for an air source heat pump, compression chiller, electric boiler, and building heat storage. The thermal inertia of the cooling network played an additional role in heat storage, which contributed to the efficient utilization of integrated energy. In the scenario of the extremely abundant and low utilization of run-of-river hydroelectric power in Southwest China, it is an urgent problem to fully tap into the energy supply flexibility contained in cooling networks and buildings to promote the consumption of run-of-river hydroelectric power. Currently, there is little research on the combined dispatch of electric-cooling and run-of-river hydroelectric power consumption considering the thermal characteristics of the cooling network and the thermal comfort.
This paper proposes an integrated electric-cooling dispatch model considering the thermal characteristics of the cooling network, building thermal inertia, and user thermal comfort elasticity. This research will investigate the potential thermal characteristics of the cooling network and buildings’ complementarity with the power system to promote the run-of-river hydropower consumption under the carbon trading mechanism, which can provide the theoretical guidance and operational solution for electric-cooling integrated energy and renewable energy consumption.

2. Method

2.1. Pipeline Characteristic Model

Figure 1 gives a diagram of the cooling network and operation regulation. The cooling capacity provided by the cold source (i.e., refrigeration unit) is transported to the centralized heat-exchange station of buildings through the supply water pipeline at a certain distance, and the return water after heat exchange is then returned to the cold source through the return pipeline, which is called the primary network. Due to the large heat transport distance of the primary network, there are delays and losses in heat transfer. The cooling capacity demand is met by the secondary network. The secondary network is near the building, thus the heat transport loss and delay have little impact on the supply cooling balance. The primary network achieves the balance of cooling capacity supply and demand at different outdoor temperatures by adjusting the supply water temperature for qualitative adjustment or by controlling the circulating water mass flux for quantitative adjustment. The difference between the supply water temperature and the outdoor temperature is about 20 °C. Under the quality regulation condition, this research will focus on the effect of the primary network characteristics on the operation of electric-cooling integrated energy systems.
The thermal characteristics of the cooling network could provide a certain amount of flexibility for the hydropower of run-of-river stations to be connected to the grid in a coupled electric-cooling operation environment. The thermal characteristics of cooling network have a great impact on the supply water heat transfer process, which includes two aspects.
  • Heat delay: The heat of the return water is absorbed by the cold source and its temperature decreases, becoming the supply water. The kinetic energy of the circulating water pump in the cooling network drives the flow towards the heat-exchange station. Due to the transportation time required for the supply water, a heat delay occurs, resulting in an imbalance between supply and demand in the heat exchanger. With reference to Ref. [27], the heat delay time of the cooling network is established as follows:
Δ t L = ρ w π r 2 L 4 m
where Δt is the heat delay time; ρw is the density of the supply water, which is taken as 1000 kg/m3; r is the radius of the pipeline; L is the length of the pipeline; and m is the mass flux of the supply water.
2.
Heat loss: When the supply water temperature is lower than the ambient soil temperature, the supply water temperature increases along the heat transport process, and the inlet temperature supply water of heat-exchange station is higher than the outlet temperature of the cold source, resulting in a loss of cooling capacity. According to Ref. [27], the pipeline heat loss is proposed as follows:
Δ Q CN L = L ( T t T e ) j = 1 J 1 2 π λ j ln d j d j 1
where ΔQCN is the heat loss; Tt is the water temperature in the cooling network; Te is the soil temperature, which is assumed to be 20 °C; dj is the outer diameter of the (j)th layer insulation material; dj−1 is the outer diameter of the (j−1)th layer insulation material; λj is the thermal conductivity of the (j)th layer insulation material; J is the number of insulation layers.

2.2. Flexible Thermal Comfort Model

Heat users have a certain degree of perceptual ambiguity towards the temperature comfort. Moderate fluctuations in indoor temperature will not affect the thermal perception. Under the thermal inertia of buildings, this thermal perceptual ambiguity forms an elastic heat load and changes the heat load demand curve, which provides space for hydropower utilization. Thermal comfort is characterized using the Predicted Mean Vote (PMV) index [15], which is expressed as follows:
PMV = 2.43 3.76 ( T s T in ) M R ( I cl + 0.1 )
where Ts is the mean skin temperature, with Ts = 33.5 °C; MR is the metabolic rate of the human body, with MR = 80 W/m2; Tin is the indoor temperature; and Icl is the clothing thermal resistance, with Icl = 0.11 (m2·K)/W.
The PMV = 0 is the optimal thermal comfort level, with a recommended range for PMV between −0.5 and +0.5 according to the ISO7730 standard [28]. When the PMV index fluctuates between ±0.5, heat users will not feel a significant difference in temperature changes. However, the existing design specification in China limits the PMV to be within ±1.0, which can also meet the thermal comfort needs of heat users. Due to the frequent activities of users during the day, their thermal perception ability is more sensitive than at night, and the requirements for thermal comfort are relatively high. However, at night, the comfort requirements can be appropriately relaxed. Therefore, the upper and lower limits of the PMV are time-limited [15]. From 0:00 to 7:00, the upper limit of the PMV is 1.0 and the lower limit is −1.0; from 7:00 to 17:00, the upper limit of the PMV is 0.5 and the lower limit is −0.5; from 17:00 to 20:00, the upper limit of the PMV is 1.0 and the lower limit is −0.5; from 20:00 to 24:00, the upper limit of the PMV is 1.0 and the lower limit is −1.0. By setting different limits for thermal comfort at different times, the heat load has a range of flexibility.

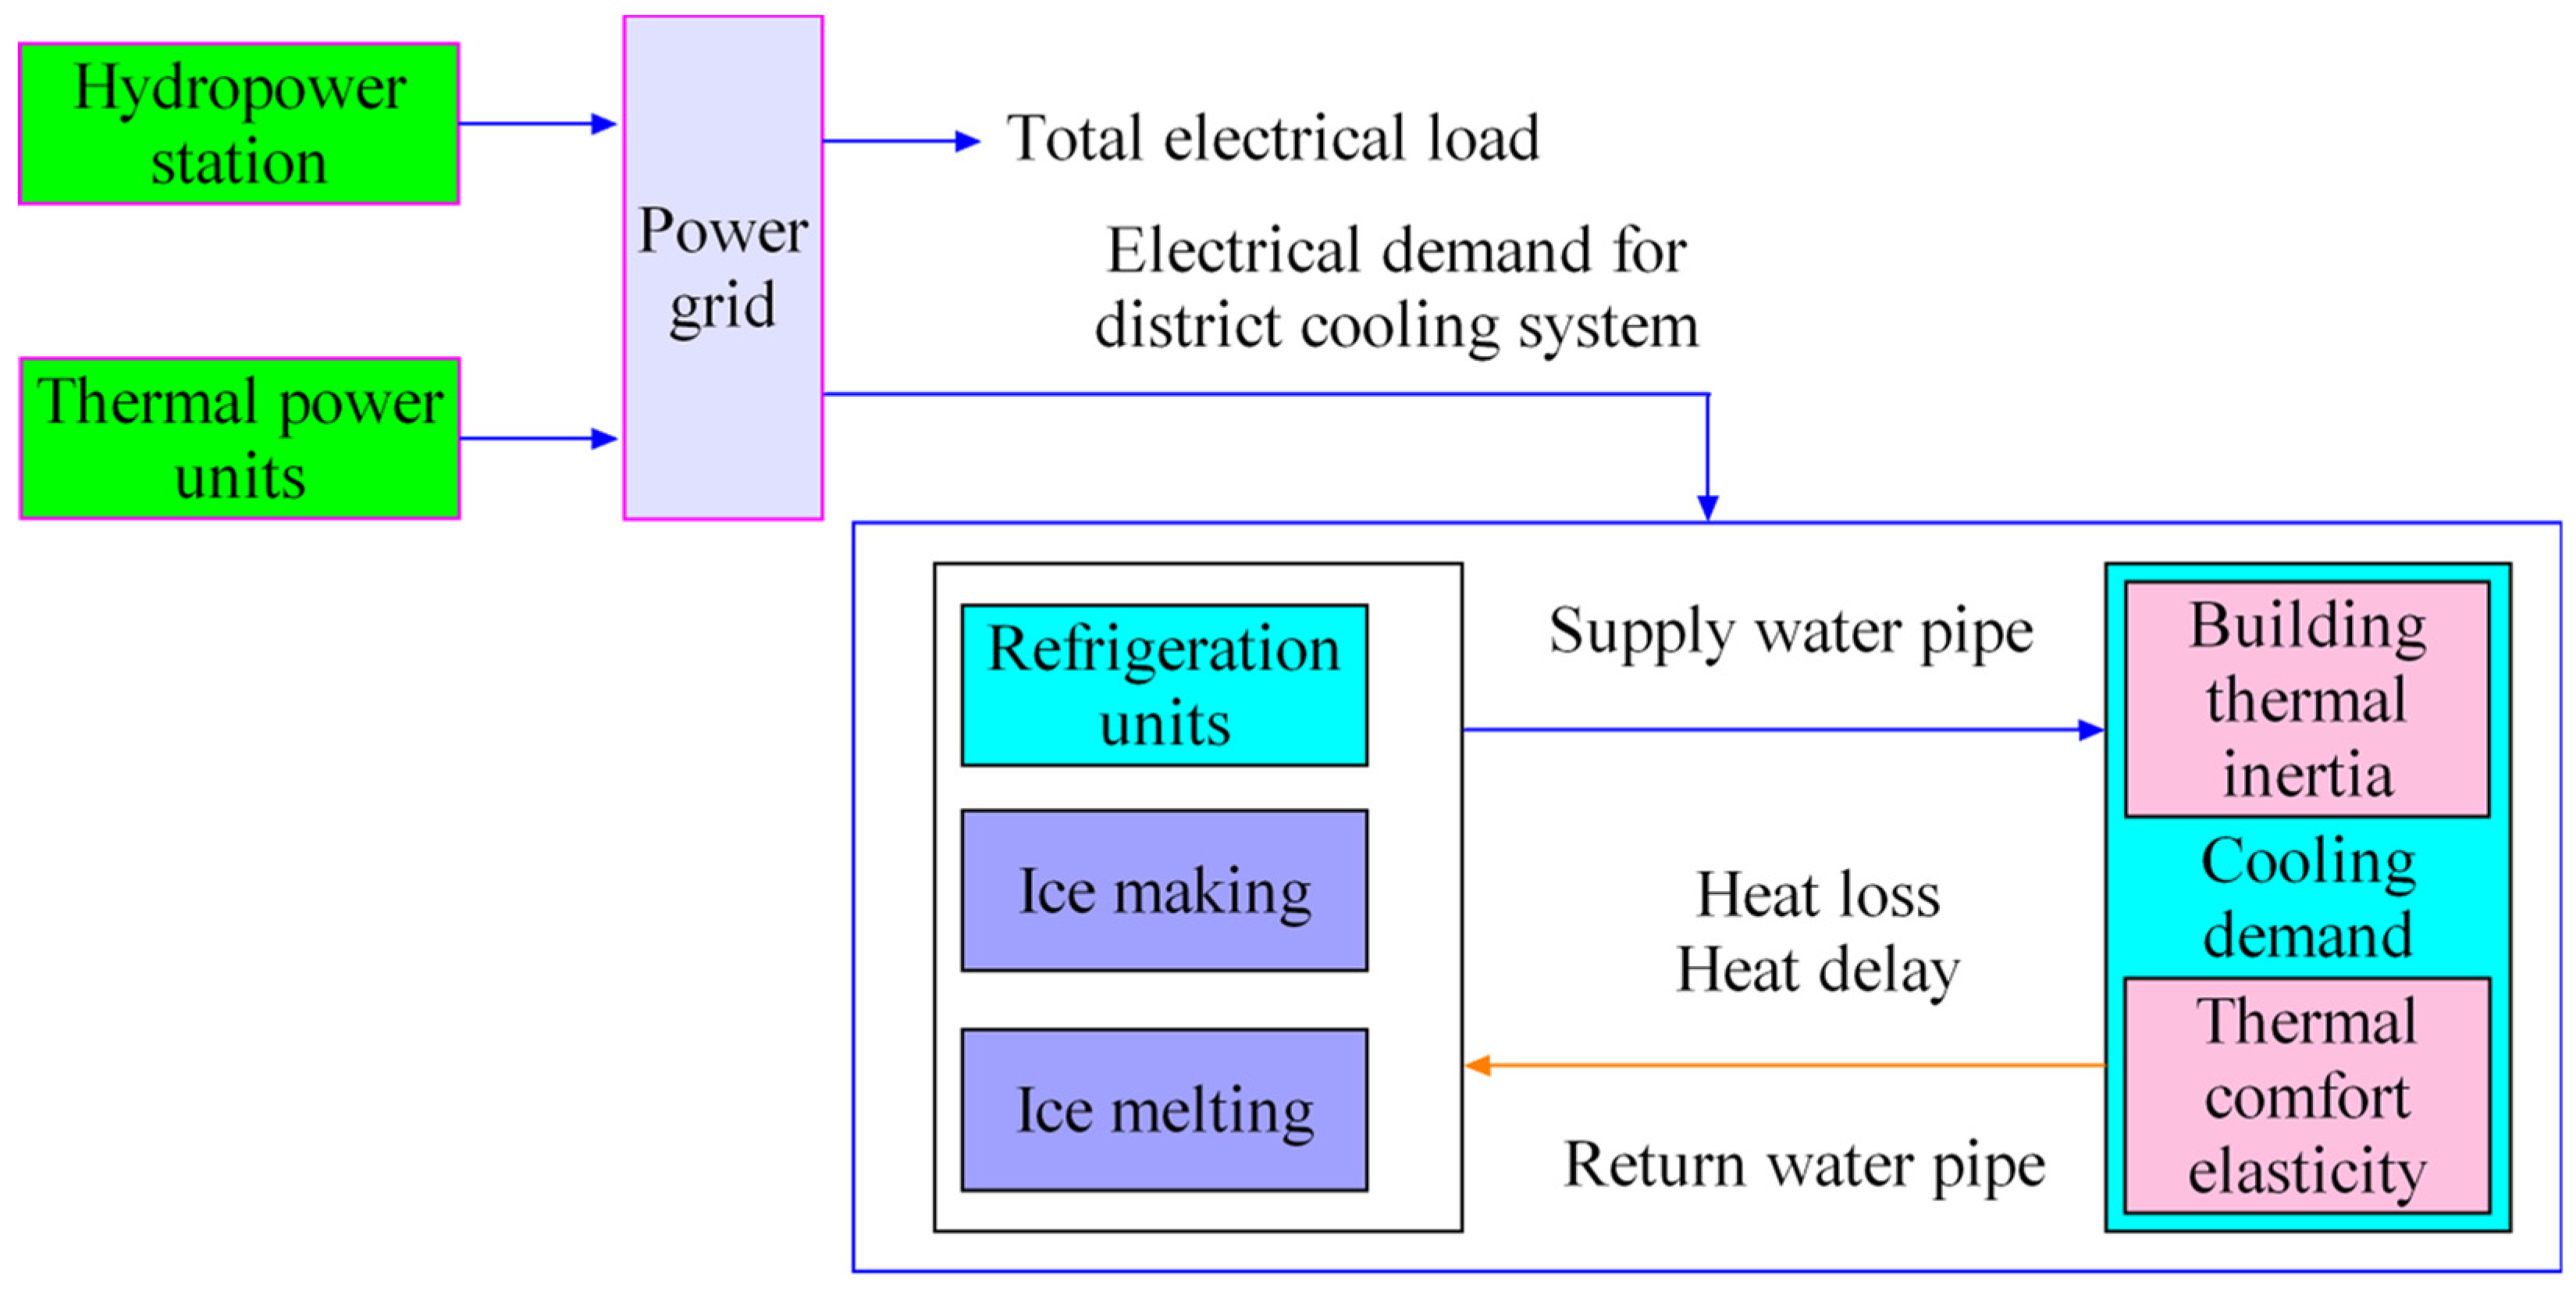
2.3. System Description

Figure 2 shows a schematic diagram of an electric-cooling integrated energy system. In this energy system, the power source consists of condensing units and a run-of-river hydropower station, meeting the total electrical load and the electricity consumptions of refrigeration units and ice storage equipment. The district cooling system includes refrigeration units, ice storage equipment (ice making and ice melting), and supply water and return water pipelines, taking into account heat delays and heat losses. The cooling load is satisfied through refrigeration units and ice storage equipment. The user side considers the thermal inertia of buildings and the thermal comfort elasticity.

2.4. Electric-Cooling Dispatching Model

2.4.1. Goal Function

This system achieves the integrated dispatching of electric-cooling under the carbon trading mechanism and the efficient consumption of hydropower. Introducing the penalty cost coefficient for abandoned hydropower, the overall goal of the coordinated dispatch of an electric-cooling system is to minimize the sum of the coal consumption cost for condensing units (CCON), the carbon trading cost for the system (CE), and the penalty cost for abandoned power in run-of-river hydropower stations (CHYD).
min ( C CON + C E + C HYD )
The cost model for the coal consumption of condensing units (CCON) is as follows:
C CON = C coal t = 1 T m = 1 M F CON t , m
where Ccoal is the coal price, taken as in Chinese Yuan as 850 CNY/t [16]; FCON is the coal consumption of condensing unit; T is the dispatch period; and M is the number of condensing units.
The relationship between the coal consumption FCON and the power generation PCON for the condensing unit is as follows [24]:
F CON = a 0 + a 1 P CON + a 2 P CON 2
where a0~a2 are the coal consumption coefficients for the condensing unit. For a condensing unit with a certain capacity, the coal consumption coefficient is determined by fitting.
The carbon trading market allocates carbon quotas to various types of power generation units according to certain rules. If the carbon emissions of a power generation unit exceed the carbon quota, it needs to purchase the insufficient carbon quotas from the carbon trading market. If the carbon emissions of a power generation unit are lower than the carbon quota, the remaining carbon quotas can be sold on the carbon trading market.
According to Ref. [21], the carbon quota model for condensing units and run-of-river hydropower stations is established as follows:
E p = σ ( t = 1 T m = 1 M P CON t , m + t = 1 T n = 1 N P HYD t , n ) .
where σ is the carbon quota coefficient per unit of electricity; PHYD is the electric power generated by a run-of-river hydropower station; and N is the number of hydropower stations.
The carbon emission (Eo) model for condensing units is as follows:
E o = t = 1 T m = 1 M γ m P CON t , m
where γm is the carbon emission intensity per unit output.
The carbon trading cost (CE) model is as follows:
C E = C b ( E o E p )
where Cb is the carbon trading price, which is set at 120 CNY/t [17].
The cost model for the hydropower abandonment penalty (CHYD) is as follows:
C HYD = δ t = 1 T n = 1 N ( P HYD t , n , r e P HYD t , n )
where δ is the penalty factor for abandoned hydropower, with a value of 0.32 t/(MW·h) [17]; and ‘re’ is the predicted value.

2.4.2. Constraint Condition

(1)
Power balance constraint
m = 1 M P CON t , m + n = 1 N P HYD t , n = P load t + r = 1 R P RU t + P ice t + P melt t
where Pload is the electricity demand; PRU is the electric power consumption of refrigeration units; R is the number of refrigeration units; Pice is the electric power consumption for making ice; and Pmelt is the electric power consumption for melting ice.
(2)
Heat transport models of a cooling system
Heat balance model of a refrigeration unit:
P RU t , r C O P RU = c w m CS t ( T rev , CS t T dir , CS t )
where COPRU is the COP of the refrigeration unit; cw is the specific heat capacity of water, which is taken as 4.2 kJ/(kg·K); mCS is the mass flux of the supply water at the outlet of the cold source; and Tdir,CS and Trev,CS represent the supply water and return water temperatures of the cold source.
Heat transport model from the pipeline inlet to the pipeline outlet:
T p out , t + Δ t = T p in , t Δ Q CN L c w
where ‘p’ represents the pipeline.
Heat balance model of a heat exchanger:
Q HE t = c w m HE t ( T rev , HE t T dir , HE t )
where QHE is the heat obtained by the heat-exchange station; mHE is the inlet mass flux of the heat-exchange station; Tdir,HE is the supply water temperature of the heat-exchange station; and Trev,HE is the return water temperature of the heat-exchange station.
Heat balance model between a heat-exchange station and cooling load:
f = 1 F Q HE t + Δ t , f + P melt t C O P m = f = 1 F Q load t + Δ t , f
where F is the number of heat-exchange stations; Qload is the cooling load; and COPm is the COP of melting ice.
Indoor temperature change model:
T in t + Δ t , f = T in t , f + Q load t , f + K ( T out t , f T in t , f ) F f c air ρ air V f Δ t
where Tout is the outdoor temperature; K is the heat transfer coefficient of the building envelope structure; Ff is the total perimeter area of the building corresponding to the heat-exchange station; cair is the specific heat capacity of indoor air with a value of 1.007 kJ/(kg·K); ρair is the density of indoor air with a value of 1.2 kg/m3; Vf is the total volume of buildings corresponding to the heat-exchange station. This model takes into account both the energy storage process of the building envelope structure and the indoor air.
PMV constraint:
PMV t , min PMV t PMV t , max
Temperature constraints on supply water and return water for quality regulation:
T dir min T dir , k t T dir max
T rev min T rev , k t T rev max
(3)
Unit output constraints
Electrical output constraint for a condensing unit:
P CON m , min P CON t , m P CON m , max
Power consumption constraint for a run-of-river hydropower station:
0 P HYD t , n P HYD t , n , r e
Power consumption constraint for a refrigeration unit:
P RU r , min P RU t , r P RU r , max
Power consumption constraint for ice storage equipment:
Balance constraint between ice making and melting:
0.94 t = 1 T 1 P ice t = t = T 1 + 1 T P melt t
Maximum ice-making capacity constraint:
0 P ice t P ice max
Maximum ice-melting capacity constraint:
t = T 1 + 1 T P melt t P load c
where T1 is the total period of making ice; c is the value during non-peak times.
(4)
Unit ramping constraint
D m , max Δ t P CON t + Δ t , m P CON t , m U m , max Δ t
where Dm,max and Um,max are the maximum up and down power ramp rates for the condensing unit.

2.5. Basic Data

The selected electric-cooling integrated energy system includes thermal power units, a run-of-river hydropower station, and a district cooling system connected and dispatched through dedicated lines. Three condensing units and one hydropower station are installed. The characteristic parameters of the condensing units (s1~s3) are shown in Table 1. The capacity of the hydropower station is 460 MW. We selected 1 h as the dispatching period, and 24 h as the dispatching cycle. The electrical load, cooling load, outdoor air temperature, and predicted hydropower are shown in Table 2. σ = 0.70. γm is taken as 1.08, 1.35, and 1.35 for the s1, s2, and s3 units, respectively. The refrigeration unit is equivalent to one large refrigeration unit, COP is 5, and an equivalent large heat-exchange station is set. The corresponding total peripheral volume of buildings is 6.372 million m3, the total peripheral area is 14.16 million m2, and the heat transfer coefficient of the building envelope is 1.59 W/(m·K). The length of the water supply pipeline is 3.6 km, and the mass flux is 196.25 kg/s, which means the flow velocity is 1 m/s. The pipeline delay time is 1 h. The COP of ice storage equipment for melting ice is 3.5, and the maximum ice energy storage capacity is 150 MW. The optimal dispatching of the integrated electric-cooling system is solved based on the mixed integer linear programming (MILP) algorithm. The general idea of this algorithm is to first solve the mixed integer programming problem by ignoring all integer constraints and relaxing it into a linear programming problem. If the result meets the integer constraints, then this solution is the solution of the original mixed integer linear programming. If the result does not meet the integer constraints, the original problem will be decomposed into two sub mixed integer programming problems, and the solution of the sub integer programming problem is also the solution of the original problem. Optimal scheduling calculations are based on MATLAB software (https://ww2.mathworks.cn/products/matlab.html).

3. Results and Discussion

Figure 3 shows the optimized dispatching results of power generation. It can be seen that the peak electricity consumption period is from 7:00 to 18:00. The power generation rate of the condensing unit s1 is 67–96%, and condensing units s2 and s3 are both generating at full loads, without frequent power generation adjustments. Therefore, the operation performances of the condensing units are good and the utilization rates are high. However, the hydropower station bears a relatively small share of power generation, and its power generation is relatively stable.
Figure 4 shows the optimized operation results of the district cooling system. It can be found that the melting of ice in ice storage equipment during the peak electricity consumption period, i.e., 9:00–20:00, and the cooling load are met by the refrigeration unit and the ice storage equipment. Ice making during the low electricity consumption period can assist in consuming hydropower at night, and the cooling load demand is only borne by the refrigeration unit. Due to the existence of heat delay and heat loss, the cooling capacity provided is delayed by 1 h to reach the heat-exchange station. The total ice-making capacity is 1570 MW, and the total ice-melting capacity is 1470 MW.
Figure 5 presents the comparison between the actual output of hydropower and the maximum available value. It can be seen that during the daytime period, i.e., 5:00–20:00, the overlap between the hydropower output and the maximum available power curve is relatively high, while during other periods, the hydropower output is lower than the maximum available value and has a certain amount of abandoned hydropower. The maximum abandoned hydropower is 56 MW, corresponding to an abandoned hydropower rate of 13.83%. The minimum abandoned hydropower is 6 MW, with an abandoned hydropower rate of 1.7%.
Figure 6 shows the hourly variations of indoor temperature and PMV. Figure 6a quantitatively analyzes the indoor conditions from the perspective of indoor temperature, while Figure 6b qualitatively illustrates the comfort level corresponding to the indoor temperature. It can be seen that the indoor temperature during the daytime is mostly maintained at 24.87 °C, corresponding to a PMV of 0.5. The indoor temperature during the peak period of hydropower at night can be divided into two typical stages: Before the 8th period, the indoor temperature remains constant, with a temperature of 27.1 °C and a corresponding PMV of 1.0. After the 18th period, the indoor temperature fluctuates as it first increases, then decreases, then increases, then remains constant, with a range of 25.5 °C–27.1 °C and a PMV range of 0.64–1.0. The indoor temperature remains constant during the daytime, and residents experience a better comfort in their work and life processes. At night, the indoor temperature is not constant, but residents are basically in a sleep state and are not sensitive to the perception of thermal comfort, which will not significantly affect the cooling effect. Moderate fluctuations in thermal comfort may be used to provide additional hydropower utilization during peak periods of hydropower at night. In addition, during the 1st–8th period and 20–24th period of the night, the outdoor temperature is low while the indoor temperature is high; thus, the building enclosure structure releases heat. The outdoor temperature first increases and then decreases during the rest of the day. The outdoor temperature is high and the indoor temperature is low; thus, heat is stored in the building envelope structure.
Figure 7 shows the hourly variation in the inlet supply water temperature of the cooling network. The ambient temperature is constant, and the difference between the supply water temperature and the ambient temperature reflects the heat storage and release characteristics of pipelines. It can be seen that during the peak period of hydropower at night (before 8:00 and after 21:00), the supply water temperature is higher than the ambient temperature (20 °C), the maximum supply water temperature is 25.3 °C, and the supply water network releases heat to the environment. At other times, the supply water temperature is lower than the ambient temperature, the minimum supply water temperature is 10.7 °C, and the supply water absorbs heat from the environment. The inlet temperature of the supply water pipe is affected by the constraint of elastic thermal comfort, and an increase in thermal comfort (i.e., PMV reduction) requires a decrease in the supply water temperature to provide a greater cooling capacity.
Figure 8 shows the hourly variation in system costs. It can be seen that the coal consumption cost of thermal power units is relatively high during the daytime period, which is accompanied by a certain carbon trading cost in the peak electric load period. During the peak period of hydropower at night, the maximum available value of hydropower cannot be fully utilized, and there is a penalty cost for abandoned hydropower. The power generation of thermal power units is relatively small; only a small amount of additional carbon emission quotas need to be purchased, resulting in a significant decrease in carbon trading costs. The total coal consumption cost is CNY 475.06 × 10⁴, the total carbon trading cost is CNY 45.41 × 10⁴, and the total cost of hydropower abandonment penalty is CNY 15.89 × 10⁴.
Table 3 shows a comparison between the operation costs of an electric-cooling dispatching model (Case 2) and a traditional electric-cooling dispatching model (Case 1). The traditional combined operation model does not consider the characteristics of the cooling network, the thermal inertia of the building envelope structure, and the thermal comfort elasticity. From the table, it can be seen that the coal consumption cost, carbon trading cost, and total cost of the present dispatching model are all lower than the traditional electric-cooling dispatching condition, and the abandoned hydropower rate has decreased from 11.03% to 7.37%, playing a significant role in hydropower consumption. Therefore, considering the characteristics of the cooling network, the thermal inertia of buildings and the flexible thermal comfort of users can help to absorb the renewable energy, reduce the operation cost, and avoid the problem of supply and demand deviation of the cooling load in the traditional scheduling method. It is recommended to jointly dispatch regional cooling and electricity as an integrated energy system, comprehensively utilizing the heat-transfer characteristics of the cooling network, building thermal inertia, and thermal comfort elasticity to solve the problem of run-of-river hydropower consumption, and achieve the optimal operational economy. This approach is in contrast with ignoring the flexible adjustment capabilities inherent in these links, simply providing real-time supply according to cooling demand.

4. Conclusions

This article conducts research on the low-carbon economic dispatch of an electric-cooling system that takes into account the thermal characteristics of the cooling network and thermal comfort elasticity. The major conclusions can be summarized as follows:
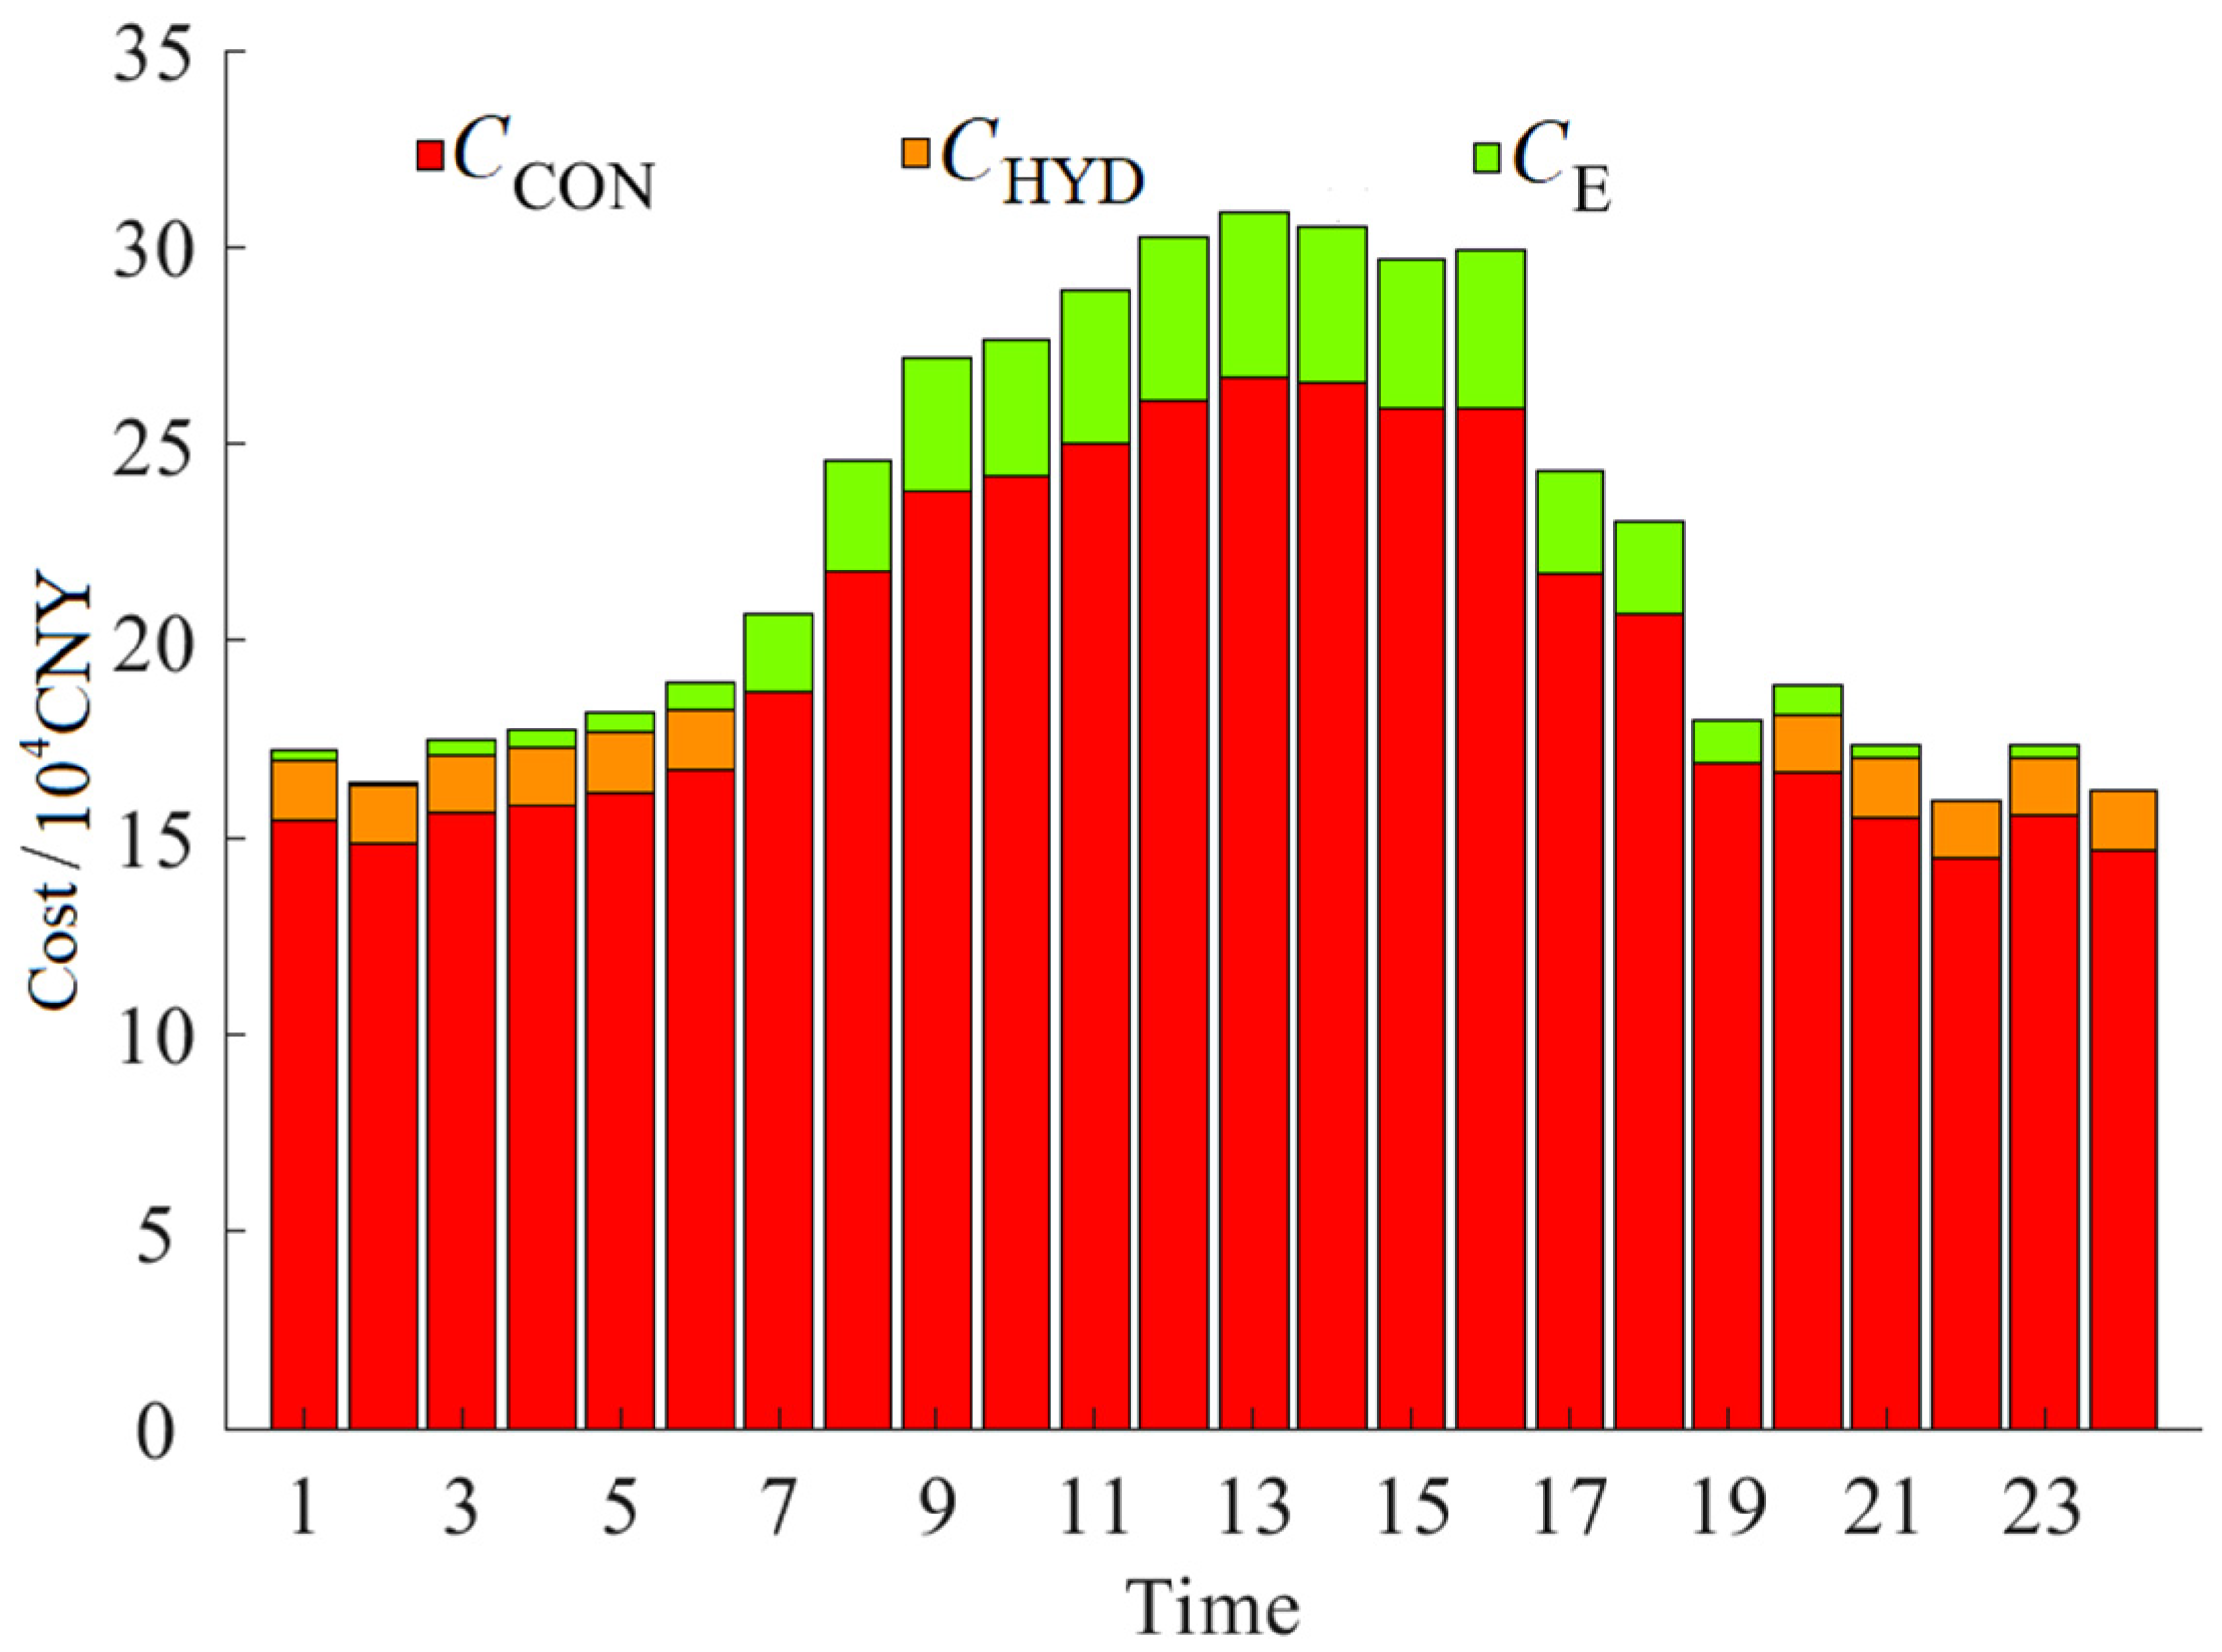
  • The electric-cooling joint dispatching is achieved by combining the district cooling and electrical energy to form an integrated energy system. The utilization rates of condensing units are relatively high, and the power generation rates of condensing units are basically higher than 67% without frequent power generation adjustments. The maximum abandoned hydropower rate is below 13.83%.
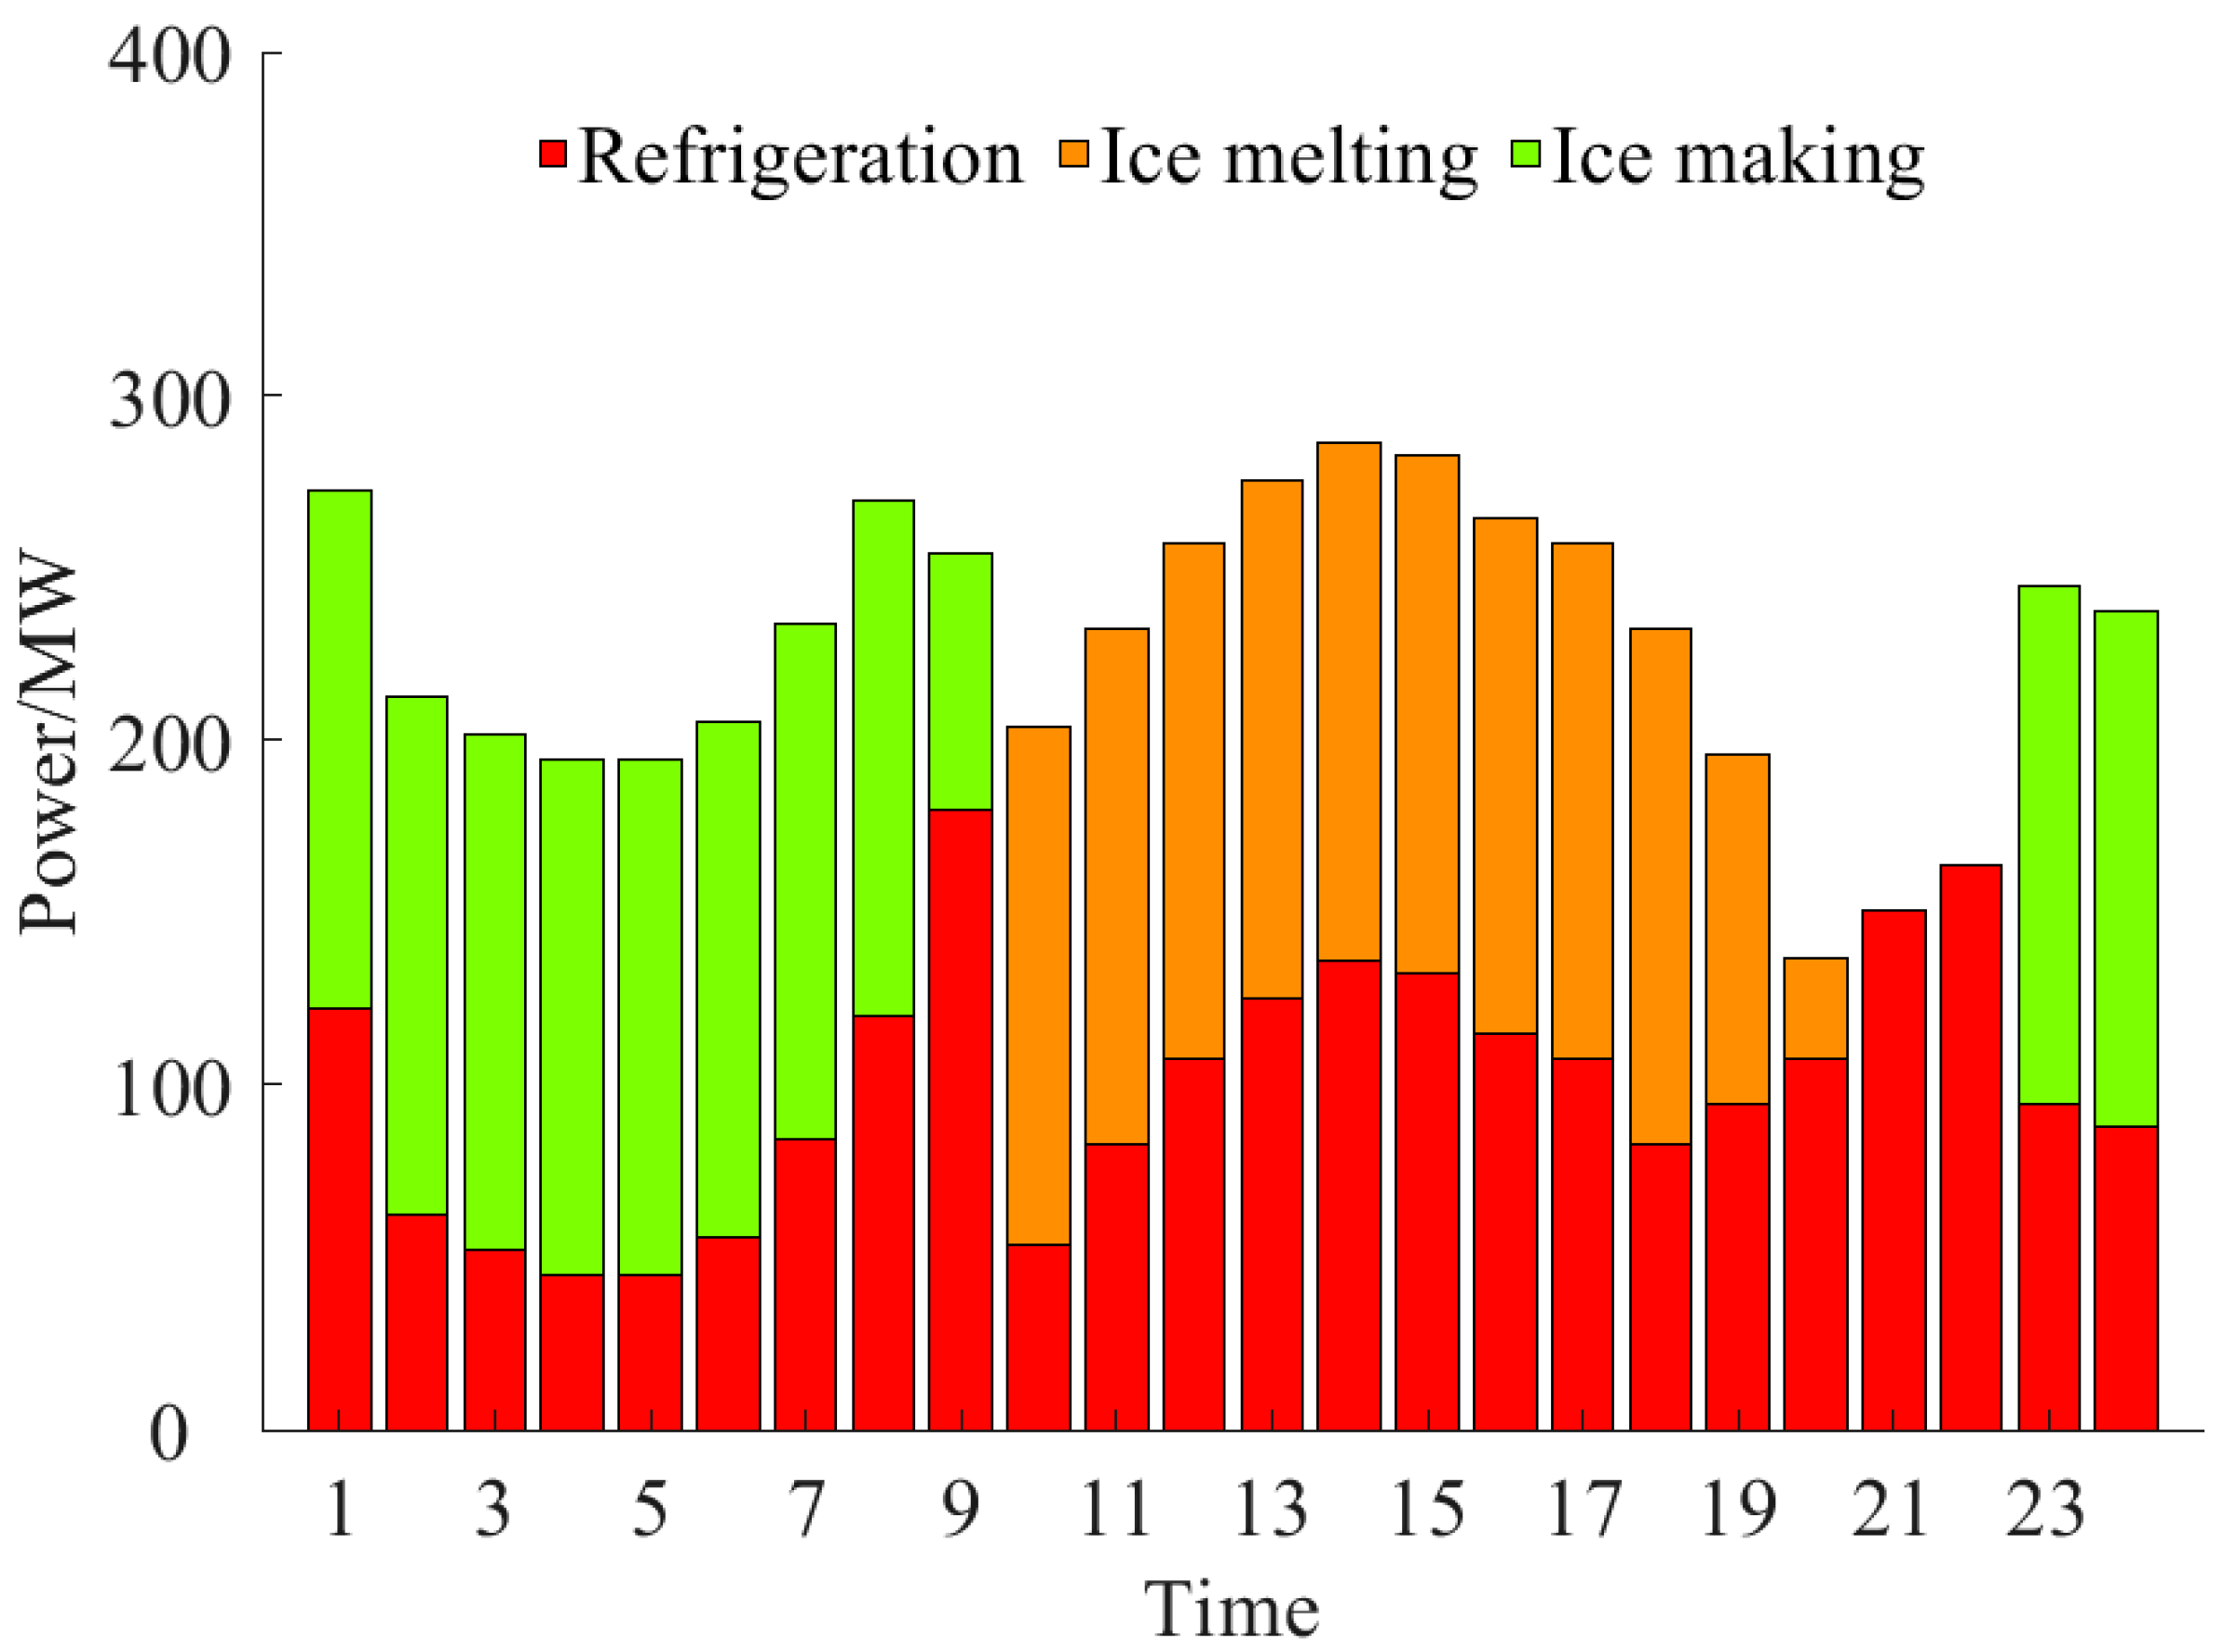
  • Refrigeration units and ice storage equipment are adopted to jointly meet the cooling capacity. During the peak period of hydropower at night, the hydropower is used to make ice, and during the peak period of cooling load at daytime, ice melting is used to provide the cooling supply. The ice storage equipment not only supplements the cooling capacity but also effectively promotes the hydropower consumption.
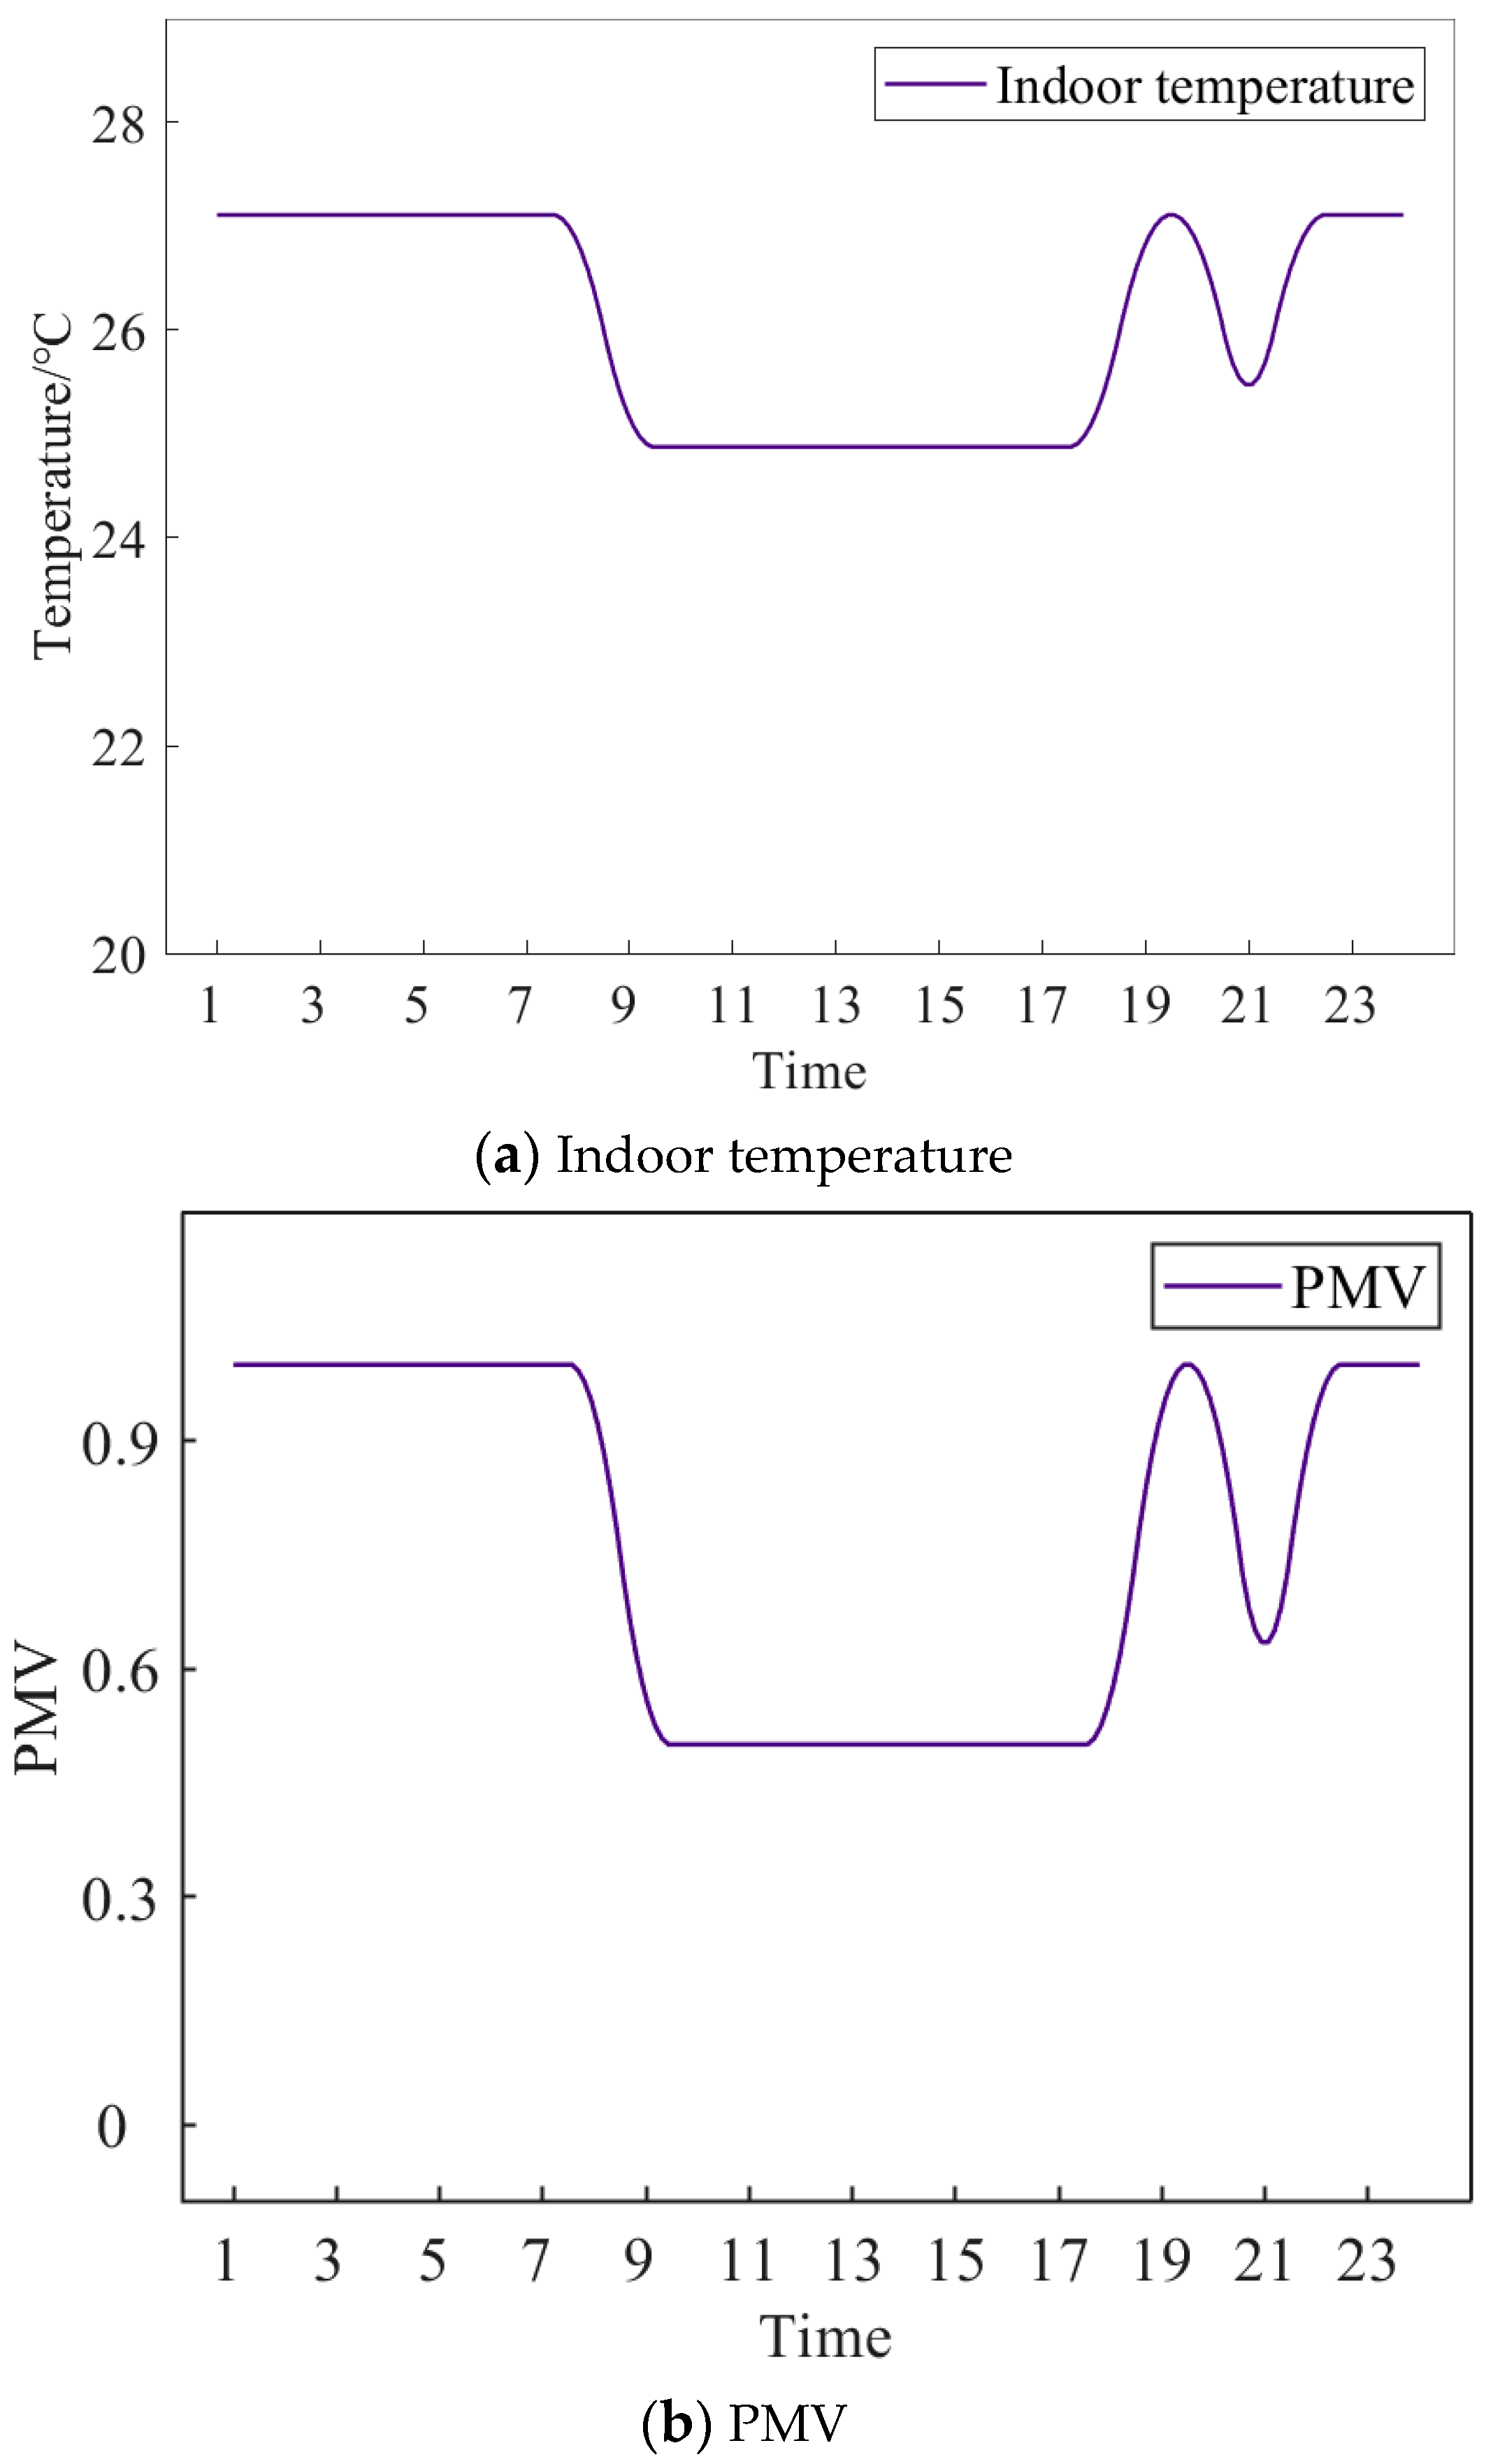
  • Most of the time, the inlet supply water temperature is lower than the ambient temperature and the cooling network absorbs heat from the environment, resulting in the heat loss. During the peak period of hydropower at night, the indoor temperature and PMV fluctuate within a certain range. The inlet temperature of the supply water pipe is affected by the constraint of elastic thermal comfort, and an increase in thermal comfort requires a decrease in the supply water temperature to provide a greater cooling capacity. Considering the thermal characteristics of the cooling network, as well as the thermal comfort elasticity, compared to the traditional dispatching model, the carbon trading cost, coal consumption cost, and abandoned hydropower rate were reduced by 4.25%, 4.47%, and 3.66%, respectively.
This research was supported by the Academician Expert Fund of Beijing Smartchip Microelectronics Technology Company Limited; State Grid Corporation of China Science and Technology Project Funding (No. SGITZXDTZPQT2201165).

Author Contributions

Conceptualization, Y.W., L.H., L.Z., L.C., F.X. and Y.M.; Methodology, Y.W., L.H., F.X. and Q.C.; Software, L.H., L.Z. and Q.C.; Validation, L.H., L.Z., L.C. and Y.M.; Formal analysis, Y.W. and Y.M.; Investigation, Y.W. and L.Z.; Resources, L.C. and Q.C.; Writing—original draft, Y.W. and L.H.; Writing—review & editing, L.C., F.X., Q.C. and Y.M.; Supervision, L.H.; Project administration, F.X. All authors have read and agreed to the published version of the manuscript.

Funding

This research was funded by Academician Expert Fund of Beijing Smartchip Microelectronics Technology Company Limited; State Grid Corporation of China Science and Technology Project Funding grant number SGITZXDTZPQT2201165.

Data Availability Statement

Not applicable.

Conflicts of Interest

The authors declare no conflict of interest.

References

  1. Liu, W.; Lund, H.; Mathiesen, B.V. Large-scale integration of wind power into the existing Chinese energy system. Energy 2011, 36, 4753–4760. [Google Scholar] [CrossRef]
  2. Tveit, T.M.; Savola, T.; Gebremedhin, A.; Fogelholm, C.J. Multi-period MINLP model for optimising operation and structural changes to CHP plants in district heating networks with long-term thermal storage. Energy Convers. Manag. 2009, 50, 639–647. [Google Scholar] [CrossRef]
  3. Li, Y.; Han, M.; Shahidehpour, M.; Li, J.Z.; Long, C. Data-driven distributionally robust scheduling of community integrated energy systems with uncertain renewable generations considering integrated demand response. Appl. Energy 2023, 335, 120749. [Google Scholar] [CrossRef]
  4. Hennessy, J.; Li, H.; Wallin, F.; Thorin, E. Flexibility in thermal grids: A review of short-term storage in district heating distribution networks. Energy Procedia 2019, 158, 2430–2434. [Google Scholar] [CrossRef]
  5. Dahlblom, M.; Nordquist, B.; Jensen, L. Evaluation of a feedback control method for hydronic heating systems based on indoor temperature measurements. Energy Build 2018, 166, 23–34. [Google Scholar] [CrossRef]
  6. Liu, X.Z.; Wu, J.Z.; Jenkins, N.; Bagdanavicius, A. Combined analysis of electricity and heat networks. Appl. Energy 2016, 162, 1238–1250. [Google Scholar] [CrossRef]
  7. Arteconi, A.; Mugnini, A.; Polonara, F. Energy flexible buildings: A methodology for rating the flexibility performance of buildings with electric heating and cooling systems. Appl. Energy 2019, 251, 113387. [Google Scholar] [CrossRef]
  8. Ansari, B.; Aligholami, M.; Khosroshahi, A.R. An experimental and numerical investigation into using hydropower plant on oil transmission lines. Energy Sci. Eng. 2022, 10, 4397–4410. [Google Scholar] [CrossRef]
  9. Hao, L.; Xu, F.; Chen, Q.; Wei, M.S.; Chen, L.; Min, Y. A thermal-electrical analogy transient model of district heating pipelines for integrated analysis of thermal and power systems. Appl. Therm. Eng. 2018, 139, 213–221. [Google Scholar] [CrossRef]
  10. Dai, Y.H.; Chen, L.; Min, Y.; Chen, Q.; Zhang, Y.W.; Xu, F.; Hu, K.; Hao, J.H. Active and passive thermal energy storage in combined heat and power plants to promote wind power accommodation. J. Energy Eng. 2017, 143, 04017037. [Google Scholar] [CrossRef]
  11. Yang, Y.L.; Wu, K.; Long, H.Y.; Gao, J.C.; Yan, X.; Kato, T.; Suzuoki, Y. Integrated electricity and heating demand-side management for wind power integration in China. Energy 2014, 78, 235–246. [Google Scholar] [CrossRef]
  12. Hassine, I.B.; Eicker, U. Impact of load structure variation and solar thermal energy integration on an existing district heating network. Appl. Therm. Eng. 2013, 50, 1437–1446. [Google Scholar] [CrossRef]
  13. Li, Z.G.; Wu, W.C.; Shahidehpour, M.; Wang, J.H.; Zhang, B.M. Combined heat and power dispatch considering pipeline energy storage of district heating network. IEEE Trans. Sustain. Energy 2016, 7, 12–21. [Google Scholar] [CrossRef]
  14. Gu, W.; Wang, J.; Lu, S.; Luo, Z.; Wu, C.Y. Optimal operation for integrated energy system considering thermal inertia of district heating network and buildings. Appl. Energy 2017, 199, 234–246. [Google Scholar] [CrossRef]
  15. Li, L.; Jia, G.; Qian, W. Optimal dispatching of combined heat-power system considering characteristics of thermal network and thermal comfort elasticity for wind power accommodation. Power Syst. Technol. 2019, 43, 3648–3655. (In Chinese) [Google Scholar]
  16. Yi, Z.K.; Li, Z.M. Combined heat and power dispatching strategy considering heat storage characteristics of heating network and thermal inertia in heating area. Power Syst. Technol. 2018, 42, 1378–1384. (In Chinese) [Google Scholar]
  17. Dong, Y.T.; Wang, Y.S.; Ni, C.B.; Yi, J.B. Dispatch of a combined heat-power system considering elasticity with thermal comfort. Power Syst. Prot. Control. 2021, 49, 26–34. (In Chinese) [Google Scholar]
  18. Yuan, J.J.; Huang, K.; Han, Z.; Zhou, Z.H.; Lu, S.L. A new feedback predictive model for improving the operation efficiency of heating station based on indoor temperature. Energy 2021, 222, 119961. [Google Scholar] [CrossRef]
  19. Xu, F.; Hao, L.; Chen, L.; Chen, Q.; Wei, M.S.; Min, Y. Discussions on the real potential of district heating networks in improving wind power accommodation with temperature feedback as one consideration. Energy Convers. Manag. 2021, 250, 114907. [Google Scholar] [CrossRef]
  20. Li, Z.G.; Wu, W.C.; Wang, J.H.; Zhang, B.M.; Zheng, T.Y. Transmission-constrained unit commitment considering combined electricity and district heating networks. IEEE Trans. Sustain. Energy 2016, 7, 480–492. [Google Scholar] [CrossRef]
  21. Lund, H. Large-scale integration of wind power into different energy systems energy system. Energy 2005, 30, 2402–2412. [Google Scholar] [CrossRef]
  22. Li, Y.; Wang, C.L.; Li, G.Q.; Wang, J.L.; Zhao, D.B.; Chen, C. Improving operational flexibility of integrated energy system with uncertain renewable generations considering thermal inertia of buildings. Energy Convers. Manag. 2020, 207, 112526. [Google Scholar] [CrossRef]
  23. Guelpa, E.; Sciacovelli, A.; Verda, V. Thermo-fluid dynamic model of large district heating networks for the analysis of primary energy savings. Energy 2019, 184, 34–44. [Google Scholar] [CrossRef]
  24. Hao, L.; Wei, M.S.; Xu, F.; Yang, X.C.; Meng, J.; Song, P.P.; Min, Y. Study of operation strategies for integrating ice-storage district cooling systems into power dispatch for large-scale hydropower utilization. Appl. Energy 2020, 261, 114477. [Google Scholar] [CrossRef]
  25. Ghilardi LM, P.; Castelli, A.F.; Moretti, L.; Morini, M.; Martelli, E. Co-optimization of multi-energy system operation, district heating/cooling network and thermal comfort management for buildings. Appl. Energy 2021, 302, 117480. [Google Scholar] [CrossRef]
  26. Wirtz, M.; Neumaier, L.; Remmen, P.; Müller, D. Temperature control in 5th generation district heating and cooling networks: An MILP-based operation optimization. Appl. Energy 2021, 288, 116608. [Google Scholar] [CrossRef]
  27. Lin, Z.R.; Zhu, X.D.; Wang, S.X.; Gao, L.X.; Yu, Y.; Wang, S.M. Optimal scheduling of electric-thermal integrated energy system considering dynamic characteristics of heating network and carbon trading. Proc. CSU-EPSA 2022, 34, 64–70. (In Chinese) [Google Scholar]
  28. ISO 7730; Ergonomics of the Thermal Environment—Analytical Determination and Interpretation of Thermal Comfort Using Calculation of the PMV and PPD Indices and Local Thermal Comfort Criteria. ISO: Geneve, Switzerland, 2005.
Figure 1. Diagram of cooling network and operation regulation.
Processes 11 02787 g001
Figure 2. Schematic diagram of an electric-cooling integrated energy system.
Processes 11 02787 g002
Figure 3. Optimal dispatching results of power generation.
Processes 11 02787 g003
Figure 4. Optimal dispatching results of district cooling system.
Processes 11 02787 g004
Figure 5. Comparison of hydropower actual outputs and forecasted values.
Processes 11 02787 g005
Figure 6. Indoor temperature and PMV variations with time.
Processes 11 02787 g006
Figure 7. Pipeline inlet temperature variation with time.
Processes 11 02787 g007
Figure 8. System costs variations with time.
Processes 11 02787 g008
Table 1. Characteristic parameters of condensing units.
s1s2s3
Minimum power generation capacity/MW150175175
Maximum power generation capacity/MW300350350
Coal consumption fitting parameter a00.0001710.0000720.000072
Coal consumption fitting parameter a10.27050.22920.2292
Coal consumption fitting parameter a211.53714.61814.618
Maximum up-regulation power/(MW/h)507070
Maximum down-regulation power/(MW/h)307070
Table 2. Electrical load, cooling load, hydropower forecast output, and outdoor air temperature.
Time IntervalElectric Load/MWCooling Load/MWHydropower Forecast Output/MWOutdoor Air Temperature/°C
1 (0:00–1:00)624272.640529.1
2 (1:00–2:00)655.2212.640528.9
3 (2:00–3:00)702201.940528.6
4 (3:00–4:00)717.6194.740528.4
5 (4:00–5:00)733.2194.740528.4
6 (5:00–6:00)748.8205.4940528.7
7 (6:00–7:00)764.4234.130629.5
8 (7:00–8:00)873.6269.8319.530.5
9 (8:00–9:00)967.2254.55321.7531.5
10 (9:00–10:00)1185.653.9325.3532.3
11 (10:00–11:00)117082.5310.0533.1
12 (11:00–12:00)1170107.6301.533.8
13 (12:00–13:00)1185.6125.531534.3
14 (13:00–14:00)1185.6136.2330.7534.6
15 (14:00–15:00)1170132.6332.134.5
16 (15:00–16:00)1170114.7313.6534
17 (16:00–17:00)1014107.6317.733.8
18 (17:00–18:00)101482.5323.533.1
19 (18:00–19:00)842.494.4324.932.2
20 (19:00–20:00)842.4107.840531.3
21 (20:00–21:00)748.8150.340530.7
22 (21:00–22:00)686.4163.640530.2
23 (22:00–23:00)655.2244.840529.8
24 (23:00–24:00)624237.640529.6
Table 3. Economics of two conditions.
Carbon Trading Cost/104CNYAbandoned Hydropower Rate/%Coal Consumption Cost/104CNYTotal Cost/104CNY
Case 152.9611.03497.29566.71
Case 245.417.37475.06536.36
Disclaimer/Publisher’s Note: The statements, opinions and data contained in all publications are solely those of the individual author(s) and contributor(s) and not of MDPI and/or the editor(s). MDPI and/or the editor(s) disclaim responsibility for any injury to people or property resulting from any ideas, methods, instructions or products referred to in the content.

