Article

Integral Effects of Porosity, Permeability, and Wettability on Oil–Water Displacement in Low-Permeability Sandstone Reservoirs—Insights from X-ray CT-Monitored Core Flooding Experiments

1
PetroChina Research Institute of Petroleum Exploration & Development, Beijing 100083, China
2
School of Geosciences, China University of Petroleum (East China), Qingdao 266580, China
3
Qingdao National Laboratory for Marine Science and Technology, Qingdao 266071, China
4
No. 1 Gas Production Plant of Changqing Oilfield Company, Xi’an 710075, China
5
Petroleum Exploration Division, PetroChina Qinghai Oil Field Company, Dunhuang 736202, China
6
Research Institute of Exploration and Development, Changqing Oilfield Company, Xi’an 710075, China
7
National Research Center for Geoanalysis, Beijing 100037, China
*
Author to whom correspondence should be addressed.
Processes 2023, 11(9), 2786; https://doi.org/10.3390/pr11092786
Submission received: 22 July 2023 / Revised: 19 August 2023 / Accepted: 23 August 2023 / Published: 18 September 2023
(This article belongs to the Section Energy Systems)

Abstract

:
Porosity, permeability, and wettability are crucial factors that affect the oil–water displacement process in reservoirs. Under subsurface conditions, the integral effects of these factors are extremely difficult to document. In this paper, waterflooding experiments were carried out using a core flooding system monitored with X-ray dual-energy CT. The mesoscale, three-dimensional characteristics of water displacing oil were obtained in real time. The integral effects of porosity, permeability, and wettability on the waterflooding in the low-permeability sandstone reservoirs were investigated. It was found that if the reservoir rock is water-wet, then the residual oil saturation decreases gradually with increasing porosity and permeability, showing an increasing waterflooding efficiency. On the contrary, if the reservoir rock is oil-wet, the residual oil saturation gradually increases with improving porosity and permeability, showing a decreasing waterflooding efficiency. The porosity, permeability, and wettability characteristics of reservoirs should be comprehensively evaluated before adopting technical countermeasures of waterflooding or wettability modification during oilfield development. If the porosity and permeability of the reservoir are high, water-wet reservoirs can be directly developed with waterflooding. However, it is better to make wettability modifications first before the waterflooding for oil-wet reservoirs. If the porosity and permeability of the reservoir are poor, direct waterflooding development has a better effect on oil-wet reservoirs compared with the water-wet reservoirs.

1. Introduction

Porosity, permeability, and wettability are the basic properties of reservoir rocks. Porosity reflects the ability of the reservoir to store fluid, and permeability reflects the ability of fluid to pass through the reservoir [1]. For sandstone reservoirs without fractures, porosity and permeability generally have a good correlation. Wettability refers to the tendency of a one-phase fluid to spread or adhere to a solid surface when two immiscible fluids co-exist on the solid surface [2].
Porosity, permeability, and wettability can strongly affect the distribution characteristics, displacement process, and relative permeability of oil and water in a reservoir [3,4]. Ghous et al. found that there was a strong correlation between the saturation of the wet-phase fluid and the pore size of the reservoir based on displacement experiments and three-dimensional micro-CT scanning technology [5]. Through microscopic numerical simulation experiments, Liu et al. realized that the pore structure of the core would change the front shape of the waterflooding gas, and the residual gas saturation decreased with the increasing waterflooding-gas efficiency as the porosity and permeability increased [6]. Gu et al. found that the connected pore throats and spontaneous imbibition recovery rate increased with an increasing rock matrix permeability based on physical simulation experiments in weakly water-wet, tight sandstone [4]. In terms of the wettability, for uniformly wetting pore media, the wet-phase fluid usually migrates along the particle surface, and then small pores in a film-like form, while the non-wet-phase fluid preferentially moves in a continuous phase in the relatively large pores [7]. As the wettability of the reservoir gradually changes to the direction of the displacement-phase fluid within the limited range, the displacement pattern becomes more complete and the displacement efficiency becomes higher [8]. Compared with uniformly wetting pore media, oil–water displacement in mixed wetting media is characterized by poor continuity and by occurring in more small pores of oil and water, as well as having a lower relative fluid permeability [9,10]. Many studies have been performed with regard to the effects of porosity, permeability, and wettability on the displacement process of oil and water in reservoirs. However, insights about the combined effects of these properties on the displacement process of fluids in the subsurface reservoir are lacking.
The lithology, texture, structure, porosity, and permeability of reservoirs are highly heterogeneous at different scales and are controlled by factors such as sedimentation, diagenesis, and structural evolution [11,12,13,14,15]. The relatively homogeneous reservoirs at one scale usually appear to be heterogeneous at another (higher) scale [16,17,18]. Compared with the numerous studies performed on oil–water displacement at both the macroscopic oilfield scale and the microscopic pore scale [19,20], real-time, three-dimensional experiments on oil–water displacement processes at the mesoscale are relatively rare, which can connect the micro- and macro-level knowledge. The medical X-ray CT scanner is characterized by a large scanning sample range and a fast scanning speed [21,22], and it is able to capture the real-time, three-dimensional imaging of waterflooding processes with an online core flooding system. This paper carried out mesoscale waterflooding experiments using an X-ray CT online core flooding system. Based on the experimental results, the integral effects of porosity, permeability, and wettability on oil–water displacement in low-permeability sandstone reservoirs were determined. The experimental results also provided direction for the development of low-permeability oil reservoirs, especially for deep, heterogeneous ones.

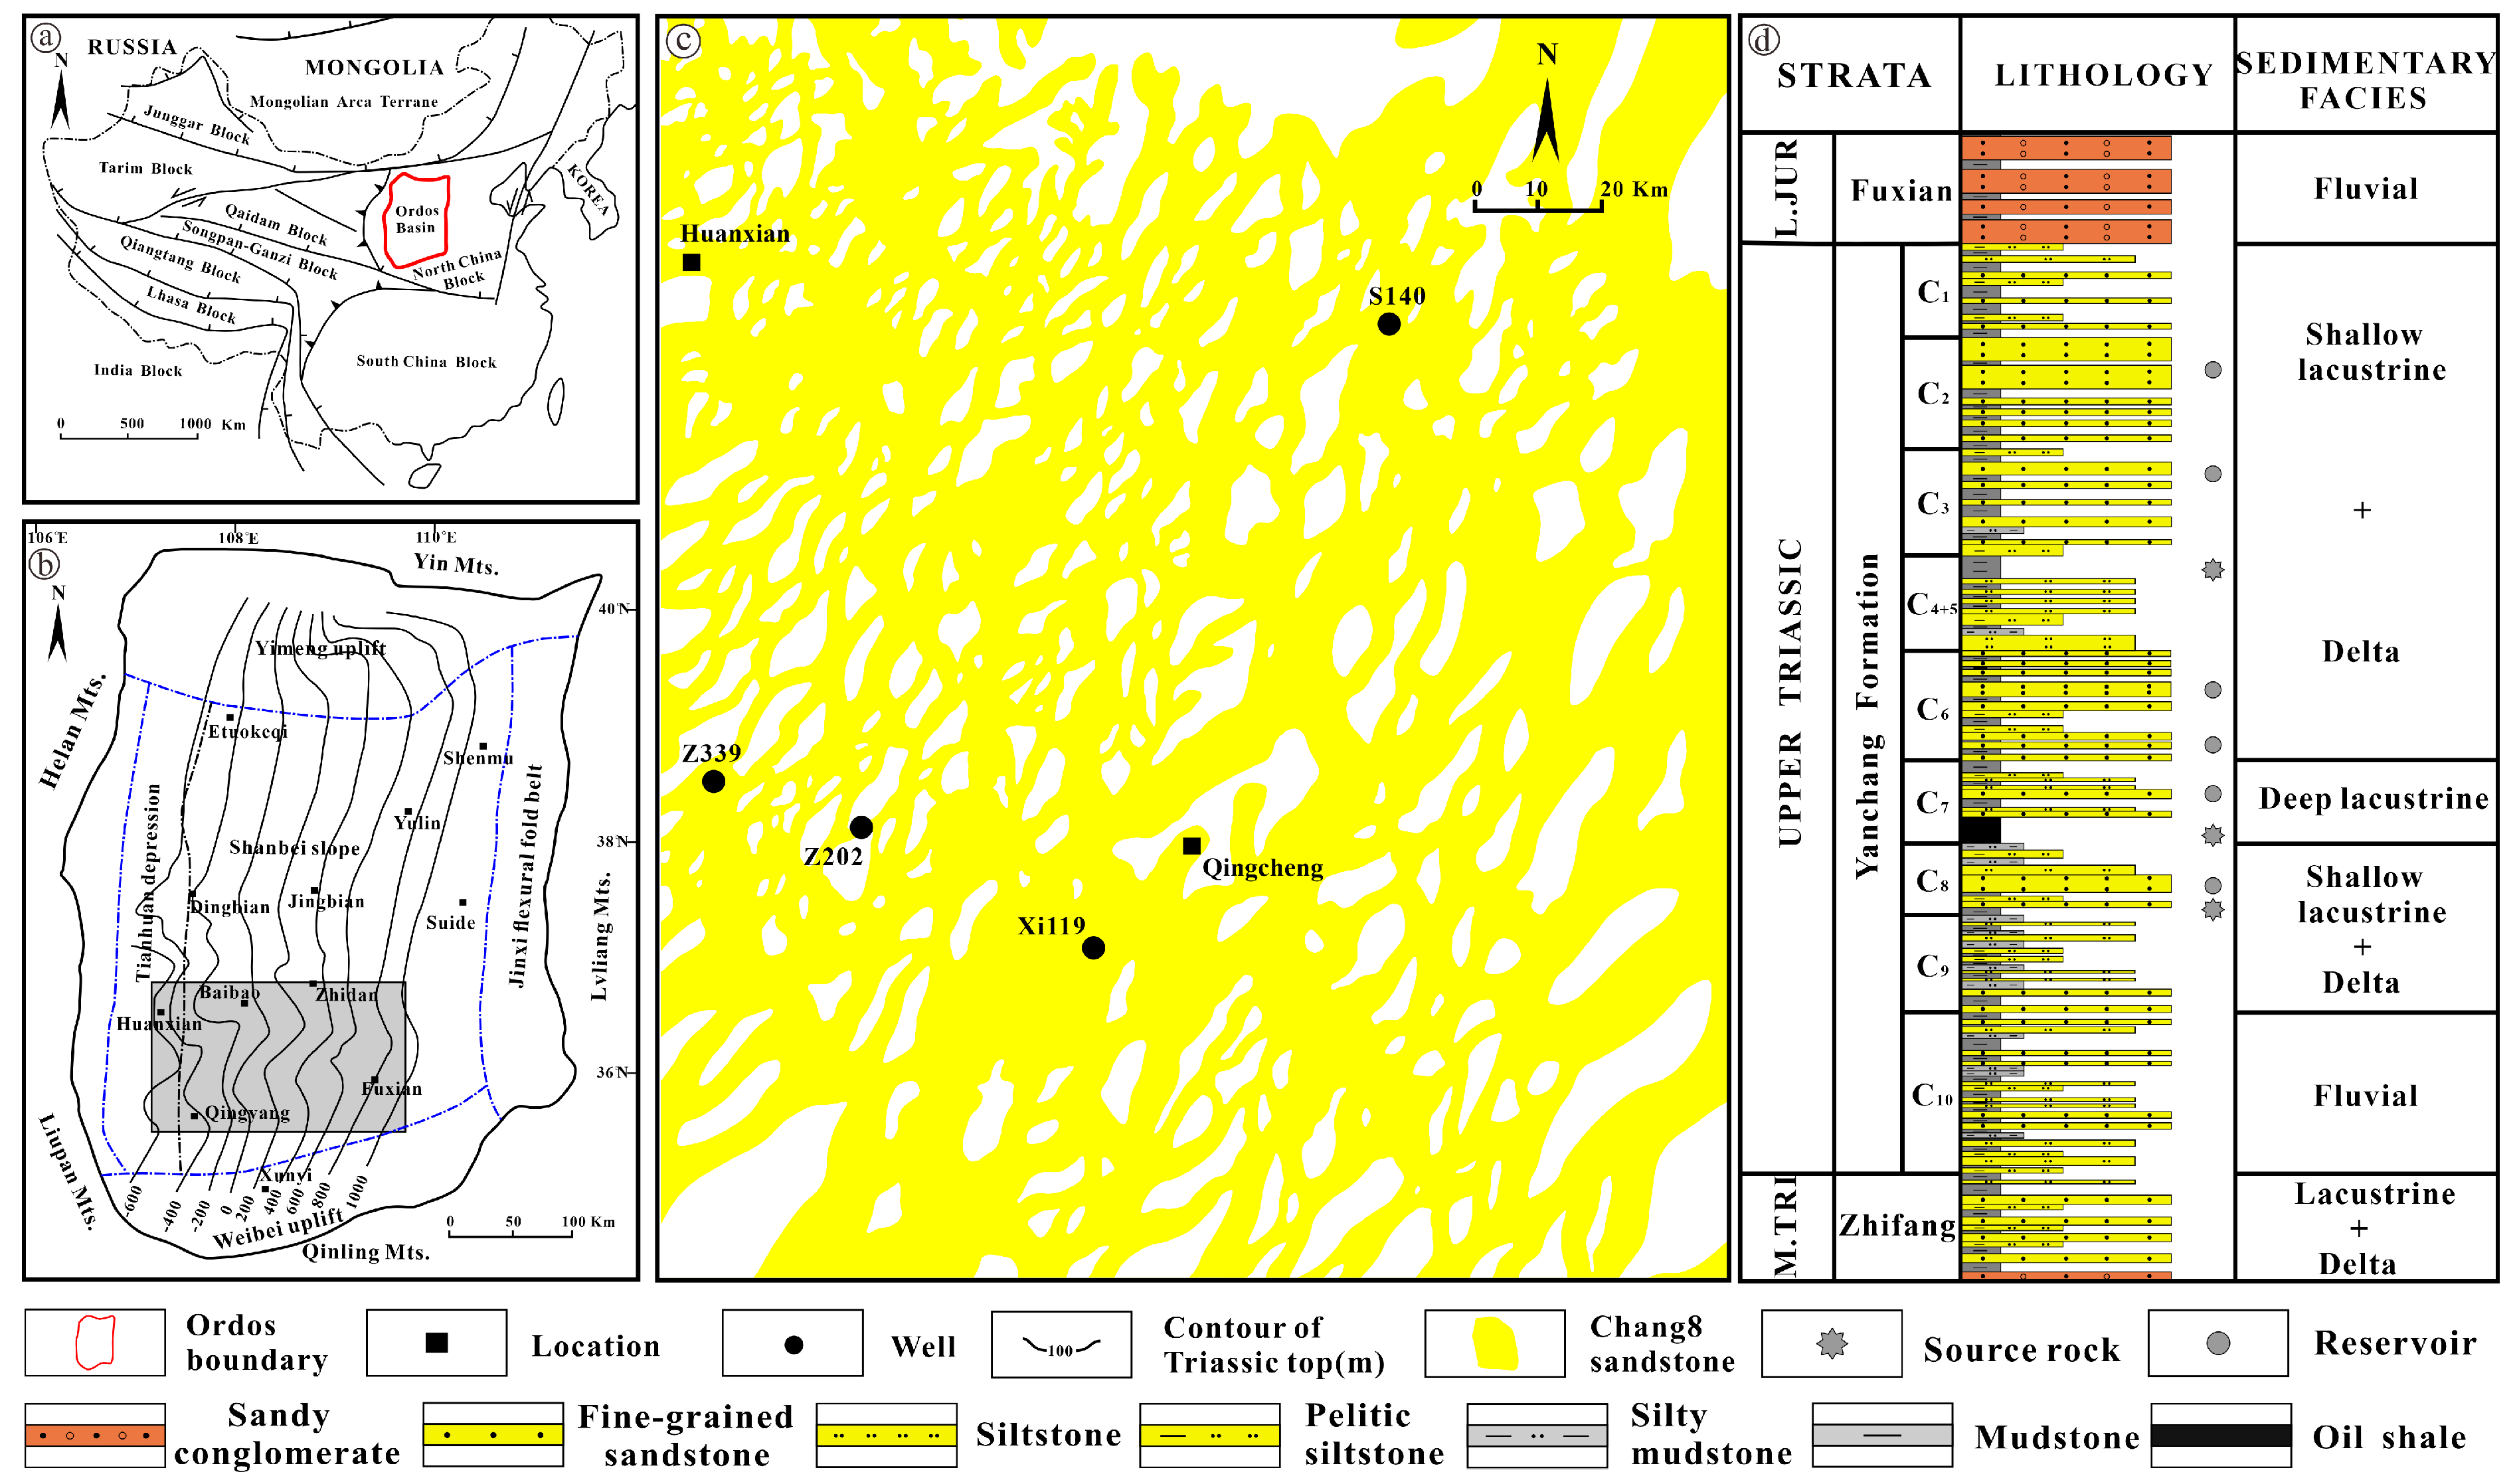
2. Geological Setting

The Ordos Basin is located in the central part of China, which is a stable intracratonic sedimentary basin (Figure 1a,b). The Upper Triassic Yanchang Formation slightly inclines to the west with a dip angle of less than 1°, and this formation is the most important hydrocarbon-bearing strata in the basin. This formation is divided into 10 members, Chang 10 to Chang 1, from bottom to top, consisting of mudstone, oil shale, fine sandstone, and siltstone [23]. The Chang 7 interval is the most important source rock, the next is Chang 9 interval, and Chang 4 + 5 is the third one. There are good reservoirs in the intervals of Chang 2–Chang 3 and Chang 6–Chang 8 (Figure 1c,d). The Chang 8 sandstones are the representative reservoirs deposited in the delta and lacustrine environment, with a distribution direction from southwest to northeast (Figure 1c,d). The petrology is arkose and lithic arkose. The authigenic cements mostly include chlorite, calcite, dolomite, and quartz. The whole reservoir is a representative of the low permeability to tight characteristics, with a porosity range of 6–16% and a permeability range of 0.1–10 × 10−3 μm2 [24]. The commonly present chlorites in the reservoir are mostly found to be oil-wet due to the modification of polar compounds, which results in some of the reservoir to be oil-wet. Therefore, the wettability of reservoirs is various, ranging from oil-wet to water-wet states.

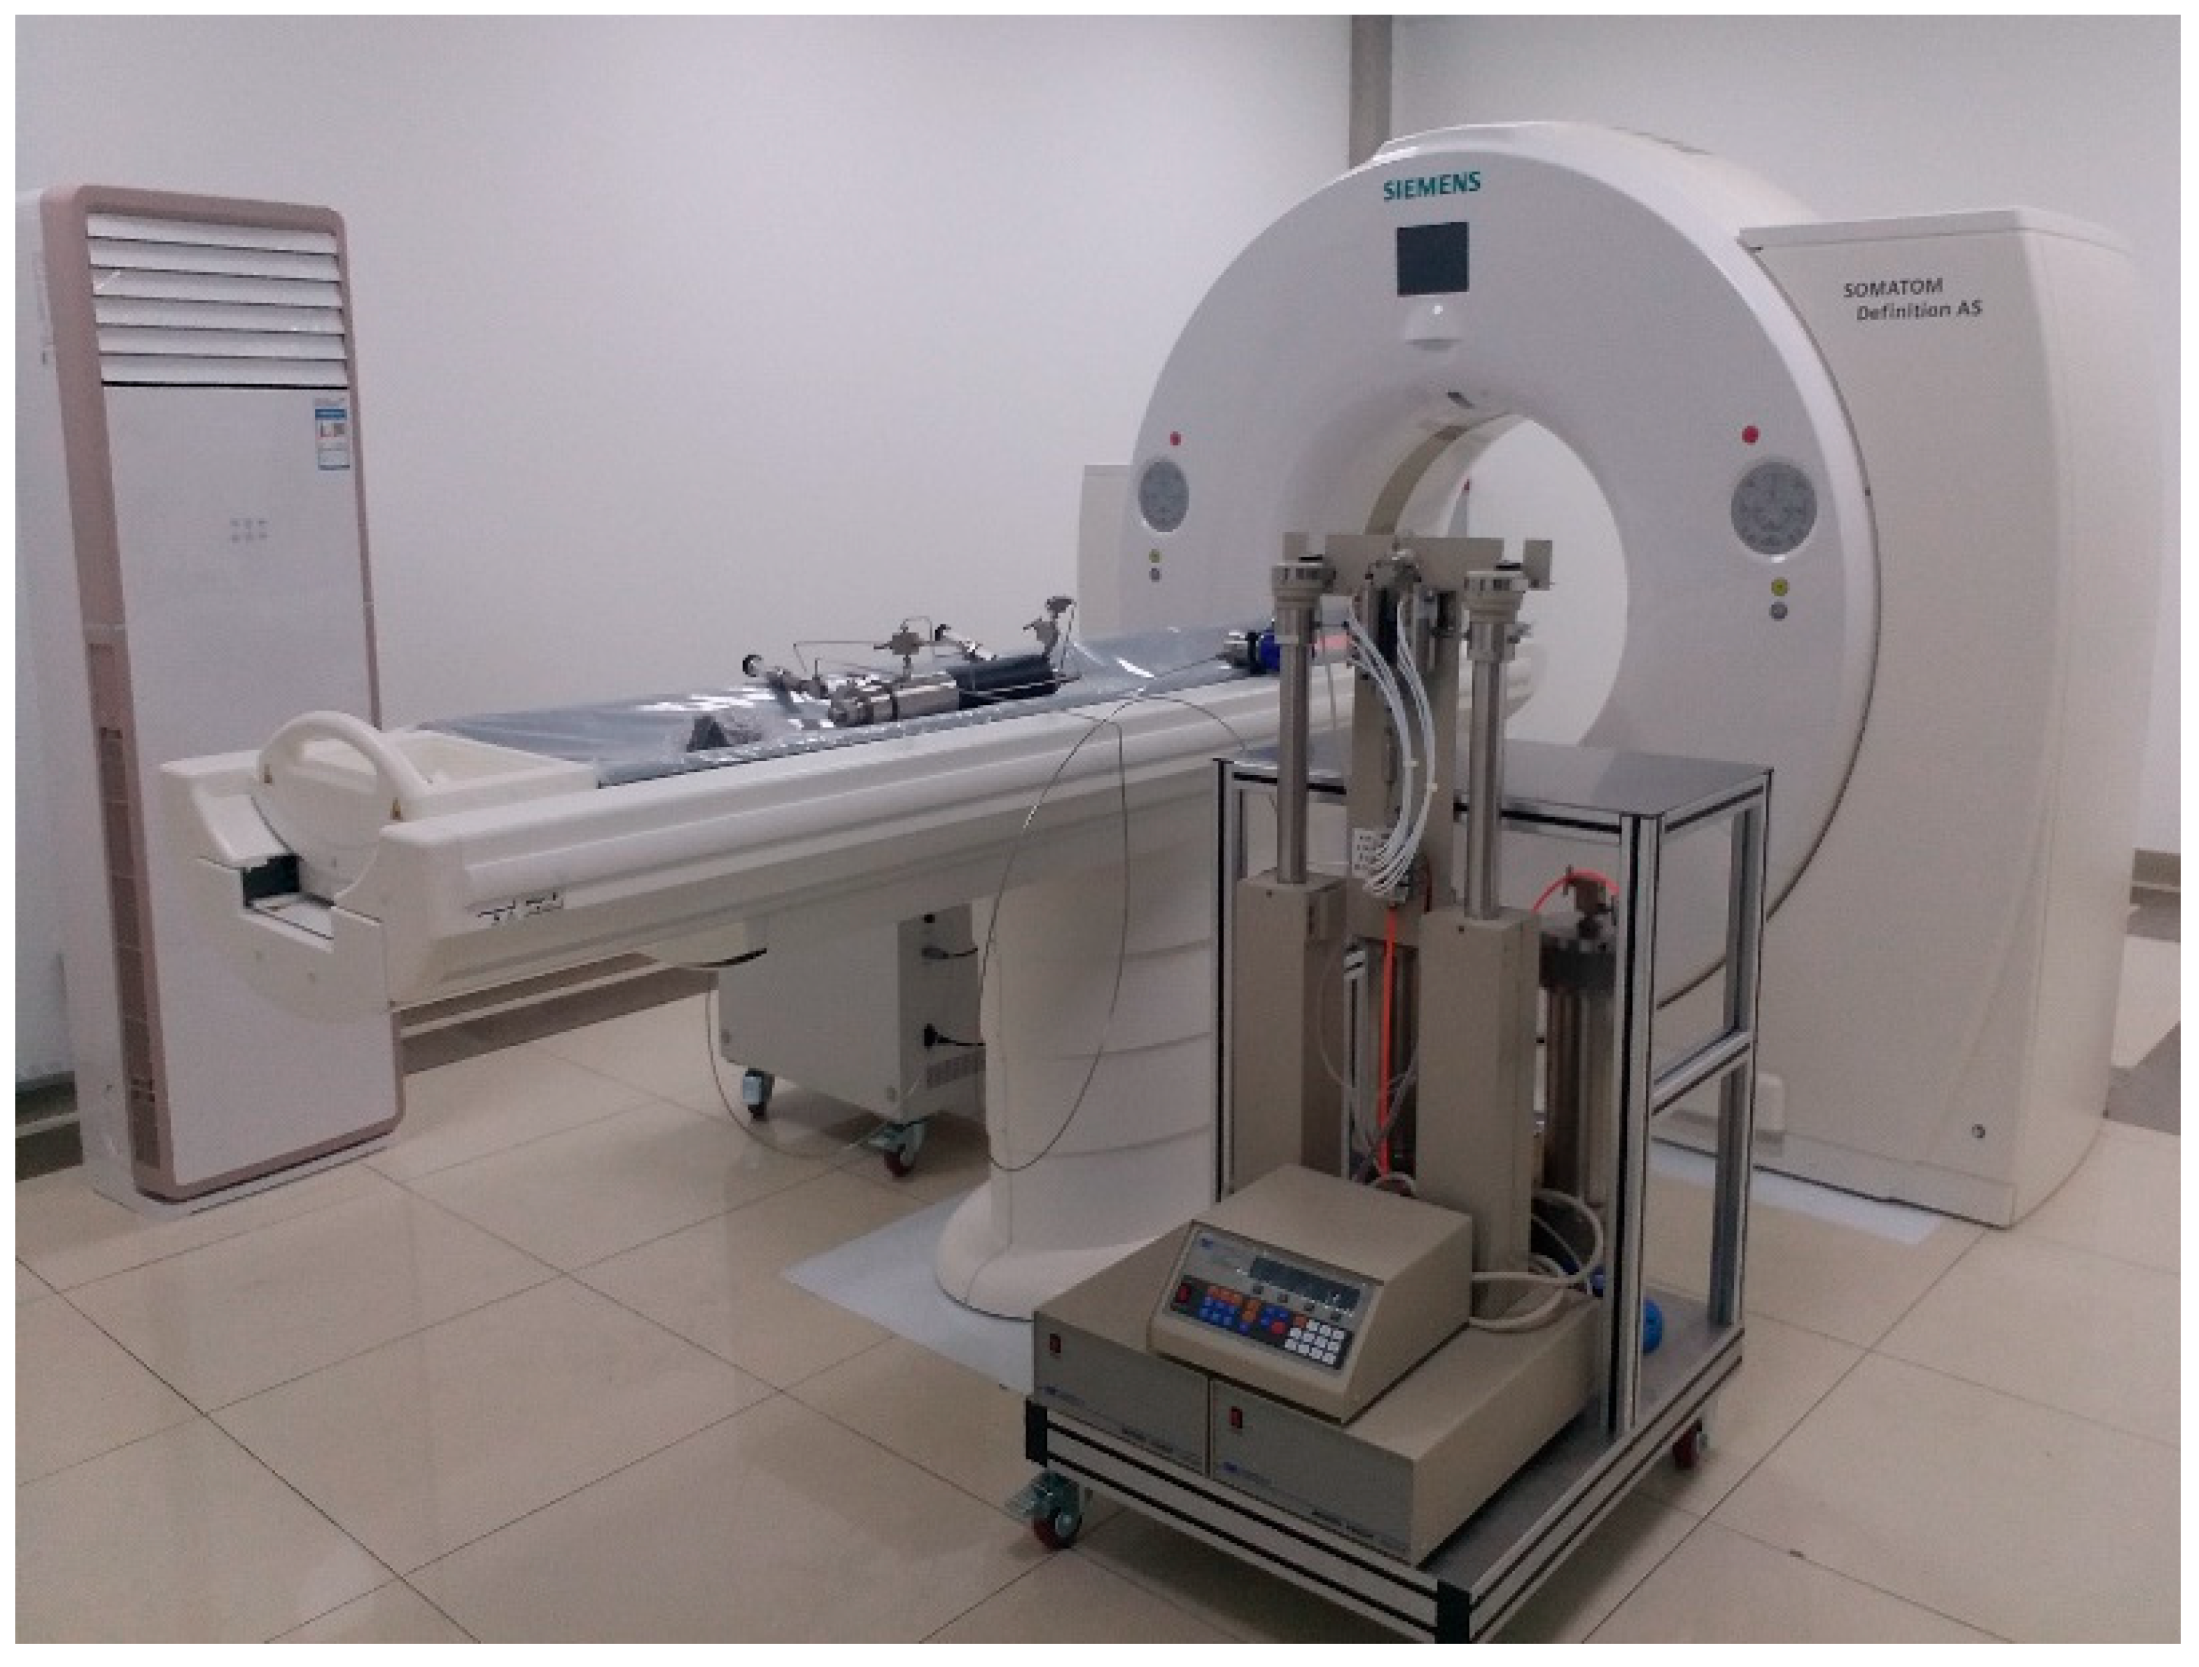
3. Materials and Methods

The studied area is located in the southwest of the Ordos Basin. A total of 6 samples were selected from the 4 wells in the sandstone reservoir of the Chang 8 group in the Ordos Basin, three of which were oil-bearing, while the other three were absent of oil (Figure 1c). Core plug samples with a diameter of about 2.5 cm and lengths of 3–5 cm were drilled. The block samples were also prepared on the oil-bearing rock. The oil-bearing core plug samples associated with the sample chips (about 4 mm × 4 mm × 4 mm) were cleaned to remove oil using a mixture of ethanol and benzene (3:1 in volume). The pore-scale wettability of the rock was determined according to the shapes of the condensed water on the surface of pores in the block sample under an environmental scanning electron microscope according to the precious method [25,26]. The observation under the ESEM was carried on the 3 oil-bearing freshly broken chip samples. Porosity and permeability of all 6 core plug samples were measured via the gas method [27], with data shown in Table 1. All of these 6 samples were then used for the waterflooding experiments.
Morphological observation of the condensed water was conducted using a Quantrr S environmental scanning electron microscopy (ESEM) at Peking University. The core flooding experiment system used at the China University of Petroleum (Huadong) mainly includes pipelines, a back pressure valve, a 260D ISCO pump, and a SOMATOM Definition AS X-ray dual energy CT scanner and an X-ray transparent core holder (Figure 2). The fluid used in the oil–water displacement experiments include No. 2 white oil (with a kinematic viscosity of 2 mPa·s at 40 °C), deionized water (used as the confining pressure fluid in the core holder), and 23% wt NaI aqueous solution. In order to mimic the pore fluid pressure in the subsurface conditions, the back pressure was set to 15 MPa at the downstream pipeline. The confining pressure was set to be 2 MPa higher than the pore fluid pressure during the core flooding experiments. The experiments were carried out at room temperature (about 24 °C), and the white oil used had a similar viscosity with crude oil subsurface.
The core flooding experimental procedure is as follows:
  • The core plug samples were firstly dried for 24 h at 80 °C.
  • The core plug samples were placed in a rubber core sleeve, then loaded into a composite carbon fiber core holder.
  • The core holder was connected to the core flooding system; the downstream valve was closed while the upstream valve was open, and then vacuuming maintained (−0.1 MPa) from the upstream for 10 h with the confining pressure of 2 MPa.
  • The sample was saturated with white oil through injection from the upstream line at a pressure of 15 MPa with the downstream back pressure valve closed and a confining pressure of 2 MPa higher than injection pressure, holding for 10 h.
  • Then, the downstream back pressure was set to 15 MPa, and the 23% wt NaI aqueous solution was injected into the sample at a constant flow rate of 0.01 mL/min.
  • The CT scans begin when the NaI aqueous solution reached at the top end of the core plug with a frequency of scanning once every 5 min.
  • The experiment was terminated at about 10 h after the NaI aqueous solution flowed out from the downstream outlet.
During the waterflooding experiments, the injection pressure and confining pressure were recorded every 10 s, and the process of waterflooding was intermittently scanned using the X-ray dual-energy CT equipment, with the saturation of oil and water in the rock calculated using the CT numbers. Firstly, the CT numbers of the sample were calculated using the Avizo software. Then, according to the established method by Akin and Kovscek [28], the oil saturation of the core in the waterflooding experiments can be quantitatively calculated, and the formula is as follows:
S o = C T w r C T o w r C T w r C T o r  
where CTwr indicates the CT number of the core saturated with water, CTowr is the CT number of the core containing both oil and water, and CTor is the CT number of the core saturated with oil. It is impossible to measure directly CTwr in the waterflooding experiments. However, they can be calculated using the following formula:
C T w r = C T d r y + C T w   C T a C T o C T a C T w r C T d r y
where CTdry is the CT number of the dry sample, CTo is the CT number of the oil phase, CTw is the CT number of the water phase, and CTa is the CT number of the air.

4. Results

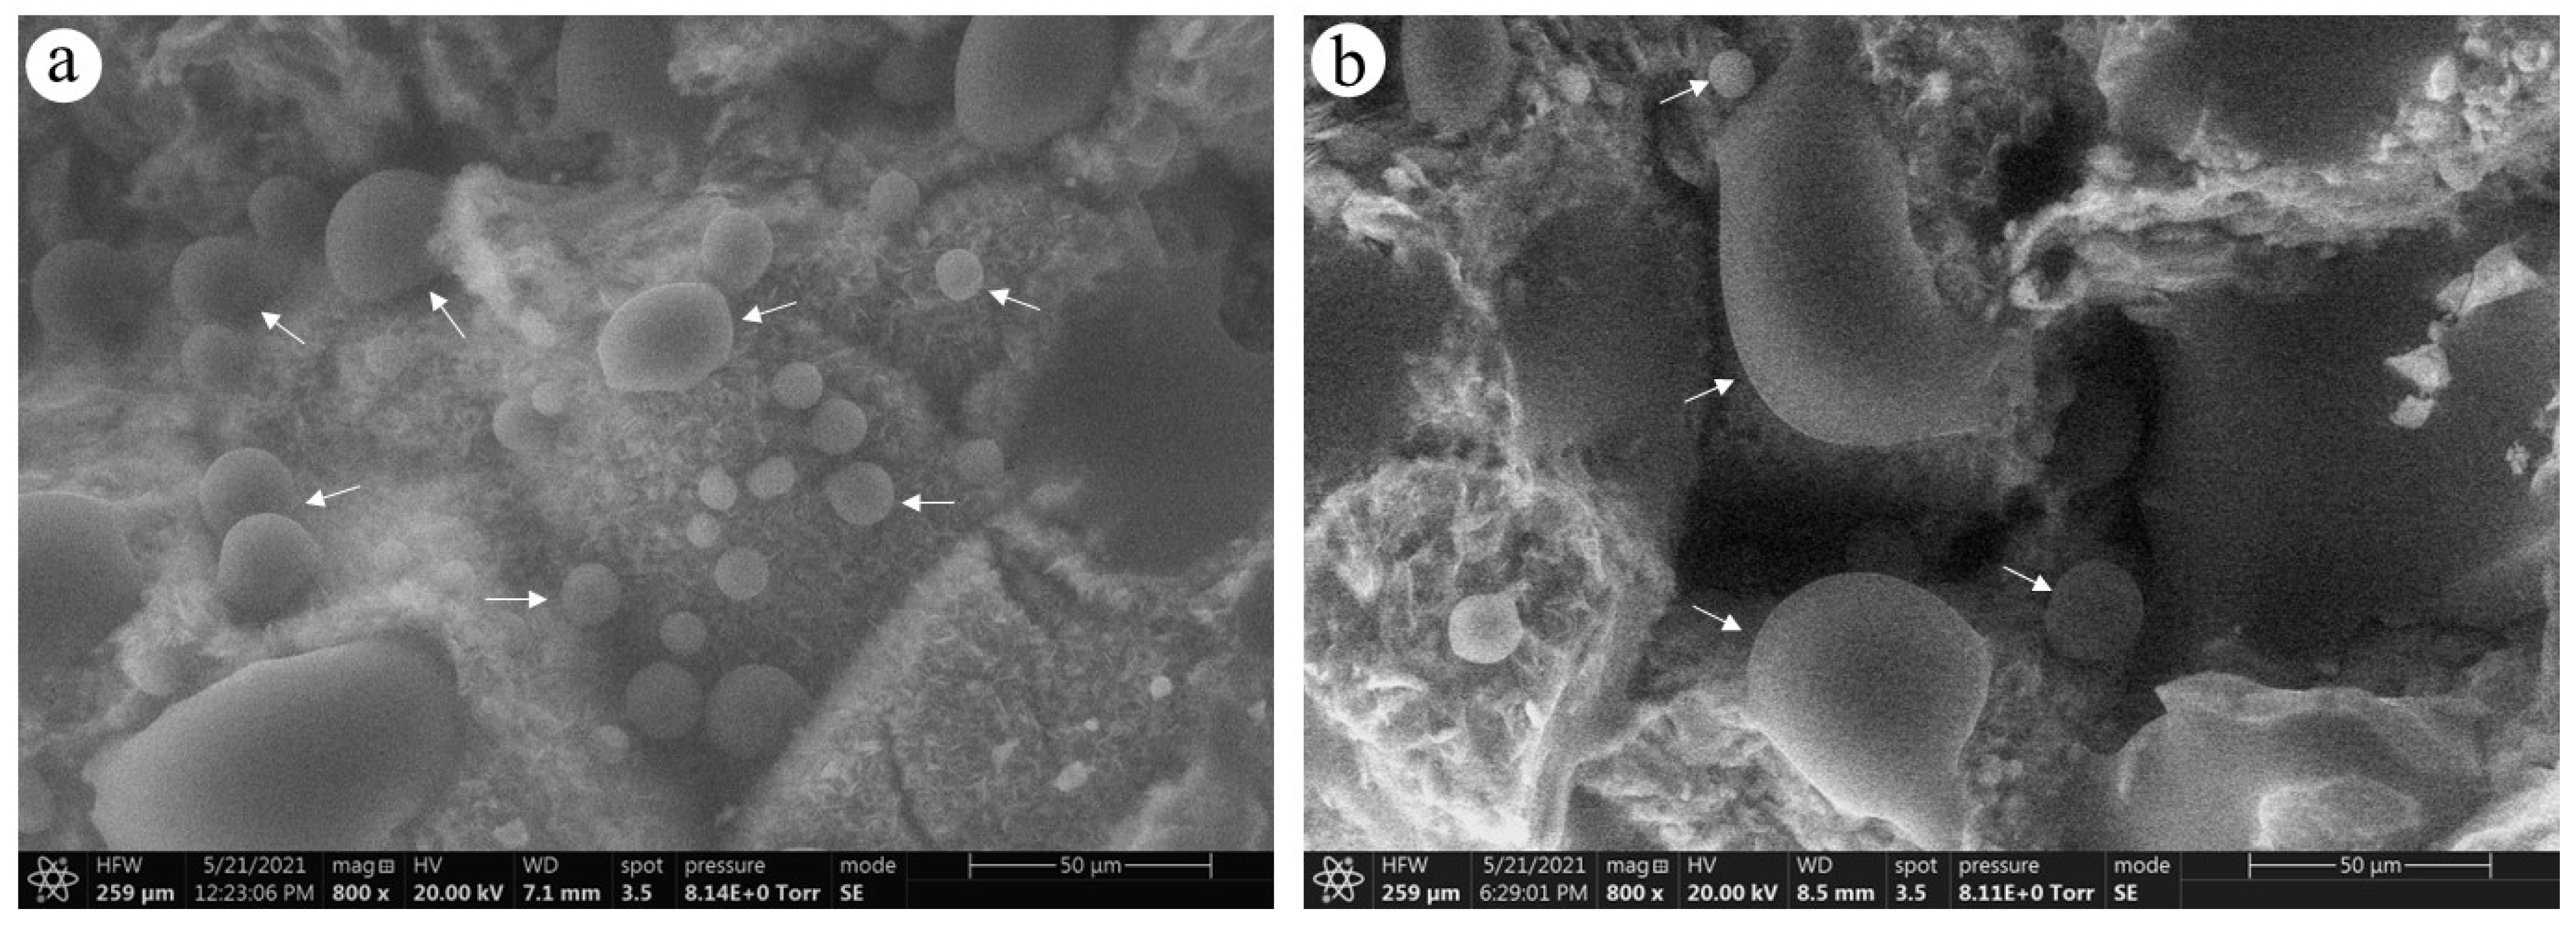
4.1. Porosity, Permeability, and Wettability of Samples

The selected six samples are representative of porosity and permeability characteristics ranging within the entirety of all the Chang 8 reservoirs in the studied area. The porosity ranges from 8.17% to 14.28%, with a median value of 9.37%. The permeability ranges from 0.10 × 10⁻³ μm2 to 1.71 × 10⁻³ μm2, with a median value of 0.26 × 10⁻³ μm2. On the correlation plot of porosity and permeability, all data points are essentially on a line (Figure 3).
The three block samples with oil removed were observed using the ESEM. The condensed water on the pore wall surface was mainly spherical, indicating the oil-wet states of samples 1#, 2#, and 3#. In detail, Figure 4a shows that the authigenic clay minerals covered most of the rock surface as the pore-lining model, and the condensed water on the surface of the clay minerals was spherical. Figure 4b also shows that the spherical water condensed on the pore surface enclosed by several particles. The oil-free samples in the Yanchang Formation reservoir are considered to be water-wet according to Wang et al. [29].
Based on the porosity, permeability, and wettability of the core samples, six samples were used for waterflooding experiments, among which samples 1#, 2#, and 3# were oil-wet, while samples 4#, 5#, and 6# were water-wet.

4.2. Waterflooding Experiments

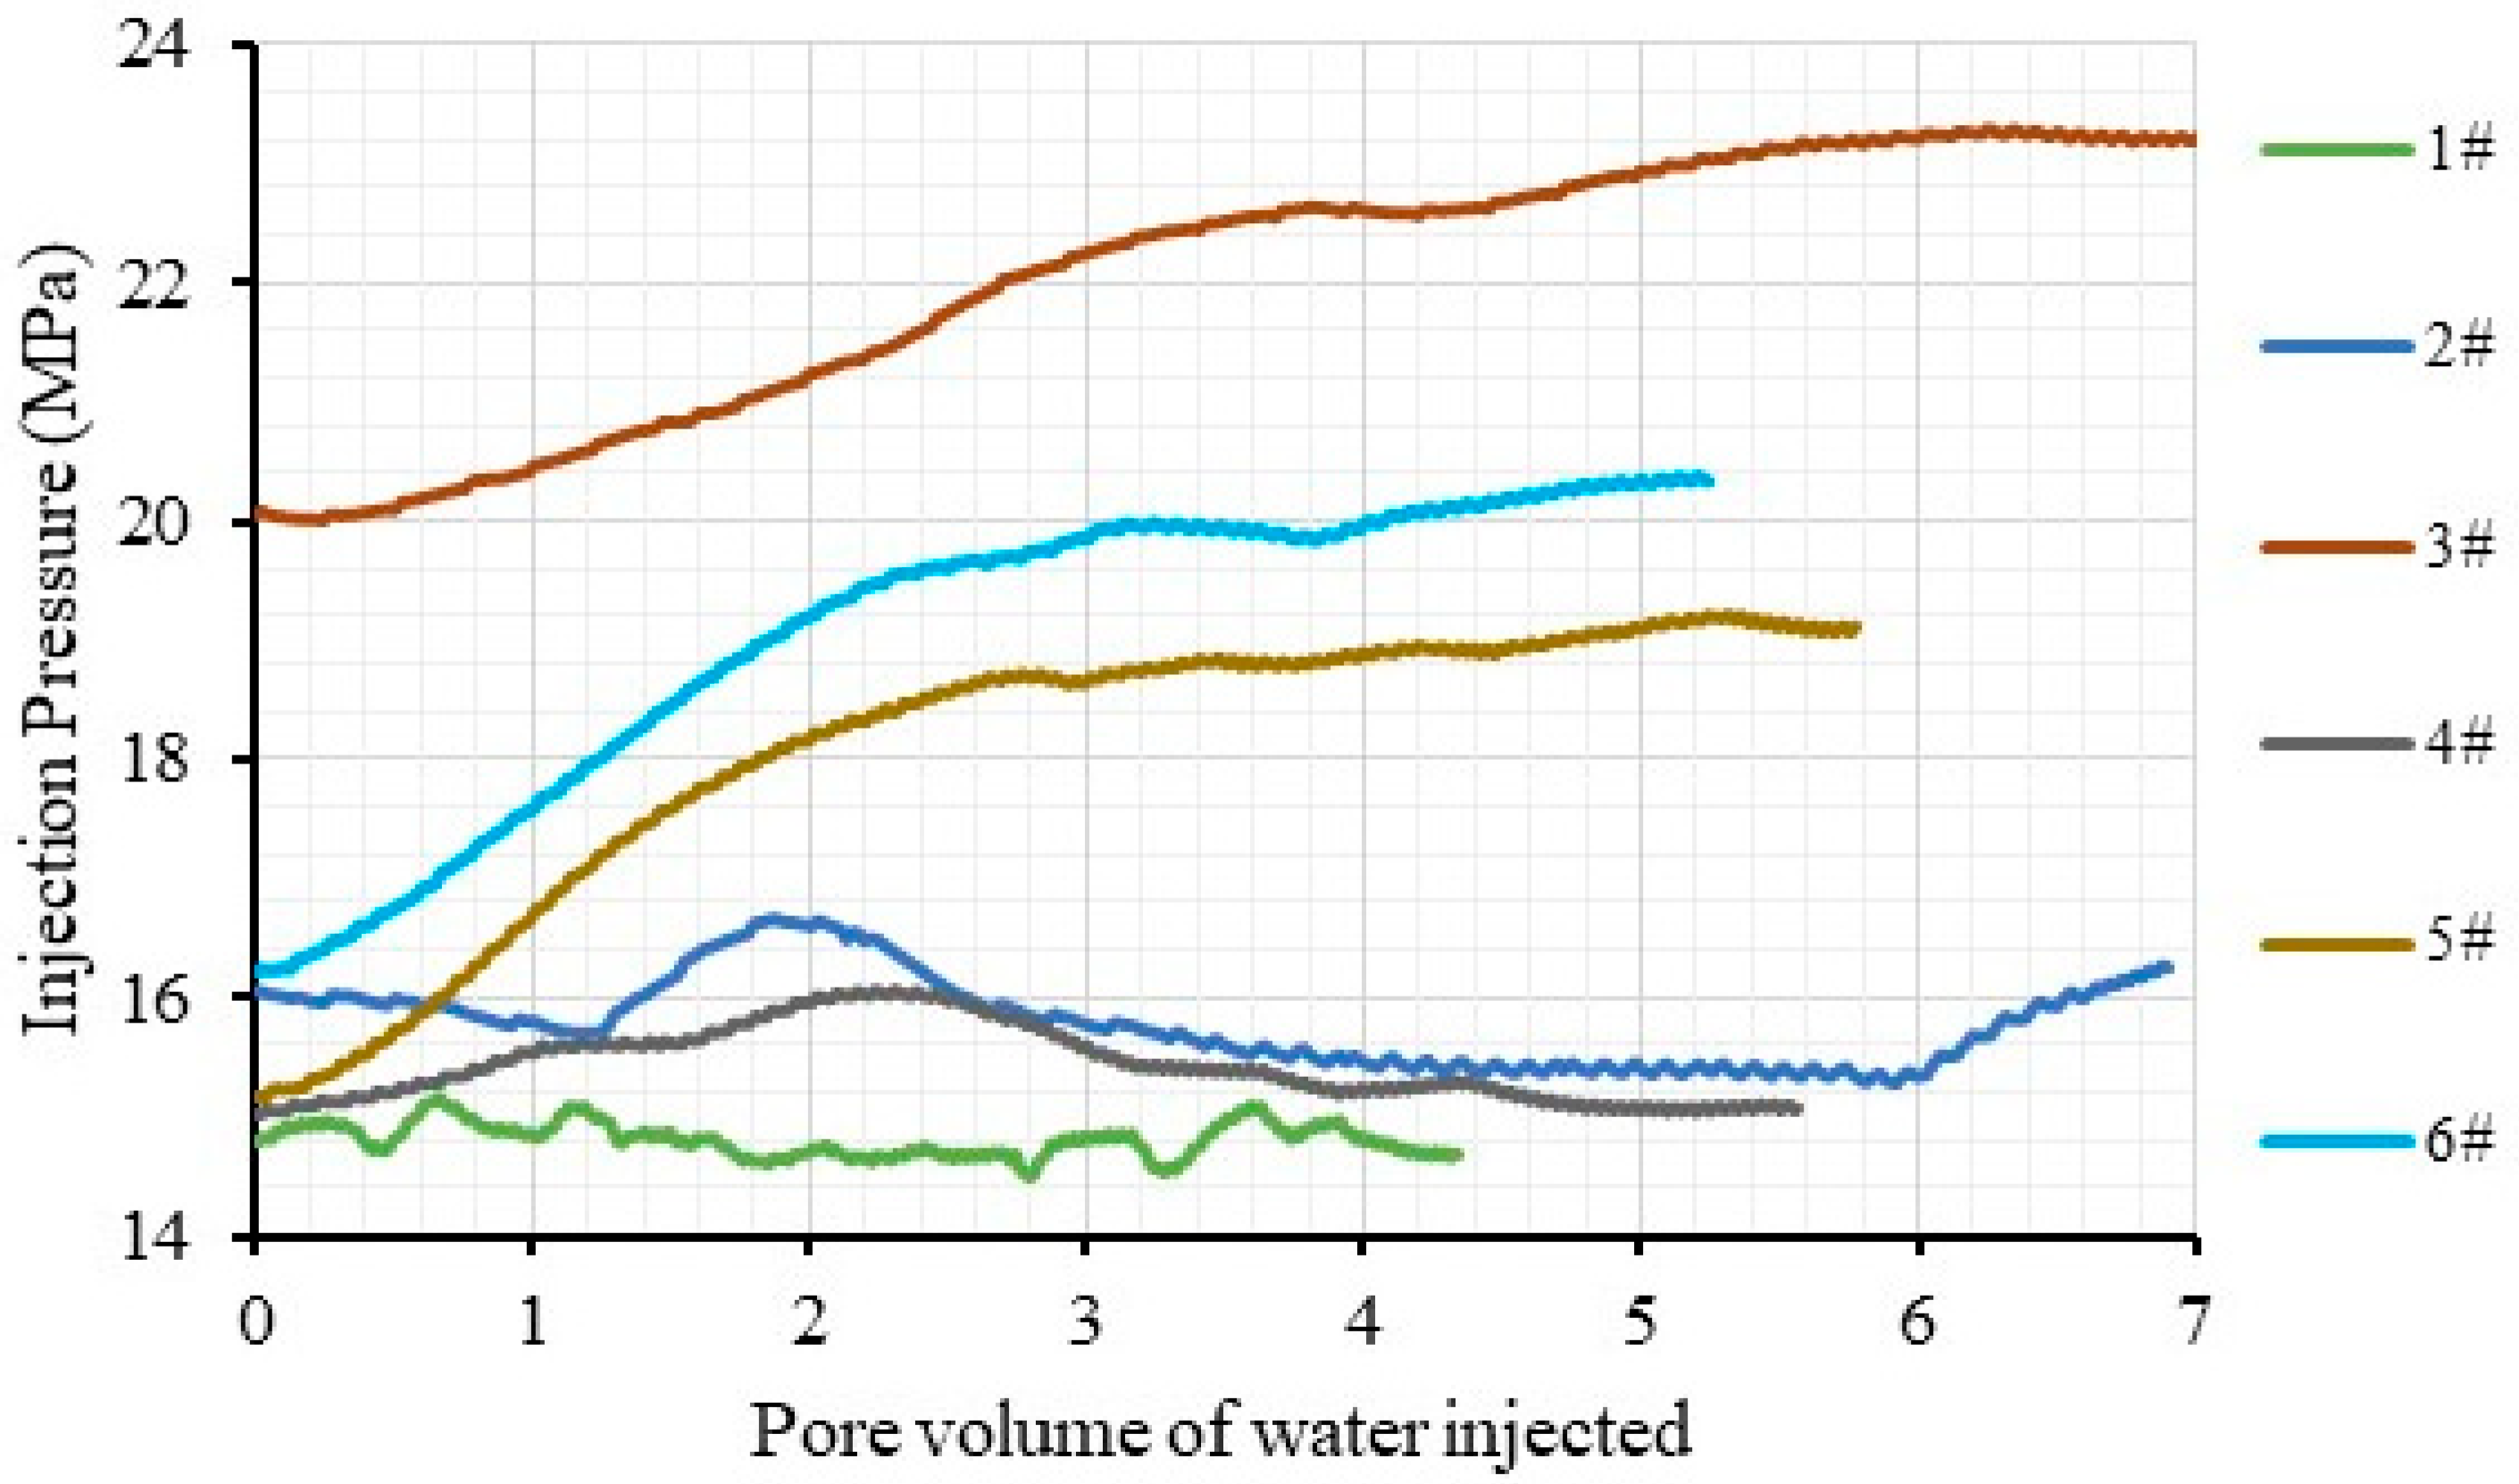
4.2.1. Injection Pressure in Waterflooding Experiments

The downstream back pressure regulator in the experiments was set to about 15 MPa, and the upstream fluid injection pressure of each sample was above this value. In general, when injecting the same volume of fluid, the fluid injection pressures were quite different for these six samples (Figure 5). The curve, such as that seen in samples #3, #5, and #6, mostly shows a rapid increase, and then gradually becomes stable with increasing injected fluid volume. For samples #1, #2, and #4, the injection pressure increases at a relatively small scale, and then appears to be stable or decreased.

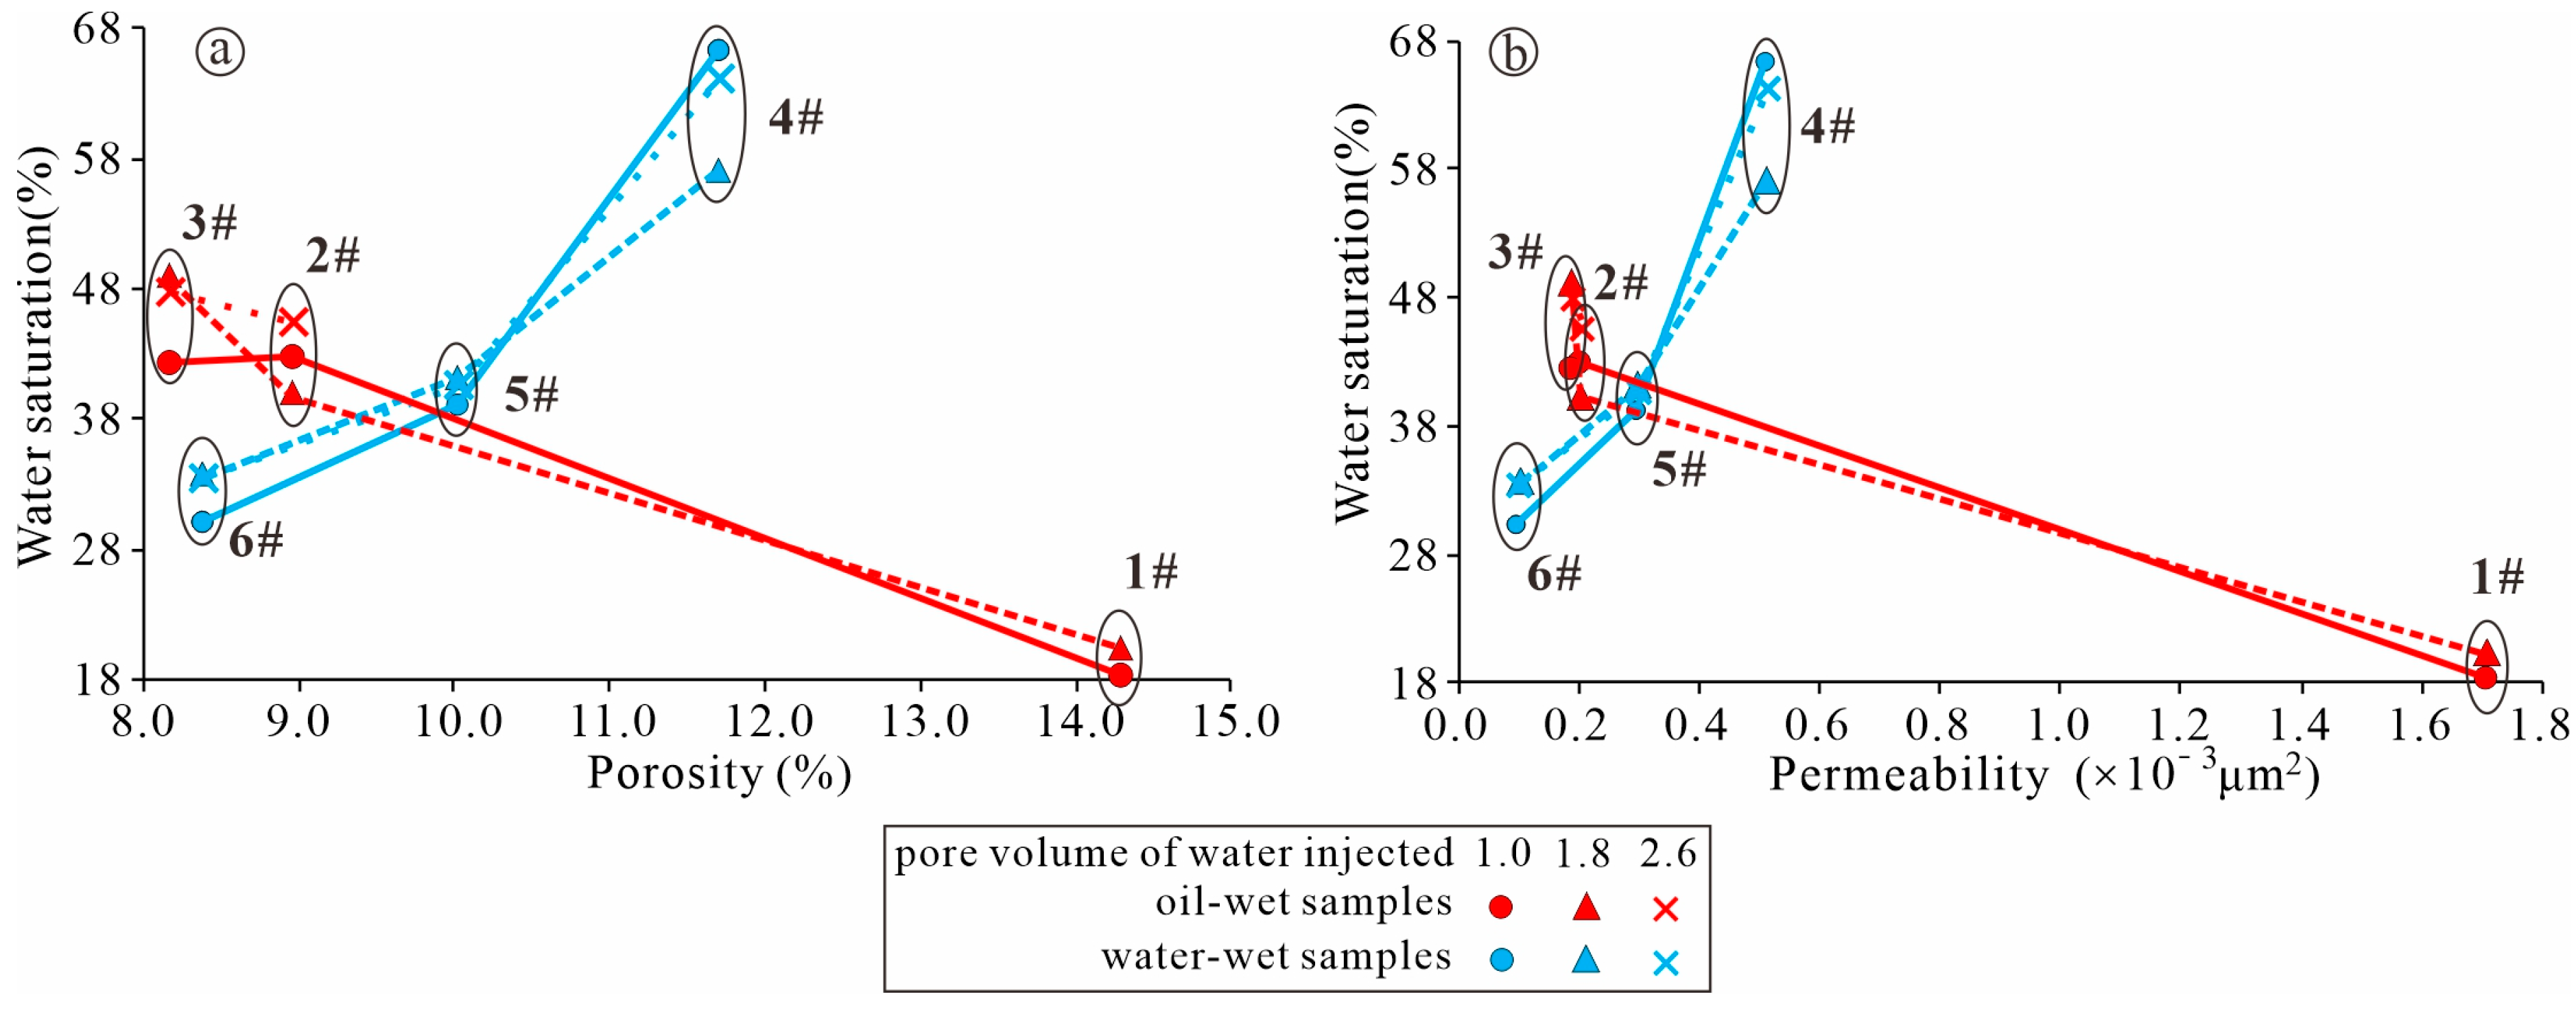
4.2.2. Water Saturation

Figure 6 shows the results of the waterflooding experiment. The plots of water saturation varying with the volume of water injected show a rapid increase in the early stage and a slow increase or even a near-flat trend during the later stage. For the oil-wet samples 1#, 2#, and 3#, the change point of the water saturation curve which is lining the early and later stages appears at an injected water volume of about 0.4 pore volume (pv), 0.4 pv and 0.9 pv, respectively. The final water saturation levels for these three samples are about 20.0% (4.3 pv), 46.5% (6.9 pv), and 55.3% (11.6 pv), respectively. For the water-wet samples 4#, 5#, and 6#, after the overall injected water volume reaches 0.8 pv–1.2 pv, the trend of the water saturation varying with water volume becomes gentle. At the end of the waterflooding experiments, the final water saturation levels of these three samples are about 70.0% (5.6 pv), 39.1% (5.8 pv), and 29.2% (4.3 pv), respectively.

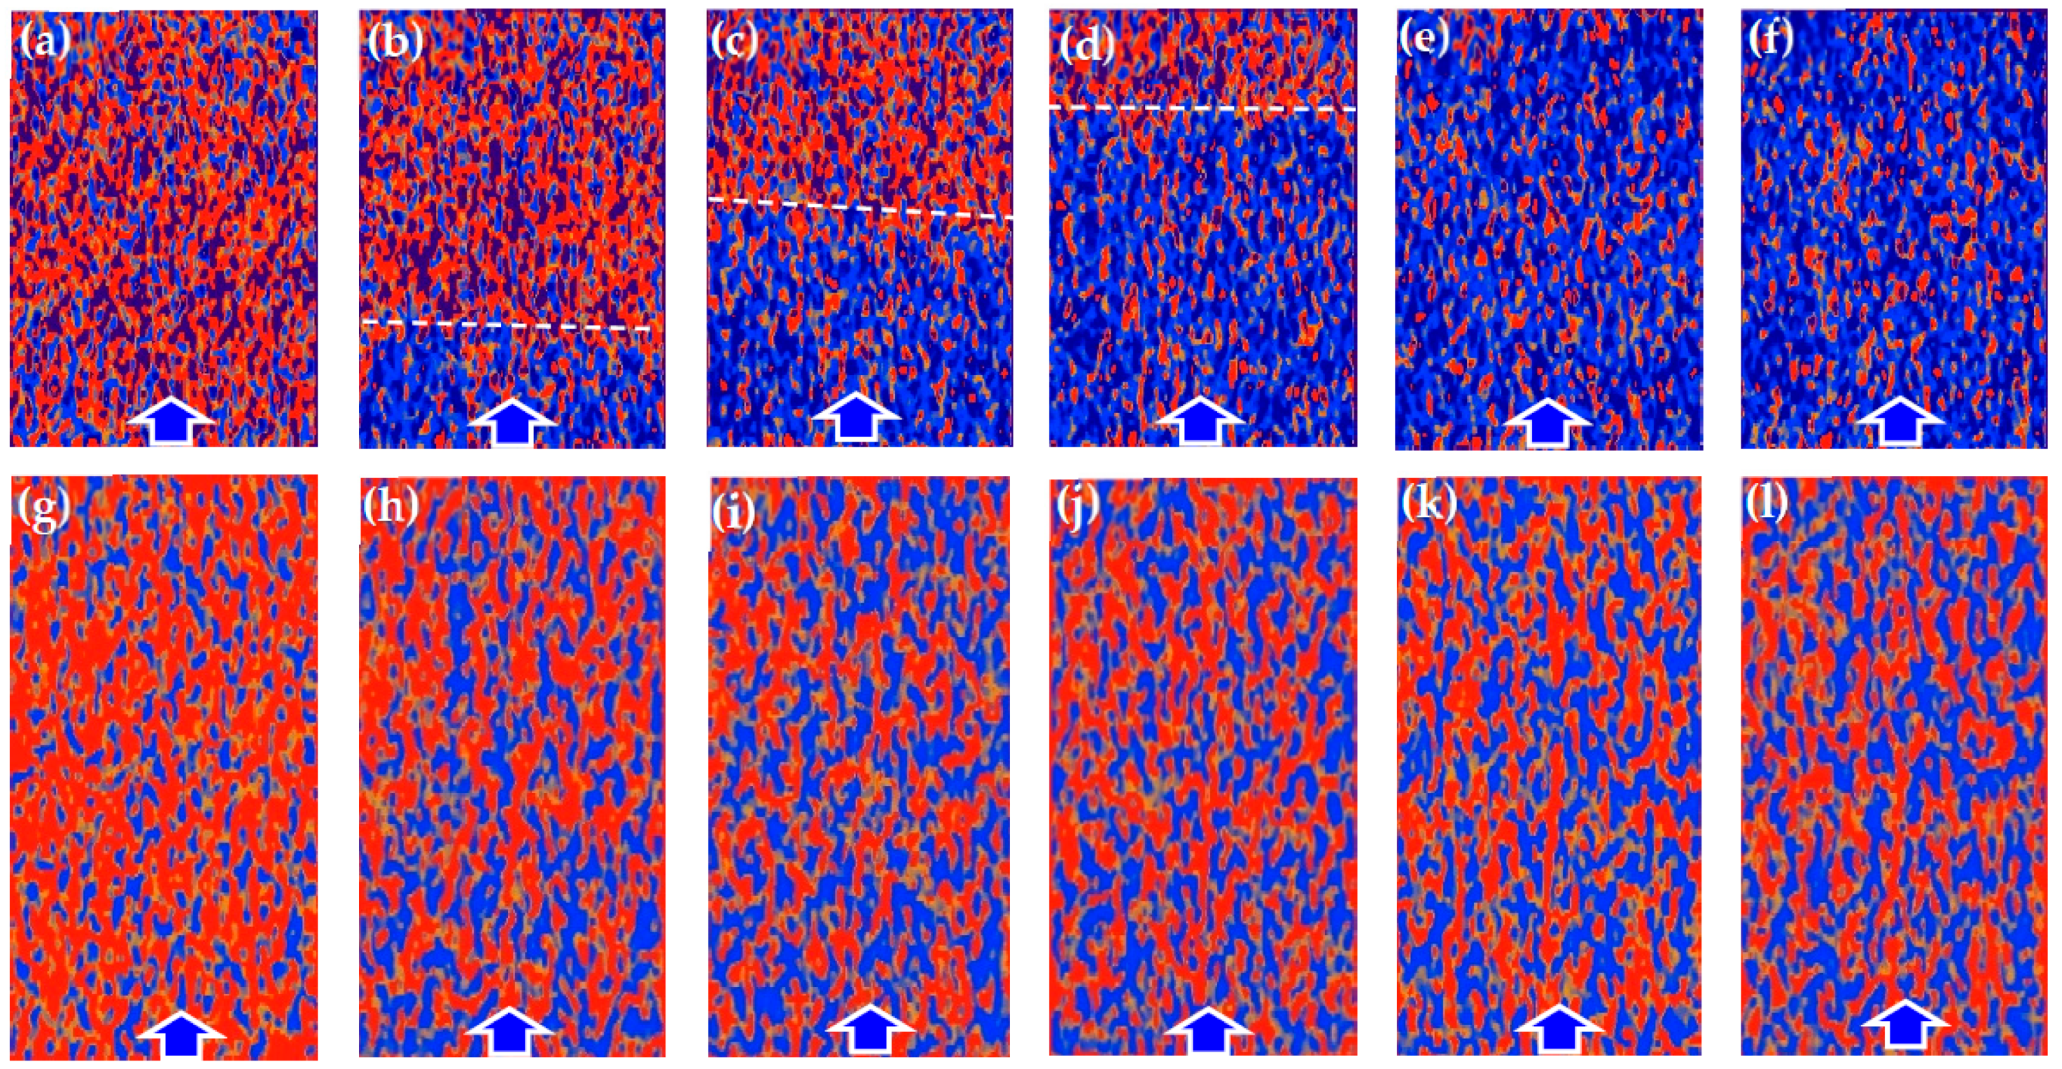
4.2.3. Displacement Patterns

In our study, the CT images of two representative oil-wet and water-wet samples were selected to determine the waterflooding modes. Figure 7a–l show the CT slices of the oil–water distribution in samples 4# and 1# during the waterflooding experiments, respectively. Sample 4# was initially saturated with oil (Figure 7a), and after water was injected, there was a distinct interface of water displacing oil. With the volume of injected water being 0.2 pv, 0.4 pv, 0.6 pv, the oil–water interface moved forward stably parallel to the end face of the core, showing a representative piston-like displacement mode (Figure 7b–d). For Sample 1#, after the volume of water injected reached 0.1 pv, water had broken through at the downstream end of the core without the appearance of a distinct displacement interface between water and oil (Figure 7h). As waterflooding continued with injected water volumes of 0.4 pv, 0.6 pv, 0.8 pv, and 1.0 pv, water-enriched areas behaved, in a small increase, in the style of fingering paths, as well as in a small decrease in oil-enriched areas. It is thus speculated to be a fingering-like displacement mode (Figure 7i–l).

5. Discussion

5.1. Effects of Porosity, Permeability, and Wettability on Oil/Water Saturation

Based on all the waterflooding experiment results, the effects of the injected water volume, porosity, permeability, and wettability on residual oil saturation were analyzed. Firstly, as for the effects of the injected water volume, it can be seen that when the injected water volume is small without waterflow breaking through the core plugs, the water saturation of each sample increases rapidly, and their trends are mostly similar (Figure 6). When the water breaks through the core plugs, the variation trends of water saturation for different core plug samples are different due to their varying physical properties. The variations of water saturation are relatively small with increasing water volume injected after one core is broken through by water (Figure 8). As the volume of water injected increases from 1.0 pv to 1.8 pv of oil-wet samples 1#, 2#, and 3#, the water saturation variations are 2.2%, −2.6%, and 6.6%, respectively, and the variations for the water-wet samples 4#, 5#, and 6# are −9.0%, 2.1%, and 3.8%, respectively. It should be noted that the minus value should result from the CT scanning error due to the excessively weak change of oil volume in samples.
Secondly, it can be seen that the residual oil saturation of the core sample is mainly controlled by the porosity, permeability, and wettability (Figure 8). The samples with comparable porosity and permeability should have similar pore structure characteristics [26]. With the increasing porosity and permeability, the residual oil saturation of the water-wet samples decreases gradually, which is consistent with the opinions of Gao et al. [30]. In the study of Gao et al., the characteristics of water displacing oil for the samples from the Yanchang group were obtained using the Nuclear Magnetic Resonance technique, and they observed the positive relationship between waterflooding efficiency and permeability. This phenomenon can be explained by the fact that permeability can reflect pore connectivity, and a larger permeability indicates more connected pores and resulted in a higher waterflooding efficiency. Based on these consequential opinions, there are three modes for immiscible two-phase fluid displacement: viscous fingering, capillary fingering, and stable displacement [31]. Zhang et al. and Zhou et al. divided the secondary migration of oil and gas into piston, fingering, and string modes based on the petrophysical simulation experiments, and found the varying migration efficiencies of these three modes [32,33]. During our experiments, the three-dimensional CT images make the analyses of oil–water displacement patterns possible. The piston-like displacement mode of sample 4# with high porosity and permeability proved the waterflooding through more connected pores.
The residual oil saturation of oil-wet samples gradually increases with porosity and permeability. It may be due to the higher number of large pores with relatively weak interfacial forces found in the samples with high porosity and high permeability, coupled with the oil-wet states of the samples, causing the water to tend to only occupy the center of several connected pores [34]. The finger-like displacement mode of sample 1# proved the waterflooding through a small part of connected pores. However, the samples with low porosity and low permeability mostly contain a higher number of small pores with relatively strong interfacial forces, resulting in more oil–water displacement phenomena; therefore, the residual oil saturation is low [10].
The water-wet and oil-wet curves have the equal point of water saturation appearing at a porosity of about 9.5% or a permeability of about 0.3 × 10⁻³ μm2. It is thus when the porosity and permeability of the samples are lower than this point that the water-wet samples would have a lower water saturation than the oil-wet ones, and the difference becomes smaller as the porosity and permeability are closer to this point. On the contrary, when the porosity and permeability of the samples are higher than this point, the water-wet core samples would have a higher water saturation than the oil-wet ones with differences in enlargement as both porosity and permeability improve (Figure 8).

5.2. Implications for Oil Development in the Low-Permeability Reservoirs

The impacts of porosity, permeability, and wettability on the process of water-displacing oil, fluid saturation, and injection pressure may provide significant implications for establishing effective strategies for oil development in low-permeability reservoirs. The waterflooding is an important development method, but it is not suitable for all the reservoirs [35]. For the water-wet reservoirs, as they have a porosity of <9.5% and a permeability of <0.3 × 10⁻³ μm2, the waterflooding method usually results in very low water saturation (<40%) and high residual oil saturation (>60%) with a relatively low displacement efficiency. While when the reservoirs have a porosity of >9.5% and a permeability of >0.3 × 10⁻³ μm2, the waterflooded reservoirs would have high water saturation, low residual oil saturation, and a high displacement efficiency. For example, sample #4 (with 11.7% porosity, 0.52 × 10⁻³ μm2 permeability) obtains a final water saturation of about 70.0%. Therefore, when the water-wet oil reservoirs behave in >9.5% porosity and >0.3 × 10⁻³ μm2 permeability, the waterflooding development method can achieve good results, and vice versa.
However, the oil-wet reservoirs would show an opposite phenomenon compared with water-wet reservoirs, that is, as the reservoir samples are < 9.5% of porosity and <0.3 × 10⁻³ μm2 of permeability, the waterflooding can result in a low residual oil saturation (<40%) and high waterflooding efficiency. As they are >9.5% of porosity and >0.3 × 10⁻³ μm2 of permeability, there are relatively high residual oil saturation (> 40%) and low waterflooding efficiency. Therefore, for the oil-wet reservoirs, if they are <9.5% of porosity and <0.3 × 10⁻³ μm2 of permeability, the field development via waterflooding would achieve a comparatively good development result. Otherwise, if the porosity and permeability are high (>9.5% and >0.3 × 10⁻³ μm2), the effect of direct waterflooding development may be poor. It should be opted to change the wettability of the reservoir before waterflooding development, or adopt other development methods. There is an example that the strong oil-wet Chang 8 reservoirs in one well behave as expected in high oil saturation (49.3% in average), high porosity (16.3% in average), and high permeability (38.9 × 10⁻³ μm2 in average), but after fracturing work, only water is produced. This phenomenon is found in many studies and may result from the low waterflooding efficiency under the integral effect of the oil-wet state, high porosity, and high permeability of the reservoirs.
In addition, wettability modification associated with waterflooding is another important technological method for the development of oil-wet reservoir worldwide, that is, modifying and altering the wettability of oil-wet reservoirs into water-wet ones before the waterflooding [36,37,38]. However, this study shows that it is necessary to determine the characteristics of the porosity and permeability of the targeted reservoir and their comprehensive influences coupled with wettability on the waterflooding process before making a decision. If the physical properties of the reservoir are good, any wettability alteration would be beneficial to the development of waterflooding. However, if the physical properties of the reservoir are poor, any wettability alteration would make the oil development via waterflooding less effective.

6. Conclusions

The porosity, permeability, and wettability of the reservoir show integral effects on the fluid saturation and displacement efficiency during the waterflooding experiments. If the reservoir rock is water-wet, the residual oil saturation decreases gradually with increasing porosity and permeability, showing the increasing waterflooding efficiency. On the contrary, if the reservoir rock is oil-wet, the residual oil saturation gradually increases with improving porosity and permeability, showing the decreasing waterflooding efficiency. The porosity, permeability, and wettability characteristics of reservoirs should be comprehensively evaluated before adopting technical countermeasures of waterflooding or wettability modification during oilfield development. If the porosity and permeability of the reservoir are high, water-wet reservoirs can be directly developed via the waterflooding method. However, for the oil-wet reservoirs, it is better to firstly make the wettability modification before applying the waterflooding technique. If the porosity and permeability of the reservoir are poor, direct waterflooding development has a better result for the oil-wet reservoir in comparison with the water-wet reservoir.

Author Contributions

Conceptualization, Z.W.; Data curation, W.D.; Formal analysis, C.Z., H.Y., T.J. and C.H.; Funding acquisition, Z.W.; Investigation, Z.W., K.L., C.Z., H.Y. and C.H.; Methodology, Z.W., J.Y., B.Y. and J.L.; Project administration, K.L.; Resources, Z.W., Supervision, K.L.; Validation, W.D.; Visualization, Z.W.; Writing—original draft, Z.W. and K.L. All authors have read and agreed to the published version of the manuscript.

Funding

This work was financially supported by National Natural Science Foundation of China (42102159) and PetroChina R&D Program (2021DJ1504).

Data Availability Statement

Not applicable.

Acknowledgments

We gratefully acknowledge the support received from the Research Institute of Exploration and Development, Changqing Oilfield Company, China. We also thank the anonymous reviewers for their valuable comments and suggestions.

Conflicts of Interest

The authors declare no conflict of interest.

References

  1. Selly, R.C. Elements of Petroleum Geology, 2nd ed.; Academic Press: Cambridge, MA, USA, 1998; pp. 239–253. [Google Scholar]
  2. Craig, F.F. The Reservoir Engineering Aspects of Waterflooding; HL Doherty Memorial Fund of AIME: New York, NY, USA, 1971. [Google Scholar]
  3. Anderson, W.G. Wettability literature survey-part 1: Rock/oil/brine interactions and the effects of core handling on wettability. J. Pet. Technol. 1986, 38, 1125–1144. [Google Scholar] [CrossRef]
  4. Gu, X.Y.; Pu, C.S.; Huang, H.; Huang, F.F.; Li, Y.J.; Liu, Y.; Liu, H.C. Micro-influencing mechanism of permeability on spontaneous imbibition recovery for tight sandstone reservoirs. Pet. Explor. Dev. 2017, 44, 1003–1009. [Google Scholar] [CrossRef]
  5. Ghous, A.; Knackstedt, M.A.; Arns, C.H.; Sheppard, A.P.; Kumar, M.; Sok, R.M.; Senden, T.J.; Latham, S.; Jones, A.C.; Averdunk, H.; et al. 3D Imaging of Reservoir Core at Multiple Scales; Correlations to Petrophysical Properties and Pore Scale Fluid Distributions. In Proceedings of the International Petroleum Technology Conference, Kuala Lumpur, Malaysia, 3–5 December 2008. [Google Scholar]
  6. Liu, X.J.; Xiong, J.; Liang, L.X.; Yuan, W. Study on the characteristics of pore structure of tight sand based on micro-CT scanning and its influence on fluid flow. Prog. Geophys. 2017, 32, 1019–1028, (In Chinese with English abstract). [Google Scholar]
  7. Celauro, J.G.; Torrealba, V.A.; Karpyn, Z.T.; Klise, K.A.; Mckemma, S.A. Pore-scale multiphase flow experiments in bead packs of variable wettability. Geofluids 2014, 14, 95–105. [Google Scholar] [CrossRef]
  8. Zhao, B.Z.; MacMinn, C.W.; Juanes, R. Wettability control on multiphase flow in patterned microfluidics. Proc. Natl. Acad. Sci. USA 2016, 113, 10251–10256. [Google Scholar] [CrossRef] [PubMed]
  9. Javaheri, A.; Habibi, A.; Dehghanpour, H.; Wood, J.M. Imbibition oil recovery from tight rocks with dual-wettability behavior. J. Pet. Sci. Eng. 2018, 167, 180–191. [Google Scholar] [CrossRef]
  10. Rücker, M.; Bartels, W.B.; Singh, K.; Brussee, N.; Coorn, A.; Linde, H.A.; Bonnin, A.; Ott, H.; Hassanizadeh, S.M.; Blunt, M.J.; et al. The effect of mixed wettability on pore-scale flow regimes based on a flooding experiment in Ketton limestone. Geopetrophysical Res. Lett. 2019, 46, 3225–3234. [Google Scholar] [CrossRef]
  11. Fitch, P.J.R.; Lovell, M.A.; Davies, S.J.; Pritchard, T.; Harvey, P.K. An integrated and quantitative approach to petrophysical heterogeneity. Mar. Pet. Geol. 2015, 63, 82–96. [Google Scholar] [CrossRef]
  12. Henares, S.; Caracciolo, L.; Viseras, C.; Fernandez, J.; Yeste, L.M. Diagenetic constraints on heterogeneous reservoir quality assessment: A Triassic outcrop analog of meandering fluvial reservoirs. AAPG Bull. 2016, 100, 1377–1398. [Google Scholar] [CrossRef]
  13. Saïag, J.; Brigaud, B.; Portier, É.; Desaubliaux, G.; Bucherie, A.; Miska, S.; Pagel, M. Sedimentological control on the diagenesis and reservoir quality of tidal sandstones of the Upper Cape Hay Formation (Permian, Bonaparte Basin, Australia). Mar. Pet. Geol. 2016, 77, 597–624. [Google Scholar] [CrossRef]
  14. Yan, H.J.; He, D.B.; Jia, A.L.; Li, Z.P.; Guo, J.L.; Peng, X.; Meng, F.K.; Li, X.Y.; Zhu, Z.M.; Deng, H.; et al. Characteristics and development model of karst reservoirs in the fourth member of Sinian Dengying Formation in central Sichuan Basin, SW China. Pet. Explor. Dev. 2022, 49, 704–715, (In Chinese with English abstract). [Google Scholar] [CrossRef]
  15. Fathy, D.; El-Balkiemy, A.F.; Makled, W.A.; Hosny, A. Organic geochemical signals of Paleozoic rocks in the southern Tethys, Siwa basin, Egypt: Implications for source rock characterization and petroleum system. Phys. Chem. Earth Parts A/B/C 2023, 130, 103393. [Google Scholar] [CrossRef]
  16. Haldorsen, H.H. Simulator parameter assignment and the problem of scale in reservoir engineering. Reservoir characterization. In Reservoir Characterization; Lake, L.W., Caroll, H.B., Eds.; Academic Press: Orlando, FL, USA, 1986; pp. 293–340. [Google Scholar]
  17. Ringrose, P.S.; Martinius, A.W.; Alvestad, J. Multiscale geological reservoir modelling in practice. Geol. Soc. Lond. Spec. Publ. 2008, 309, 123–134. [Google Scholar] [CrossRef]
  18. Yan, H.J.; Deng, H.; Wan, Y.J.; Yu, J.C.; Xia, Q.Y.; Xu, W.; Luo, R.L.; Cheng, M.H.; Yan, Y.J.; Zhang, L.; et al. The gas well productivity distribution characteristics in strong heterogeneity carbonate gas reservoir in the fourth Member of Dengying Formation in Moxi area, Sichuan Basin. Nat. Gas Geosci. 2020, 31, 1152–1160, (In Chinese with English abstract). [Google Scholar]
  19. Jackson, M.D.; Hampson, G.J.; Sech, R.P. Three-dimensional modeling of a shoreface-shelf parasequence reservoir analog: Part 2. Geologic controls on fluid flow and hydrocarbon recovery. AAPG Bull. 2009, 93, 1183–1208. [Google Scholar] [CrossRef]
  20. Mohamed, A.A.; Khishvand, M.; Piri, M. A pore-scale experimental investigation of process-dependent capillary desaturation. Adv. Water Resour. 2020, 144, 103702. [Google Scholar] [CrossRef]
  21. Al-Owihan, H.; Al-Wadi, M.; Thakur, S.; Behhehani, S.; Al-Jabari, N.; Dernaika, M.; Koronfol, S. Advanced rock characterization by Dual-Energy CT imaging: A novel method for complex reservoir evaluation. In Proceedings of the IPTC 2014: International Petroleum Technology Conference, Doha, Qatar, 19–22 January 2004; European Association of Geoscientists & Engineers: Utrecht, The Netherlands, 2014. [Google Scholar]
  22. AlJallad, O.; Dernaika, M.; Koronfol, S.; Naseer, Y.; Mishra, P. Evaluation of complex carbonates from pore-scale to core-scale. International petroleum technology conference. In Proceedings of the International Petroleum Technology Conference, Dhahran, Saudi Arabia, 13–15 January 2020; p. 21. [Google Scholar]
  23. Wang, Z.N.; Luo, X.R.; Lei, Y.H.; Zhang, L.K.; Shi, H.; Lu, J.H.; Cheng, M.; Liu, N.G.; Wang, X.Z.; He, Y.H.; et al. Impact pf detrital composition and diagenesis on the heterogeneity and quality of low-permeability to tight sandstone reservoirs: An example of the Upper Triassic Yanchang Formation in Southeastern Ordos Basin. J. Pet. Sci. Eng. 2020, 195, 107596. [Google Scholar] [CrossRef]
  24. Fu, J.; Wu, S.H.; Luo, A.X.; Zhang, L.A.; Li, Z.; Li, J.H. Reservoir quality and its controlling factors of Chang 8 and Chang 6 members in LongDong Area, Ordos Basin. Earth Sci. Front. 2013, 20, 98–107, (In Chinese with English abstract). [Google Scholar]
  25. Robin, M.; Combes, R.; Degreve, F.; Cuiec, L. Wettability of porous media from Environmental Scanning Electron Microscopy: From model to reservoir rocks. In Proceedings of the International Symposium on Oilfield Chemistry, Houston, TX, USA, 18–21 February 1997; Society of Petroleum Engineers: Richardson, TX, USA, 1997. [Google Scholar]
  26. Wang, Z.N.; Luo, X.R.; Liu, K.Y.; Fan, Y.C.; Wang, X.Z. Impact of chlorites on the wettability of tight oil sandstone reservoirs in the Upper Triassic Yanchang Formation, Ordos Basin, China. Sci. China Earth Sci. 2021, 64, 951–961. [Google Scholar] [CrossRef]
  27. SY/T 5336-2006; Practices for Core Analysis. Petroleum and Natural Gas Industry Standards of People’s Republic of China. Petroleum Industry Publishing House: Beijing, China, 2006.
  28. Akin, S.; Kovscek, A.R. Computed tomography in petroleum engineering research. Geol. Soc. Lond. Spec. Publ. 2003, 215, 23–38. [Google Scholar] [CrossRef]
  29. Wang, Z.N.; Luo, X.R.; Liu, K.Y.; Lei, Y.H.; Zhang, L.K.; Cheng, M.; Wang, X.Z. Evaluation of pore-scale wettability in the tight sandstone reservoirs of the Upper Triassic Yanchang Formation, Ordos Basin, China. Mar. Pet. Geol. 2022, 138, 105528. [Google Scholar] [CrossRef]
  30. Gao, H.; Wang, X.P.; Qi, Y. Characteristics of NMR water displacing oil and influencing factors in extra-low permeable sandstones: Taking the Yanchang Group in Ordos Basin as an example. Geol. J. China Univ. 2013, 19, 364–372. [Google Scholar]
  31. Lenormand, R.; Zarcone, E.; Touboul, E. Numberical models and experiments on immiscible displacements in porous media. J. Fluid Mech. 1988, 189, 165–187. [Google Scholar] [CrossRef]
  32. Zhang, F.Q.; Luo, X.R.; Miao, S.; Wang, W.M.; Zhou, B.; Huang, Y.Z. The patterns and its effect factors of secondary hydrocarbon migration. Pet. Geol. Exp. 2003, 25, 69–75, (In Chinese with English abstract). [Google Scholar]
  33. Zhou, B.; Jin, Z.J.; Luo, X.R.; Wang, Y.; Zhang, F.Q. Discussion on the efficiency of secondary oil-gas migration. Acta Pet. Sin. 2008, 29, 522–526, (In Chinese with English abstract). [Google Scholar]
  34. Habibi, A.; Xu, M.X.; Dehghanpour, H.; Bryan, D.; Uswak, G. Understanding rock-fluid interactions in the Montney tight oil play. In Proceedings of the SPE/CSUR Unconventional Resources Conference, Calgary, AB, Canada, 20–22 October 2015; Society of Petroleum Engineers: Richardson, TX, USA, 2015. [Google Scholar]
  35. Anderson, W.G. Wettability literature survey-part 6: The effects of wettability on waterflooding. J. Pet. Technol. 1987, 39, 1605–1622. [Google Scholar] [CrossRef]
  36. Kathel, P.; Mohanty, K.K. Wettability alteration in a tight oil reservoir. Energy Fuels 2013, 27, 6460–6468. [Google Scholar] [CrossRef]
  37. Brady, P.V.; Bryan, C.R.; Thyne, G.; Li, H.N. Altering wettability to recover more oil from tight formations. J. Unconv. Oil Gas Resour. 2016, 15, 79–83. [Google Scholar] [CrossRef]
  38. Khishvand, M.; Alizadeh, A.H.; Kohshour, I.O.; Piri, M.; Prasad, R.S. In situ characterization of wettability alteration and displacement mechanisms govering recovery enhancement due to low-salinity waterflooding. Water Resour. Res. 2016, 53, 4427–4443. [Google Scholar] [CrossRef]
Figure 1. Location of the Ordos Basin and stratigraphy of Yanchang Formation. (a,b) indicate the location of Ordos Basin and study area, respectively; (c) displays the distribution of Chang 8 sandstones, (d) indicates the atrata and lithology of Yanchang Formation.
Processes 11 02786 g001
Figure 2. Coreflooding system, including CT scanner, core holder, and Isco pump.
Processes 11 02786 g002
Figure 3. Plot of porosity and permeability of core samples used in the waterflooding experiment.
Processes 11 02786 g003
Figure 4. ESEM images showing representative condensation scenarios on pore walls. (a) 1#. (b) 2#. The arrows point at the water droplets.
Processes 11 02786 g004
Figure 5. Plots of injection pressure with volume of injected water.
Processes 11 02786 g005
Figure 6. Plot of water saturation and volume of injected water. The red and blue curves represent oil-wet and water-wet samples, respectively.
Processes 11 02786 g006
Figure 7. Slices of core samples during the process of water displacing oil. (af) represent sample 4#, (gl) represent sample 1# with the injected water volumes of 0 pv, 0.2 pv, 0.4 pv, 0.6 pv, 0.8 pv, and 1.0 pv. The red represents the oil-enriched area, blue represents the water-enriched area, blue arrows indicate the direction of water injection from the bottom to the top of image, and the dash lines indicate the displacement front; the image width is about 2.5 cm.
Processes 11 02786 g007
Figure 8. Plot of water saturation vs. the porosity (a) and permeability (b) of samples for waterflooding experiments.
Processes 11 02786 g008
Table 1. Parameter table showing basic characteristics of the core plug samples.
No.Well NameDepth
(m)
Length
(cm)
Diameter
(cm)
Porosity
(%)
Permeability
(×10−3μm2)
Wettability
1#Xi1192085.504.032.5114.281.71Oil-wet
2#Z2022285.504.092.508.710.21Oil-wet
3#Z2022288.304.932.538.170.19Oil-wet
4#Z3391857.893.692.5011.700.52Water-wet
5#Z3392162.784.302.5410.030.30Water-wet
6#S401645.404.052.508.390.10Water-wet
Disclaimer/Publisher’s Note: The statements, opinions and data contained in all publications are solely those of the individual author(s) and contributor(s) and not of MDPI and/or the editor(s). MDPI and/or the editor(s) disclaim responsibility for any injury to people or property resulting from any ideas, methods, instructions or products referred to in the content.

