1. Introduction
The problem of cavitation in the impeller and on the pump suction has been addressed by many publications [
1]. The fundamental mechanism of cavity dynamics is described as the process of the growth and rapid collapse of vapor bubbles in a fluid flow that has damaging and performance-degrading effects on the pump [
1,
2,
3,
4,
5,
6]. A distinction should be made between vapor and gas cavitation. Vapor cavitation arises if the static pressure drops under the saturated vapor pressure. Gas cavitation involves the formation of bubbles because of the release of dissolved gases from the liquid in connection with diffusion [
2,
3].
An important factor in evaluating the suction characteristics of a centrifugal pump is the Net Positive Suction Head (NPSH). The NPSH can be defined as the difference between the total head in the inlet nozzle and the vapor head [
7],
where
is absolute static pressure in a suction nozzle,
is the vapor pressure of the fluid corresponding to the temperature,
is velocity in a suction nozzle,
is the geodetic height between the suction nozzle centre and the reference level,
is the density of a fluid and
is gravity acceleration.
We distinguish two NPSH values: the Net Positive Suction Head Required by the pump (NPSHR) and the Net Positive Suction Head Available in the system (NPSHA). The NPSHR is a function of the pump design, i.e., the impeller inlet diameter, number of blades, blade inlet angle and flow inlet conditions. In case of NPSHR, the sum of the terms in the Equation (1) must not fall below a minimum value specified for a given pump. Determining NPSHR is performed by pump testing. Most often, the constant flow method is used for this purpose. In this method, the pump discharge valve is kept at a fixed open position so that the pump-developed head and flow rate remain constant. The pump suction valve is throttled to reduce the pump inlet pressure until a point where the total pump head decreases by at least 3 percent. The net positive suction head corresponding to the 3% drop in the pump head is known as NPSH3 and is commonly used as the relevant cavitation criterion; however, various cavitation criteria can be determined [
8,
9,
10,
11].
The available suction energy NPSHA is a function of the design, arrangement and condition of the suction pipe and fittings. NPSHA is the energy head defined by the hydraulic loss of the pump suction line between the liquid level in the suction tank and the pump suction nozzle for 1 kg of liquid (suction head). It is dependent on the operating condition of the system (flow rate) and provides information about the risk of cavitation [
6,
12,
13].
Substituting the values for the system into Equation (1), we obtain:
where
is the measured relative pressure,
is the barometric pressure and
is the absolute pressure in a suction tank,
is the vapor pressure of the fluid corresponding to the temperature,
is the velocity defined at the liquid surface in the suction tank,
is the geodetic height between the liquid surface in the suction tank and the reference level (suction pipe axis in case of horizontal pipe), and
is the loss head on the system suction side.
The NPSHA can be plotted against the flow rate in the same way as the NPSHR. To ensure the continuous and reliable operation of a pump, the NPSHA should always be higher than the NPSHR in all duty points, and a certain safety NPSHA margin over the NPSHR must be kept. Most often, NPSHA = (1.1 ÷ 1.5) NPSHR. Inadequate NPSHA can lead to liquid evaporation in the low-pressure zone at the eye of the impeller. The prevailing low pressure of the liquid rises as the vapor pockets traverse the impeller blades. The rising pressure causes the vapor pockets to collapse against the impeller and pump housing, producing noise and damage of cavitation [
14]. We can improve the NPSHA by either increasing the suction static head above the pump centreline and the pressure above the liquid in the suction tank or by reducing the losses on the system suction side, which subtracts energy from the liquid.
The suction pipe design should ensure an undisturbed approach of the flow to the pump impeller. Elbows, tees and valves should not be installed close to the pump’s suction nozzle to prevent an irregular flow pattern inside the suction line. Narrow pipes and constrictions producing turbulence and pressure losses should be avoided as they can work as a source of cavitation.
Many presented papers deal with the investigation of pressure losses in hydraulic elements in various applications. The authors of [
15] investigated the influence of angular fitting connections in pipeline systems of transport machines’ hydraulic drives. The performed research showed that each type of angular connection required an accurate definition of the flow coefficient based on the flowrate that could be obtained both experimentally and by means of numerical simulation. The standard equivalent length method was not capable of taking complex flow phenomena into account. Numerical modelling can be used as a tool, which provides detailed description of velocity and pressure field in the hydraulic components in various conditions. Similar research was presented in [
16]. The analysis of fluid flow and energy efficiency inside non-repaired and repaired high-pressure hoses was presented in this work. The pressure drop, power losses and flow coefficients were investigated. Numerical simulation results were verified by the physical experiment. It was concluded that the repair of the hose with a junction fitting led to changes in the flow characteristic and the increase of power losses.
As can be seen from [
15,
16], it is possible to analyse the characteristics of hydraulic elements by numerical modelling, but in the case of more complex element geometry and under complicated operating conditions (high temperature, saturated vapor pressure, physical properties of liquids, air content), it is advisable to verify the method experimentally, as presented in [
3,
8].
The authors of [
8] focused their attention on the CFD (Computational Fluid Dynamics) investigation of the flow field in the converging-diverging nozzle. The wide range of the cavitation regimes were investigated numerically to complement the previous experimental results.
The authors of [
3] focused on the measurement and evaluation of the hydraulic parameters of a convergent-divergent nozzle of rectangular and circular cross-section during the flow of water that was saturated with air. The dependence of the size of the cavitation cloud and the change of hydraulic parameters (pressure and flow) on the amount of absorbed air were monitored. In conclusion, it is necessary to model the air phase in the flow with cavitation.
The pressure losses in hydraulic elements can be investigated in connection with the pumping systems. Both the pump construction and suction pipe design have been subjected to research. This issue has also been the subject of analysis in the latest publications [
17]. In [
17], the authors compared two methods of the axial flow water jet pump design with respect to cavitation. Numerical simulations, including the equations for cavitation flow and physical experiments, were conducted to investigate the flow characteristics. Attention was paid to the changes of internal flow fields with the variation of the cavitation number.
The design of the suction pipeline can significantly affect the pump operation. The formation of cavitation in hydraulic elements can contribute to decrease of the pump performance and the parameters at which the pump head starts to fall.
Cavitation can be identified acoustically [
4,
18], by vibrations [
19], visually and by measuring hydraulic characteristics [
4,
8,
14,
15]. An overview of cavitation detection in pumps is given in [
20,
21].
The authors of [
4] focused on the available methods for identifying cavitation in a hydraulic element. Hydraulic quantities were measured here, from which the loss coefficient was evaluated. From the dependence of the loss coefficient on the Reynolds number (experiment), the formation of cavitation was clearly visible, which was also supported by the visualization on the transparent element. The main contribution of the publication [
4] was the detection and dynamic behaviour of the cavitation cloud recorded by a high-speed camera, while the available quantities were measured simultaneously (pressure, flowrate, noise, vibration and the amount of the air dissolved in the liquid). The evaluation of all quantities confirmed the change in the flow field, which the authors attributed to the occurrence of cavitation.
The authors of [
19] focused on the detection and monitoring of the cavitation phenomenon within a centrifugal pump using the vibration technique. Vibration signals were analysed in both time and frequency domains under different operating conditions and proved to be a good tool for cavitation indication.
The authors of [
18] presented the simulation results of the acoustic field around an underwater supercavitation vehicle. They provided a comprehensive numerical study of the influence of various operating conditions on the ventilated cavitation phenomenon and the noise characteristic spectrum in a wide-frequency domain. The obtained results provide theoretical support for studying the supercavitation vehicles’ noise and applying the ventilated supercavitation technology.
The authors of [
20] recommended the detection of cavitation in problematic cases by combining two methods. Cavitation detection by the acoustic method is non-destructive and has a high accuracy for early cavitation detection, but the price of sensors is high, and this method is difficult to use in practice. Vibration measurement is widely used in practice, but this method is unsuitable for cavitation detection due to the attenuation of the signal that propagates through the structure and its low accuracy for the primary detection of cavitation. The visual method is applicable primarily in laboratories where transparent elements can be used.
When detecting cavitation using the measurement of hydraulic quantities or pressure pulsations, pipe destruction may occur when pressure sensors are connected; the installation of sensors is complex and not always desirable in practice, and the low accuracy of detection during initial cavitation is also a disadvantage. However, the method is resistant to interference from surrounding influences [
17].
Hydraulic systems allow to transport the fluid through the set of interconnected discrete elements. The performance of such system can be described by the system characteristic curve, which is a response in the head or pressure to a given flowrate. The system characteristic is calculated based on major (friction) losses in the pipelines and minor losses in the hydraulic elements. The presence of cavitation is often only discovered during the implementation and operation of the system. The main motivation of this paper was therefore the evaluation of the characteristics affected by cavitation for individual elements (pipe, convergent-divergent nozzle) and, subsequently, the characteristics affected by cavitation for the pump.
The cavitating elements located in front of the pump significantly affect the pump characteristics, while the elements behind the pump do not have a significant effect on the characteristics of the pump supplied by the manufacturer. By default, pressure losses in the installed elements are defined during the design of the suction pipe using a loss coefficient depending on the flow rate (or speed, Reynolds number). The loss coefficients are defined on the basis of the pressure drop on the hydraulic element in the cavitation-free mode. However, the specific value of the absolute pressure at the entrance to the pump is essential, which can change significantly in connection with the formation of cavitation in the hydraulic elements on the suction, as demonstrated by the experimental research carried out. This conclusion can be stated as the main contribution of the article.
2. Objective and Procedure of the Experiment
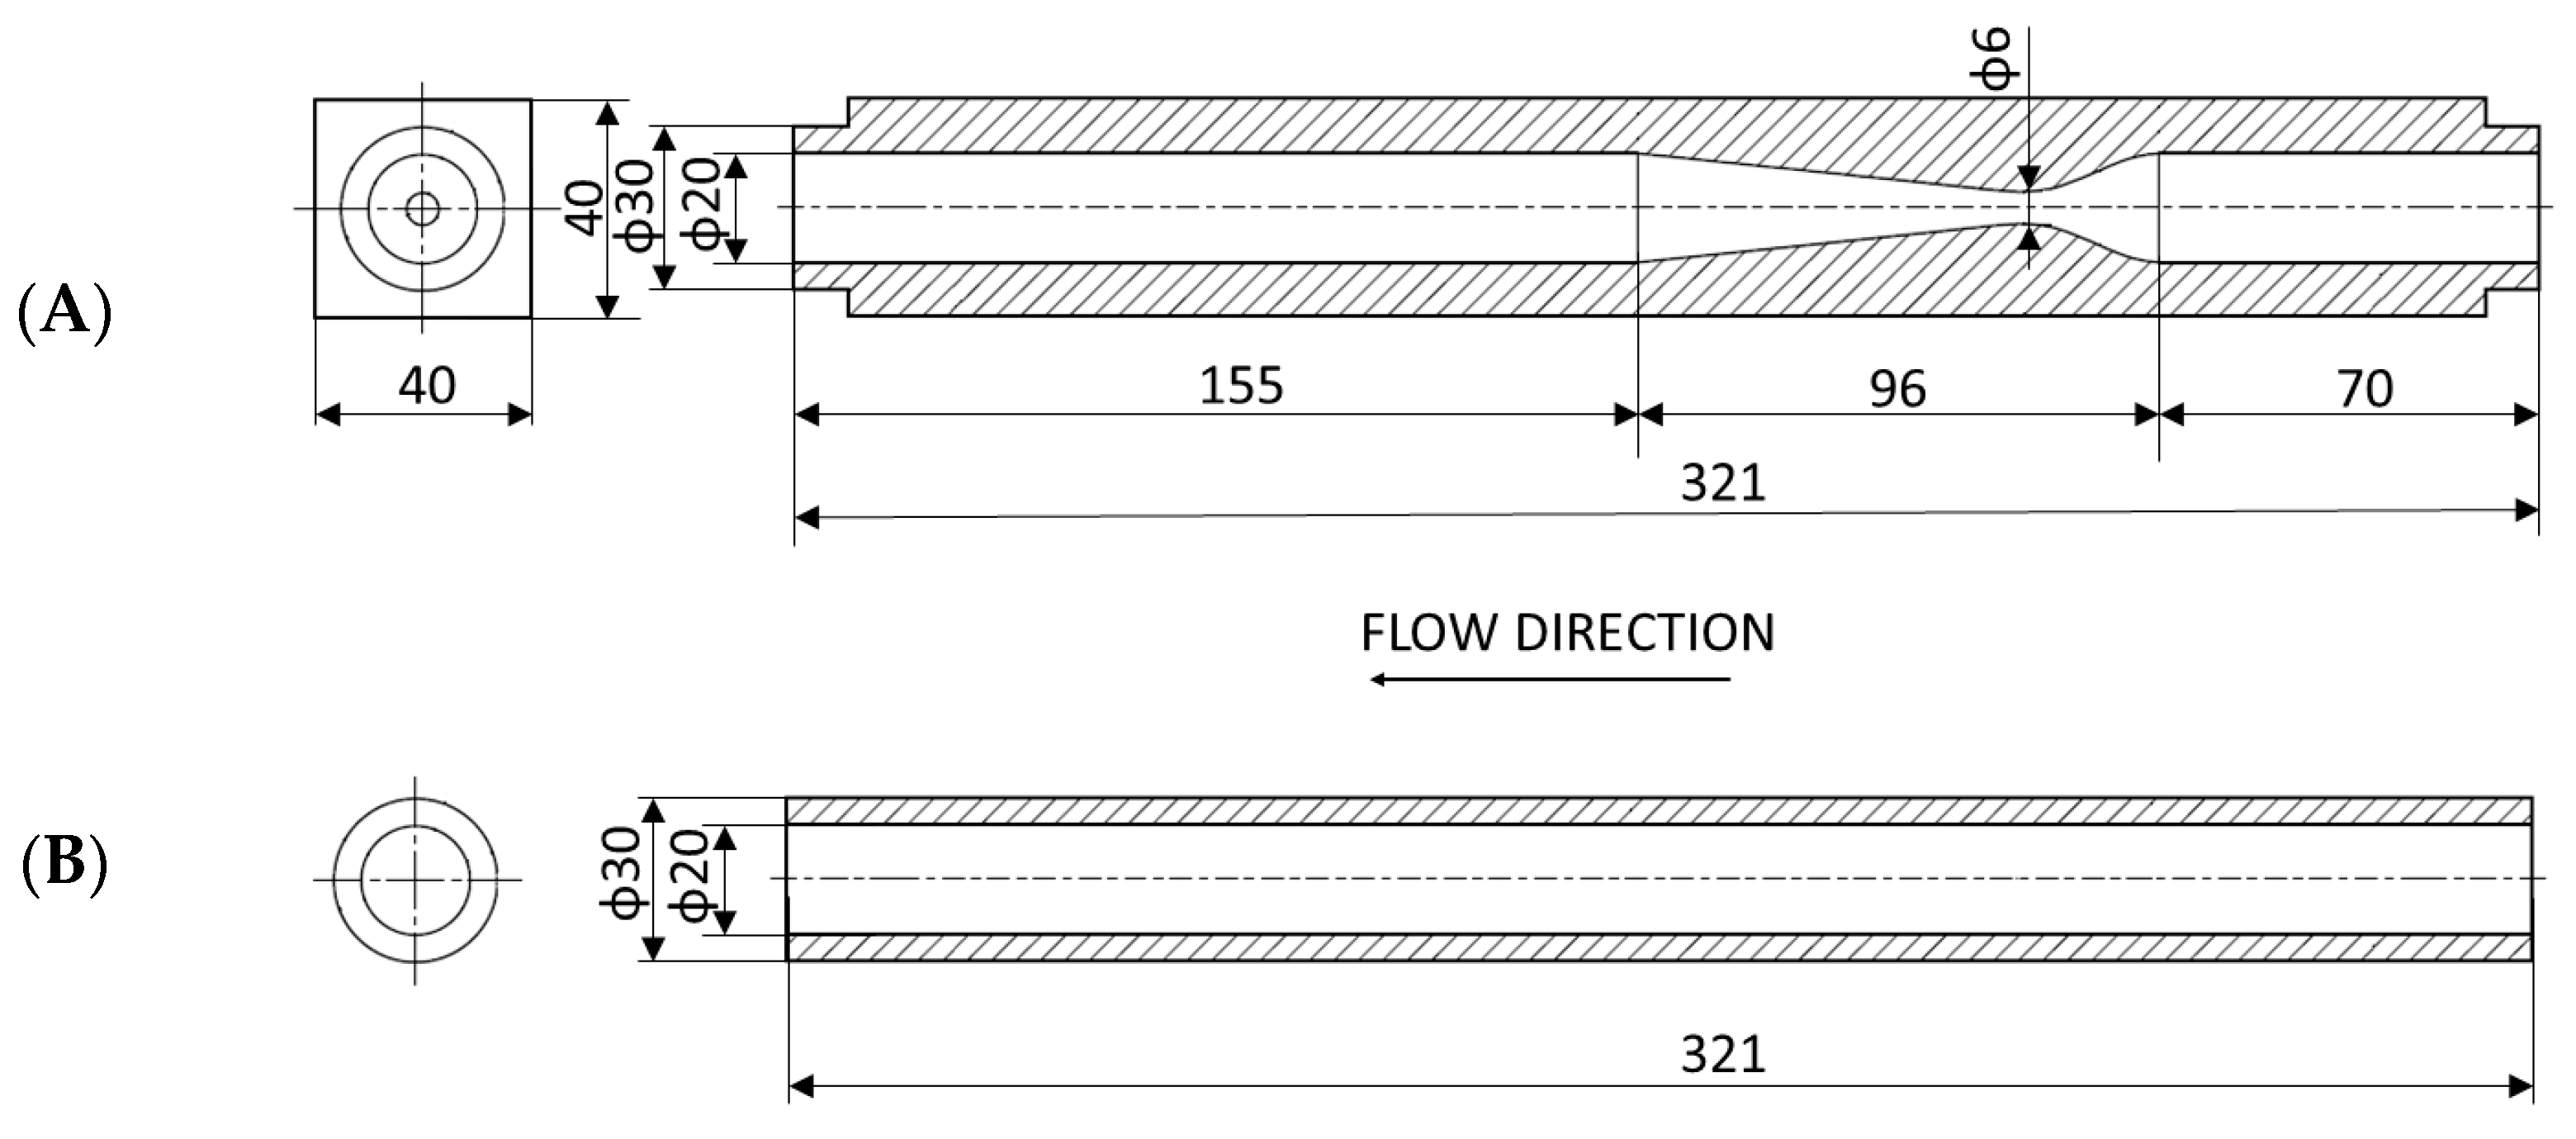
The main objective of this work was to investigate the influence of cavitating hydraulic elements installed in the pump suction pipe on the pump performance. We chose a converging-diverging nozzle with a circular cross-section for this purpose. A straight pipe segment of constant diameter and the same length was used for comparison. The design and main dimensions of both are presented in
Figure 1.
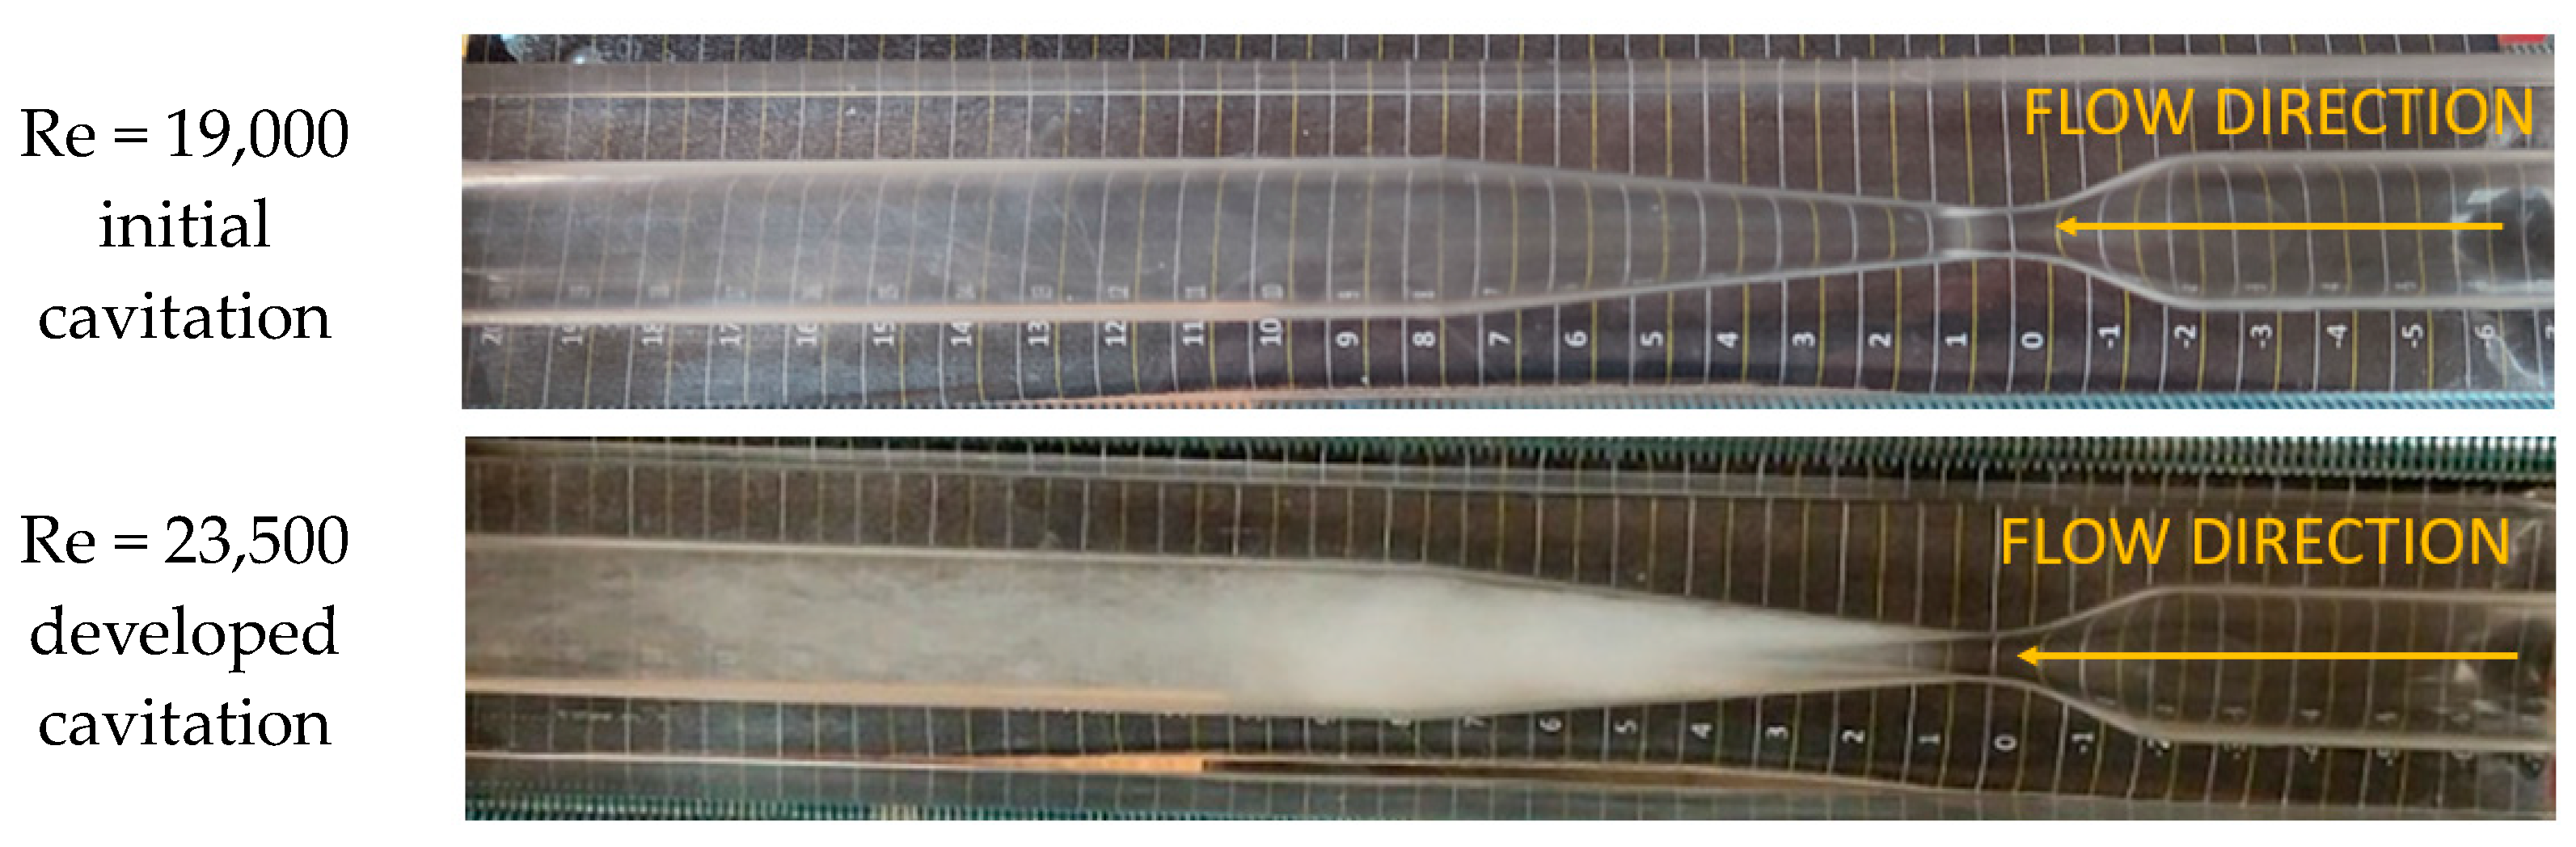
The nozzle was made of transparent material, which made it possible to observe the formation of cavitation bubbles, as illustrated in
Figure 2 [
5]. The study of the one-dimensional flow with bubble cavitation effect can help in understanding the mechanism of cavitation origin in different conditions of flow and to evaluate its contribution to NPSHA and pump head decreases.
Basic characteristics
were evaluated for both hydraulic elements (nozzle and straight pipe). Further, the loss coefficient
and cavitation number
were calculated and plotted against the Reynolds number
.
where
is the velocity,
is the diameter,
is the density of a fluid and
is the dynamics viscosity. The loss coefficient
can be determined from the Bernoulli equation:
where
is the pressure loss,
is the density of a fluid and
is the velocity. The cavitation number
represents the ratio of the static pressure (the difference between the inlet absolute pressure and the saturated vapor pressure) to the dynamic pressure as given by Equation (4). The critical
corresponds to the origin of cavitation in the converging-diverging nozzle.
where
is the pressure at the inlet to the measured element,
is the vapor pressure of the fluid corresponding to the temperature,
is the density of a fluid and
is the velocity in narrowing. The pump was tested in the laboratory under various discharge and head conditions. The characteristic
curve (head—flow rate) of the pump was provided by the manufacturer. The pump curve was then measured with the converging-diverging nozzle and straight pipe installed in the suction pipe.
Applying Bernoulli’s equation between points P3 and P2 in
Figure 3 results in:
where
is pressure point P3 (see
Figure 3),
is pressure point P2 (see
Figure 3),
is velocity point P3 (see
Figure 3),
is velocity point P2 (see
Figure 3),
is the density of a fluid and
is the geodetic height between the liquid surface in the suction tank and the reference level. Since the difference between the elevations
and velocities at points P2 and P3 are negligible, the equation becomes:
The NPSHA was evaluated from Equation (2). Since the tank is opened,
and the equation becomes:
where
is barometric pressure,
is the vapor pressure of the fluid corresponding to the temperature,
is the density of a fluid,
is the geodetic height between the liquid surface in the suction tank and the reference level (suction pipe axis in case of horizontal pipe) and
is loss head on the system suction side. For comparison, the nozzle was also situated behind the pump on the discharge pipe. The pump curve
and
were evaluated.
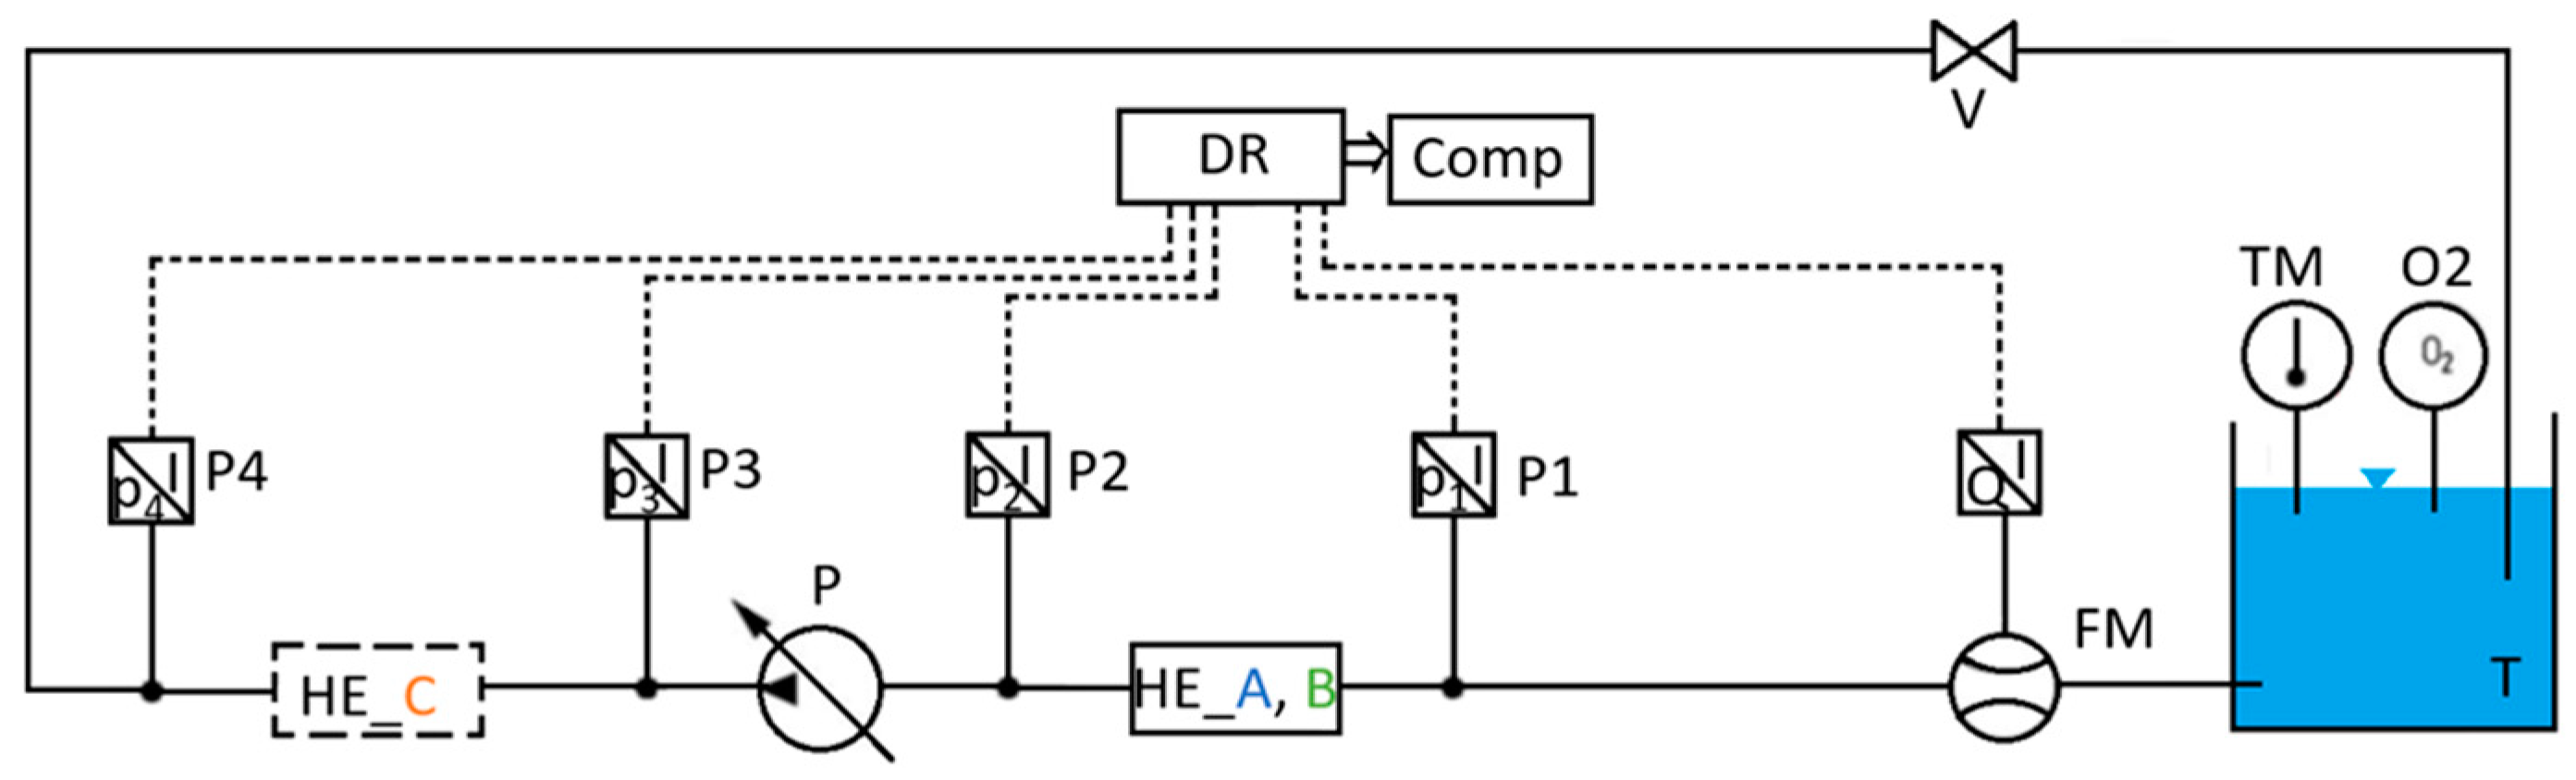
3. Experimental Setup
The hydraulics bench was fitted with a single centrifugal pump Grundfos MAGNA1. The liquid (water) was pumped from the opened tank (T) with a water level of 500 mm further into the system, which was designed as overpressure (overpressure was induced by a column of liquid in the tank). Temperature (TM) and oxygen (O2) sensors were located in the tank. A flow meter (FM) behind the tank was used to measure the volume flow rate. Pump (P) suction and discharge pressures were measured to evaluate the pump head. The flow rate was controlled by the valve (V) on the discharge pipe.
There were three variants of the location of the measured hydraulic element (HE):
HE_A—a transparent converging-diverging nozzle of circular cross-section with an inlet diameter of 20 mm and minimum diameter of 6 mm, located upstream of the pump. The pressure drop was evaluated from the pressure differences , and the flow rate was measured by an FM flow meter.
HE_B—a transparent tube with a constant inner diameter of 20 mm, located upstream of the pump. The pressure drop was evaluated from the pressure differences , and the flow rate was measured by an FM flow meter.
HE_C—a transparent converging-diverging nozzle of circular cross-section with an inlet diameter of 20 mm and minimum diameter of 6 mm, located downstream of the pump. The pressure drop was evaluated from the pressure differences , and the flow rate was measured by an FM flow meter.
Figure 3.
Hydraulic circuit. T—tank, FM—flow meter, HE—hydraulic element, P—pump, V valve, DR—data recorder, Comp—computer, pressure at the inlet to the hydraulic element A, B, pressure at the outlet of the hydraulic element A, B and at the inlet to the pump, pressure at the outlet to the pump and at the inlet to the hydraulic element C, pressure at the outlet to the hydraulic element C. —thermometer, O2—oxygen meter.
In all variants, the pressure upstream and downstream of the element HE was measured, and the pressure drop was evaluated. The configuration of the hydraulic circuit is illustrated in
Figure 3. The centrifugal pump was situated under the liquid level in the tank. The discharge from the return pipe was submerged under the liquid level in the opposite side of the tank. There was a partition between the suction and return pipes.
The hydraulic elements were tested separately; only one element was inserted into the circuit, and the hydraulic characteristics were investigated. After replacing the element, the circuit had to be vented properly. The HMG 3000 portable data recorder was used for recording the measured data simultaneously at a rate of 1 ms for 10 s. The average value was then calculated from recorded values.
Table 1 gives a summary of the pump experimental setup devices.
4. Results and Discussion
Measurement was performed and repeated for a various range of pump flow rates up to 0.0008 m
3·s
−1, which corresponds to a Reynolds number up to 40,000. The barometric pressure
was 99,180 Pa. The physical constants of water during the measurement are summarised in
Table 2. Due to the amount of liquid in the circuit and the total length of the measurement, it was not necessary to stabilize the temperature. The measured temperature change was up to 1 °C.
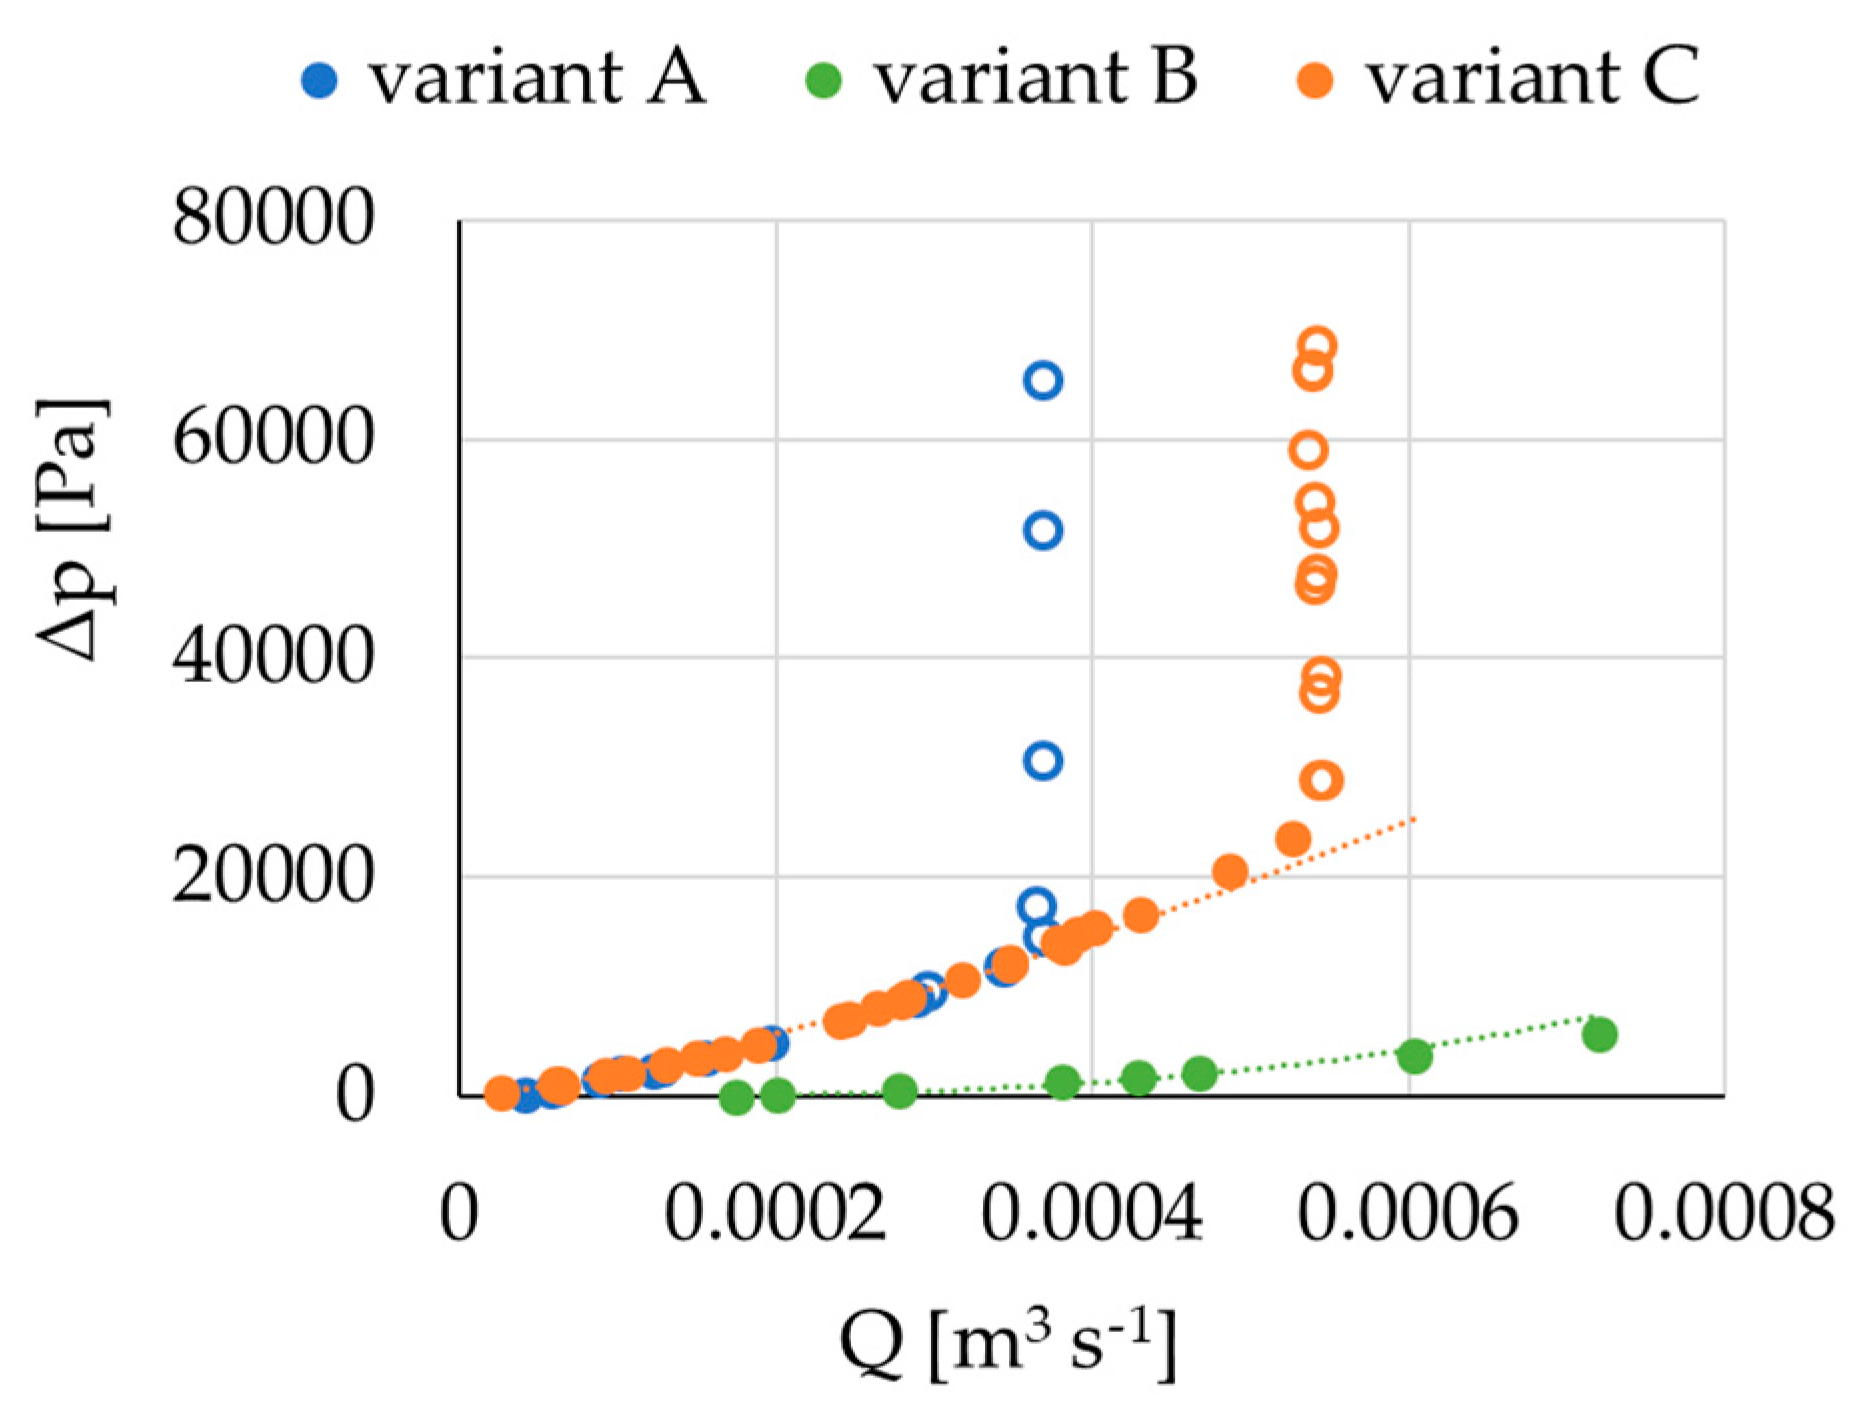
Figure 4 shows the characteristics of the converging-diverging nozzle (variant A) and the pipe segment (variant B) located in front of the pump and converging-diverging nozzle (variant C) located behind the pump. Filled points express the flow without cavitation, and empty points indicate the flow with cavitation.
In the non-cavitation region, the characteristics of all three variants (A, B, C) are approximately proportional to the square of the flow rate with respect to the loss coefficient [
5,
7]. A sharp increase in pressure loss in the converging-diverging nozzle (variants A and C) was associated with the formation of cavitation and corresponded to the visual observation of cavitation in the transparent nozzle (see
Figure 2). Cavitation did not occur in the pipe (variant B), and the pressure loss was significantly smaller compared to converging-diverging nozzle. It can be observed that cavitation in the converging-diverging nozzle situated behind the pump (variant C) occurred at higher values of the flow rate if compared with variant A.
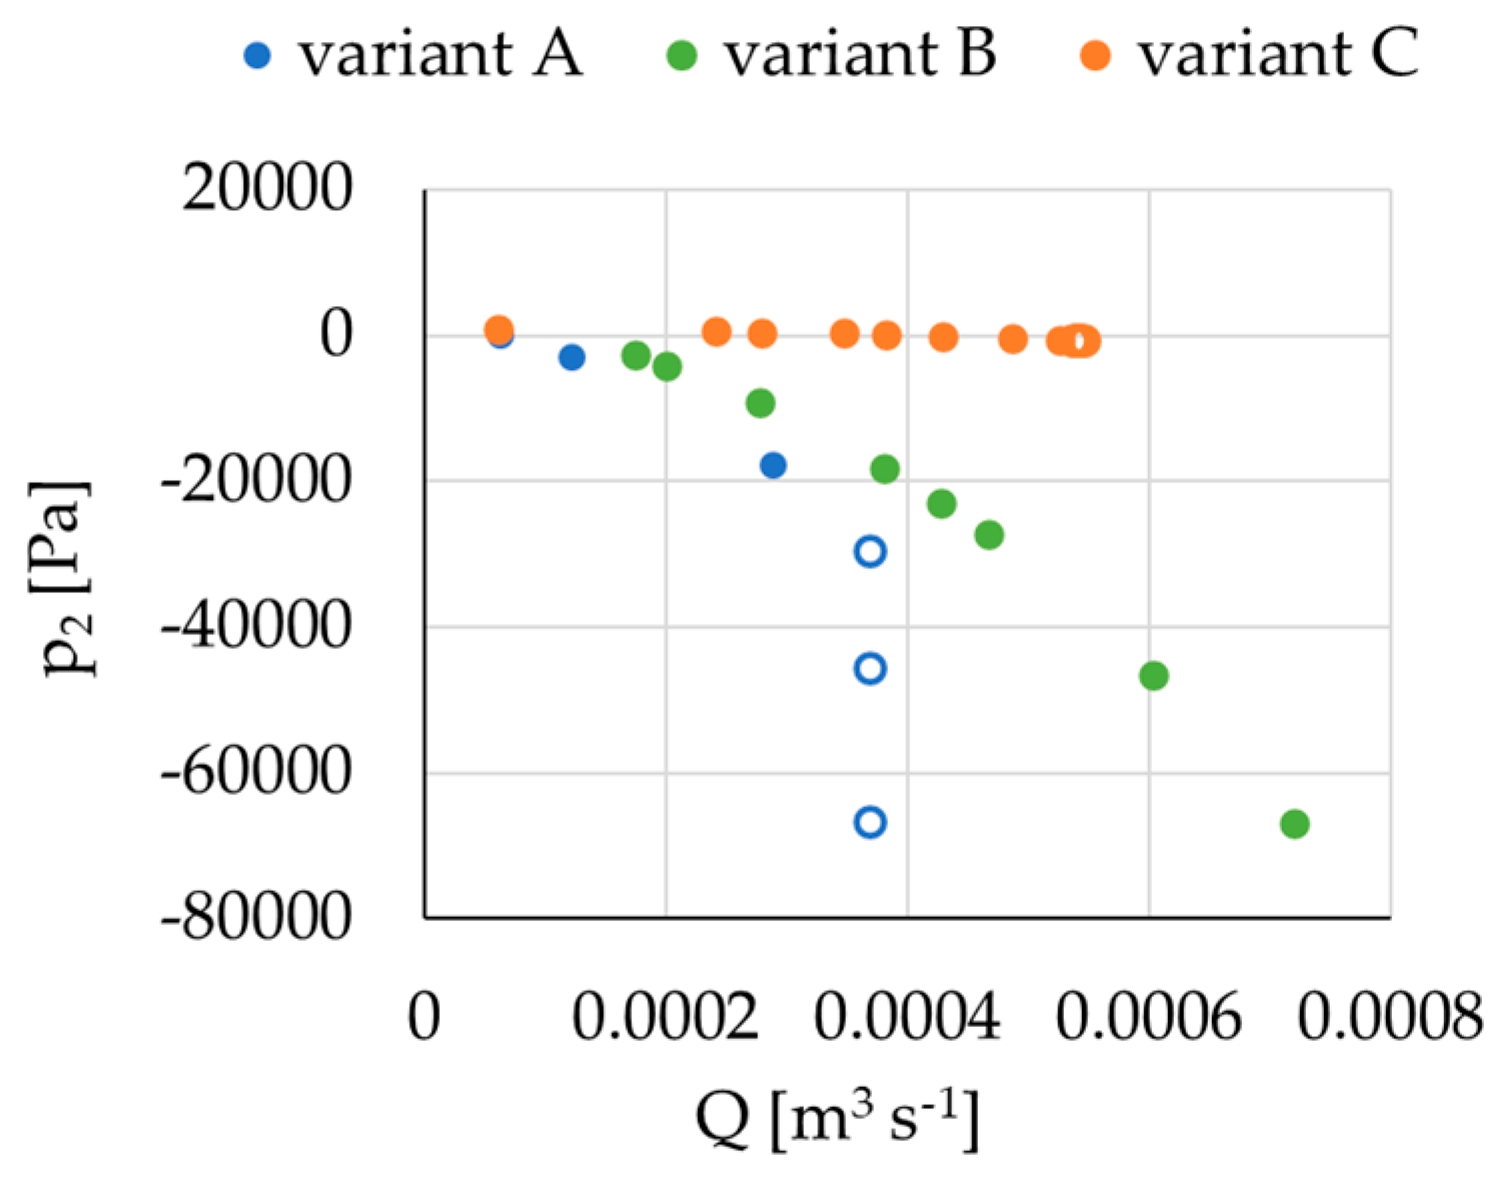
The pump inlet pressure was monitored and compared for all variants (A, B, C), as presented in
Figure 5. The converging-diverging nozzle in front of the pump (variant A) exhibited a steeper pressure drop in comparison with the pipe segment with a constant diameter (variant B). Furthermore, it is noticeable that from a certain value of the flow rate, it decreased significantly faster, which was due to the formation of cavitation. In the case of the straight pipe (variant B), the pressure drop was given only by the friction loss of the pipe. The nozzle placed behind the pump did not affect the pressure at the pump inlet, even if cavitation was observed.
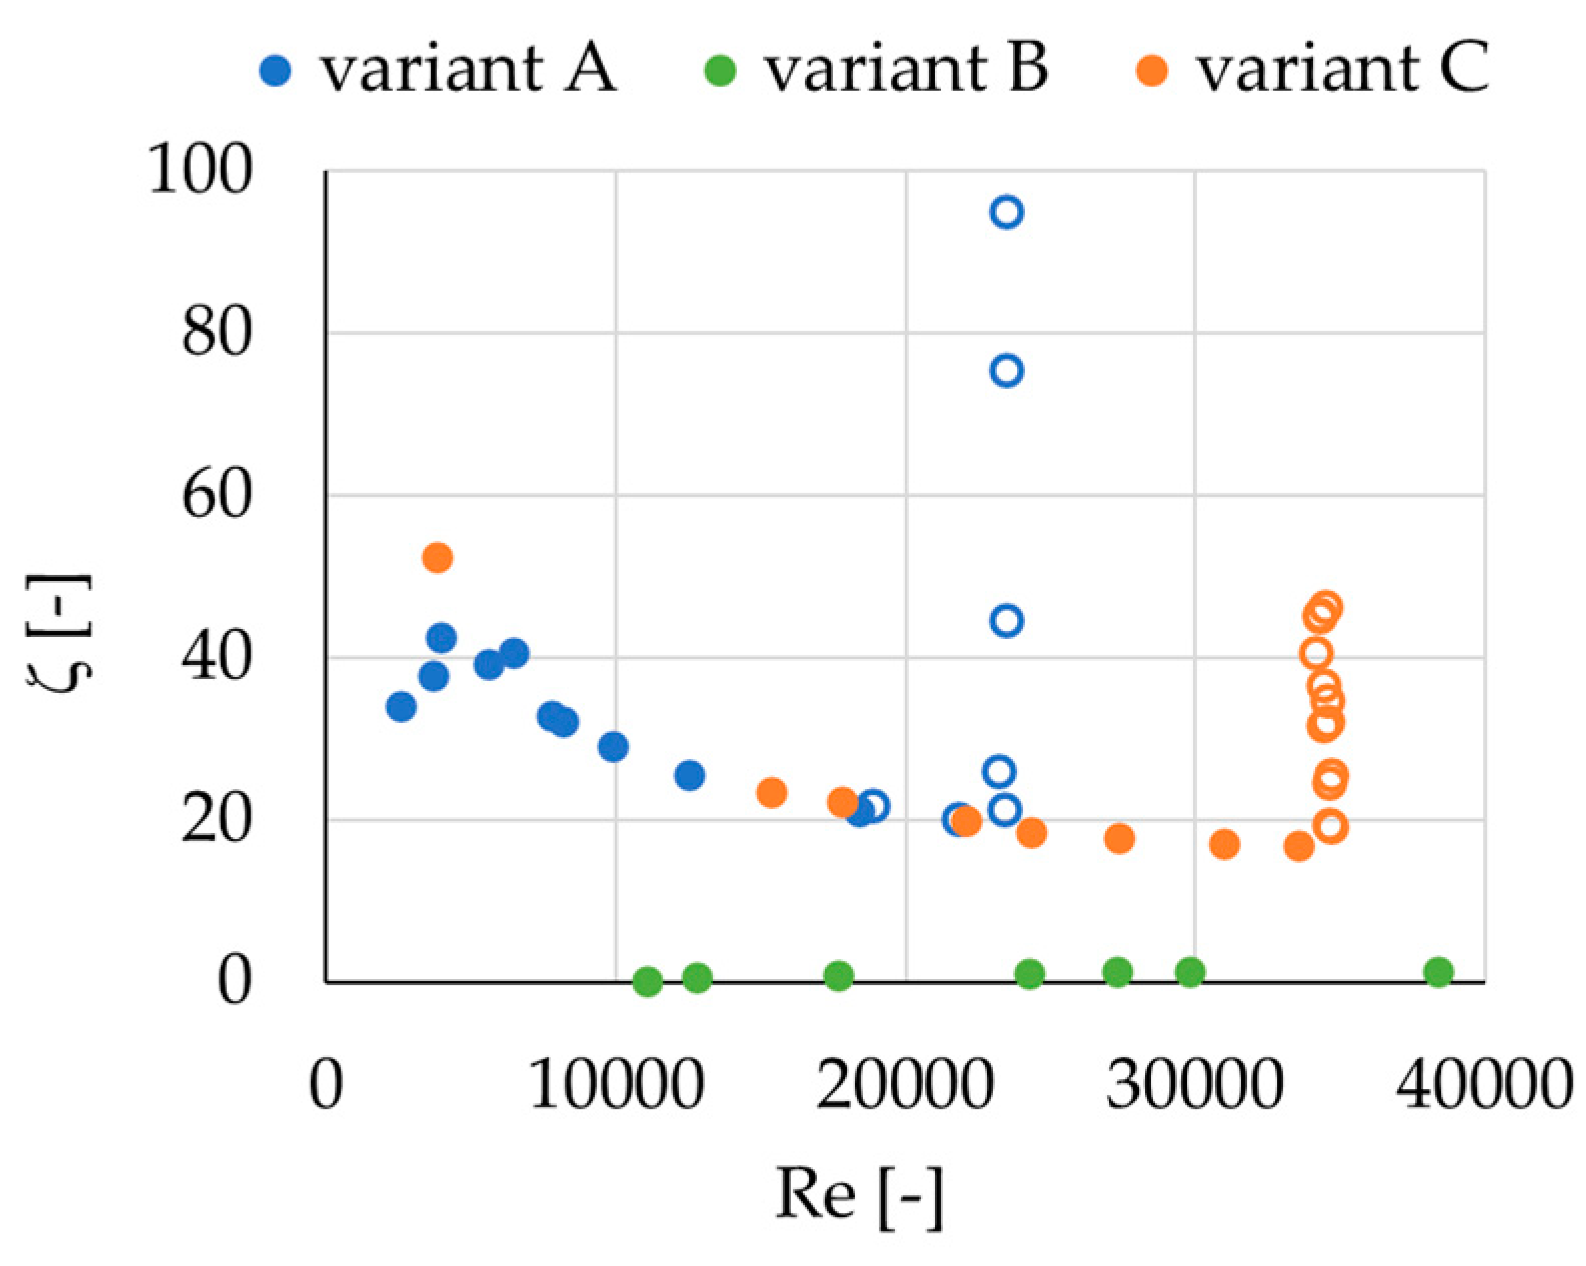
The loss coefficient
was evaluated from the pressure drop on the hydraulic elements Equation (3) and is presented in
Figure 6. In the non-cavitation region, the loss coefficient decreased with the Reynolds number in the case of all variants (A, B, C). The origin of cavitation did not impact the loss coefficient significantly, but with the developed cavitation, the loss coefficient increased rapidly.
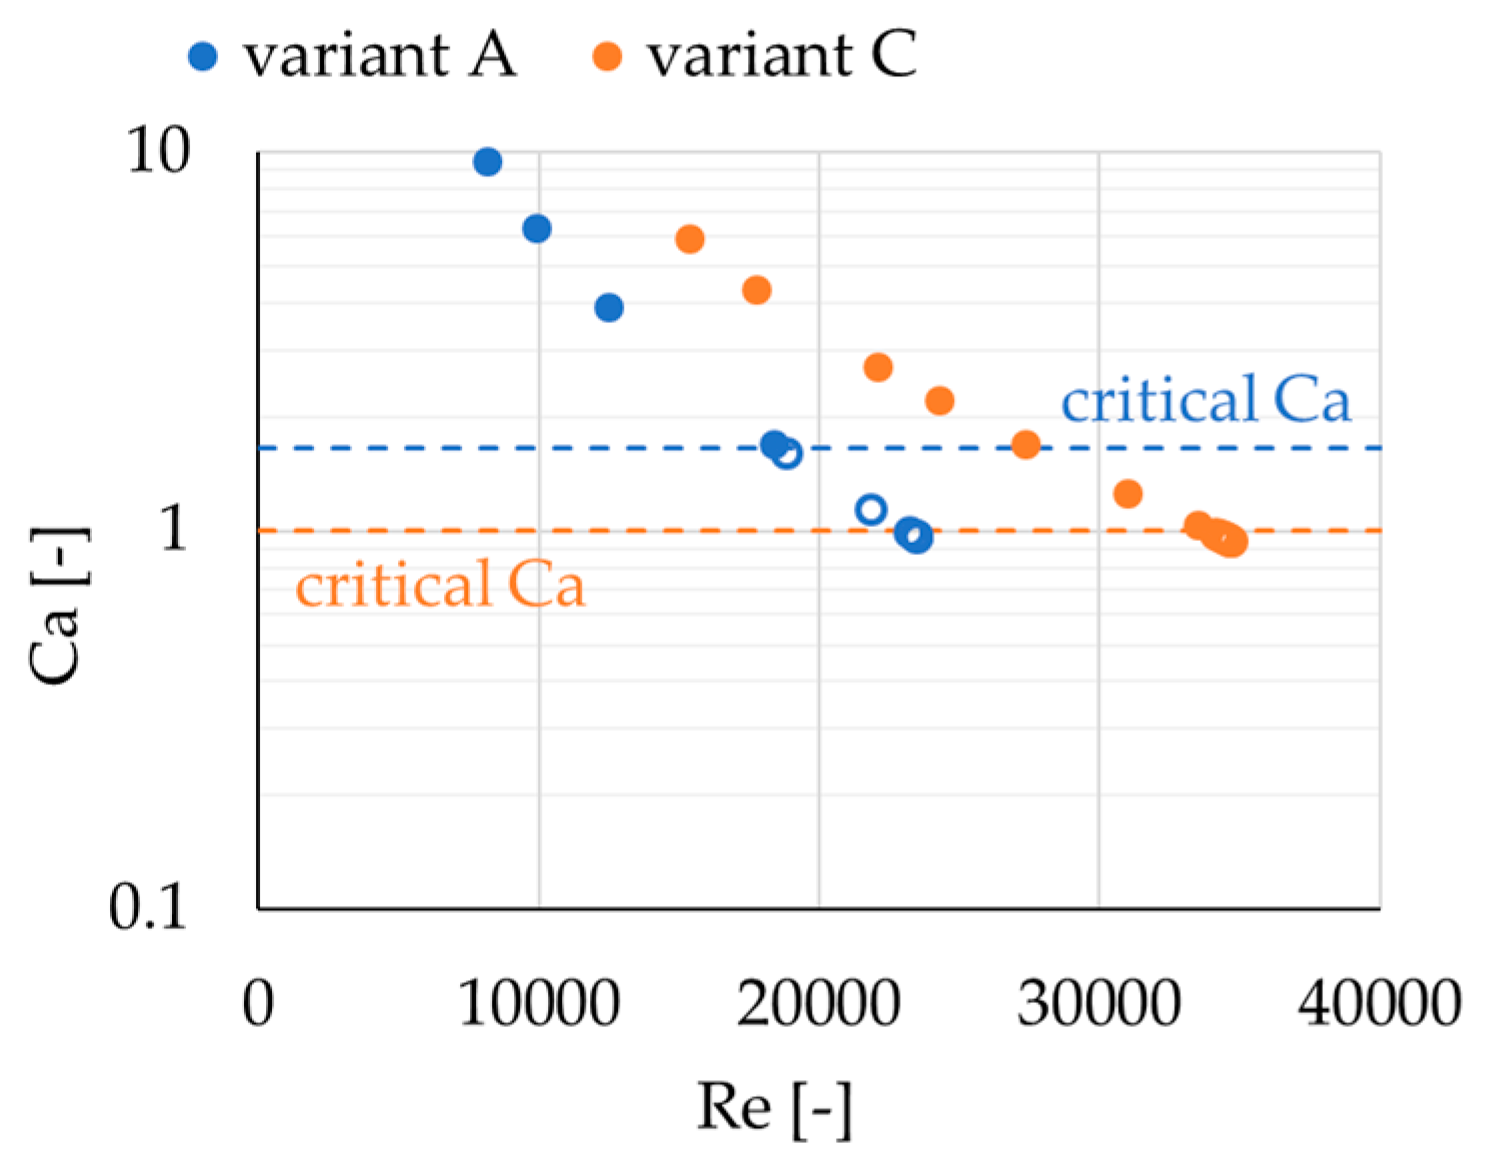
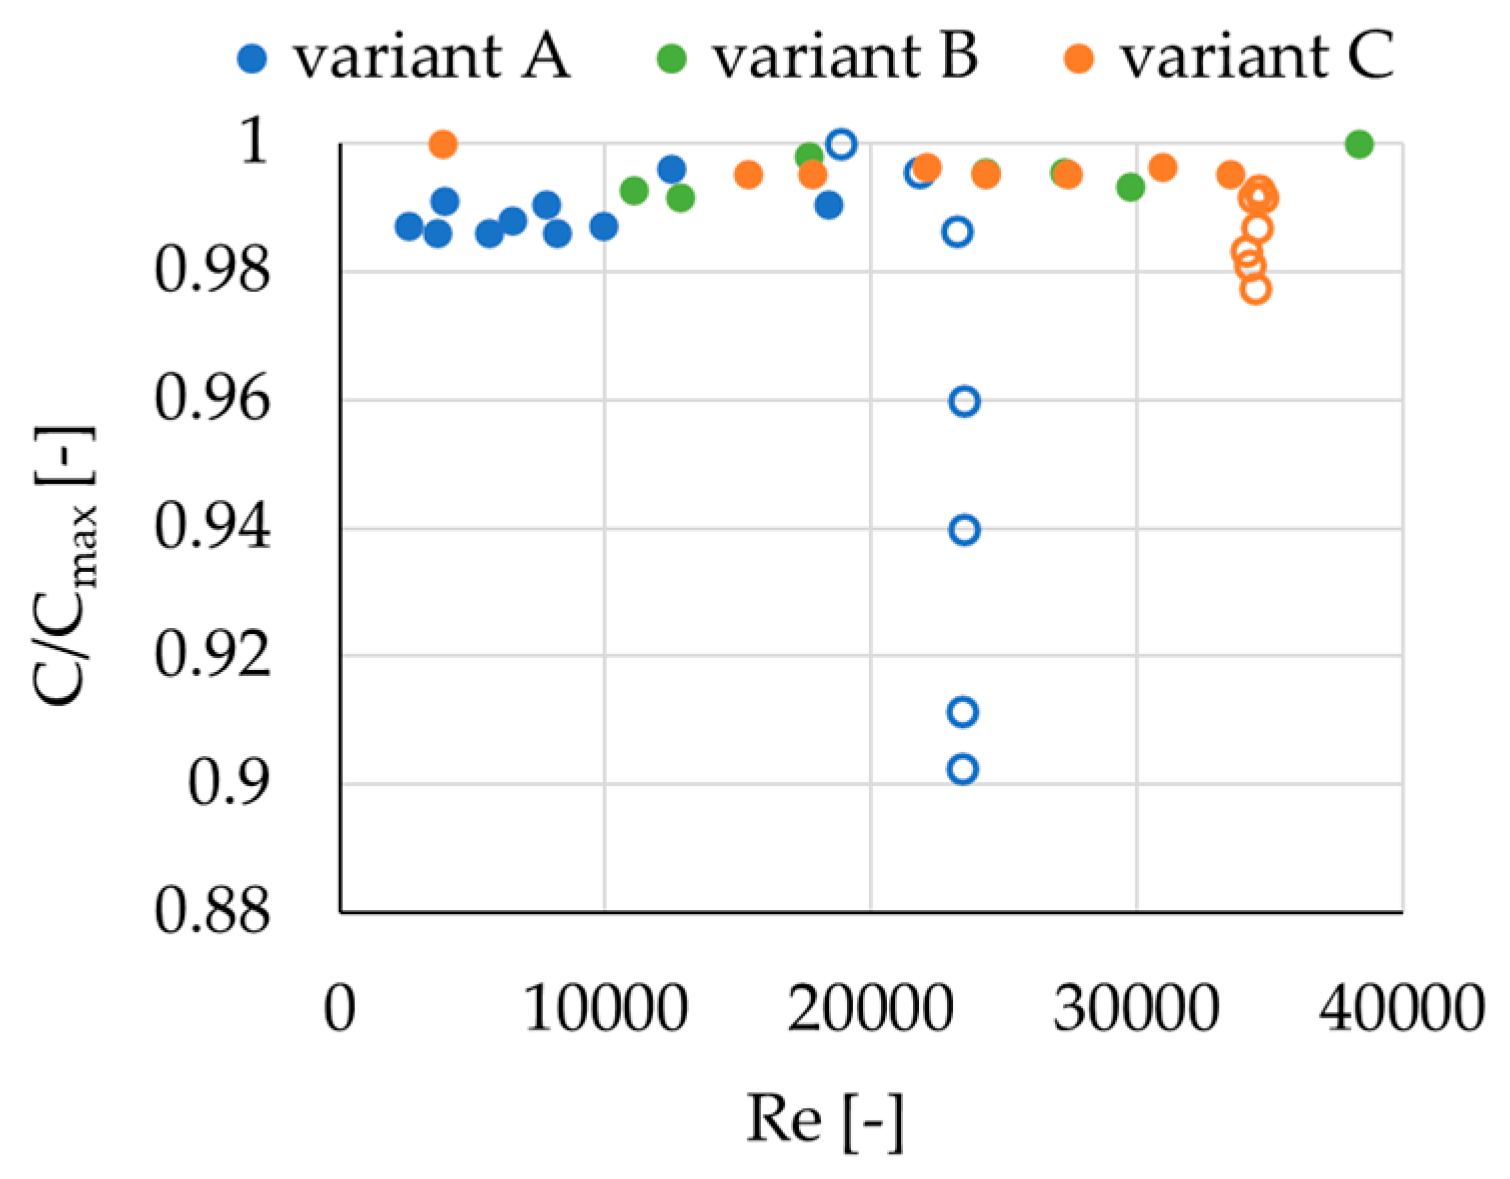
Figure 7 shows the dependence of the dimensionless cavitation number Ca on the Reynolds number for variants A and C. It is evident that a different critical cavitation number applied to the converging-diverging nozzle placed in front and behind the pump, so the problem could not be simply generalized.
In the case of variant A, the cavitation occurred at a lower Reynolds number and affected the formation of cavitation in the pump, as can be seen in
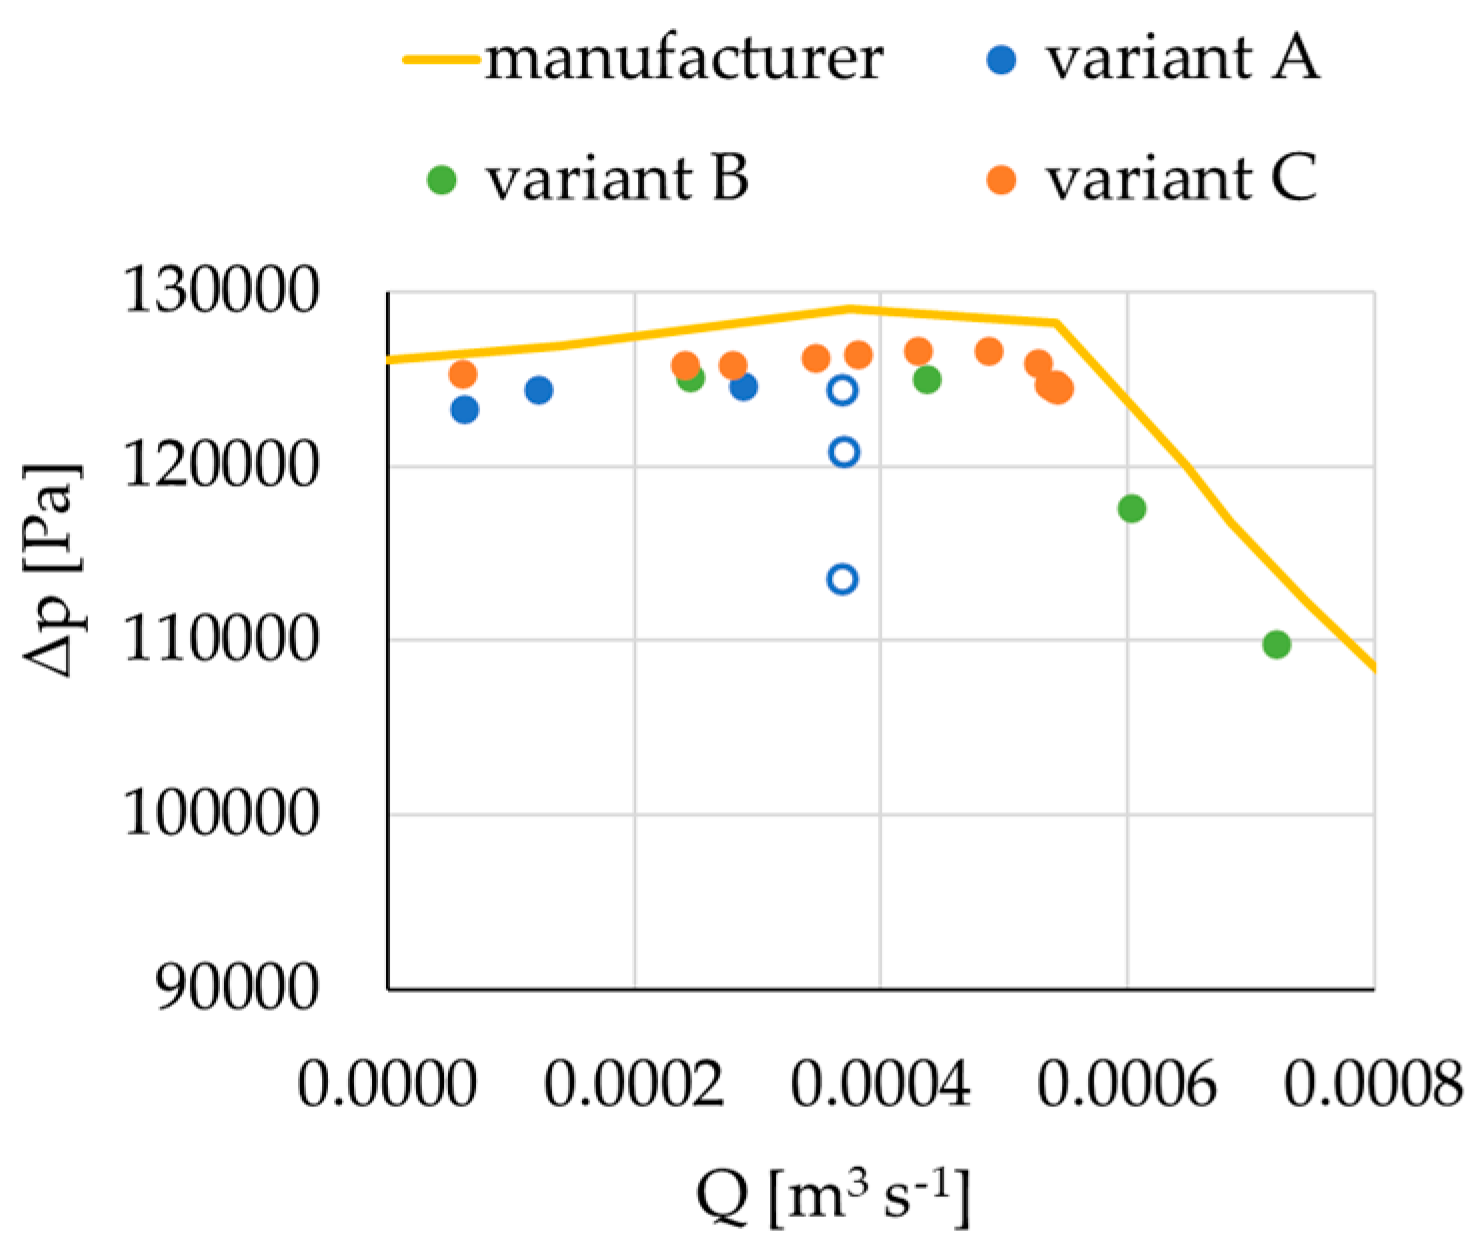
Figure 8. The effect of the cavitating element on the pump suction could be determined from the fall of the pump head. It is obvious that during cavitation, the pump characteristic deviated from the characteristic given by the manufacturer.
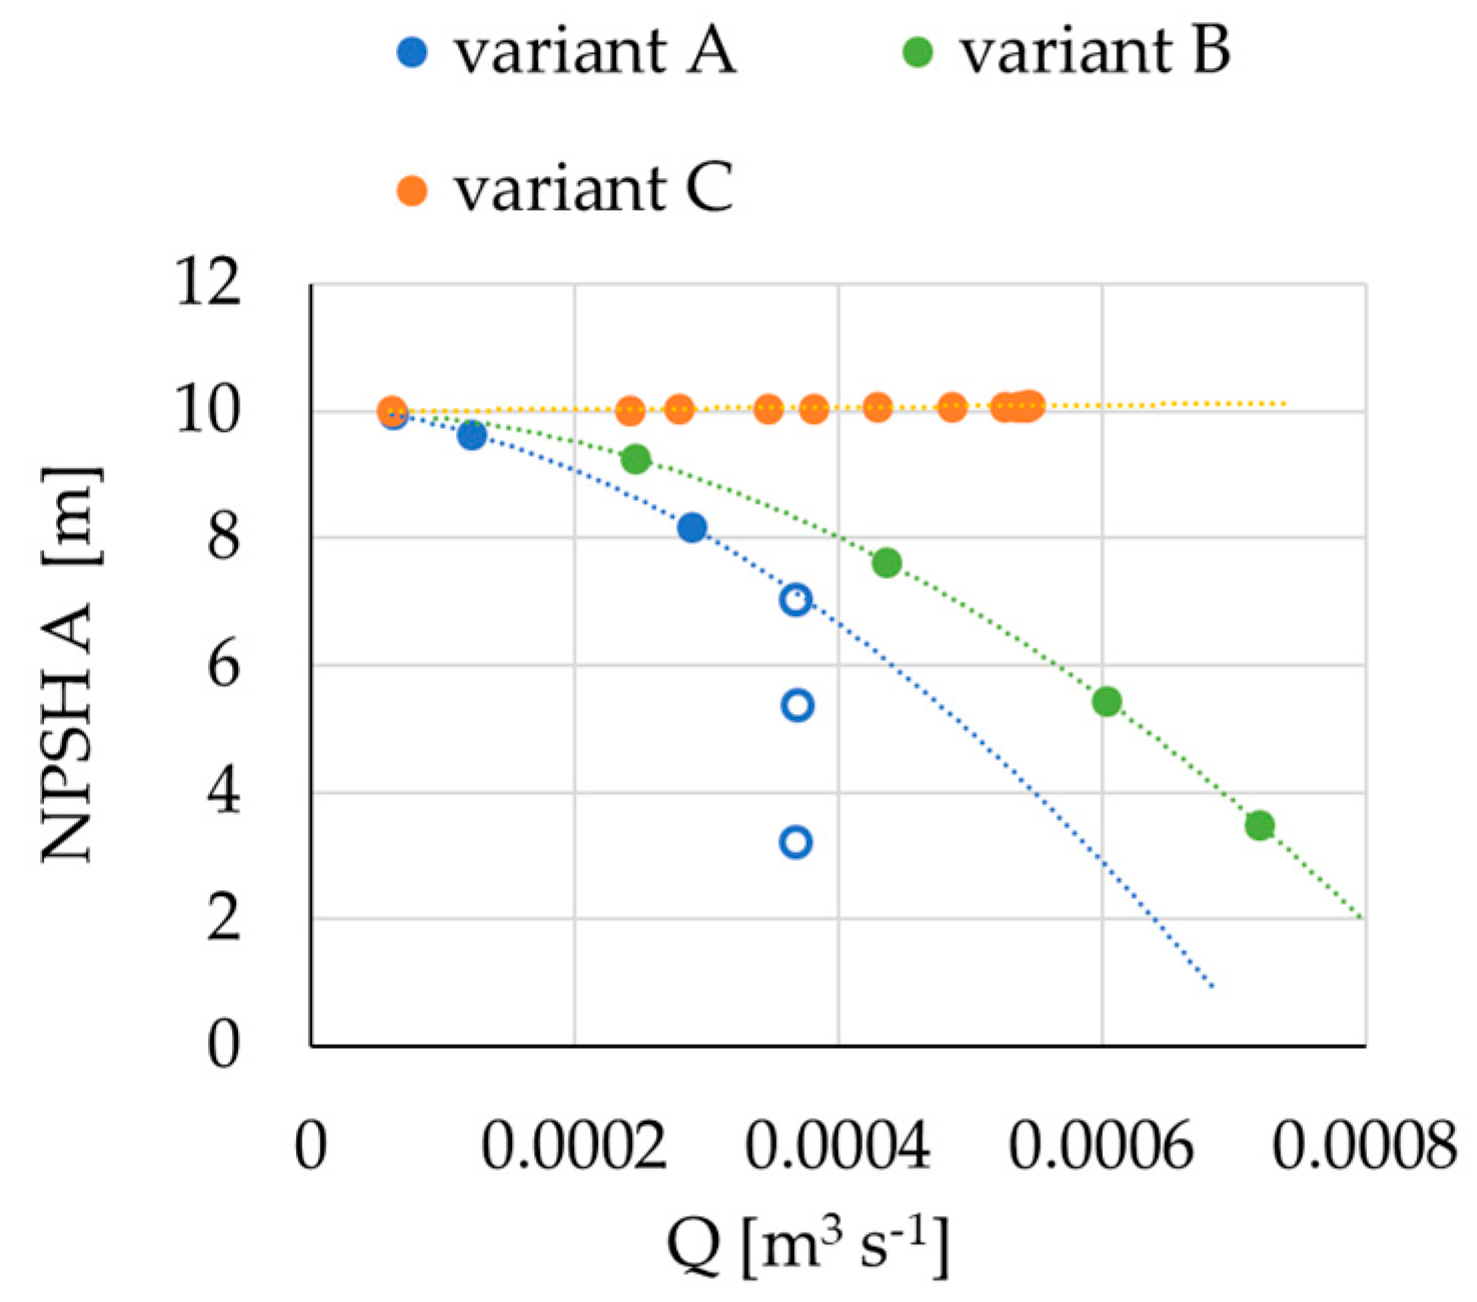
The course of the pressure at the pump inlet corresponded to the NPSHA according to Equation (1). A nozzle in the suction pipe led to an increase in hydraulic resistance and the formation of cavitation, thereby reducing NPSHA, as shown in
Figure 9.
Cavitation is characterized by the formation of a vapor phase and the release of air from water. The release of air is identifiable by measuring the oxygen concentration in the liquid. Simultaneously, nitrogen is also released, and the amount of released air can then be determined. This confirms the presence of the air cavitation besides the vapor cavitation. We can see that the measured relative air concentration is constant if cavitation does not occur in the circuit (
Figure 10). If cavitation fully develops in the circuit, then the relative air concentration will decrease. In variant A (converging-diverging nozzle located in front of the pump), the relative air concentration dropped significantly with Reynolds inlet number 23,000, which corresponded to simultaneous cavitation in the nozzle and pump.
5. Conclusions
The pump suction is very sensitive to the installation of any hydraulic resistances due to the reduction of pressure in front of the pump, thereby creating favourable conditions for cavitation. In the case of a hydraulic element located in front of the pump, it is necessary to design it carefully to prevent an irregular flow pattern inside the suction line and minimize the pressure drop at the pump suction in the entire range of the flow rate.
Cavitation has a significant impact on the characteristics both of hydraulic elements and the pump in the circuit. The hydraulic element located in the suction pipe significantly affects the characteristics of the pump. The pump head falls when the loss coefficient of the hydraulic element increases rapidly due to cavitation.
Suppression of cavitation and its consequences is generally possible in the following ways:
- -
reduction of air content (air bubbles) in the liquid,
- -
application of more resistant construction materials against cavitation,
- -
optimization of the construction of the impeller and hydraulic elements,
- -
increase of NPSHA or decrease of NPSHR.
Verification of the function of the hydraulic circuit with the pump when inserting the necessary hydraulic elements on the suction is possible through physical experimentation. The pump suction is very sensitive to the installation of any hydraulic resistances due to the reduction of pressure in front of the pump, thereby creating favourable conditions for cavitation.
In the case of a hydraulic element located in front of the pump, it is necessary to design it carefully to prevent an irregular flow pattern inside the suction line and minimize the pressure drop at the pump suction in the entire range of the flow rate.
In the straight pipe in front of the pump inlet (variant B), cavitation did not occur in the given range of flow (see
Figure 8). Thus, the conditions for the formation of cavitation are real and depend on the length, head (vertically placed pipes) and design of the pipeline.
In the case of placing the convergent divergent nozzle in front of the pump (variant A), cavitation occurred in the narrowest part, which affected the characteristics of the element (see
Figure 4) and the pump (see
Figure 8). The occurrence of cavitation was due to the resistance in the constricted part of the element. This geometry is similar for the valves; therefore, it is not advisable to install valves in the suction line.
In the case of placing a convergent divergent nozzle downstream of the pump (variant C), cavitation occurred in the element (see
Figure 4) but did not significantly affect the pump characteristics (see
Figure 8).
Based on the measurements, it can be concluded that the air content in the liquid plays a significant role in the formation of cavitation. The air concentration in a liquid can be measured and depends on the actual liquid temperature (which was constant during the measurement) and pressure. During cavitation, it was released from the liquid to the open air, which was confirmed by air content measurements in the tank (see
Figure 10).
Experimental measurement is dependent on the set up of the real hydraulic circuit and, above all, on the characteristics of the pump and the hydraulic element. It may be limited by operating conditions, sensors capabilities and the accuracy of the measuring procedure. In our work, the occurrence of cavitation was identified visually by means of transparent material of the hydraulic elements (see
Figure 2). In case of real components applied in the industry, the cavitation can be indicated by vibration and noise measurement. The characteristics of measured elements and pumps can be used as the basic inputs for numerical modelling.
The obtained results will be the basis for future research focused on the mathematical modelling of cavitation in other hydraulic elements (e.g., valves, ball valve, slide valve). Mathematical modelling assumes a good knowledge of the mathematical models and numerical methods of fluid flow with cavitation. For model of the flow in the hydraulic circuit, it is necessary to know the characteristics of the pump and hydraulic elements, i.e., loss coefficients and other characteristic parameters of the circuit and the liquid. A flowing liquid should be defined as a multiphase mixture of liquid, vapor, air and other gases. The boundary and initial conditions of the given circuit must be defined properly. This type of modelling can be a helpful tool for design and optimization of hydraulic elements and pump parts.


