1. Introduction
Climate change is a global issue, manifested by planet exploitation and degradation of the environment at an alarming rate [
1]. It has been accelerated by the increasing atmospheric carbon dioxide (CO
2) concentration, widely considered the main driving factor that causes the phenomenon of global warming [
2]. This increase was caused most likely by human activities [
3,
4] since they mainly depend on fossil fuel to produce energy, which releases different amounts of CO
2, water vapour, and nitrous oxides depending on the fossil fuel type [
5,
6]. More precisely, the manufacturing and industrial sectors are responsible for climate change since they decrease the amount of carbon that is stored in the environment and release additional greenhouse gases (GHGs) into the atmosphere [
7]. To measure these GHG emissions, a unified metric has been defined and is called carbon footprint, expressed in carbon dioxide equivalents (CO
2e) [
8]. To overcome these emissions challenges, the European Union (EU) decided to adopt a set of proposals, known as the European Green Deal, to transform the EU into a modern, resource-efficient and competitive economy, with zero net emissions of GHG by 2050, economic growth decoupled from resources use while neither person nor place to be left behind [
9,
10].
AM is an upcoming and promising process used in the industrial sector [
11,
12]. As defined by the American Society for Testing and Materials (ASTM), AM is the process of joining materials to make parts from 3D model data, with the material usually joined layer upon layer, as opposed to other subtractive and forming methods of manufacturing [
13]. Frameworks for the reduction of carbon emissions in the manufacturing industry have previously been applied [
14] and the sustainability of conventional processes has been examined. However, since AM is a novel process, it must be examined from an environmental point of view as well, to ensure its sustainability. Life cycle analysis is a technique that is frequently used to assess how AM processes affect the environment. It takes into account every stage of a product’s life cycle, from the extraction of raw materials to disposal and makes it possible to evaluate variables including energy usage, carbon emissions, and resource utilisation [
15]. What is more, due to its ability to enable on-demand production, lower waste generation, and encourage material reuse, AM has the potential to aid in the development of a circular economy. Considerations for AM evaluation from a circular economy standpoint include recyclability, remanufacturability, and material recovery [
16].
Analysing the energy usage of AM processes is also essential for determining their sustainability. Examining the energy needed for machine operation, post-processing tasks, and material processing is part of this. It is necessary to take into account variables like machine efficiency and utilisation rates [
17]. Additionally, by enabling accurate and personalised production, AM has the ability to reduce material waste. Analysing elements like material consumption, powder reuse, and recycling options is necessary to assess resource efficiency and material waste [
18]. Different studies have reviewed the overall sustainability of AM [
19,
20,
21] with some having applied a framework to reduce product environmental impact through design optimisation [
22] or via estimating the net changes in life cycle primary energy and GHG emissions associated with AM technologies [
23]. The carbon footprint of fused metal deposition (FDM) has also been previously estimated [
24], but most studies focus on the energy consumption of these processes [
25,
26].
This paper aims to estimate the carbon footprint of SLA with the use of a previously developed carbon emissions framework [
27,
28]. This framework is based on a holistic approach [
29], that takes into consideration theoretical calculations for carbon emissions using carbon emission factors (CEFs) [
30] and the principle of manufacturing levels [
31]. The next sections are organised as follows.
Section 2 describes the materials and methods used for this case study. It explains the manufacturing levels, the holistic approach for the calculation of carbon emissions and the carbon emissions framework. It also includes all the materials needed in this case study, such as the equipment used.
Section 3 presents how these materials and methods were applied to an SLA case study, along with the results that were collected. With the use of data from the printing, the energy spent during SLA is calculated and the carbon footprint is estimated via the holistic framework. The level that causes most of the emissions is determined and the final results are presented with plots and Sankey diagrams.
Section 4 and
Section 5 are about Discussion and Conclusion and Future work, respectively.
2. Materials and Methods
In this section, the materials and methods used for the completion of this work are described. Firstly, the principle of manufacturing levels is explained, followed by the holistic approach to carbon emissions calculation. The AM-specific framework for carbon calculation is presented and applied to the SLA case study, while information about the life cycle assessment is presented.
2.1. Manufacturing Levels
The same approach has been proposed by Fysikopoulos et al. [
31] for manufacturing processes, with four main levels identified, namely process, machine, production line, and factory. Process level “concerns the energy interactions related to the physical mechanisms of the process itself”. Machine level “includes the process level as well as all the required machine peripherals that ensure proper machining conditions”. Production line level “refers to a group of different machines and any other peripheral devices that may be required for the proper function of a production line” and lastly, factory level “comprises several different production lines that may interact and include peripheral devices, required for the proper function of the entire factory”.
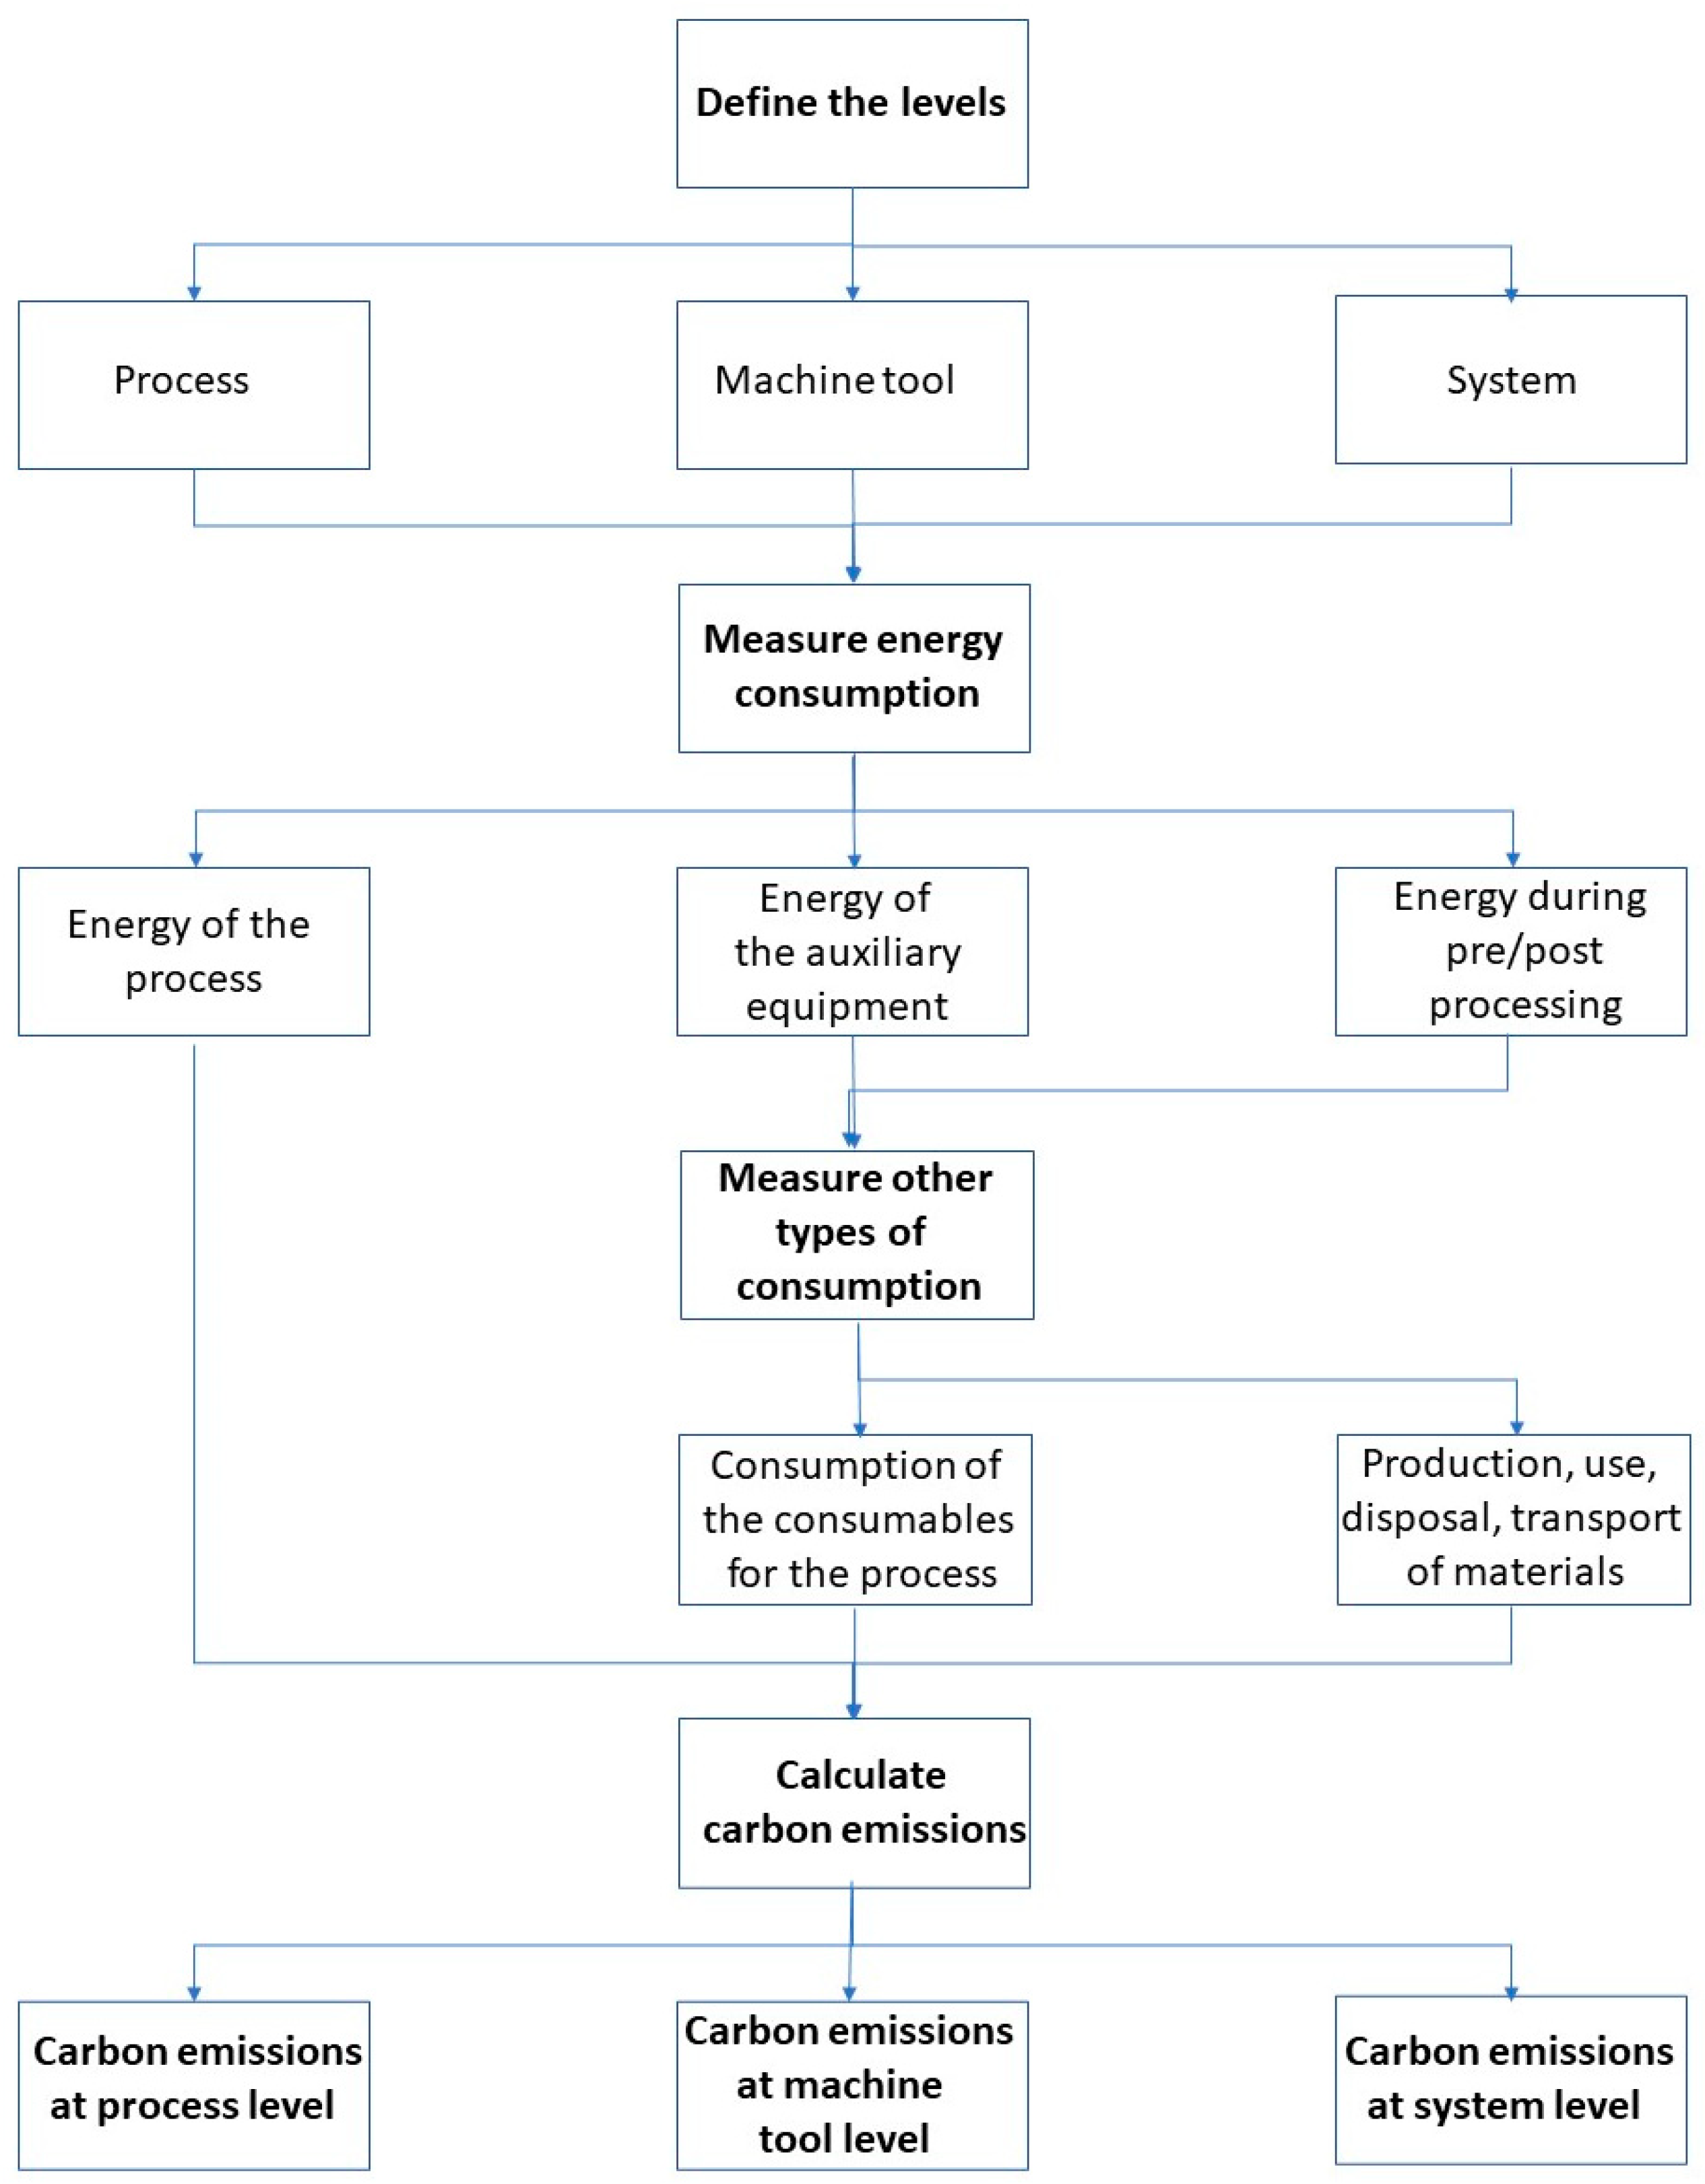
In order to estimate the carbon emissions of AM, a helpful step would be to first categorise the AM into levels (
Figure 1). Carbon footprint has to be defined separately for each AM level since it is affected by a set of factors of quite divergent nature. This classification allows for the easier study of emissions. To adjust this classification to AM, three levels were chosen. Process level includes the steps of every AM technique that are related exclusively to the process. Machine tool level includes the emissions of process level, as well as those derived from the auxiliary equipment and the consumables. System level includes the emissions produced in the machine level increased by those of the material creation, transportation and disposal, and the actions that take place before or after the printing process.
2.2. Holistic Approach for Carbon Footprint Calculation
This holistic approach was developed by Panagiotopoulou et al. [
29], where the carbon emissions are calculated based on the CEF. An electrical grid has one or more primary energy sources, which affect CEF, depending on the mix of power sources used, as in percentage of fossil fuels and renewable resources.
The carbon emitted, due to energy consumption, can be calculated by the following equation:
is the carbon emitted due to consumption, the energy consumed and the carbon emission factor.
Based on this equation, a holistic framework can be developed and applied to every AM method. This derives from the generalisation of the “Levels method” mentioned previously. Thus, it can be said that the carbon emissions at process level
come exclusively from the energy spent for curing
:
In the machine tool level, the carbon footprint depends on the energy spent at the process level, by the auxiliary equipment
and by the consumables
.
The carbon emissions at system level
are given by the energy spent at the machine tool level, the emissions related to the material
) and by pre/post-processing
.
2.3. Framework for Carbon Footprint Calculation in Additive Manufacturing
The holistic framework mentioned in
Section 2.2 can be further explained per level. At process level, things are very specific, as the only thing taken into consideration is the energy spent exclusively for curing the main part and the support structure (Equation (2)).
At the machine tool level, the carbon emissions are given by Equation (3), where the consumables can either be liquid (
or gas (
:
Regarding the auxiliary equipment, any of the followings can be included depending on the AM method used:
Therefore, whether the material is liquid, powder, or solid, every method requires a material dispenser . In some methods, the product is constructed on a build platform (), whilst in others, the head moves layer by layer (). Recoaters are occasionally required to guarantee the smoothness of each layer (). Respectively, there are methods that need a heater ( for the proper material use, while most of the printers have some lighting for easier utilisation of the machine (). Regarding the laser-based methods, carbon emissions are created by both the galvo motor system () and the laser unit (. Lastly, special conditions may require the use of gas ( or pressure ( in the building environment.
The carbon emissions of the material can be separated in three stages [
29], the emissions of the production of the material
, the transportation
and the disposal
:
Regarding the pre-processing, it is common and standard for all of the AM techniques. To create an AM product, a design must be made (
using the appropriate software (e.g., AutoCAD, CATIA, etc.). This design is then translated with the use of a specific AM software (
The last step before the beginning of printing is the preparation of the printer, so as to define the number of layers and their thickness
.
Post-processing activities can vary depending on the process, the material needs, and the desired result of the product. Products that are made from powder materials most often require compressed air cleaning afterwards (
, while resins need a chemical bath (
). For better material qualities, the final product may be cooled down by a fan
or put in a UV oven (
) for further curing.
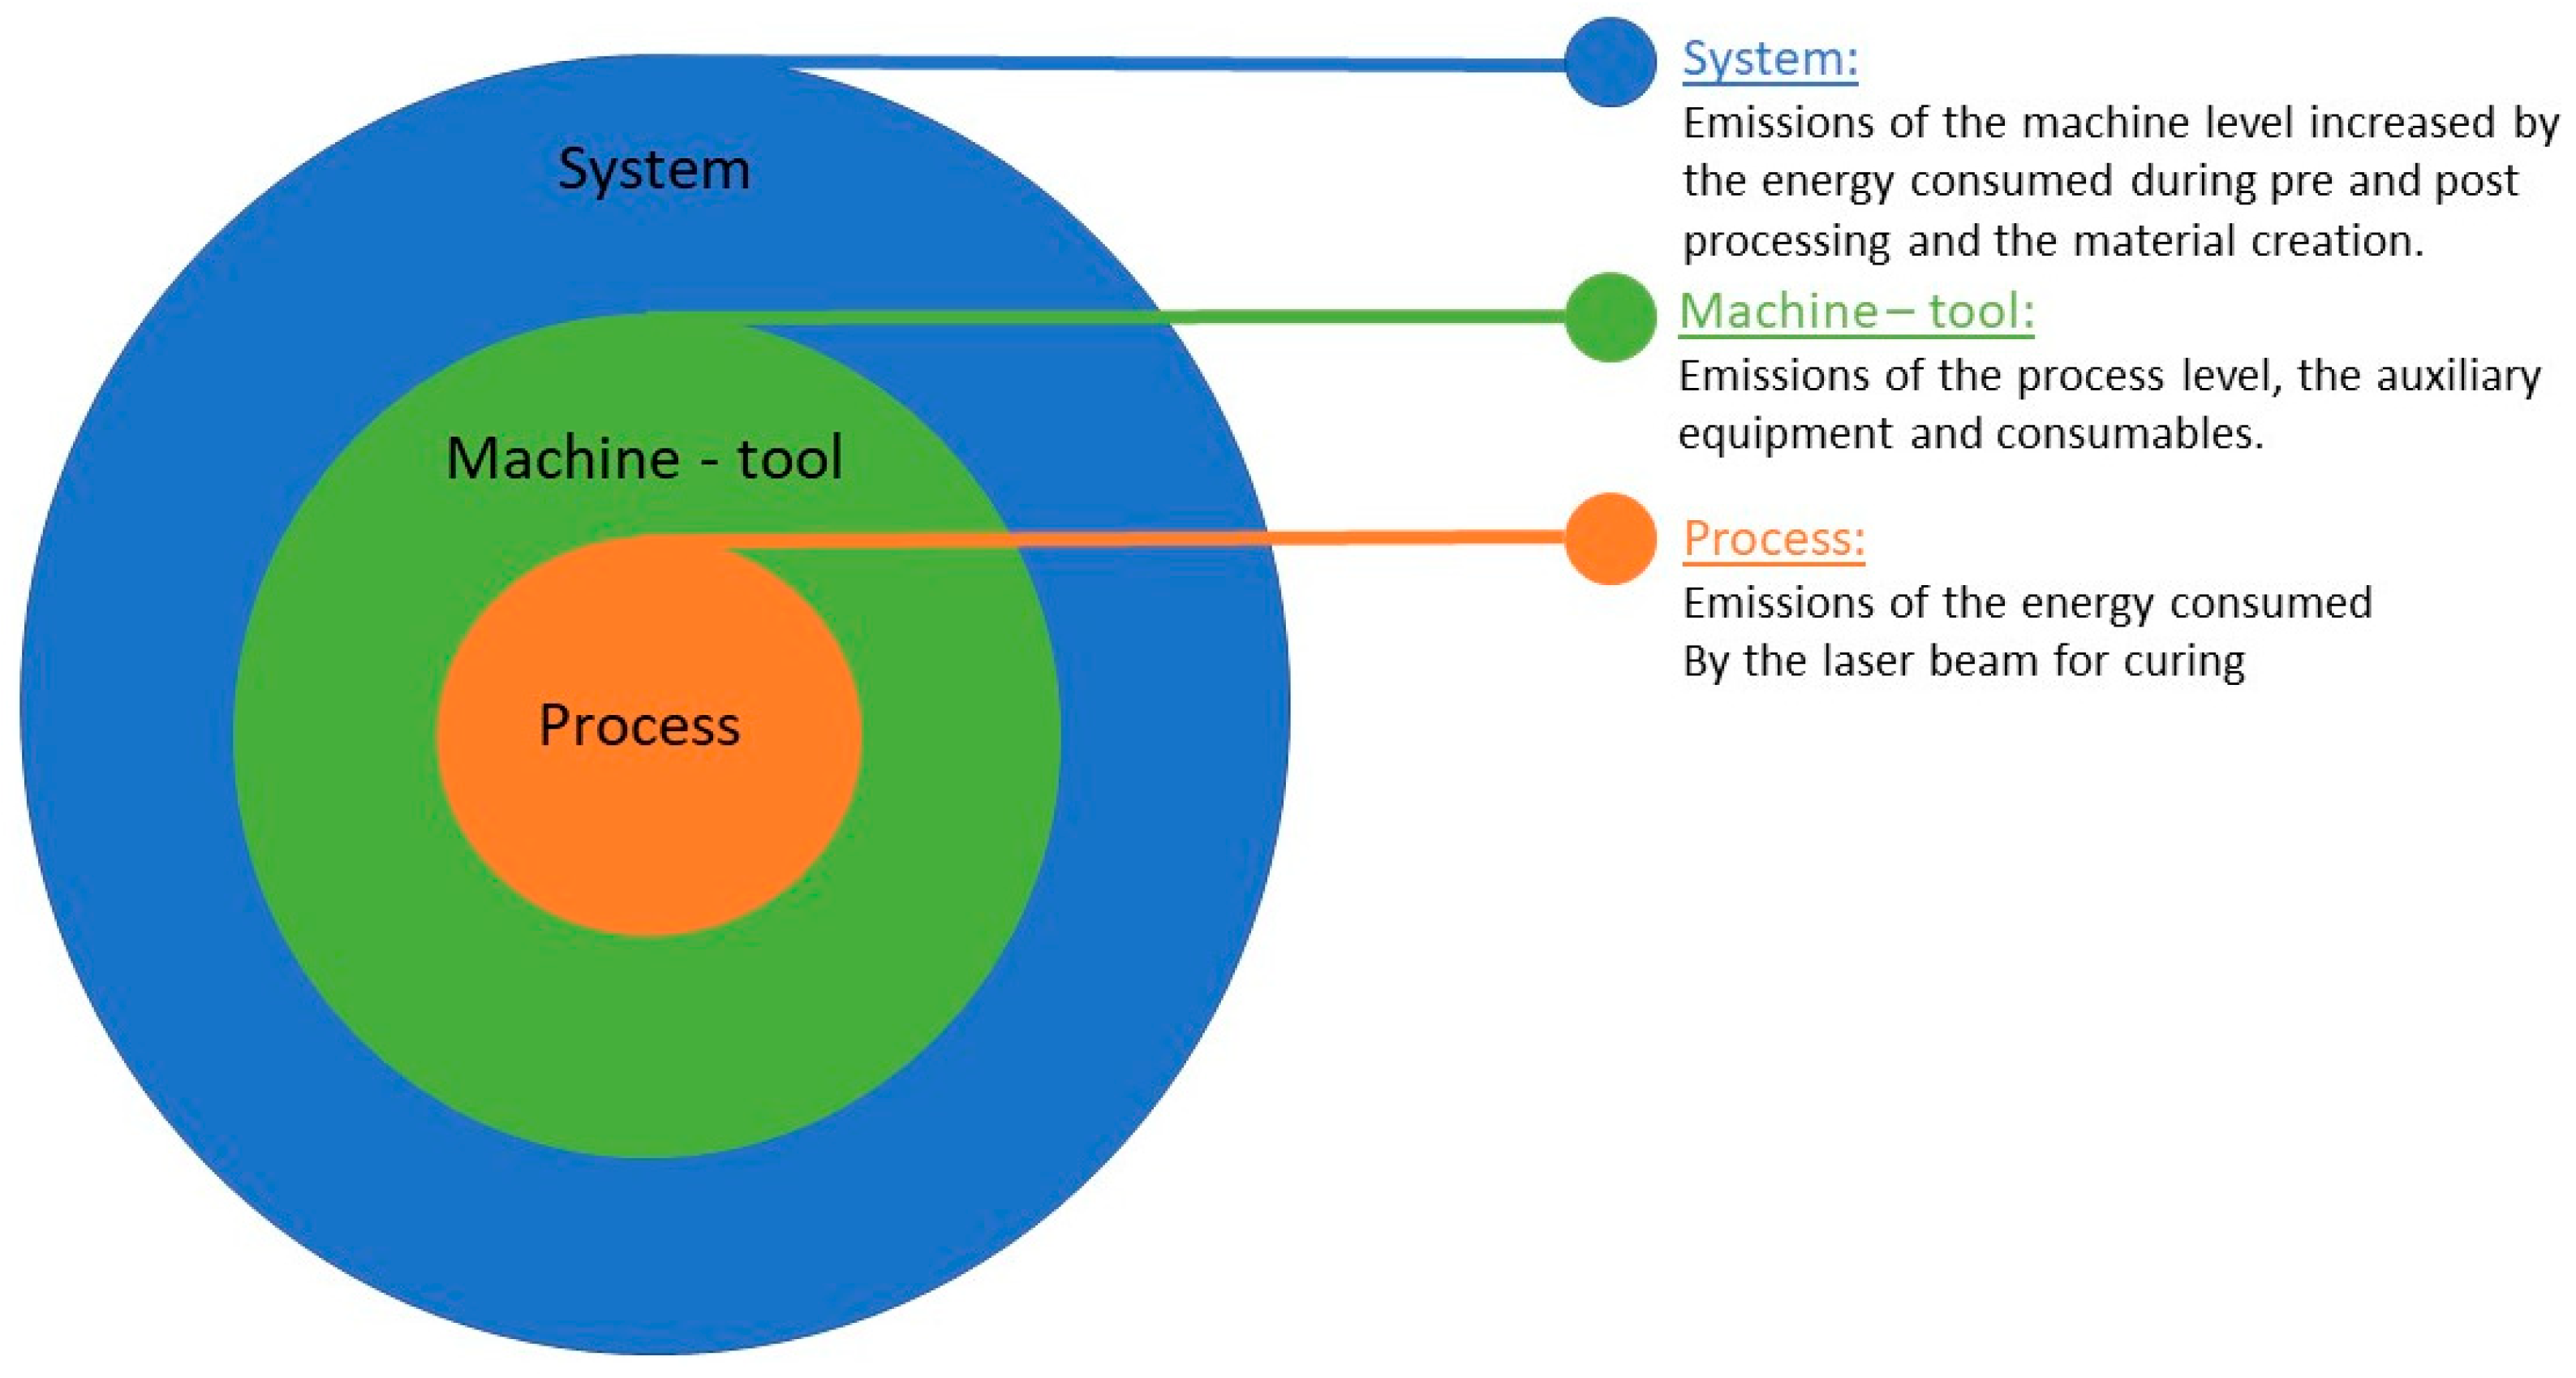
The holistic framework for carbon emissions in AM explained above is presented in
Table 1. This table shows the equation used in every level of the process. A more schematic view of the framework can be seen in
Figure 2.
2.4. Case Study
Stereolithography is a powerful AM technique that enables the creation of complex, high-precision parts with exceptional accuracy and detail. In this case study, the carbon emissions of this process are examined, validating the carbon emissions framework [
27,
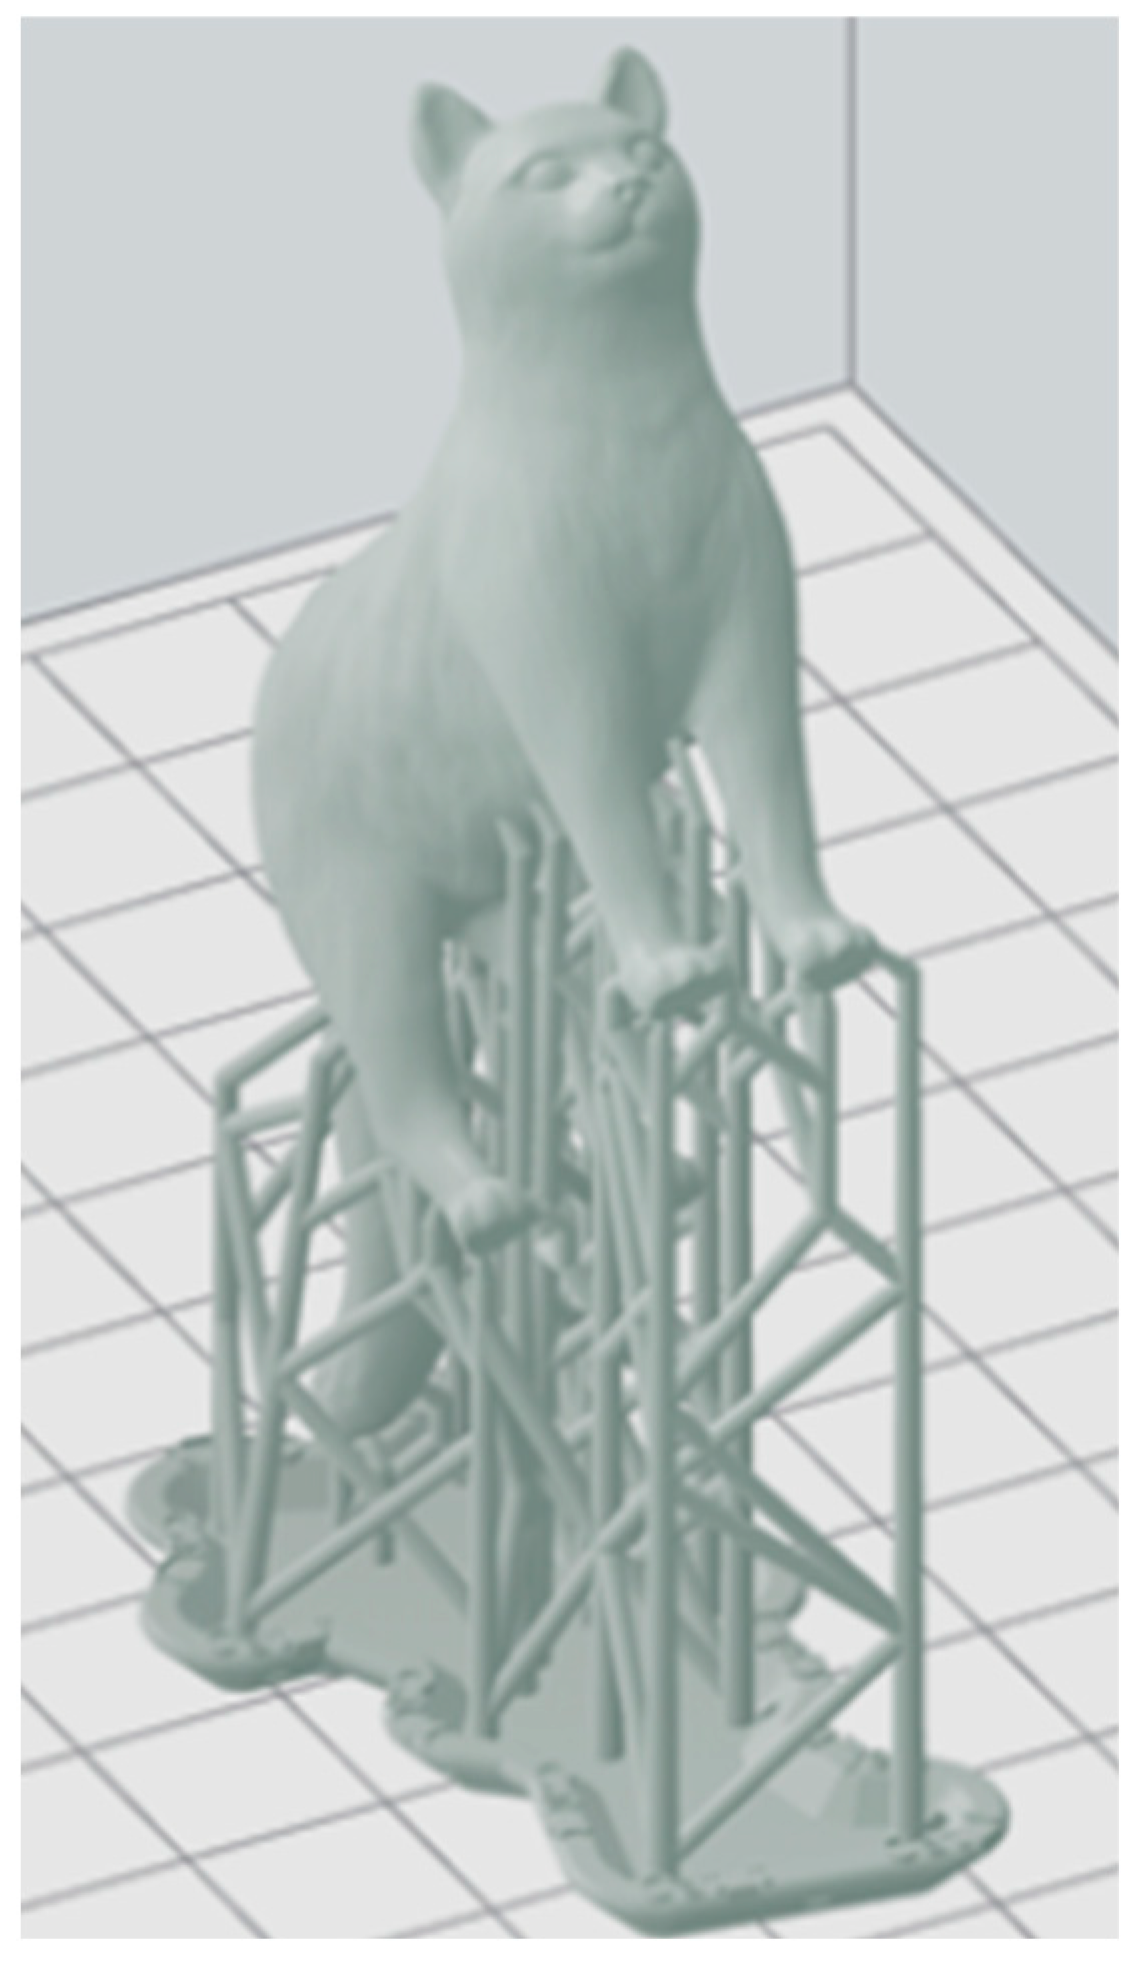
29]. For this case study, the part shown in
Figure 3 was printed via SLA, using the Form 2 Desktop Stereolithography 3D Printer by Formlabs, and examined regarding its carbon emissions. The volume of the part, including the support structure, was 11.13 mL, whereas 9.66 mL was the volume without the support.
The first layers to be printed serve as support and then, for each layer, both the support structure and the main part are cured. The part was printed from bottom to top. A focused laser beam aimed at the bottom of the resin tank cures the necessary points. Once a layer is complete, the build platform moves upwards to detach the printed part from the bottom of the tank, and the recoater distributes the resin evenly for the next layer to be cured. After the completion of the printing, the part has to dry at room temperature to get solid. Then, a double chemical bath using IPA takes place for the remaining resin to be removed.
2.5. Carbon Emissions Calculation
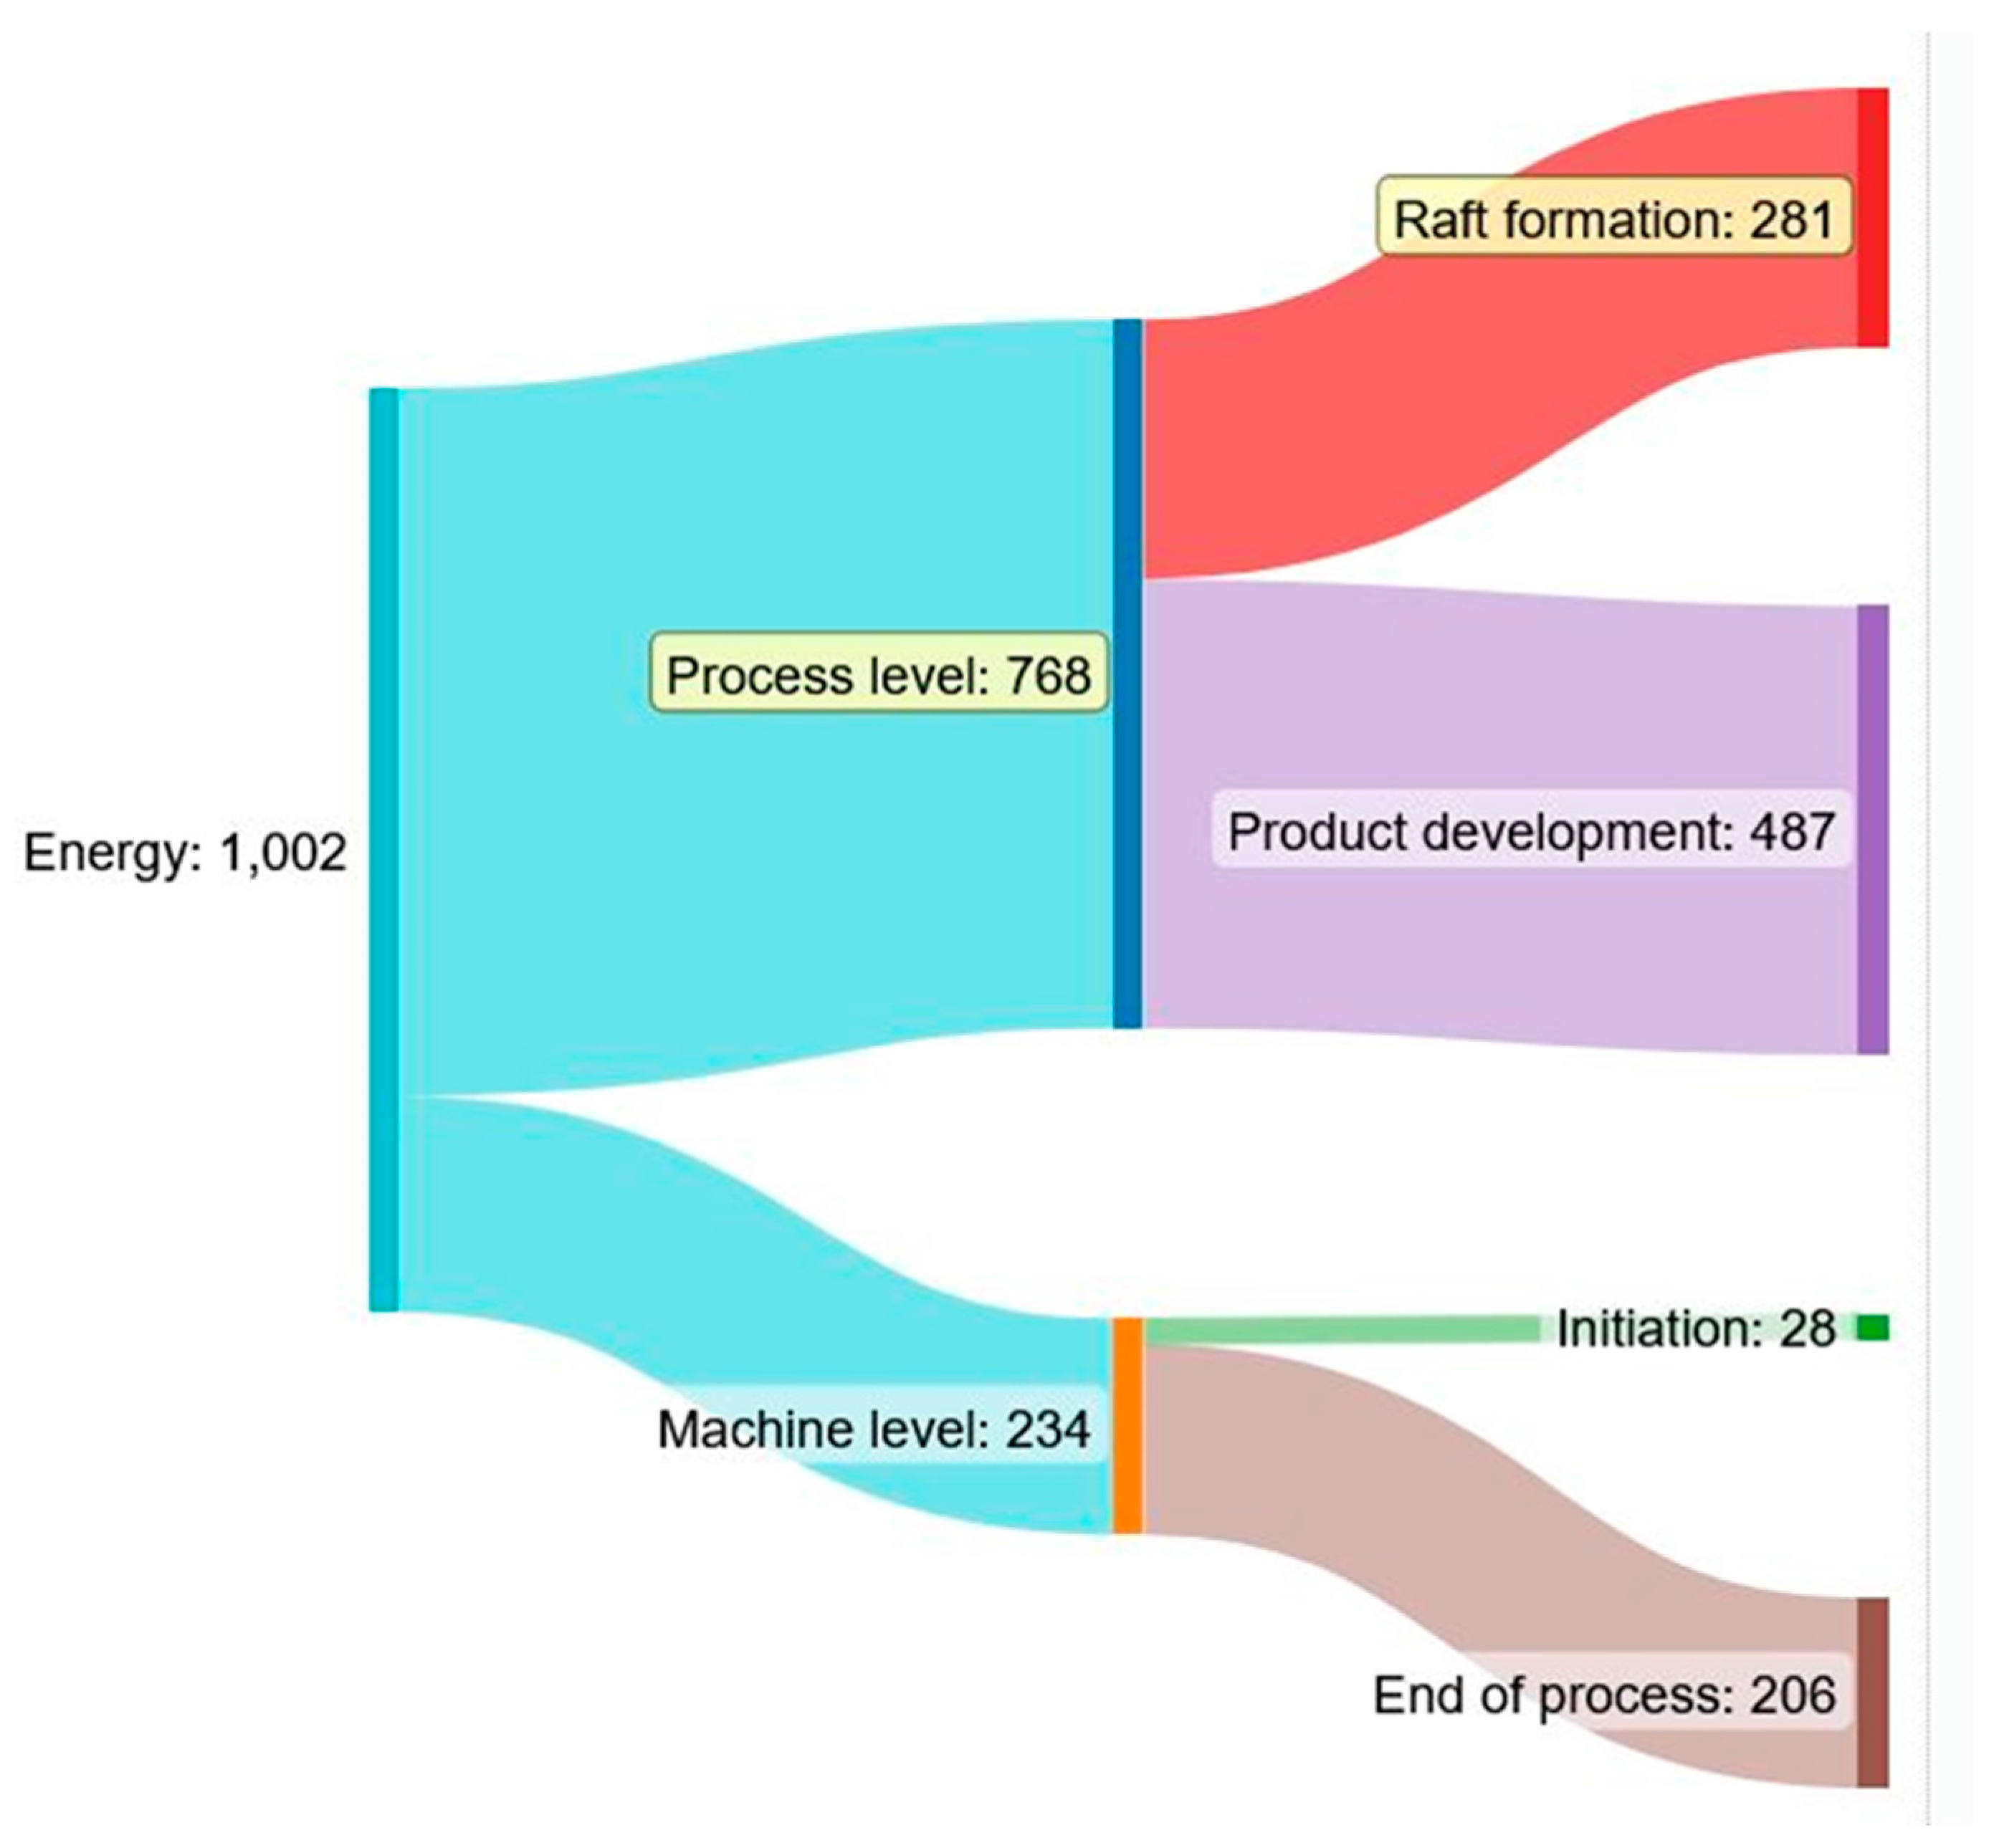
The current used throughout the process of this case study was recorded and presented in a current–time plot. From this current and knowing that the voltage of the printer is equal to V = 240 V, the corresponding power was calculated using Ohm’s law. Then, it was possible for the energy to be estimated and the mean energy of every part of the process (process initiation, raft formation, product development, end of process) was the one used for estimating the carbon emissions. From this mean energy, a Sankey diagram, a visualisation used to depict the flow of energy through the different stages of the process, was also created (
Figure 4). In this case, the sum of the mean energies of every process part is the input and the diagram shows how it is transferred and utilised per part and per level.
The carbon footprint for electricity-related emissions was calculated using SimaPro (9.3.03, PRé Sustainability B.V., Amersfoort, The Netherlands), in combination with Ecoinvent Database 3.1, assuming “Allocation, default system model” as models for the carbon footprint. For the material consumption, the resin [
32] and the IPA [
33] used for the post-processing bath, the carbon emissions were calculated based on the amount of material used and the CEFs.
3. Case Study
The results collected from the application of the holistic carbon emissions framework in the SLA paradigm are presented here.
3.1. Manufacturing Levels of SLA
SLA steps can be categorised per manufacturing level: process, machine tool and system level. The process level includes the steps related to the curing by the laser beam, meaning the curing of the main part and the support structure. The machine tool level contains all the steps related to the auxiliary equipment, helping with the operation of the printer, while the system level is about pre- and post-processing and material creation. What is more, some steps should also be mentioned that are not directly related to the printing. These are the transportation and disposal of the material used, and the lighting of the printer, all of which belong to the system level.
3.2. Carbon Emissions
Prior to calculating the carbon emissions, a Sankey diagram was made to show the different energy streams for the SLA case study (
Figure 4). It shows that the energy used during the SLA process is either on a process or a machine tool level, with the majority being on the process level. On the process level, most of the energy is on product development, followed by raft formation. On the machine tool, the majority of energy is consumed while ending the printing, and the least amount of energy is used for the initiation.
The material used for printing was Draft v2 resin with a relative density equal to 1.02 g/cm
3. Since the CEF for the production of this resin specifically could not be found, the factor used in this paper was decided to be equal to 4.523 kg CO
2eq per kg of produced resin. Τhis was obtained by averaging three different kinds of resin, namely polyvinyl chloride (PVC), polypropylene (PP), and polyethylene (PE) [
34]. Additionally, for the IPA bath, the CEF of this consumable was 1.85 kg CO
2e per kg of produced IPA [
33] and lastly, the CEF of electricity used in this paper was estimated via SimaPro.
Table 2 gathers all the CEFs used in this paper.
Carbon emissions calculated by SimaPro and by the theoretical approach are summarised in
Table 3, with an indication of level. The highest value of carbon emissions is related to the IPA bath, which is used for post-processing and finishing. Each IPA bath is filled for ten uses, therefore only 20% of the carbon emissions calculated for ten uses will be added to this specific use case (Step 2). The second highest carbon footprint belongs to product development, where the repetitive building of the product consumes a significant amount of energy (Steps 9, 12, 14, 16, 18, 19, 21, 23, 25). The raft formation is also an energy-intensive step, while the production of fossil-based resin is associated with high carbon emissions (Steps 8, 11, 13, 15, 17, 20, 22, 24). The switching on (Steps 3, 4, 5, 6, 10) and switching off of the printer (Step 26) are also linked with carbon emissions.
3.3. Carbon Emissions per Manufacturing Level
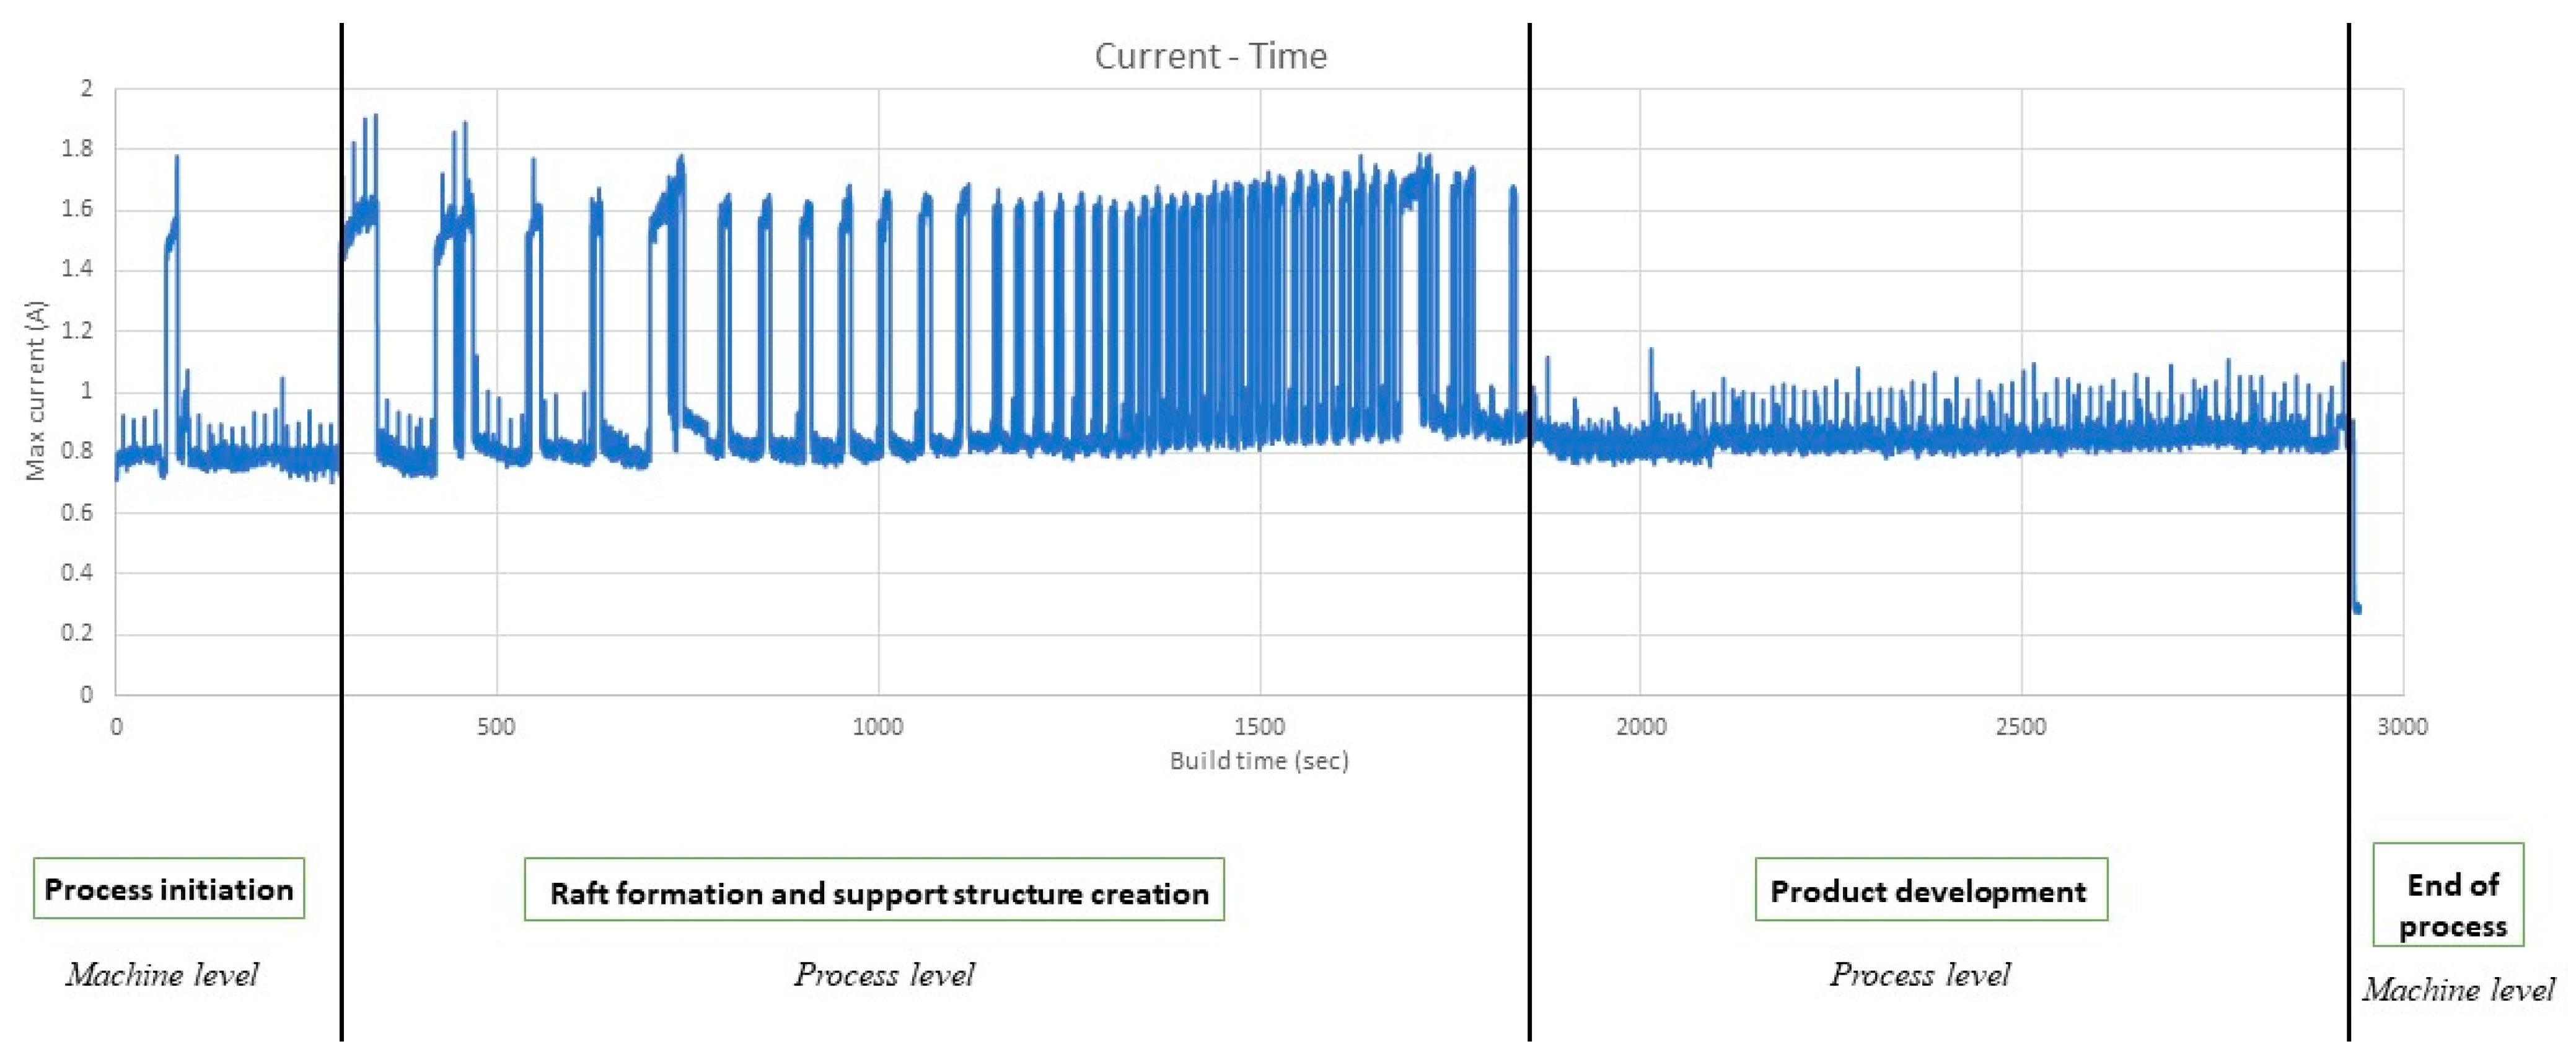
The SLA process is divided here into four parts (
Figure 5), (a) process initiation, (b) raft formation and support structure creation, (c) product development and (d) end of process. As shown in
Table 3, process initiation is about the preparation of the printer, meaning turning it on, heating the material to the right temperature, and positioning the build platform to the initial level. Raft formation and support structure creation include the printing of some first layers that will later on support the printing of the main part. Product development is when the main part is being printed and lastly, the end of process concerns the moment when the printing is finished until the printer shuts down.
Hence, process initiation and end of process can be considered parts that belong to the machine level, while raft formation and product development belong to the process level. It should also be mentioned that, in this case study, when it comes to the system level, the only emissions examined are those for the creation of the consumables, meaning the resin and the IPA. However, neither the pre/post-processing nor the transportation and disposal of the material were taken into consideration.
To calculate the carbon emissions,
Figure 1, which presents the AM levels, should always be kept in mind. This means that, once the emissions of the process level are estimated, in this case by adding the emissions of raft formation and product development, then the emissions of the machine tool level can be calculated as well. This will be the product of the emissions of process initiation and end of process, increased by the emissions of process level. Lastly, emissions of the system level would be the emissions of the steps that belong to this level (resin and IPA creation), increased by the emissions of the machine tool level. The IPA bath (1635.86 g CO
2e) is used for ten prints and a double cleansing per part. Therefore, it was assumed that two uses of IPA bath per printing are required, resulting in 327.17 gCO
2 for the IPA bath.
Table 4 shows the amount of carbon emissions per level, as well as in total.
4. Discussion
The total carbon emissions of SLA printing were calculated at 586.55 g CO2e, with 208.02 g CO2e being related to energy consumption and the rest to material production and consumption. The higher carbon emissions are related to the product development phase (101.08 g CO2e) and the IPA bath (327.18 g CO2e).
The process level at SLA included the raft formation and the product development, resulting in 159.44 g CO
2e. This is 27.45% of the whole carbon emissions for this case study. In other manufacturing processes, the carbon emissions from the process level are not that significant [
28,
29], but the previous literature on AM [
35] supports the fact that the carbon footprint of AM is larger than carbon emissions for machine tool operations. The question now is how to reduce the carbon emissions of the process level. Since these emissions are exclusively related to the energy consumed for printing the main part and the support structure, some key factors could be optimised in order for the carbon footprint of this level to be reduced. Firstly, the orientation of the part during printing. If the part is strategically placed, then it is possible for the support structure to be minimised, thus decreasing the overall printing time, the disposed material and the energy consumed. The thickness of the layers should also be adjusted. Thinner layers, while resulting in a higher quality surface, are more energy-intensive and require a longer time to be printed. The power of the laser beam and the duration of the curing per layer should also be modified in a way that it will not consume more energy than what is required for the curing of the part. However, all these modifications should be examined under the prism of product quality and required specifications, not only environmental sustainability [
36].
At the machine tool level, process initiation and end of process are related to switching on and switching off the SLA printer. These emissions are relatively minimal in comparison to the overall emissions of the print. An increase in energy use occurs when an SLA printer is turned on to power up the printer and any auxiliary equipment. This energy surge is typically transient, though. The same applies to the switching off of the printer, where a brief period of increased energy consumption occurs, while the printer’s components shut down. But, once again, these emissions are not as significant, compared to the rest. A way to reduce the emissions at this level would be to control the temperature used for heating the material and throughout the process, since increased temperature results in increased carbon emissions, as well [
37]. Moreover, reducing idle time can reduce the operation time of the machine and of the auxiliary equipment; hence, the energy that these consume, and the carbon emitted. The same applies to the number of layers, the printing speed and the total printing time. Choosing an energy-efficient printer with lower power consumption or adjusting energy efficiency features could also reduce the environmental impact of this AM level. Finally, when an SLA printer is operating electricity, power is required. Thus, the energy source chosen to power the printer determines the carbon emissions related to its operation. Fossil fuel-based power plants produce higher emissions compared to renewable energy sources [
29].
At the system level, all the material-related carbon emissions are allocated. The IPA used for the bath is very carbon intensive (1635.86 g CO
2e), but the bath is used for ten prints and a double cleansing per part. Therefore, it was assumed that two uses of IPA bath per printing are required, resulting in 327.17 gCO
2 for the IPA bath. Regarding resin consumption, the carbon emissions calculated were 51.35 gCO
2. When combined, the majority of carbon emissions are related to material production, as already mentioned in the previous literature [
28,
29]. Additionally, choosing more environmentally friendly materials and practising proper waste management for used resins and supports can also help mitigate the environmental impact of SLA printing. Resins with a lower carbon footprint, such as biobased or recycled should be preferred and excess resin or failed parts should be reused and recycled. The framework presented in this paper enables a thorough analysis of the carbon emissions related to the entire lifecycle of AM. This means not only the printing process but also the creation, transportation and disposal of the material, as well as the steps that take place before and after the printing [
29]. Applying this framework allows for the categorisation of the process into levels (process, machine tool, system) and thus the identification of areas within the process where carbon emissions need to be reduced. What is more, being generic makes it applicable to every AM method and allows for the comparison of the different processes regarding their emissions. When it comes to SLA, the application of this holistic framework showed that the most carbon-intensive level was the system level and specifically the use of IPA. Overall, a holistic carbon emissions framework offers valuable insight regarding the sustainability of AM processes.
While the application of the holistic framework in SLA provided valuable insight into the environmental impact of the process, there were certain limitations to its application. One of the main challenges was the lack of standardised emissions data throughout the entire lifecycle of the printing. It was not clear what part of the power was utilised exclusively for the process of printing and which was necessary for the operation of the printer and the auxiliary equipment. The idle and standby time was also ignored. What is more, some emissions were not taken into consideration, such as the transportation of the material and the post-curing step. Simplified assumptions, such as for the CEF of the resin and for the electricity, were also made, and the data were not enough to perform SimaPro-only calculations or theoretical calculations via the framework.
5. Conclusions and Future Outlook
In conclusion, the application of a carbon emissions framework on an SLA paradigm provides valuable insights into the environmental impact of the AM process. By taking into account the steps that need to be examined or the entire lifecycle of the process, the carbon emissions associated with these steps can be further understood. In this case study, the factors considered were the different AM levels of the process, the carbon emissions to create the amount of the material used (resin, IPA) and the energy consumed throughout the operation of the printer. These factors contribute to the overall carbon emissions of the process and help identify areas of improvement. This was mainly the system level, and specifically the IPA bath, since the creation of this cleanser is very carbon intensive, followed by the machine tool level, while the process level caused the least emissions.
The holistic framework of carbon emissions serves as a valuable tool for implementing carbon reduction strategies. It can be applied to every AM process and takes into consideration the entire life cycle emissions, including those produced during the material creation, printing, post- and pre-processing and end-of-life. This elevates it above the present, conventional carbon footprint estimation techniques, which frequently fail to take into account the complexity of AM processes. The use of this carbon emissions framework makes it easier to benchmark and compare various AM processes. It can support the adoption of more sustainable practices by assisting AM-using industries and sectors in making decisions regarding these technologies based on their environmental impact and identifying areas where emissions can be decreased. The application of this framework also highlights some challenges, such as the need for accurate data collection, and challenges in quantifying emissions of material transportation and post-curing. Regarding material transportation, some factors that need to be considered for the calculation of the emissions are obtaining accurate and reliable data, the variability in transportation methods, where each one has different energy requirements, or tracking and quantifying carbon emissions at each stage of the supply chain that involves transportation. On the other hand, post-curing is a step that takes place in a specific oven, so many parameters have to be taken into consideration for this process as well, such as the energy spent for curing, the idle time, the carbon emission factors, etc.
To further improve this framework and to reduce the carbon emissions of AM future work should target the carbon-intensive areas. Environmentally friendly materials should be examined or renewable energy sources. Additionally, more accurate and easier data collection methodologies could be developed. Lastly, a more detailed application of this framework could provide further information regarding the sustainability of this non-conventional process.


