Article

Homogeneous Field Measurement and Simulation Study of Injector Nozzle Internal Flow and Near-Field Spray

1
College of Power Engineering, Naval University of Engineering, Wuhan 430033, China
2
The Merchant Marine College, Shanghai Maritime University, Shanghai 201306, China
*
Author to whom correspondence should be addressed.
Processes 2023, 11(9), 2533; https://doi.org/10.3390/pr11092533
Submission received: 19 July 2023 / Revised: 13 August 2023 / Accepted: 21 August 2023 / Published: 24 August 2023
(This article belongs to the Special Issue Internal Combustion Engine Combustion Processes)

Abstract

:
The homogeneous field measurement of internal flow and spray of internal combustion engine injector nozzles under high pressure has always been one of the difficulties in experimental research. In this paper, an actual-size aluminum alloy nozzle is designed, and the simultaneous measurement of internal flow and near-field spray is successfully realized with the help of synchrotron radiation X-ray phase contrast imaging technology under an injection pressure of 30~90 MPa. For a 0.25 mm aperture nozzle, different radii of the inlet corner can induce different cavitation layer thicknesses, and the measured flow section shrinkage ratio is 0.70. The flow characteristics in the nozzle are entirely connected to the jet characteristics, indicating a tight correlation between internal flow and jet morphology. Finally, the internal cavitation of the nozzle was studied by the CFD simulation, and the simulation results are in good agreement with the experiment.

1. Introduction

The atomization effect and evaporation process of fuel in internal combustion engines produce a significant impact on combustion and emission characteristics. Phenomena such as cavitation and string cavitation induced by the internal structure of the injector can increase the spatial and temporal uncertainty of the flow field inside the nozzle, which in turn affects spray characteristics. To better control and optimize the fuel spray, this experimental study combining the fuel flow inside the nozzle with the external spray is of great importance.
Visualization experiments play a crucial role in studying the internal flow and cavitation of injectors. However, due to the small size of injector structures, many experiments use enlarged transparent nozzles to observe fuel flow phenomena and create spray visualization [1,2,3]. These experiments have revealed that geometry-induced cavitation and line cavitation inside the nozzle can cause notable alterations in spray characteristics.
Relevant studies on actual-size nozzles [4,5,6] have revealed that the formation and progression of cavitation are highly sensitive to the nozzle’s geometry; particularly, the radius of the fillet at the nozzle entrance significantly influences the distribution of the cavitation layer. By comparing experimental results of internal flow between actual-size and enlarged orifices, it becomes evident that the cavitation structures within the orifices are similar, but their transient development processes differ [4].
Furthermore, the visualization experiments conducted on nozzle flow face challenges related to the poor strength of transparent materials and the difficulty of achieving a proper experimental seal. As a result, the injection pressure in most of these experiments does not exceed 5 MPa, which significantly differs from the actual injection pressure of internal combustion engine injectors. However, a few notable experiments [7,8,9] have successfully visualized the internal flow at higher pressure levels, reaching a maximum injection pressure of 70 MPa. Manin et al. [10] used a cast acrylic nozzle to visualize internal flow at a pressure as high as 100 MPa. Despite these advancements, simultaneous visualization of the internal flow and emerging jet remains challenging due to disparities in refractive index and focal distance. Additionally, visible light is unable to penetrate the liquid core, thus causing ambiguity in internal information about the liquid core. Therefore, it is imperative to establish a connection between the spray and internal flow at actual injection pressures to overcome these limitations.
Considering the challenges posed by experimental research, numerical calculations serve as another effective method to investigate the internal flow and spray of injector nozzles. Some studies have focused solely on simulating the internal cavitation flow [11,12,13,14]. Reynolds-averaged Navier-Stokes (RANS) and Large Eddy Simulation (LES) have been employed to simulate cavitation within the nozzle hole. When comparing RANS and LES models for cavitating flows, RANS results have shown reasonably accurate predictions of hole cavitation under high-pressure conditions. On the other hand, LES can capture the small-scale vortex cavitation caused by pressure fluctuations [12]. The simulation and experimental results exhibit strong agreement in terms of the geometry and prediction of string cavitation. Recognizing the significant impact of internal flow on the jet breakup, researchers have also simulated the connection between internal flow and the outer jet. A coupled VOF-Level Set LES simulation methodology was successfully utilized to predict the spray patterns observed in X-ray images of diesel nozzles [15]. The simulated string cavitation and jet pattern align well with the experimental findings obtained through LES.
It is worth noting that most of the studies use the cavitation experimental results at low injection pressure to verify the numerical calculation model [16,17]. However, it should be noted that under high-pressure conditions, significant changes occur in fuel density, viscosity, and other physical parameters, directly impacting the accuracy of flow field calculations. Unfortunately, there is still limited availability of experimental verification for the model under high-pressure conditions.
In recent years, X-ray imaging technology has been utilized for experiments such as near-field atomization effects and needle valve lift measurements [18,19,20]. However, it was observed during these experiments that there was a significant X-ray attenuation after penetrating the steel needle body, which prevented proper imaging of the internal two-phase flow.
To establish the connection between the internal flow and spray of the nozzle, this study uses a low-Z (atomic number) material (aluminum alloy) to fabricate the nozzle and visualizes the internal flow and near-field spray simultaneously using X-ray phase contrast imaging.
Sufficient X-ray intensity can be obtained through the aluminum alloy nozzle, which is conducive to internal two-phase flow imaging, while the aluminum alloy nozzle can also withstand higher injection pressure than the transparent material. In this paper, the actual size of the nozzle is made, and the experimental results obtained are closer to the actual injection situation of diesel engines. The internal nozzle flow was visualized, and cavitation characteristics were measured quantitively. The experimental results were then compared with the computational fluid dynamics (CFD) simulation of the internal flow. Finally, the impact of inlet geometry on both the internal flow and the external jet is discussed.

2. Experimental and Simulation Methods

2.1. X-ray Phase Contrast Imaging (XPCI)

The imaging experiments of the nozzle internal flow and near-field spray were carried out at the beamline BL13W1 of the Shanghai Synchrotron Radiation Facility (SSRF), which is a third-generation synchrotron light source with a storage energy of 3.5 GeV and an electron beam current of 200 mA [21].
A schematic diagram of the XPCI system is shown in Figure 1. Detailed imaging principles can be found in the reference [22]. High-pressure diesel fuel is injected into the spray chamber, which is equipped with two polyurethane windows to enable the passage of X-rays. X-ray energy is set at 22 keV, and as the X-rays traverse through the aluminum nozzle and diesel fuel spray, they are converted to visible light using a scintillator (YAG: Ce crystal, thickness 200 μm).
The images were subsequently recorded with a charge-coupled device (CCD) detector with 2048 × 2048 pixels, corresponding to 0.65 μm per pixel. Since the fuel was injected under quasi-steady conditions, the selected image exposure time was 500 ms, and the duration of each injection was about 6 s. More than ten images were taken for each set of experiments.

2.2. Aluminum Alloy Nozzle and High-Pressure Injection System

Figure 2 illustrates the configuration of the experimental apparatus. An aluminum alloy nozzle is securely fastened and sealed between the upper and lower flanges, and the upper flange is equipped with an adjustable lift needle valve and fuel inlet for precise control. High-pressure fuel is introduced into the device via the fuel inlet. The fuel flows through the gap between the needle valve and the valve body and is ejected from the aluminum alloy nozzle at the lower end. The experimental device has been tested to withstand fuel pressure up to 150 MPa.
The needle valve lift adjustment is accomplished through a threaded mechanism, and the test nozzle consists of a single orifice measuring 0.80 mm in length. The diameter of the orifice is 0.24 mm, with the sac diameter measuring 0.85 mm. For this particular experiment, the needle valve lift remains fixed at 5 mm, with negligible impact on the internal flow and jet.
To ensure a consistent and stable fuel injection pressure throughout the experiment, a reliable high-pressure fuel source has been devised following hydraulic principles. Figure 3 depicts a schematic diagram of the setup. The left side is a double-acting hydraulic cylinder, and the connecting rod drives the piston movement in the right fuel cylinder. The piston area of the left hydraulic cylinder is six times the piston area of the right fuel cylinder, so the fuel output pressure is six times the left hydraulic pressure. Maximum fuel pressure is 150 MPa.
Real-time fuel pressure is measured by a pressure sensor (PT210B-200 MPa, accuracy: ±0.5% FS) and displayed on the computer. When the solenoid valve is energized, fuel injection starts, and this high-pressure fuel source is capable of satisfying nozzle continuous injection for more than 6 s.
The experiment was conducted with commercial #0 diesel fuel with a density of 853 kg/m3 and kinematic viscosity of 3.32 mm2/s, respectively [23]. The experiment injection pressures were: 30, 50, and 90 MPa, respectively, and the spray chamber environment was ambient temperature and pressure (approx. 1.0 bar, 25 °C).

2.3. Simulation Method

Both RANS and LES can be used to calculate the two-phase flow in the nozzle. Considering that RANS can also obtain better precision in cavity cavitation simulation and use less computational resources than LES, the RANS method is chosen for this paper. The simulation software adopts Ansys Fluent 15.0. The turbulence mode used in the simulation is k-ω (SST) mode, and the solver is Simple C, keeping the default settings of the model parameters. A no-slip condition between the liquid and vapor phases is assumed. The cavitation model is the Zwart-Gerber-Belamri model, and the bubble’s initial diameter is set to 0.001 mm. The cavitation simulation method is verified by a microhole cavitation experiment [24]. The study of similar working conditions found that when the mesh scale of the cavitation region reaches below 1μm, the nozzle flow rate can reach stability, and the number of grids has little influence on the calculation results [25]. It is determined that the mesh size of the cavitation area is less than 1μm, and the mesh size of other major areas is 5–10 μm. The experiments with a pressure difference of 300 bar were selected to validate the simulation. The flow comparison results of model verification are shown in Figure 4. With the decrease of back pressure, the cavitation state in the microchannel gradually changes from no cavitation to full cavitation. The flow and cavitation morphology simulation results agree well with the experimental results. The reliability of the 8 cavitation simulation method is ensured.
For the nozzle in this experiment, grid independence analysis was carried out, and the results are shown in Figure 5. It can be seen that when the number of grids is close to 1.0 million, the flow rate is stable. At this point, the minimum cavitation area mesh is about 0.5 μm. The mesh scale of the middle region is about 5μm, and polyhedral mesh is adopted. The mesh density of the cavitation region in the hole is similar to the results of the mesh sensitivity analysis [25]. Therefore, the total number of grids in half of the models is close to 1.0 million, which can ensure the effectiveness of the number of grids. Half of the symmetric nozzle model is used, and the structured mesh totals about 1.0 million. In the simulation, other physical parameters of diesel were selected from the data in the literature [26].

3. Experiment Result

3.1. Digital Image Processing

The near-field spray and internal flow images were captured when the injection was in a quasi-steady state, and averaged images were utilized for analysis and processing. Because of the significant difference in atomic arrangement density between the aluminum alloy nozzle and fuel, the X-ray penetration effect differs, resulting in the fuel jet appearing in the experimental image with an extremely similar grayscale to the air background, while the nozzle part appears almost black, as depicted in Figure 6.
To clearly observe the correlation between internal and external flows, it is essential to apply appropriate image processing techniques. First, the nozzle boundary is utilized to separate the nozzle from the jet. Parts A and B in Figure 6 represent the external jet and the aluminum nozzle. Subsequently, the grayscale stretching operation is conducted on the images of parts A and B individually, revealing the two-phase fuel flow inside the nozzle and the structure of the jet outside the nozzle, as evident from the figure.
To define the rectangular region as the region of interest ROI (region of interest), the cavitation layer thickness and distribution can be obtained using local threshold enhancement and binary image operation to segment the cavitation layer and extract cavitation information from the image.

3.2. Internal Flow and Jet Characterization

Figure 7 shows the comparison of the nozzle inlet flow and near-field jet flow under different injection pressure conditions. There is an inlet fillet at the experiment nozzle’s inlet, and the fillet’s radii on the left and right sides are about 40 μm and 60 μm, respectively. The ratio between the radius of the fillet and the diameter of the orifice is about 0.17 and 0.25. As seen in Figure 7, the cavitation layer covering the entire hole appears on both sides of the orifice wall. The cavitation thickness on the left side is larger than that on the right side, which is consistent with the general rule of the effect of the radius of the inlet fillet on the cavitation of the orifice. The jet state can be clearly observed as a ski-jump flow in the experiment. Because the wall cavitation layer is connected to the air outside the orifice, the internal flow is completely separated from the surface of the orifice, and the cavitation layer boundary is connected to the jet boundary. Because the boundary effect of the flow is eliminated, the ski-jump flow phenomenon causes the jet flow not to break [27].
Since X-rays interfere when they pass through the edge of the material during propagation, they improve the contrast of the edges and thus image out the internal features of the fluid. The internal streaking characteristics of the jet flow and nozzle flow can be observed in Figure 7. In the absence of fuel injection, no streaks were seen in the orifice, indicating that the streak feature was not from the nozzle structure; it should be related to fuel. For a single-hole nozzle, no swirl inside the pressure chamber induces string cavitation. The main cavitation comes from the structure-induced cavitation caused by the reduction of the flow area. Due to the different radius of the orifice inlet fillet, the thickness of the cavitation layer in the orifice should also differ along the circumference. CT imaging of the internal flow of low-pressure water pipes in the literature [28] showed that the flow structure of the orifice was not cylindrical due to the different thicknesses of the cavitation layer, while the cavitation collapse led to a change in the flow structure. In this experiment, the variation in the actual inlet fillet radius results from processing factors, and cavitation is sensitive to inlet size. This means that in a real single-hole nozzle, it is difficult to maintain the cylindrical shape of the jet boundary. For near-field jet flow under ski-jump flow, the jet flow characteristics are fully connected and consistent with the flow characteristics inside the nozzle, indicating that the jet morphology is highly coupled with the internal flow structure. The irregularity of the jet flow surface is also a potentially important factor affecting jet flow breakage.

3.3. Quantitative Cavitation Layer Thickness Analysis

Quantitative measurement of cavitation layer thickness can be made based on the high-resolution image of fuel flow in the orifice taken by X-ray. The product of the number of pixels and the pixel size in the cavitation layer in the image is the thickness of the cavitation layer. Figure 8 shows the cavitation layer thickness measurements at different positions in the orifice under different pressure conditions.
It can be seen in this figure that the thickness of the cavitation layer is at its minimum at the orifice entrance and gradually increases along the flow direction, which may be related to the gradually expanding orifice of the nozzle used in this experiment. Under the same pressure condition, the thickness of the cavitation layer on the left and right sides is different, and the thickness of the cavitation layer on the left is obviously larger than that on the right. This difference is due to the fact that the radius of the left fillet at the entrance of the orifice is smaller, and the flow separation area at the entrance is larger, so the thickness of the cavitation layer is larger. This unevenness of this cavitation layer thickness unevenness caused by the cavitation primary position can be maintained throughout the downstream orifice, and the cavitation layer thickness gap gradually increases along the flow direction. With the increase in injection pressure, it seems that the overall thickness of the cavitation layer in the orifice tends to rise; however, the increase in cavitation thickness is generally no more than 2 μm, which is about 3 pixels when converted into pixels. This represents the critical point for structure recognition accuracy commensurate with imaging. In this experiment, the cavitation phenomenon shows that the experimental condition has reached a hydro-flip condition. The cavitation area is filled with air due to air suction. The R/D ratio between the inlet radius and nozzle diameter is around 0.17 and 0.25, as shown in Figure 9.
From the simulation study by Im in Figure 9 [29], the cavitation threshold is around 0.55 for single-hole injectors. In the hydro-flip condition, the injection pressure has little effect on the flow rate, and a linear relationship between flow rate and pressure difference can be found, similar to that of a non-cavitation nozzle [30]. Therefore, further experiments still need to test whether the injection pressure has a slight effect on cavitation thickness in the pick flow state of this experiment.

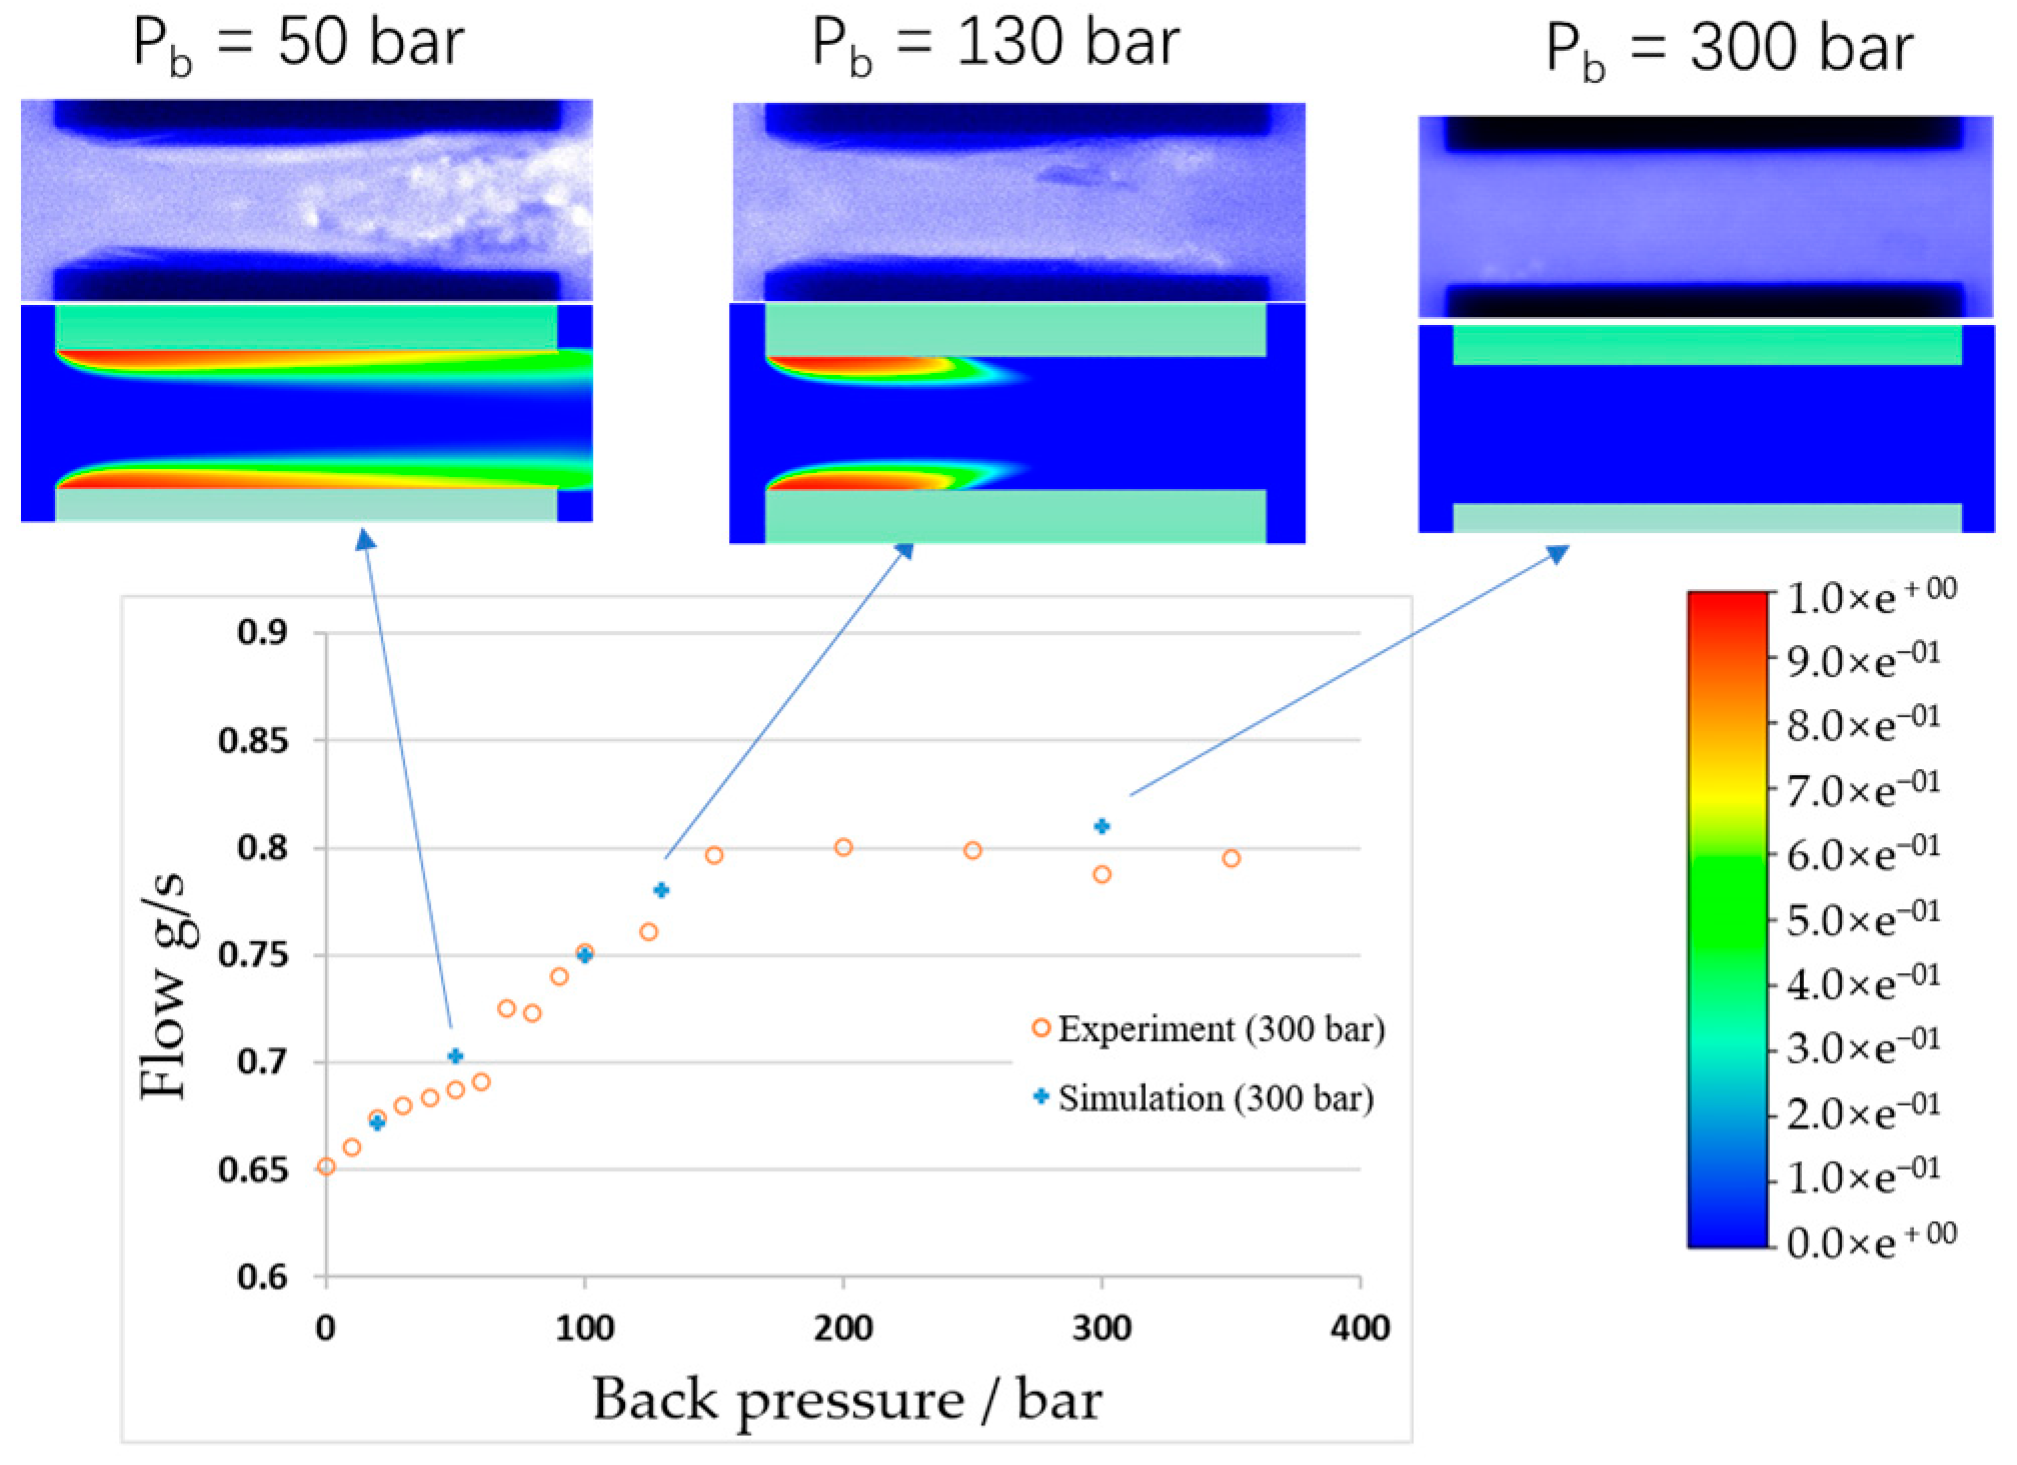
4. Simulation Results

Based on the experimental study, the internal flow in the orifice with two different sizes of inlet fillet is simulated. Figure 10 displays the distribution of the cavitation layer within the orifice. As is evident in the figure, the simulation results reveal a gradual increase in the thickness of the cavitation layer along the flow direction. The thickness of the cavitation layer in the orifice with the inlet fillet radius of 40 μm is larger, which indicates the higher cavitation intensity, consistent with the experiment results.
Results show that the simulation method in this paper can predict the cavitation flow in the nozzle well.
In Figure 11, a comparison is presented between the simulated and experimental values of the cavitation layer thickness at an injection pressure of 90 MPa. As the figure indicates, the overall thickness of the cavitation layer obtained through both experimentation and simulation is quite similar. Considering that near the initial position of cavitation in the experiment and due to the limited brightness of the original image, it is difficult to accurately determine the initial position of cavitation after image enhancement. Therefore, a specific deviation exists between the simulation result and the experiment result.

5. Discussion

In this paper, the experimental measurement of an internal flow and a diesel jet was carried out using an Al alloy nozzle assembly and synchrotron X-ray phase-contrast imaging. The preliminary results confirm that this method effectively reveals the connection between the internal flow structure and jet structure. The experimental results show that the image characteristics of the flow inside the nozzle and the image characteristics of the external jet are connected, indicating that the shape of the flow inside the nozzle determines the shape of the exit spray.
In addition, the experimental and simulation results show that different inlet chamfer radii will lead to different cavitation layer thicknesses in 2D cross-section. The different thicknesses of cavitation layers will affect the three-dimensional structure of fuel in the orifice, resulting in the outlet jet shape not being ideally cylindrical. This conclusion can also be confirmed by CT test results of water flow in low-pressure pipes [28]. The non-cylindrical jet was formed due to the surface irregularity caused by the different thicknesses of the cavitation film along the circumference. The irregularity of the surface of the non-cylinder will cause the non-uniformity of the interaction between the external field jet and the air along the circumference, leading to differences in the location and time of the fuel crushing.
Figure 12 shows the initial breakup morphology from a hydroground nozzle using pure biodiesel at 50 MPa injection pressure [31]. The biodiesel with higher viscosity will delay the jet breakup and has a larger breakup feature. This nozzle has a large inlet radius, so there is no cavitation in the nozzle hole. It can be seen that the wave structure in the diesel jet tended to follow the streak structure. This tendency indicates that surface irregularity could influence the instability of fuel jets due to the uneven interaction between fuel and air, especially in single-hole nozzles. In addition, the spray breakup process was highly related to the spray morphology [32]. The nozzles with non-circular orifices induce greater instabilities in the jet and cause it to disintegrate faster. From the two-phase structure distribution of real nozzle flow, it can also be seen that there are obvious folding characteristics at the gas-liquid interface [33]. The non-cylindrical characteristics of the liquid phase in the hole and the fold characteristics of the liquid phase surface have been formed before the interaction with the outside air, which introduces the initial instability factor to the jet surface. Therefore, in analyzing the primary breaking mechanism of the jet outside the real nozzle hole, the instability introduced by the irregular shape of the liquid phase surface structure must be considered.

6. Conclusions

In this paper, an aluminum alloy nozzle was designed to study the correlation between internal flow and a near-field spray of a diesel nozzle. Simultaneous measurement of the internal nozzle flow and external field spray was carried out using XPCI. The CFD simulation was also used, and the simulation and experimental results were compared. The main findings are as follows:
(1)
Aluminum nozzles combined with XPCI imaging technology can effectively achieve the same field measurement of internal flow in the orifice and near-field spray at higher injection pressures.
(2)
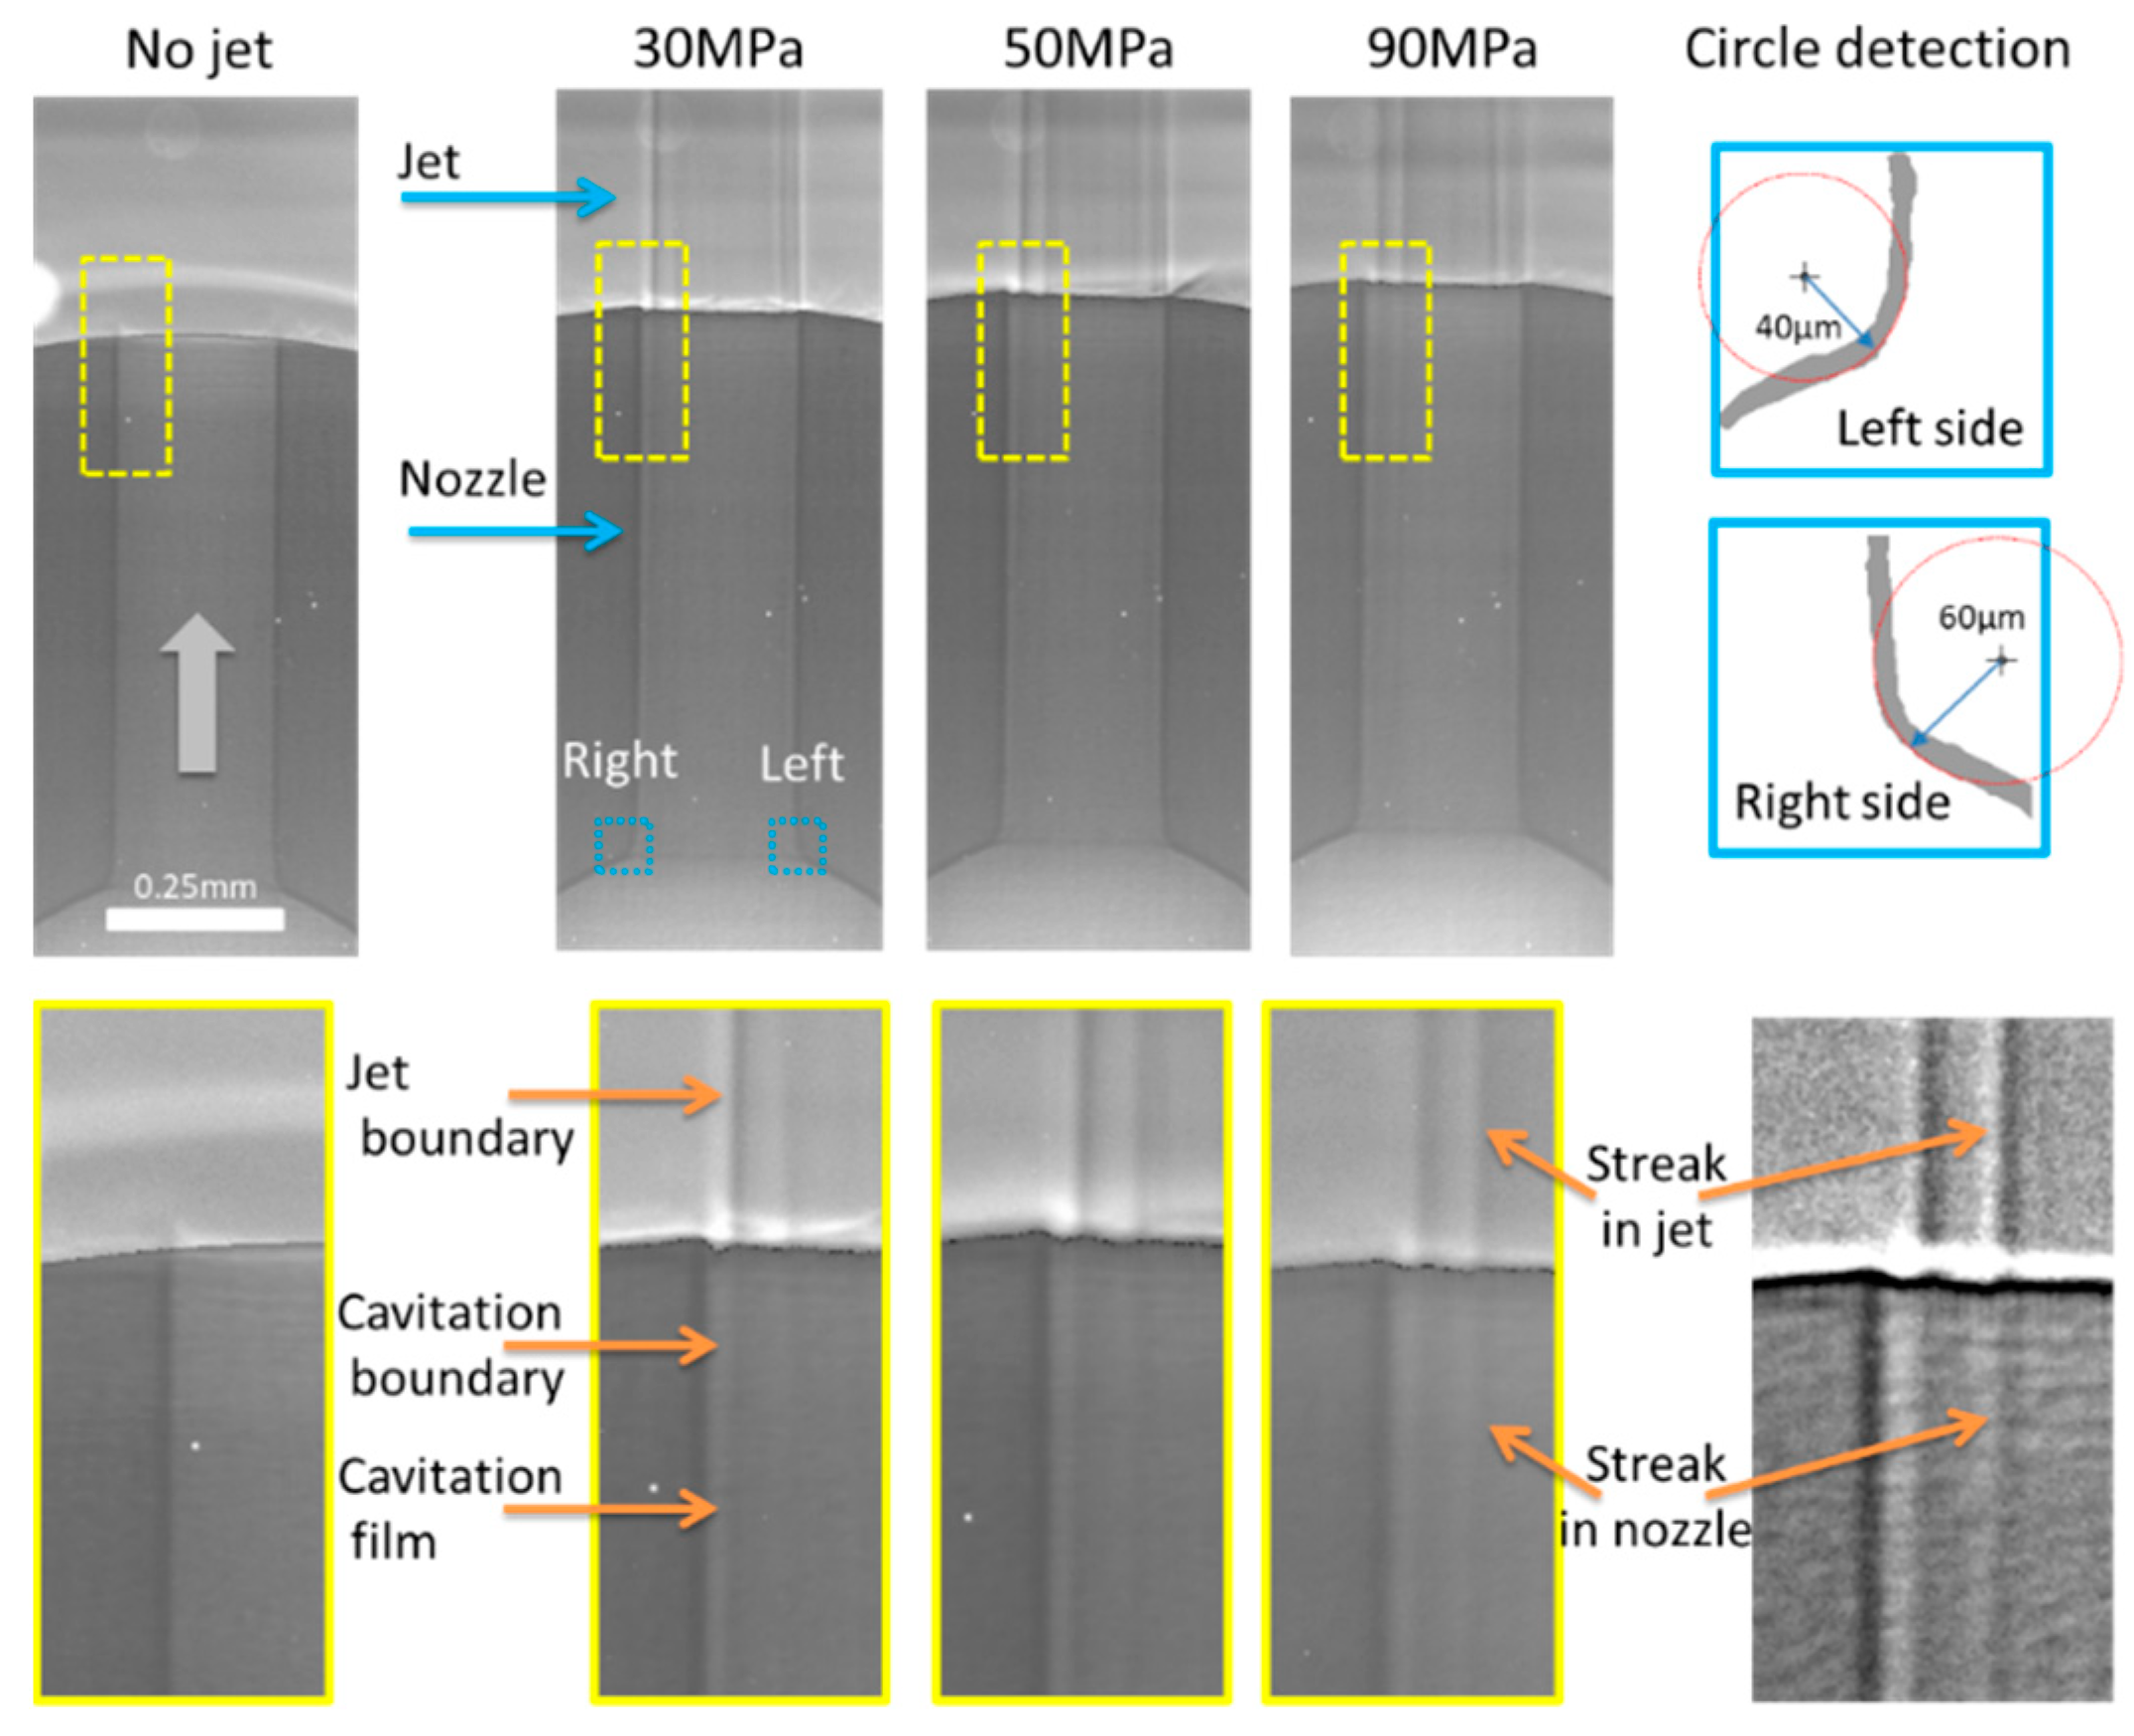
The imaging streak characteristics of the internal flow in the orifice are continuous and coincide with the external spray streak characteristics, indicating that the internal flow strongly influences the near-field spray characteristics.
(3)
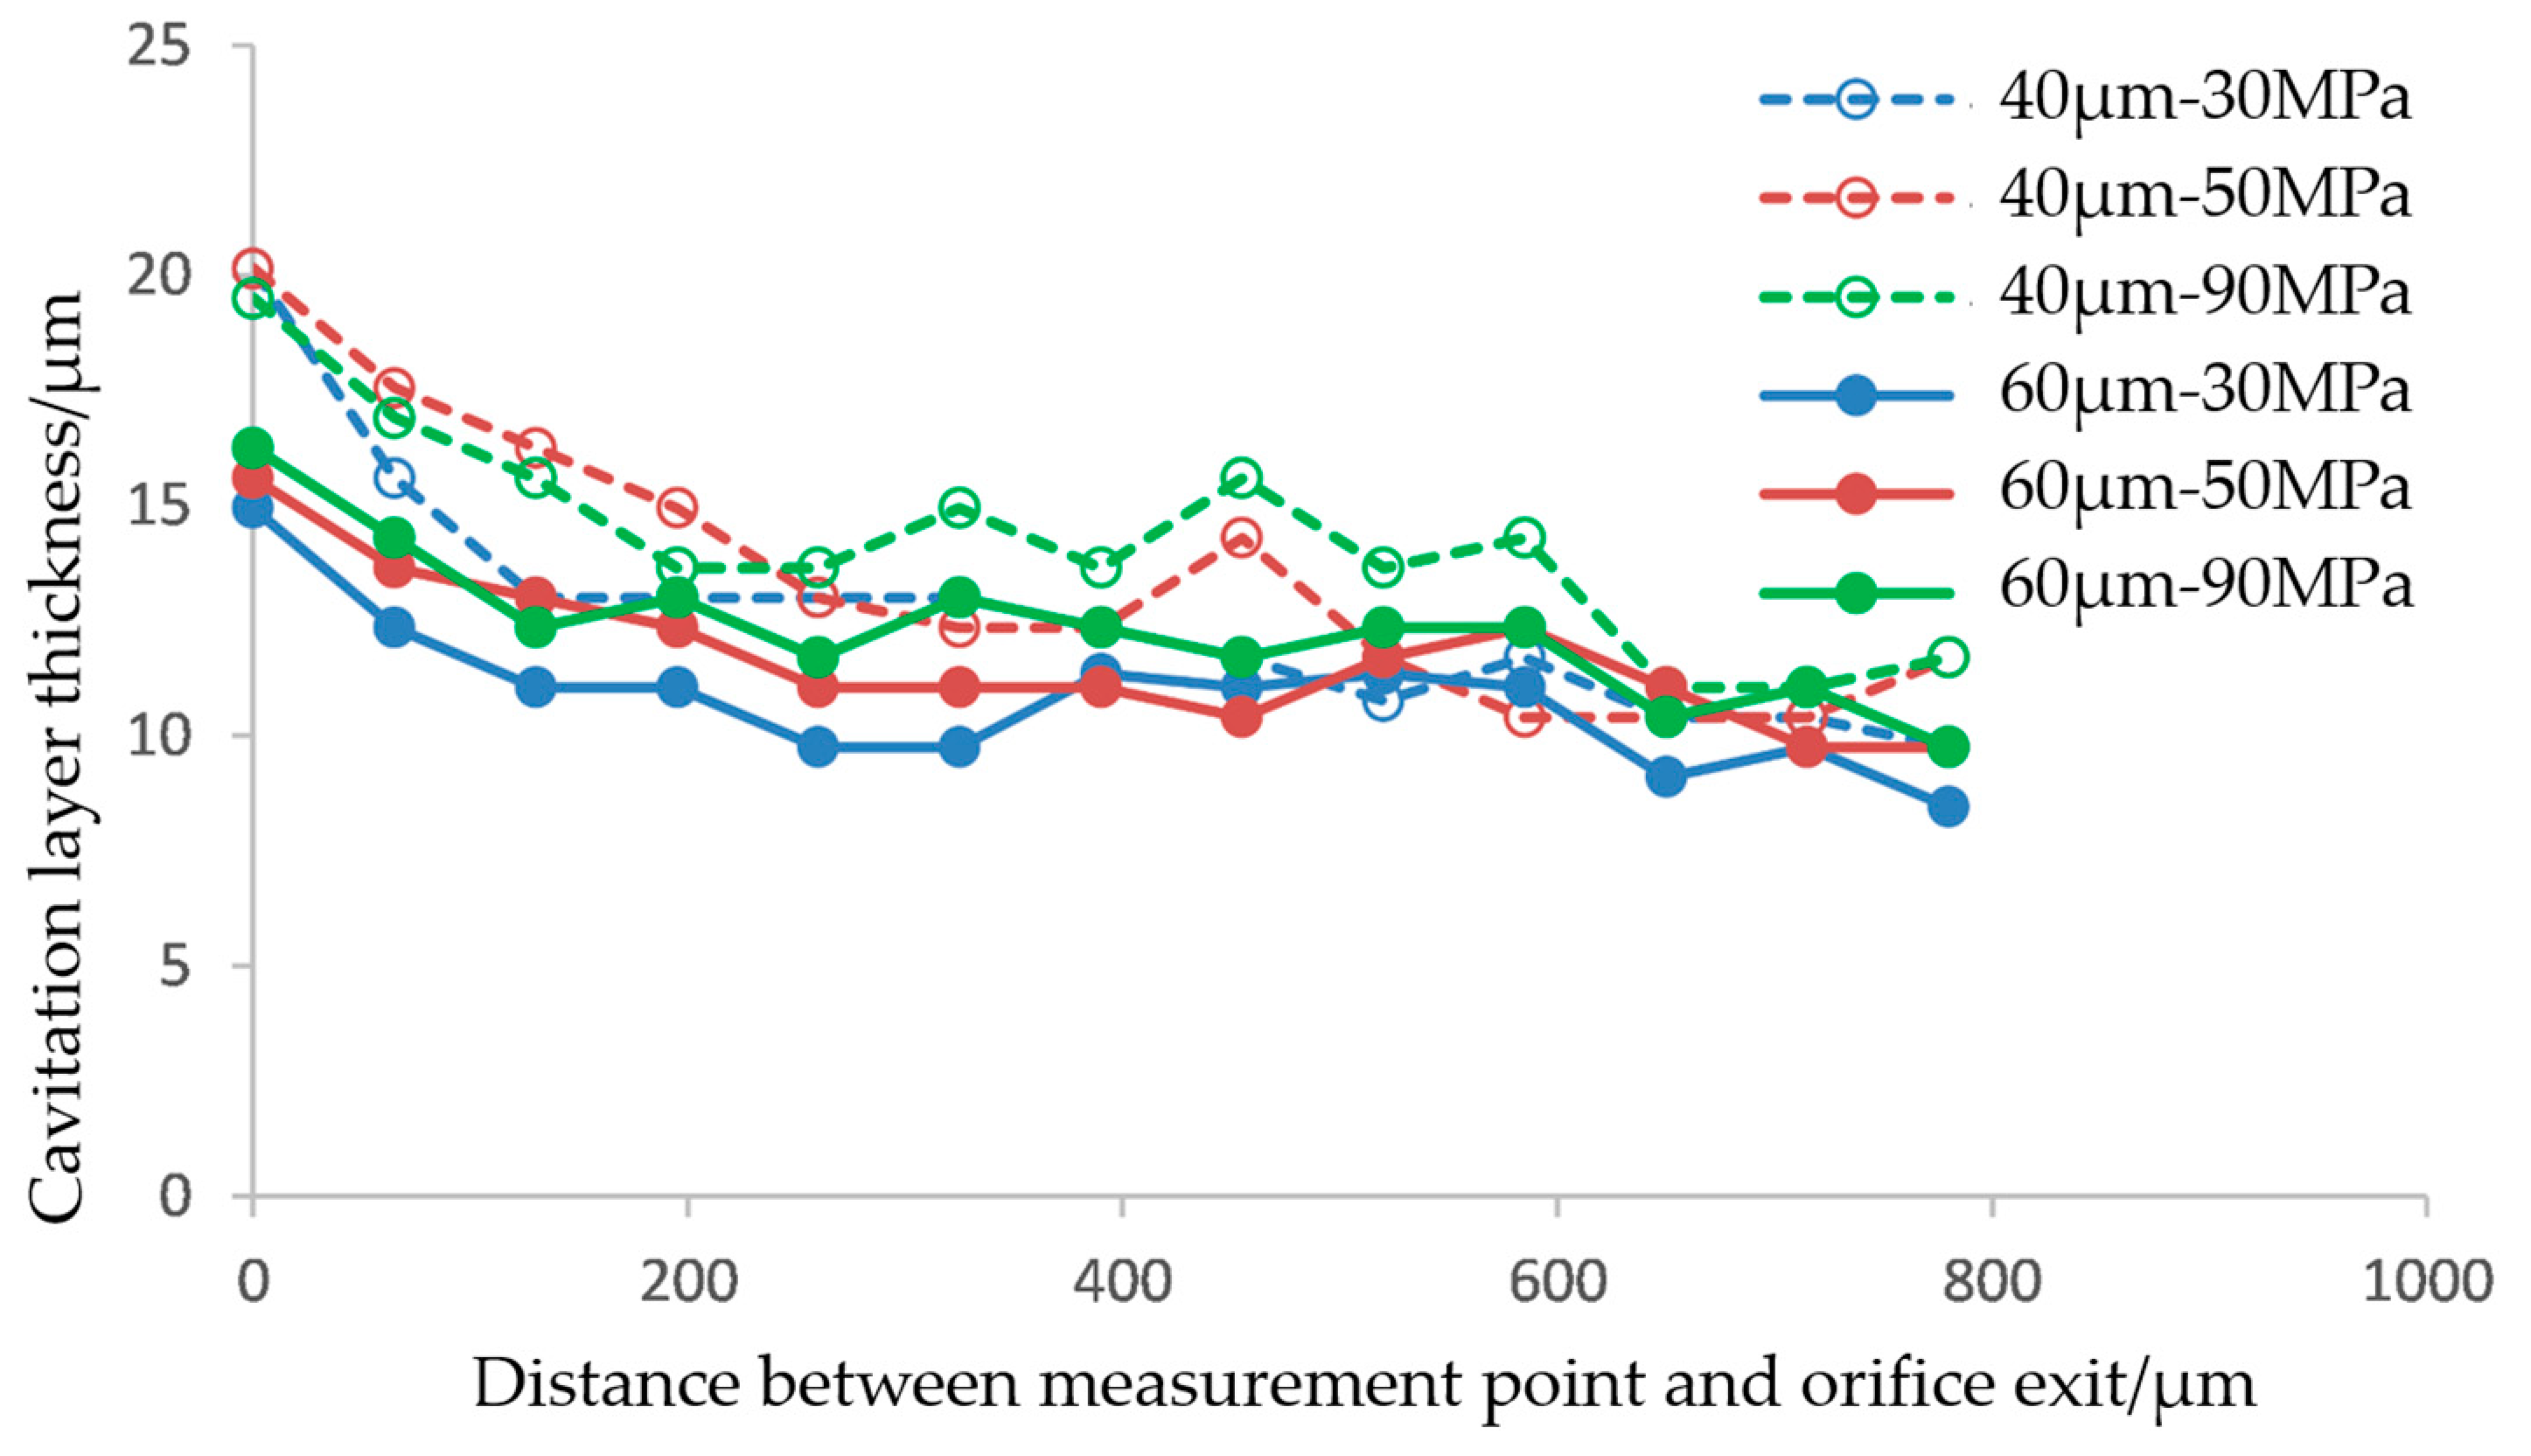
The thickness of the cavitation layer of the progressively expanding orifice increases along the flow direction, and the cavitation leads to a shrinkage ratio of about 0.70 in the circulation cross-section.
(4)
The entrance fillet significantly affects the thickness of the cavitation layer in the orifice, with the larger entrance fillet conducive to reducing the thickness of the cavitation layer in the orifice.

Author Contributions

Experiment, P.C., R.X., and Z.L.; simulation, P.C., R.X., and J.L.; digital image processing, P.C. and X.Z.; validation, P.C. and Z.L.; formal analysis, P.C.; resources, R.X. and Z.L.; writing—original draft preparation, P.C. and R.X.; writing—review and editing, P.C., R.X., Z.L., J.L., and X.Z.; supervision, R.X.; funding acquisition, Z.L. All authors have read and agreed to the published version of the manuscript.

Funding

This research received no external funding.

Institutional Review Board Statement

Not applicable.

Informed Consent Statement

Not applicable.

Data Availability Statement

Some data, models, or code that support the findings of this study are available from the corresponding author upon reasonable request.

Conflicts of Interest

The authors declare no conflict of interest.

Abbreviation

CFDComputational Fluid Dynamics
XPCIX-ray Phase Contrast Imaging
CCDCharge-Coupled Device
ROIRegion of Interest
SSTShear Stress Transport

References

  1. Andriotis, A.; Gavaises, M.; Arcoumanis, C. Vortex flow and cavitation in diesel injector nozzles. J. Fluid Mech. 2008, 610, 195–215. [Google Scholar] [CrossRef]
  2. Sou, A.; Pratama, R.H.; Tomisaka, T.; Kibayashi, Y. Cavitation Flow in Nozzle of Liquid Injector. In Proceedings of the ICLASS 2012, Heidelberg, Germany, 2–6 September 2012. [Google Scholar]
  3. Sun, S.X. Study on the String Cavitation Characteristics in the Nozzle of Diesel Engine and Its Effect on Fuel Injection and Spray. Master’s Thesis, Jiangsu University, Zhenjiang, China, 2018. [Google Scholar]
  4. Arcoumanis, C.; Flora, H.; Gavaises, M.; Badami, M. Cavitation in Real-Size Multi-Hole Diesel Injector Nozzles; SAE Technical Paper: Warrendale, PA, USA, 2000. [Google Scholar]
  5. Payri, R.; Salvador, F.J.; Gimeno, J.; Venegas, O. Study of cavitation phenomenon using different fuels in a transparent nozzle by hydraulic characterization and visualization. Exp. Therm. Fluid Sci. 2013, 44, 235–244. [Google Scholar] [CrossRef]
  6. Hult, J.; Simmank, P.; Matlok, S.; Mayer, S.; Falgout, Z.; Linne, M. Interior flow and near-nozzle spray development in a marine-engine diesel fuel injector. Exp. Fluids 2016, 57, 49. [Google Scholar] [CrossRef]
  7. Watanabe, H.; Nishikori, M.; Hayashi, T.; Suzuki, M.; Kakehashi, N.; Ikemoto, M. Visualization analysis of relationship between vortex flow and cavitation behavior in diesel nozzle. Int. J. Engine Res. 2015, 16, 5–12. [Google Scholar] [CrossRef]
  8. Falgout, Z.; Linne, M. Novel design for transparent high-pressure fuel injector nozzles. Rev. Sci. Instrum. 2016, 87, 085108. [Google Scholar] [CrossRef]
  9. Chen, Z.; He, Z.; Shang, W.; Duan, L.; Zhou, H.; Guo, G.; Guan, W. Experimental study on the effect of nozzle geometry on string cavitation in real-size optical diesel nozzles and spray characteristics. Fuel 2018, 232, 562–571. [Google Scholar] [CrossRef]
  10. Manin, J.; Pickett, L.M.; Yasutomi, K. Stereoscopic high-speed microscopy to understand transient internal flow processes in high-pressure nozzles. Exp. Therm. Fluid Sci. 2020, 114, 110027. [Google Scholar] [CrossRef]
  11. Som, S.; Longman, D.E.; Ramírez, A.I.; Aggarwal, S.K. A comparison of injector flow and spray characteristics of biodiesel with petrodiesel. Fuel 2010, 89, 4014–4024. [Google Scholar] [CrossRef]
  12. Edelbauer, W.; Strucl, J.; Morozov, A. Large Eddy Simulation of cavitating throttle flow. Adv. Hydroinform. Simhydro 2016, 2014, 501–517. [Google Scholar]
  13. Balz, R.; Nagy, I.G.; Weisser, G.; Sedarsky, D. Experimental and numerical investigation of cavitation in marine Diesel injectors. Int. J. Heat Mass Transf. 2021, 169, 120933. [Google Scholar] [CrossRef]
  14. Guo, G.; He, Z.; Wang, Q.; Lai, M.C.; Zhong, W.; Guan, W.; Wang, J. Numerical investigation of transient hole-to-hole variation in cavitation regimes inside a multi-hole diesel nozzle. Fuel 2020, 287, 119457. [Google Scholar] [CrossRef]
  15. Shi, J.; Lopez Aguado, P.; Guerrassi, N.; Dober, G. Understanding High-pressure Injection Primary Breakup by Using Large Eddy Simulation and X-ray Spray Imaging. Mtz Worldw. 2017, 78, 50–57. [Google Scholar] [CrossRef]
  16. Winklhofer, E.; Kull, E.; Kelz, E.; Morozov, A. Comprehensive hydraulic and flow field documentation in model throttle experiments under cavitation conditions. In Proceedings of the ILASS-Europe Conference, Zurich, Switzerland, 2–6 September 2001. [Google Scholar]
  17. Duke, D.J.; Matusik, K.E.; Kastengren, A.L.; Swantek, A.B.; Sovis, N.; Payri, R.; Viera, J.P.; Powell, C.F. X-ray radiography of cavitation in a beryllium alloy nozzle. Int. J. Engine Res. 2017, 18, 39–50. [Google Scholar] [CrossRef]
  18. Moon, S.; Gao, Y.; Park, S.; Wang, J.; Kurimoto, N.; Nishijima, Y. Effect of the number and position of nozzle holes on in- and near-nozzle dynamic characteristics of diesel injection. Fuel 2015, 150, 112–122. [Google Scholar] [CrossRef]
  19. Zhang, X.; Moon, S.; Gao, J.; Dufresne, E.M.; Fezzaa, K.; Wang, J. Experimental study on the effect of nozzle hole-to-hole angle on the near-field spray of diesel injector using fast X-ray phase-contrast imaging. Fuel 2016, 185, 142–150. [Google Scholar] [CrossRef]
  20. Zhang, W.Q.; Wang, Q.; He, Z.X.; Zhang, X.; Guan, W.; Leng, X.Y. Experimental study of cavitation and cavitation characteristic in diesel engine model orifice. Intern. Combust. Engine Eng. 2018, 39, 14–20. [Google Scholar]
  21. Liu, Y.P.; Sheng, W.F.; Wu, Z.H. Progress of synchrotron radiation and its application in inorganic materials. J. Inorg. Mater. 2021, 36, 901–918. [Google Scholar] [CrossRef]
  22. Zhang, X.; Peng, G.; Du, G.; Sun, X.; Jiang, G.; Zeng, X.; Sun, P.; Deng, B.; Xie, H.; Wu, Z.; et al. Investigating the microstructures of piston carbon deposits in a large-scale marine diesel engine using synchrotron X-ray microtomography. Fuel 2015, 142, 173–179. [Google Scholar] [CrossRef]
  23. Liu, C. Numerical Simulation Study of Diesel-Ignited Natural Gas in-Cylinder High-Pressure Direct Injection Dual-Fuel Engine. Master’s Thesis, Jiangsu University of Science and Technology, Zhenjiang, China, 2020. [Google Scholar]
  24. Gothsch, T.; Schilcher, C.; Richter, C.; Beinert, S.; Dietzel, A.; Büttgenbach, S.; Kwade, A. High-pressure microfluidic systems (HPMS): Flow and cavitation measurements in supported silicon microsystems. Microfluid Nanofluid 2015, 18, 121–130. [Google Scholar] [CrossRef]
  25. Yu, S.; Yin, B.; Deng, W.; Ye, Z.; Xu, B.; Xu, H. Internal flow and spray characteristics for elliptical orifice with large aspect ratio under typical diesel engine operation conditions. Fuel 2018, 228, 62–73. [Google Scholar] [CrossRef]
  26. Karrholm, F.P.; Weller, H.; Nordin, N. Modelling injector flow including cavitation effects for diesel. In Proceedings of the FEDSM2007 5th Joint ASME/JSME Fluids Engineering Conference, San Diego, CA, USA, 30 July–2 August 2007. [Google Scholar]
  27. Wu, P.-K.; Miranda, R.F.; Faeth, G.M. Effects of initial flow conditions on primary breakup of nonturbulent and turbulent round liquid jets. At. Spray 1995, 5, 175–196. [Google Scholar] [CrossRef]
  28. Bauer, D.; Chaves, H.; Arcoumanis, C. Measurements of void fraction distribution in cavitating pipe flow using x-ray CT. Meas. Sci. Technol. 2012, 23, 055302. [Google Scholar] [CrossRef]
  29. Im, K.S.; Cheong, S.K.; Powell, C.F.; Lai, M.C.D.; Wang, J. Unraveling the Geometry Dependence of In-Nozzle Cavitation in High-Pressure Injectors. Sci. Rep. 2013, 3, 2067. [Google Scholar] [CrossRef]
  30. Payri, R.; Salvador, F.; Gimeno, J.; Novella, R. Flow regime effects on non-cavitating injection nozzles over spray behavior. Int. J. Heat Fluid Flow 2011, 32, 273–284. [Google Scholar] [CrossRef]
  31. Zhang, X.; Moon, S.; Gao, J. Investigation of the spray morphology and primary breakup of biodiesel blends using X-ray ultrafast phase-contrast Imaging. In Proceedings of the 2011 International Conference on Advances in Construction Machinery and Vehicle Engineering, Shanghai, China, 5–7 November 2011. [Google Scholar]
  32. Miranda, R.; Chaves, H.; Obermeier, F. Imaging of cavitation, hollow jets and jet branching at low lift in a real size VCO nozzle s. In Proceedings of the ILASS-Europe 2002, Zaragoza, Spain, 9–11 September 2002. [Google Scholar]
  33. Tekawade, A.; Sforzo, B.A.; Matusik, K.E.; Fezzaa, K.; Kastengren, A.L.; Powell, C.F. Time-resolved 3D imaging of two-phase fluid flow inside a steel fuel injector using synchrotron X-ray tomography. Sci. Rep. 2020, 10, 8674. [Google Scholar] [CrossRef]
Figure 1. Schematic diagram of XPCI experimental system.
Processes 11 02533 g001
Figure 2. Design diagram of aluminum alloy nozzle combination structure.
Processes 11 02533 g002
Figure 3. Schematic diagram of the high-pressure constant pressure hydraulic system: (1) diesel fuel tank; (2) diesel pump; (3) filter; (4) check valve; (5) hydraulic cylinder; (6) hydraulic oil pressure sensor; (7) displacement sensor; (8) piston; (9) accumulator; (10) hydraulic pump; (11) hydraulic oil tank; (12) control valve (booster cylinder in and out solenoid valve, pressure reducing valve, relief valve); (13) diesel pressure sensor; (14) high-pressure hose; (15) high-pressure solenoid valve; (16) fuel chamber; (17) computer.
Processes 11 02533 g003
Figure 4. The cavitation model versus the experiment, ΔP = 300 bar.
Processes 11 02533 g004
Figure 5. Nozzle calculation model and grid independence result.
Processes 11 02533 g005
Figure 6. Quantitative extraction process of cavitation layer thickness: (A) external jet; (B) aluminum nozzle.
Processes 11 02533 g006
Figure 7. Quantitative extraction of cavitation layer thickness.
Processes 11 02533 g007
Figure 8. Measurement results of cavitation layer thickness under different pressure conditions.
Processes 11 02533 g008
Figure 9. Cavitation comparison between present experimental results and Im’s CFD simulation [29].
Processes 11 02533 g009
Figure 10. Simulation result of nozzle internal flow cavitation.
Processes 11 02533 g010
Figure 11. Simulation and experimental comparison of cavitation layer thickness.
Processes 11 02533 g011
Figure 12. Wave structure in the diesel spray/jet.
Processes 11 02533 g012
Disclaimer/Publisher’s Note: The statements, opinions and data contained in all publications are solely those of the individual author(s) and contributor(s) and not of MDPI and/or the editor(s). MDPI and/or the editor(s) disclaim responsibility for any injury to people or property resulting from any ideas, methods, instructions or products referred to in the content.

