Article

High Dimensional Model Representation Approach for Prediction and Optimization of the Supercritical Water Gasification System Coupled with Photothermal Energy Storage

1
Key Laboratory of Ocean Energy Utilization and Energy Conservation of Ministry of Education, Dalian University of Technology, Dalian 116024, China
2
School of Vehicle and Energy, Yanshan University, Qinhuangdao 066004, China
*
Author to whom correspondence should be addressed.
Processes 2023, 11(8), 2313; https://doi.org/10.3390/pr11082313
Submission received: 4 July 2023 / Revised: 19 July 2023 / Accepted: 27 July 2023 / Published: 1 August 2023
(This article belongs to the Section Energy Systems)

Abstract

:
Supercritical water gasification (SCWG) coupled with solar energy systems is a new biomass gasification technology developed in recent decades. However, conventional solar-powered biomass gasification technology has intermittent operation issues and involves multi-variable characteristics, strong coupling, and nonlinearity. To solve the above problems, firstly, a solar-driven biomass supercritical water gasification technology combined with a molten salt energy storage system is proposed in this paper. This system effectively overcomes the intermittent problem of solar energy and provides a new method for the carbon-neutral process of hydrogen production. Secondly, the high dimensional model representation (HDMR) approach, as a surrogate model, was used to predict the production and lower heating value of syngas developed in Aspen Plus, which were validated using experimental data obtained from the literature. The ultimate analysis of biomass, temperature, pressure, and biomass-to-water ratio (BWR) were selected as input variables for the model. The non-dominated sorted genetic algorithm II (NSGA II) was considered to maximize the gasification yield of H2 and the LHV of syngas in the SCWG process for five different types of biomass. Firstly, the results showed that HDMR models demonstrated high performance in predicting the mole fraction of H2, CH4, CO, CO2, gasification yield of H2, and lower heating value (LHV) with R2 of 0.995, 0.996, 0.997, 0.996, 0.999, and 0.995, respectively. Secondly, temperature and BWR were found to have significant effects on SCWG compared to pressure. Finally, the multi-objective optimization results for five different types of biomass are discussed in this paper. Therefore, these operating parameters can provide an optimal solution for increasing the economics and characteristics of syngas, thus keeping the process energy efficient.

1. Introduction

With the rapid development of industry and the growth of the population, fossil energy such as oil and coal have been rapidly consumed since the last century [1,2]. Fossil energy has a high energy density. However, the excessive use of fossil fuels can lead to environmental problems, such as the greenhouse effect, global warming, etc., not only destroying the environment but also causing health-related problems [3,4]. Renewable energy is more widely used in the metallurgy [5] and electricity industries [6], etc., compared with fossil energy, with the advantages of cleanliness and sustainability.
Biomass energy, with its wide range of sources and considerable scale, is one of the most widely available renewable energy sources around the world [7]. The yield of the produced gas is affected by temperature and the biomass ratio, which promote the decomposition of biomass during the gasification process [8]. According to the gas production mechanism, biomass gasification technology can be divided into pyrolysis gasification (without using a gasification medium) and reactive gasification (using a gasification medium). Reactive gasification includes air gasification, water vapor gasification [9,10], etc. In addition, wet routes of hydrogen production from biomass have been widely considered [11,12]. For example, Thompson et al. maximized production from the anaerobic biodigestion of cassava wastewater with the addition of glycerol [13].
Biomass with a high moisture content requires drying when conventional thermal conversions such as combustion, pyrolysis, and gasification are used, which reduces the efficiency of the whole process [14]. As a new biomass treatment technology developed in recent decades, supercritical water gasification may effectively solve this problem. Supercritical water gasification technology (SCWG) is a special water state formed when the pressure is 22.1 MPa and the temperature is above 374.1 °C. Compared with conventional biomass gasification technology, SCWG has good solubility, and it serves as both the reaction medium and the reactant, which promotes hydrolysis, the water gas shift reaction, and hydrogen production [15,16]. Chen et al. carried out supercritical water gasification of fermented corn stalks using natural gas as the input energy, discussed the energy efficiency of the gasification process, and optimized the process [17]. After optimizing the ratio of supercritical water, coal slurry, and oxygen flow rate, Chen et al. achieved a hydrogen production rate of 80% [18]. In the above studies, the energy provided for the supercritical gasification reactor was from product gas or fossil energy, which leads to a reduction in target products and lower process efficiency [19]. As a clean energy source, solar energy can be coupled to the supercritical water gasification process for the preparation of supercritical water, which can reduce the consumption of fossil energy and provide more syngas products in the same biomass raw material [20,21]. However, the conventional solar-driven biomass gasification hydrogen production technology cannot operate at night due to the intermittent impact of solar energy. An effective solution is to store energy using a coupled photothermal energy storage system to provide energy at night, while reducing carbon emissions from traditional nighttime energy supply (burning fossil energy or syngas), thereby increasing the system’s syngas output. However, none of the previous studies attempted detailed biomass supercritical water gasification hydrogen production systems coupled with solar thermal energy storage. This paper aims to establish an SCWG model driven using solar energy coupled with molten salt energy storage. The thermal energy required for the reaction and to preheat biomass and supercritical water comes from the photothermal energy storage system.
The biomass gasification process involves complex physical and chemical processes [22]. Prediction and optimization of the gasification can be performed using process simulation and surrogate models. Thermodynamic equilibrium modeling and kinetic modeling are two main aspects of biomass gasification process simulation. In the thermodynamic equilibrium model, the Gibbs free energy minimization method is applied to obtain the thermodynamic properties of the chemical process [23]. Marco et al. used Aspen Plus software V12 to establish a zero-dimensional steady-state model for woody biomass gasification. Their obtained simulation results matched well with the experimental data, and the average error of LHV and CGE of syngas was less than 7% [24]. Mendiburu et al. used the Gibbs free energy minimization method to develop and test four models. Their simulation revealed that with increasing the equivalence ratio (ER), the carbon conversion efficiency was enhanced, whereas the LHV of the syngas decreased with the increase in the equivalence ratio (ER) [25]. Compared with the thermodynamic equilibrium, kinetic modeling is more accurate due to the consideration of kinetic information and thermodynamic properties of the gasification reaction [8]. Ding et al. established a co-gasification model for municipal solid waste (MSW) and bituminous coal (BC). Their results showed that when the mixing ratio of BC was 40%, the average activation energy was the lowest [26].
The biomass gasification process has the characteristics of multi-variable, strong coupling, and nonlinearity, and there is a mutual influence among different variables. It is difficult to accurately predict the outcome of the gasification process using thermodynamic equilibrium models and kinetic models. Compared to mechanism models, surrogate models can be regarded as a “black box”. The concept of a surrogate model is to construct a mathematical model that satisfies the accuracy based on a sample set using a limited number of simulation experiments and then fit the mapping relationship between the input and output in the black box to replace the previous physical model with the surrogate model [27,28]. Kargbo et al. applied the neural network model to predict two-stage gasification, and the prediction results were consistent with the experimental data. Except for the coefficient of determination R2 values for CO2 and N2 of 0.74 and 0.82, respectively, the R2 values for other elements in the syngas were greater than 0.99 [29]. Sezer et al. used data generated with Aspen Plus software V12 to train an artificial neural network and predict the production and exergy value of hydrogen in syngas. The results showed that the relative error in predicting the exergy value of syngas is lowest when the hydrogen content in the syngas is highest [30]. Cristian et al. proposed a biomass gasification model based on the combination of a feedforward neural network (ANN) and particle swarm optimization algorithm (FF-PSO). Compared to the feedforward backpropagation (FF-BP) neural network and cascaded forward propagation (CF-P) neural network, FFF-PSO had a 23.3% lower MSE for all variables [31]. Musharavati et al. used neural networks and a multi-objective gray wolf algorithm to predict and optimize biomass-based energy systems. Their results showed that at the optimum point, the values of exergy efficiency and total cost were 15.61% and USD 206.78/h, respectively [32].
However, as the dimensions and nonlinearity of the problem increase, the sample size and calculations required to construct a neural network model increase exponentially, and the prediction accuracy of the process simulation is not adequate in the face of complex and high-dimensional variables. High-dimensional model representation (HDMR) is a tool to evaluate the mapping relationship between input variables and outputs. It is proven mathematically to be an efficient processing model because it shifts from exponential scaling to polynomic complexity, which significantly reduces the amount of computation required. In comparison to models such as artificial neural networks, HDMR is less dependent on dataset size and has a simple mathematical structure and explicit expressions, which can describe the relationships between variables [33,34]. Zhang et al. combined HDMR and Dendrite Net algorithms to solve the design optimization problem of solid launch vehicle propulsion to improve the impulse-weight ratio [35]. Huang et al. constructed HDMR models based on support vector regression (SVR) to solve high-dimensional problems and optimize the design structure of heavy-duty machine tools [36]. Xie et al. established a surrogate model based on HDMR and obtained the optimal operating coefficient for efficient dehydrogenation of propane [37].
To our best knowledge, a study on the SCWG system driven using solar energy coupled with molten salt energy storage is not available in the literature. In addition, there is no application of data-driven models to predict and optimize the SCWG system. Therefore, this work aims to address the above-mentioned research gap. The novelties of this work are as follows:
(1)
The SCWG system driven using solar energy coupled with molten salt energy storage is established to solve the intermittent problem of solar energy and provide a new method for biomass hydrogen production.
(2)
In this paper, the HDMR model is used to predict and analyze the supercritical water gasification characteristics of five different types of biomass, and the multi-objective optimization analysis of the HDMR model is carried out.
The remainder of this paper is organized as follows. Section 2.1 introduces the process flow. Aspen Plus software V12 is used to build and verify the simulation model and then to collect data from the verified simulation model for the construction of the prediction model in Section 2.2. The principles and construction methods for the HDMR model used in this paper are introduced in Section 2.3. The HDMR models are used to predict the biomass gasification process in Section 3.1, and the sensitivity analysis is introduced in Section 3.2.

2. Methodology

Using experimental data obtained from the literature, a solar-driven biomass supercritical water gasification model was developed with Aspen Plus software V12. The simulation model was validated using the experimental data, and then the HDMR model was constructed on this basis. The detailed methodology of this study is given in Section 2.1, Section 2.2 and Section 2.3

2.1. Process Flow

A flow diagram outlining the research method used in this paper is shown in Figure 1. The data used for the simulation modeling of biomass gasification were collected from the relevant literature on different biomass gasification [17,19,38]. The gasification process simulation model was established based on mass conservation and thermodynamic equilibrium. The simulation model was validated using a comparison with the experimental data from the literature. Five different types of biomasses were considered, and the design of experiments (DOE) is shown in Table 1, including operating conditions such as temperature, pressure, and the gasification agent ratio:
In Table 1, Tij is the respective individual value of temperature, Pij is the respective individual value of pressure, and BWRi is the respective individual biomass-to-water ratio. The range of operating conditions was chosen from the literature [8,39]. This paper developed an HDMR model based on the design of experiment data. The validity of the model was confirmed using the coefficient of determination (R2), mean square error (MSE), and root mean square error (RMSE), which are presented in Section 3.2. To conclude, the sensitivity results are shown in Section 3.4.

2.2. Process Simulation Model

The process simulation model was developed using Aspen Plus software V12. Five different types of biomass including wheat straw, sugarcane bagasse, sewage sludge, food waste, and corn waste were analyzed for process simulation. The ultimate analysis of the five different types of biomass is shown in Table 2 [17,40,41,42,43]. Different biomass results were collected using multiple simulation calculations for HDMR prediction, as stated in Section 2.2.2.
In the SCWG simulation model, the Pen–Robinson equation of state with the Boston–Mathias alpha function (PR-BM) is applied due to its ability to produce accurate results [38,44]. The simulation model is applied using Gibbs free energy minimization [17,19]. The total Gibbs energy of the reaction is shown in Equation (1):
G T = i = 1 N n i μ i
where ni and μi represent the molar number and chemical potential of the ith component, respectively. Considering the ideal gas properties of the gas in Equation (2):
μ i = G i 0 + R T ln ( f i f i 0 )
where fi, G i 0 , and f i 0 are the fugacity of species i in the gas mixture, the standard Gibbs free energy, and the standard fugacity of species i, respectively. Assuming that all gases are ideal gases at 1 atmosphere, Equation (2) can be rewritten as Equation (3):
μ i = Δ G f , i 0 + R T ln ( y i )
where yi represents the mole fraction of species I and Δ G f , i 0 is equal to zero for each chemical element at the standard state. According to Equation (3), Equation (4) becomes:
G t = i = 1 N n i Δ G f , i 0 + i = 1 N n i R T ln ( n i n t o t )
The minimization of the Gibbs free energy can be solved using Lagrange’s undetermined multipliers to find the values of ni that minimize the Gibbs free energy subject to the constraints of material mass balance:
i = 1 N a i j n j = A j
L n i = Δ G f , i 0 + R T ln α i + j = 1 k λ i a i j = 0
where ai and Aj represent the number of atoms of j element in species i and the total atoms of j element, respectively. λi is the Lagrange multiplier, and L is the Lagrange function.
Biomass gasification parameters were obtained from the literature [17]. The temperature range for gasification was selected from 600 °C to 700 °C with an interval of 10 °C, and the pressure range was specified from 25 MPa to 38 MPa in the interval of 1 MPa. Supercritical water was used as a gasification agent, and different biomass-to-supercritical water ratios were evaluated in this study. Different levels of the biomass-to-water ratio (BWR), including 0.053, 0.111, 0.176, 0.250, and 0.333, were applied to evaluate the results during the gasification process. In this study, the biomass-to-water ratio (BWR) is calculated using Equation (7).
BWR = Mass   flow   of   biomass Mass   flow   of   supercritical   water
The process simulation was developed with Aspen Plus using the PR-BM method, and the feed flow rate is 1000 kg/h. In process simulation, it is assumed that the model is steady state, ignoring the pressure and temperature loss in the pipeline and each reactor module, and that there are no changes in kinetic and potential energy in the flow [45,46]. The SCWG system model developed in this study is shown in Figure 2. Firstly, the mixture of biomass and water is pressurized to 25 MPa. Secondly, the mixture is transported to HX1 where it is preheated, and then the preheated mixture flows through HX2 to exchange heat with the molten salt, and then the mixture is separated from the water with SEP1 to pyrolysis in RYIELD. Thirdly, according to the element analysis of the biomass, the biomass is decomposed into C, H2, O2, N2, S, and ash in the RYIELD model, and the S and ash are separated with SEP2, and the rest of the gas is transported to RGIBBS. Fourthly, according to the GIBBS free energy minimization, the rest of the gas reacts in the RIGBBS module, which is designed for a temperature of 600–700 °C and a pressure of 25–38 MPa. The high-temperature and high-pressure syngas (CO, CO2, CH4, and H2) discharged from RGIBBS are driven into the TURBINE module to complete work, and then it passes into HX1 to preheat the biomass and water. Fifthly, the preheater gas is transported into the heater exchanger HEATER1. The moisture and the gas are separated in the flash evaporator B1. The separated gas passes through SEP to obtain hydrogen.
The use of a molten salt energy storage system can effectively solve the intermittent problem of solar energy, and the system has a high capacity for heat storage scheduling [20]. The key to the molten salt heat storage system is the selection of the molten salt. The upper and lower limits of the actual working temperature of the molten salt are by the degradation temperature and the melting temperature of the molten salt, respectively [47]. Most of the molten salts currently used are solar salts (NaNO3-KNO3: 60–40% mixed), which have high thermal melting; however, the degradation temperature is low, and the price is high [48]. Previous studies have shown that solar salts (NaNO3-KNO3) degrade above 600 °C [49,50], which is lower than the temperature range of the biomass gasification process in this study. The molten salt selected in this study was MgCl2-NaCl-KCl (56.5–22.2–21.3 wt%), which is less corrosive to containers and has a higher degradation temperature with a larger range and lower price [51]. The detailed parameters of this molten salt are shown in Table 3. The working range of this molten salt is 425–800 °C [52,53].

2.2.1. Validation of the Simulation Model

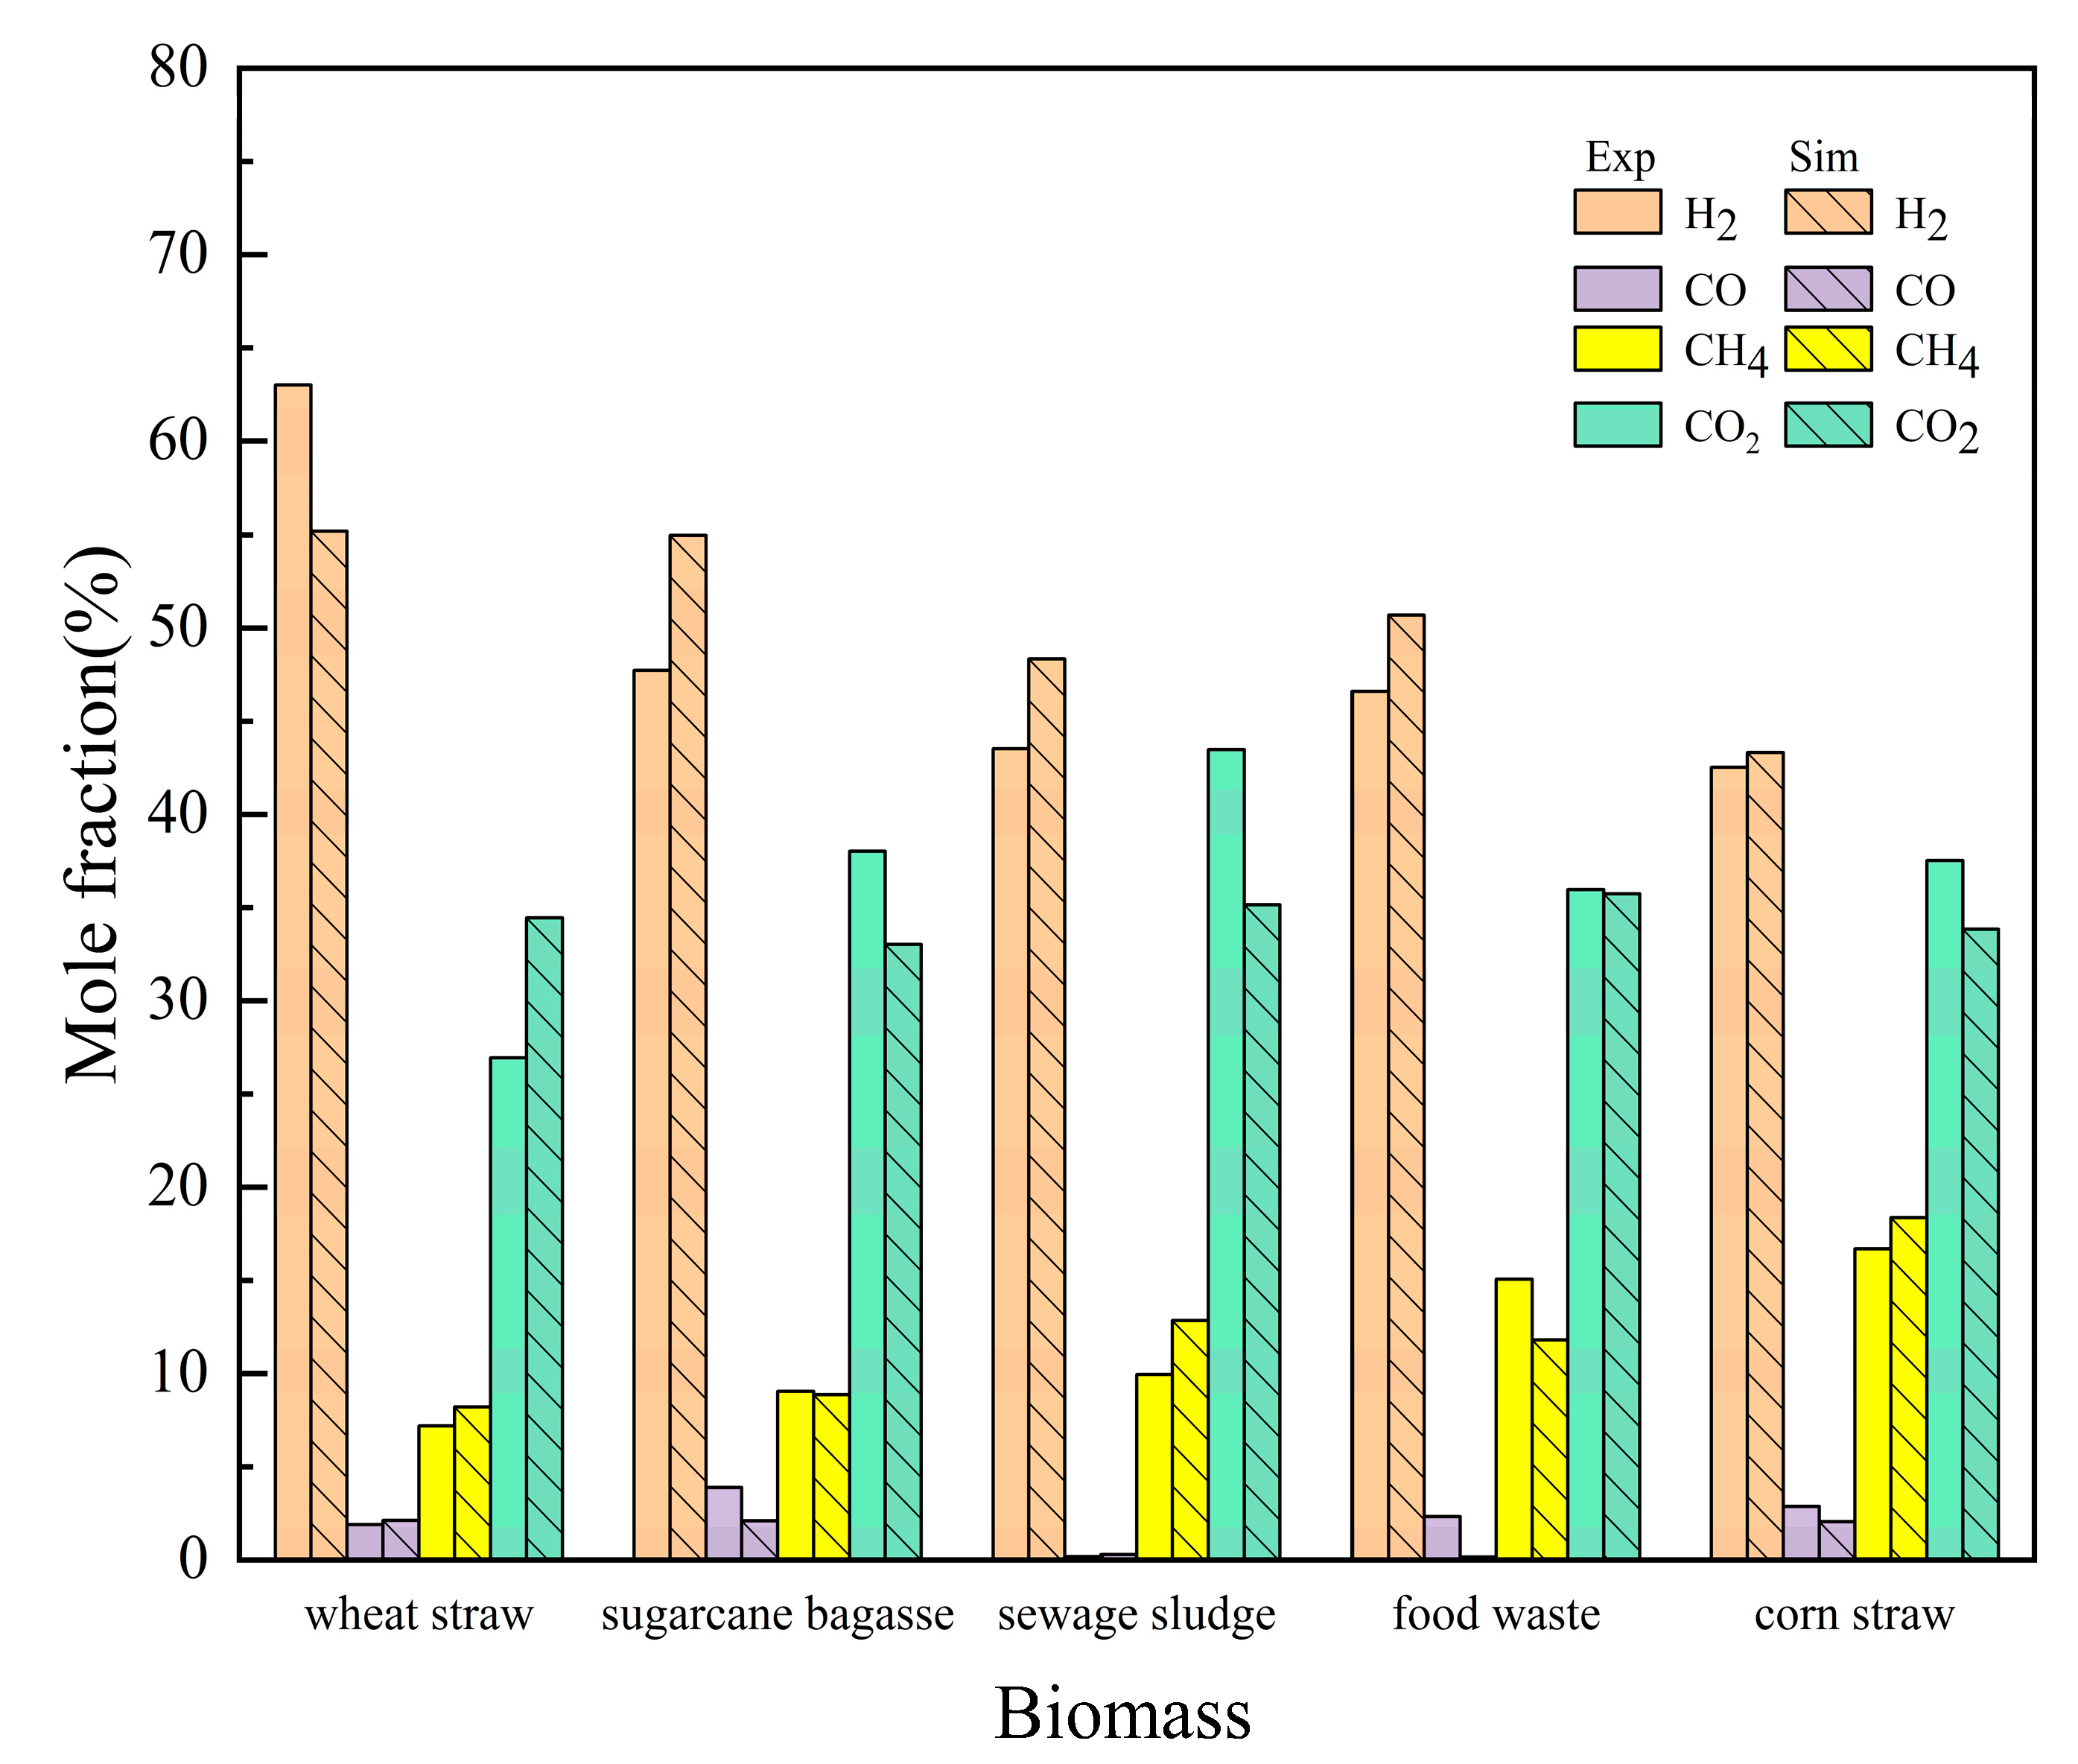
In order to ensure the rationality of the supercritical water gasification model, this paper uses experimental data obtained from the literature for verification. Results of the simulation models and experiments under the same operations for five different types of biomass, including wheat straw [54], sugarcane bagasse [42], sewage sludge [41], food waste [55], and corn waste [17,56], are compared in Figure 3. As shown in Figure 3, the simulated and experimental values for the mole fractions of the components in the syngas are similar, but there are still some differences. The reasons are as follows. Firstly, the simulation model was constructed according to chemical equilibrium and phase equilibrium using the GIBBS free energy minimization method. The results sometimes overestimate or underestimate the production of some gases due to the limitation of chemical kinetics [57]. Secondly, differences in reactor type, reaction residence time, sampling, etc., all affect the time to reach equilibrium during the experiment [58]. In previous studies, chemical thermodynamic and equilibrium modeling were successfully applied to the SCWG model for different biomass [46,59], which justifies the use of the GIBBS free energy minimization method of the SCWG model developed in this study.

2.2.2. Data Collection from the Validated Simulation Models

Data collected from the validated simulation models were applied to develop the data-driven model. Ultimate analysis of different biomass including C, H, O, N, S, and ash and operation parameters including temperature, pressure, and BWR were used as input variables, and the gas composition of syngas and lower heating value (LHV) were used as output variables, where the temperature changed from 600 °C to 700 °C with an interval of 10 °C and the pressure changed from 25 MPa to 38 MPa with an interval of 1 MPa. The BWRs were selected as 0.053, 0.111, 0.176, 0.25, and 0.333.

2.3. High-Dimensional Model Representation (HDMR)

The HDMR model was developed to predict gasification. As given in Equation (8), the output variable is expressed as a function of the input variables subsets:
y = f 0 + i = 1 N f i ( x i ) + i = 1 N j = i + 1 N f i j ( x i x j ) + f 12 N ( x 1 x 2 x N )
where f0 is the zeroth order effect, which is a constant; N is the number of input parameters; i and j index the input parameters; fi(xi) and fij (xixj) … are the first and second order components functions, respectively; and f12···N(x1x2···xN) indicates the correlated effect contributed by all the input variables to the output. However, for most practical applications, the functions containing more than two inputs can often be ignored due to their fewer contributions compared to the former terms [27,60]. Since biomass gasification is a highly nonlinear and multivariable coupling process, the HDMR model describing the gasification process was constructed using orthogonal polynomials, as shown in Equation (9):
y = C + i = 1 N k = 1 K A i , k × φ i ( x i ) + i N j = i + 1 N k = 1 K n = 1 K B i , j , k , n × φ i ( x i ) × φ j ( x j )
where C is a constant term; Ai,k and Bi,j,k,n are coefficients of first and second order component functions, respectively; and {φ} is the set of orthogonal functions. To obtain a more accurate HDMR model, the maximum error allowed by the model was applied to the objective function as a penalty item, and the objective function is shown in Equation (10):
min d D ( y d y d ) 2 + 1 2 σ d D c i 2 ( x ) , d { 1 , 2 , 3 , D }
where D represents the number of datasets, yd is the model calculated value, and y d * is the actual value. The second term is the penalty term, and σ is the penalty factor. ci(x) is shown in Equation (11).
c i ( x ) = max { | y d y d | , 0 } , d { 1 , 2 , 3 , D }
To evaluate the performance of the HDMR model, the coefficient of determination (R2), mean absolute error (MAE), and root mean square error (RMSE) were calculated using Equations (12)–(14) and the test dataset:
R 2 = 1 i = 1 N ( y i p r e y i ) 2 i = 1 N ( y i p r e y i m e a n ) 2
MAE = i = 1 N | y i p r e y i | N
RMSE = 1 N i = 1 N ( y i p r e y i ) 2
where y i p r e is the i-th prediction of the output value and yi is the i-th output value in the test dataset.
An input and output value illustration for the HDMR model in this paper is shown in Figure 4. The data generated using the Aspen Plus model was divided into an 80% training set and a 20% test set. Parameters A, B, and C were calculated by minimizing the HDMR model results and training data results. R2, MAE, and RMSE were calculated to evaluate the prediction effect of the established model with the test dataset.

2.4. Multi-Objective Optimization

During the biomass gasification process, multi-objective optimization plays an important role since it defines an optimum condition that can satisfy both thermodynamic and economic objectives to some extent. A multi-objective optimization (MOO) problem can be indicated as:
Min f (x) = [f1(x), f2(x), …, fk(x)]
s.t.                 g(x) ≤ 0
            h(x) = 0
where the integer k ≥ 2 is the number of objectives, x is a vector of decision variables in the feasible decision space X, fi(x) is the ith objective function, i = 1, 2, …, k, and g() and h() are the inequality and equality constraint vectors, respectively. The MOO problem is defined to find the particular set, x* ∈ X, that satisfies both constraints and yields the optimal values for all objective functions. Therefore, attention is paid to Pareto optimal solutions that cannot be improved in any of the objectives without degrading a least one of the other objectives. In mathematical terms, a feasible solution x1X is expressed to dominate another solution x2X, if ∀i ∈ {1, …, k}, fi(x1) ≤ fi(x2), and ∃ i ∈ {1, …, k}, fi(x1) < fi(x2). The Pareto optimal set is S = {x*X: x* is Pareto optimal} if there does not exist another solution that dominates it and the Pareto front is F = {f(x): xS}.
A GA (genetic algorithm) is a metaheuristic inspired by the process of natural selection that belongs to the larger class of evolutionary algorithms (EAs). Genetic algorithms are used to generate high-quality solutions for optimization and search problems using biologically inspired operators such as mutation, crossover, and selection.
The non-dominated sorting genetic algorithm (NSGA) has been applied to various problems. In NSGA-II, each solution must be compared with every other solution in the population to determine if it is dominated and to sort the population according to the level of non-domination. The crowding coefficient used to preserve the diversity among non-dominated solutions is calculated to sort the population according to the ascending order of the size of each objective function value. Elite strategy is introduced to combine excellent individuals in the parent population and its child population to prevent the loss of Pareto optimal solutions.

3. Results and Discussions

The results for the statistical analyses of the variables are described in Section 3.1. The performance of the HDMR model is discussed in Section 3.2. In Section 3.3, the HDMR model is applied to predict the impact of single input variables and the interaction between the input variables on syngas, respectively.

3.1. Statistical Results and Analysis of a Linear Relationship between Any Two Variables

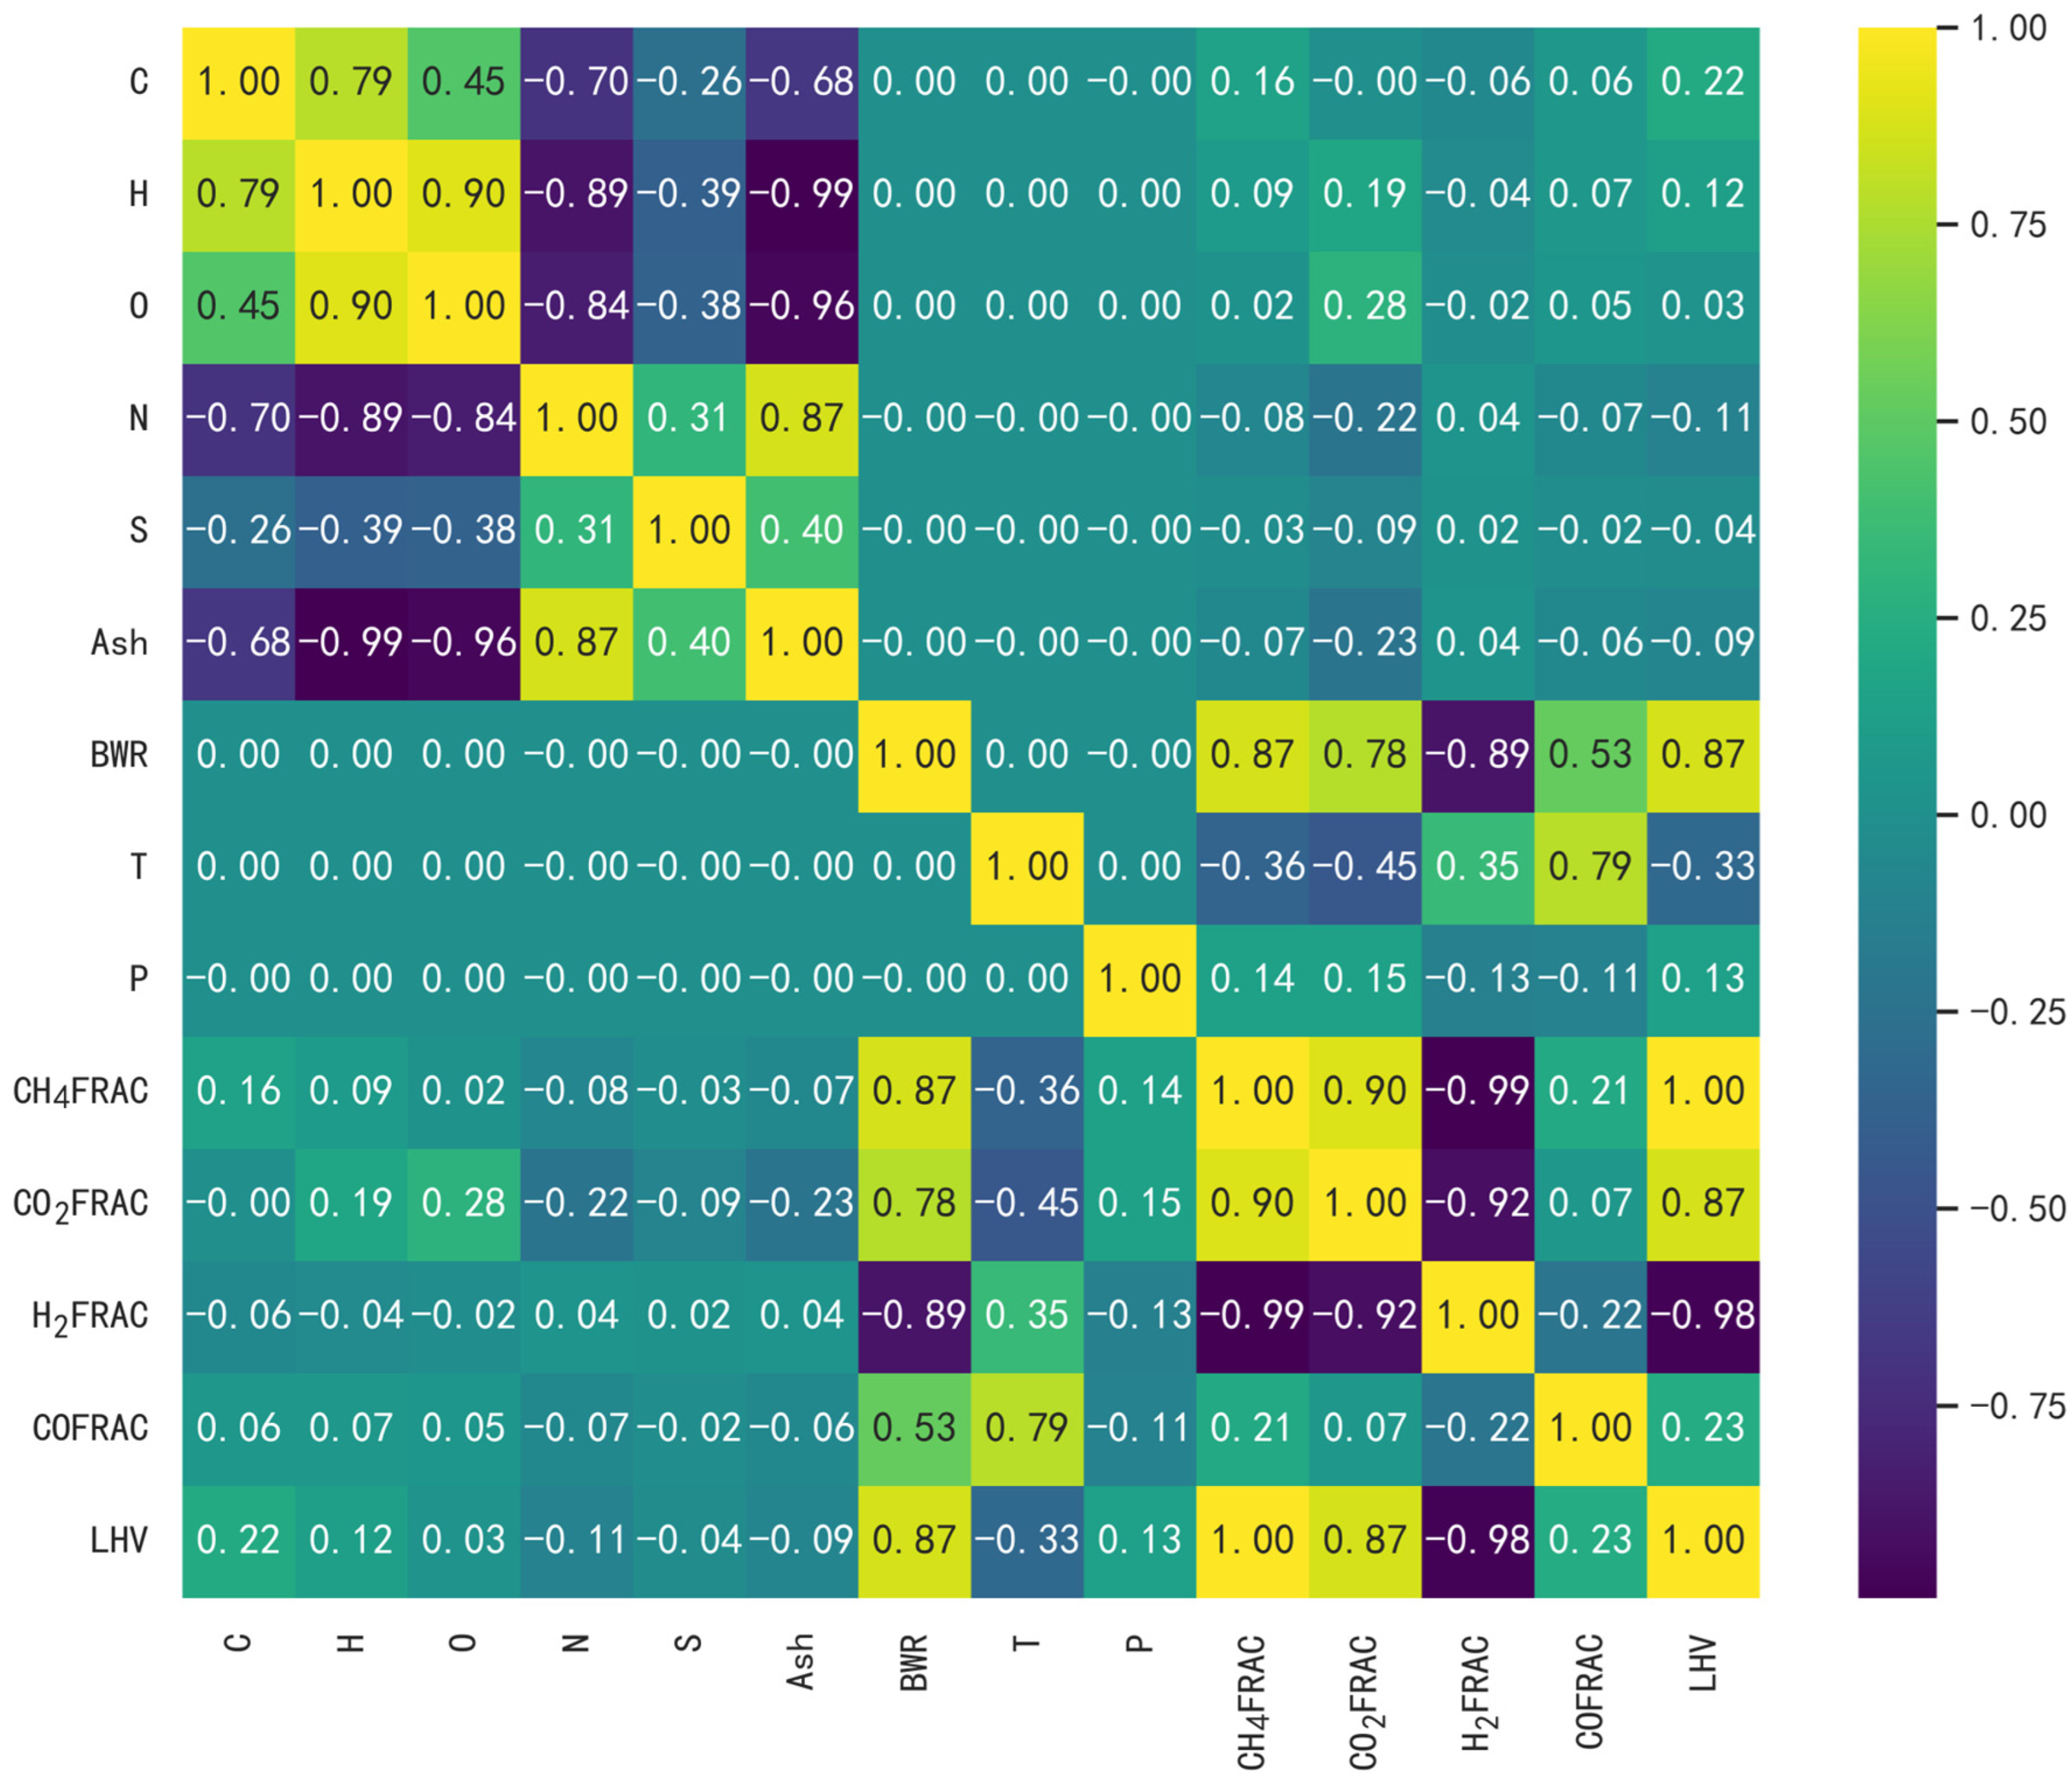
The Pearson correlation coefficient (PCC) is a correlation coefficient commonly used in linear regression. The Pearson correlation coefficient varies between −1 and 1. Figure 5 presents the PCC matrix. Considering the relationship between the biomass composition and mole fraction of syngas, C and H affect the mole fraction of CH4 and H2 according to the material conversation; therefore, there is a strong negative correlation between the output variables for CH4 and H2. Temperature is negatively correlated with CH4(−0.36), which indicates that methane burns more easily at high temperatures [61]. In addition, BWR and H2 are negatively correlated because an increasing BWR promotes CH4 production [58]. Although the Pearson coefficient can simply show the correlation between variables, the Pearson coefficient can only represent the linear relationship between two variables and cannot predict the specific impact of the input variable on the output variable. To obtain the deep relationships between operation parameters and the properties of syngas, in the next sections of this paper, the HDMR model is applied to predict biomass gasification and accordingly explore the influence of single operation parameters and their interactions on syngas.

3.2. The Performance of the Prediction Models

Using the data set in Section 2.2.2, the HDMR model proposed in this paper is used to predict the gasification process. The results are shown in Figure 6. The predicted values for the mole fraction of H2, CH4, CO, CO2, gasification yield of H2, and LHV (lower heating value) of syngas are consistent with the actual values. The values R2 for the mole fraction of H2, CH4, CO, CO2, gasification yield of H2, and LHV of syngas are 0.995, 0.996, 0.997, 0.996, 0.999, and 0.995, respectively, as shown in Figure 7. The MAE and RMSE for the prediction model are listed in Table 4. According to the data in the table, the model for H2 gasification yield performs best on the test, with MAE and RMSE values of 0.00128 and 0.00191, respectively. All prediction models show extraordinary generalization skills. All model predictions and actual values have an appropriate agreement. Thus, the HDMR model established in this paper has a good prediction effect and is robust.

3.3. Analysis of the effects of Single Operation Parameters on Syngas Properties

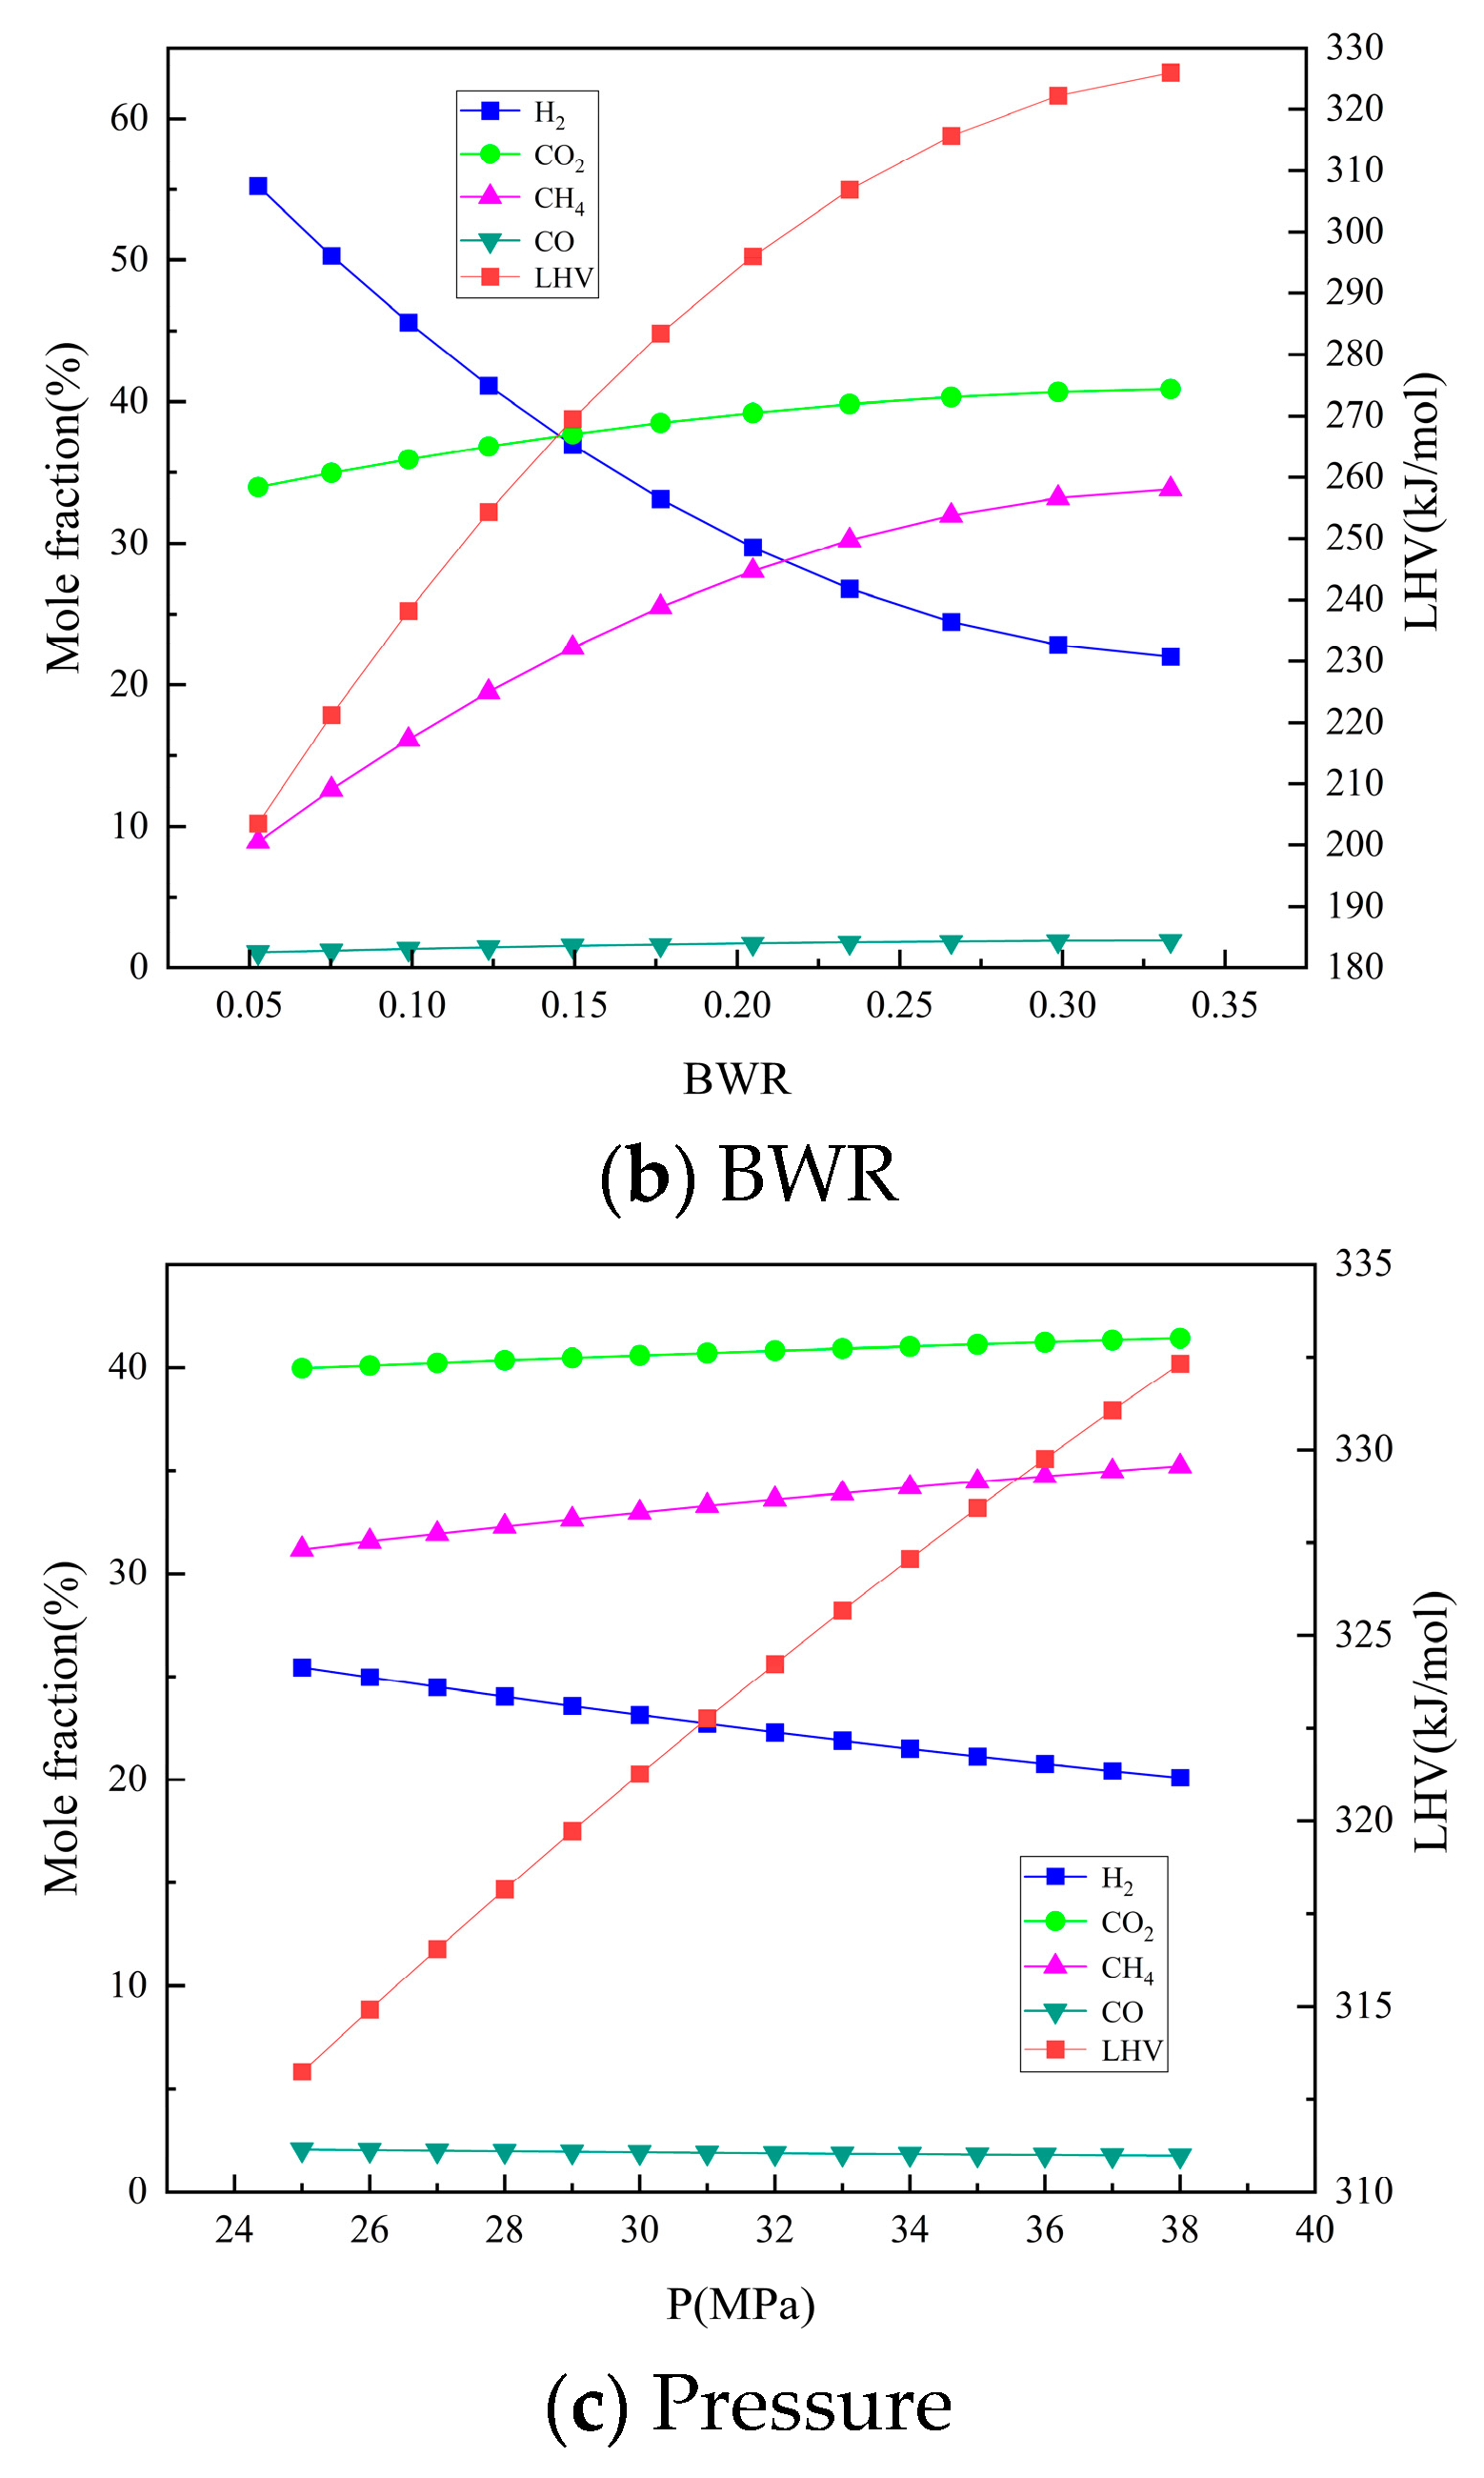
To explore the relationship between the operating conditions and syngas properties, the effect of operating conditions on syngas was analyzed using an average of the values over the other features [62]. Figure 7 shows the effect of temperature, BWR, and pressure on the LHV and mole fraction of each component in the syngas. Temperature is the most important influencing factor whenever the reactions occur in supercritical water. The effect of temperature on SCWG is shown in Figure 7a. As the temperature increases from 600 °C to 700 °C, the mole fraction of CH4 and CO decreases, and the mole fraction of H2 and CO increases, respectively. The reason for the change is that supercritical water gasification mainly includes the steam reforming reaction, the water–gas shift reaction, the and methanation reaction, as shown in Equations (16)–(19). The changes in hydrogen and methane are mainly affected by the steam reforming reaction and the methanation reaction, respectively. Steam reforming is an endothermic process, and increasing the temperature promotes the steam reaction, and thus the hydrogen production rate increases.
Steam reforming reaction:
C x H y O z + ( x z ) H 2 O xCO + ( x z + y / 2 ) H 2
C x H y O z + ( 2 x z ) H 2 O xCO 2 + ( 2 x z + y / 2 ) H 2
Water–gas shift reaction:
CO + H 2 O CO 2 + H 2
Methanation reaction:
CO + 3 H 2 CH 4 + H 2 O
LHV is related to the production of syngas, in which methane production is much greater than hydrogen production. As the temperature increases, the mole fraction of H2 increases, the mole fraction of CH4 decreases, and the methane production decreases, resulting in a decrease in the LHV of the syngas.
The BWR is another key parameter in the SCWG process. The effect of the BWR on SCWG is shown in Figure 7b. When the BWR increases from 0.053 to 0.333, the mole fraction of H2 and CH4 decreases and increases, respectively, and the LHV of the syngas decreases. Biomass and water are both reactants in SCWG reactions. An increase in the BWR means that the content of reaction water decreases. A lower water content limits the forward reaction of the steam reforming reaction and the water–gas shift reaction, and the reactions proceed in the reverse direction. Therefore, the mole fraction of H2 decreases, the model fraction of CH4 increases, and the LHV of syngas increases.
Figure 7c shows the effect of pressure on the SCWG process. Compared to temperature and the BWR, pressure has less effect on the SCWG process. As the pressure increases, the mole fraction of H2 and CH4 show little change, and the mole fraction of H2 and CH4 slightly increase, respectively. Under supercritical conditions, high pressure promotes hydrolysis and water–gas shift reactions and exhibits pyrolysis reactions. However, when the pressure is reduced below a critical point, the advantages of SCWG, such as high solubility and strong diffusivity disappear, which has a negative effect on biomass gasification [63].

3.4. Analysis of the effects of Operation Parameter Interactions on Syngas Properties

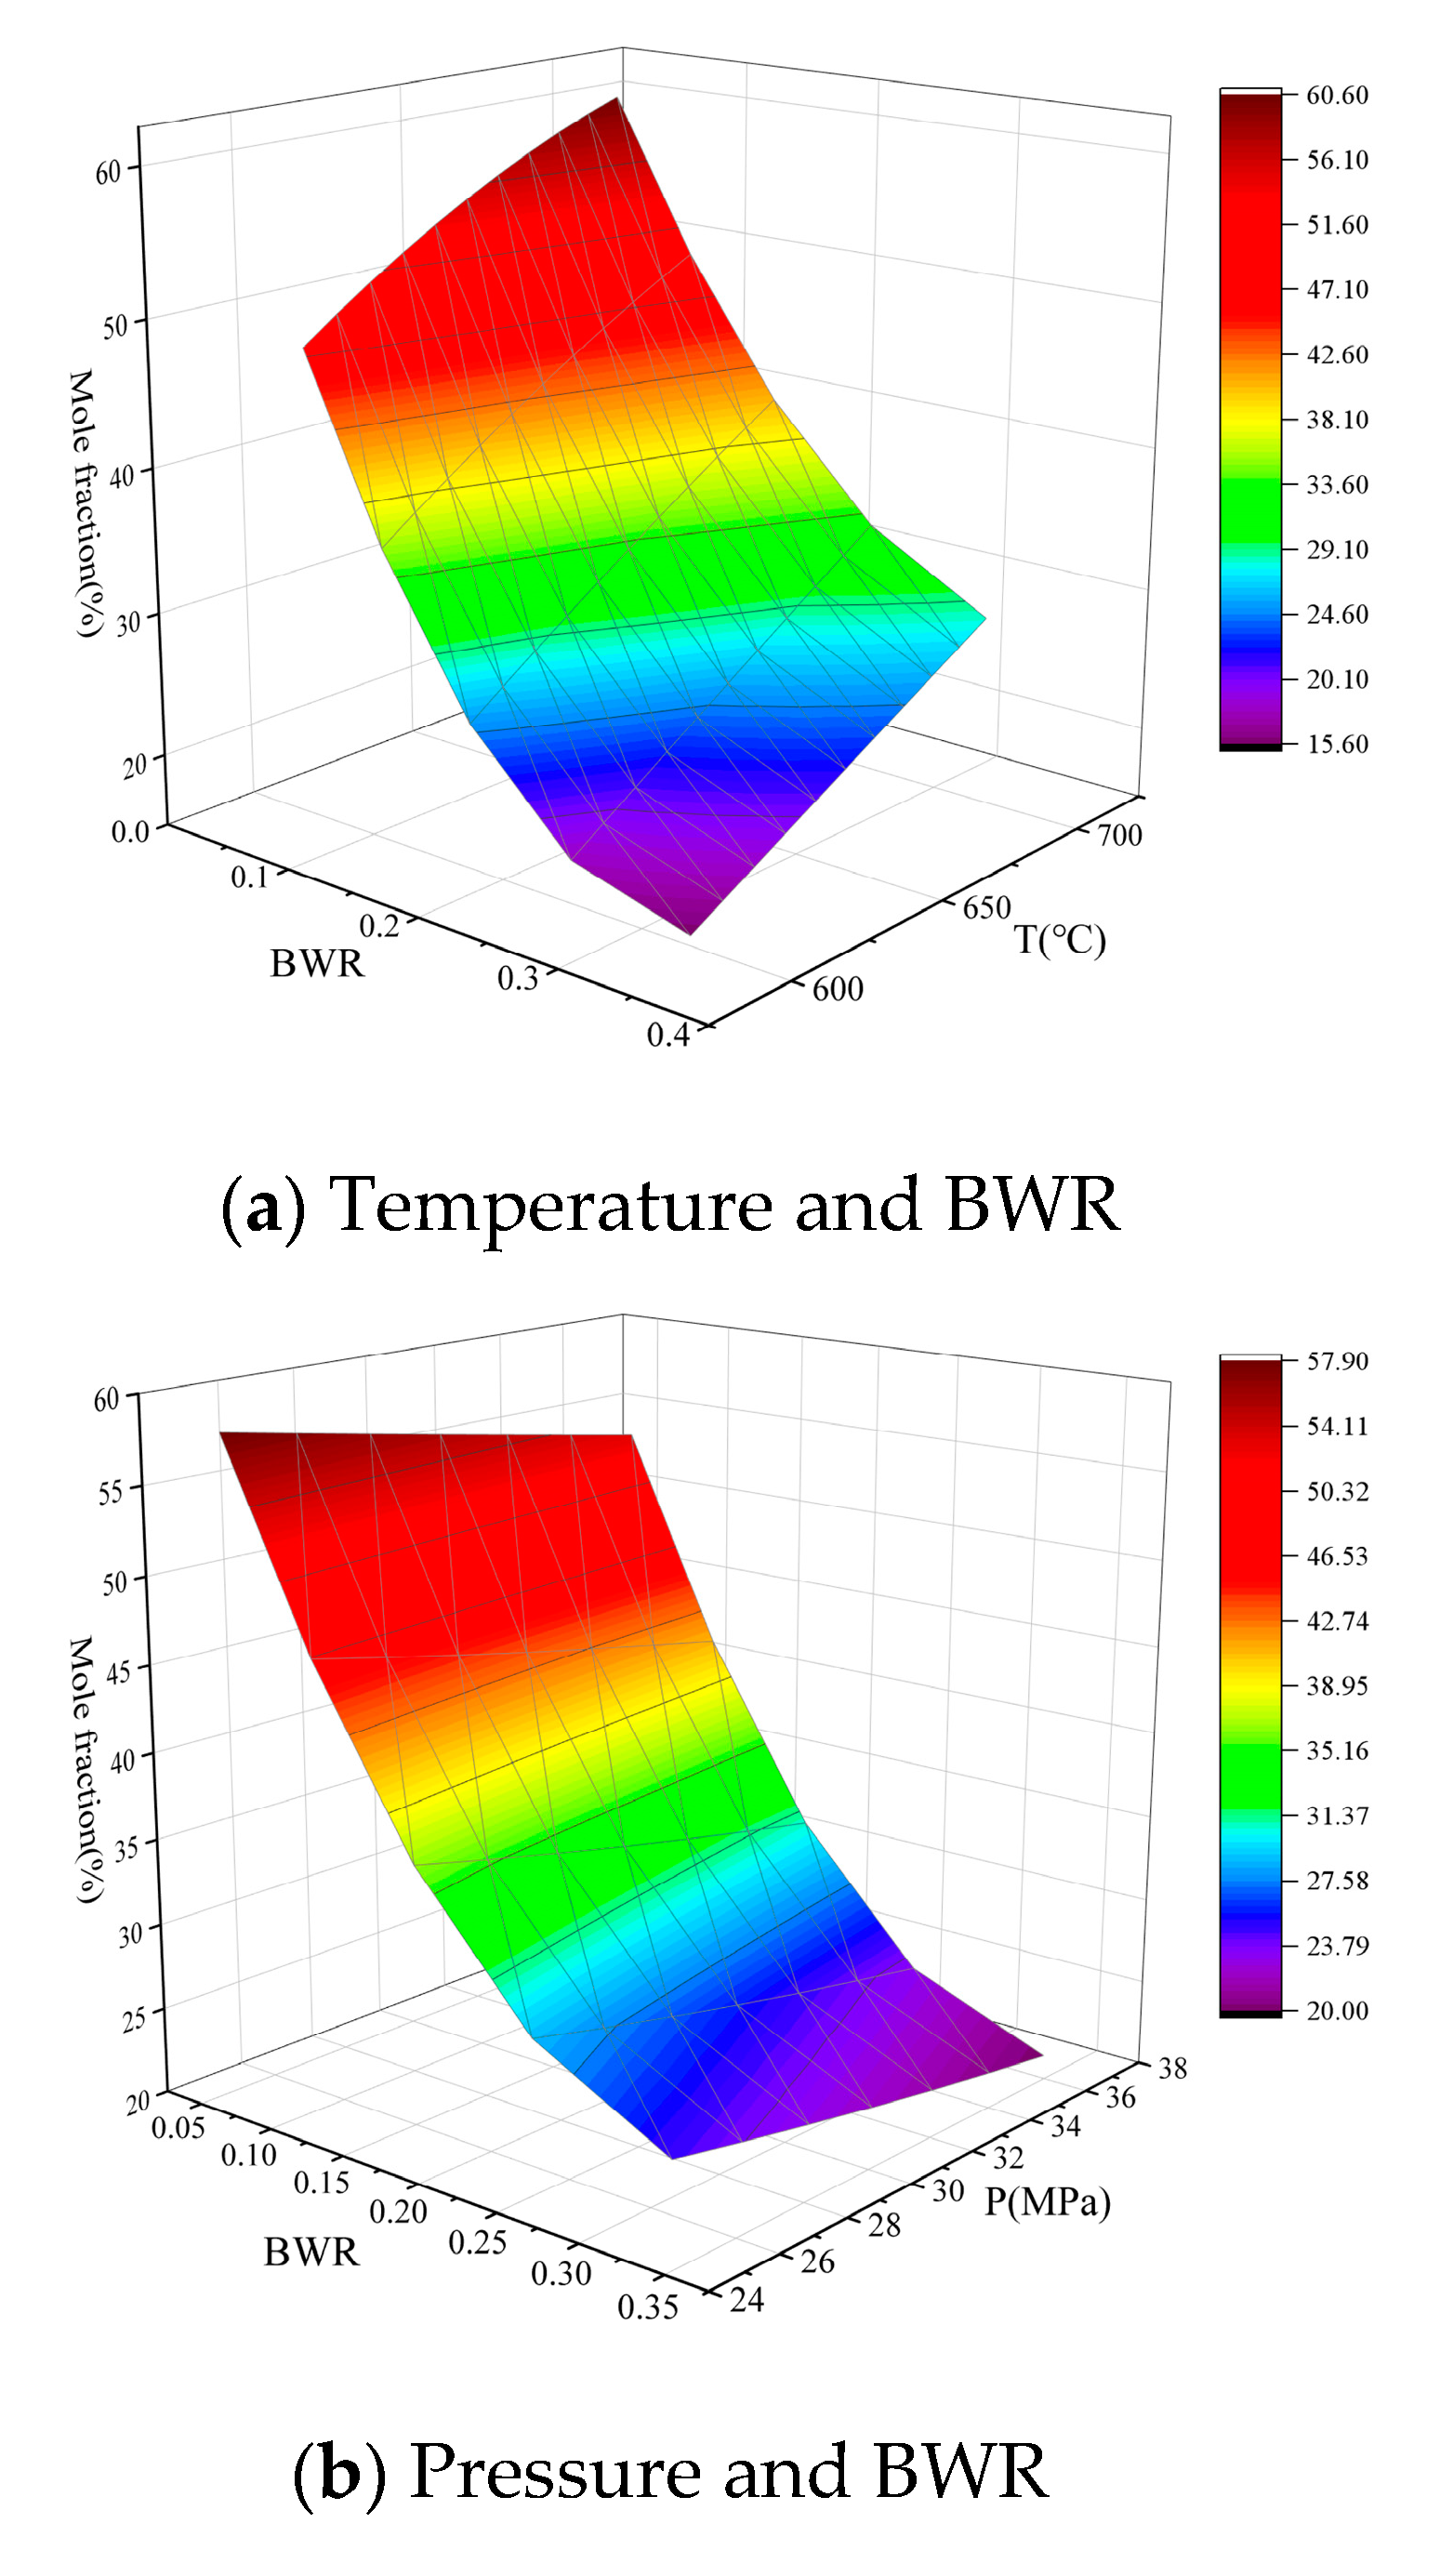
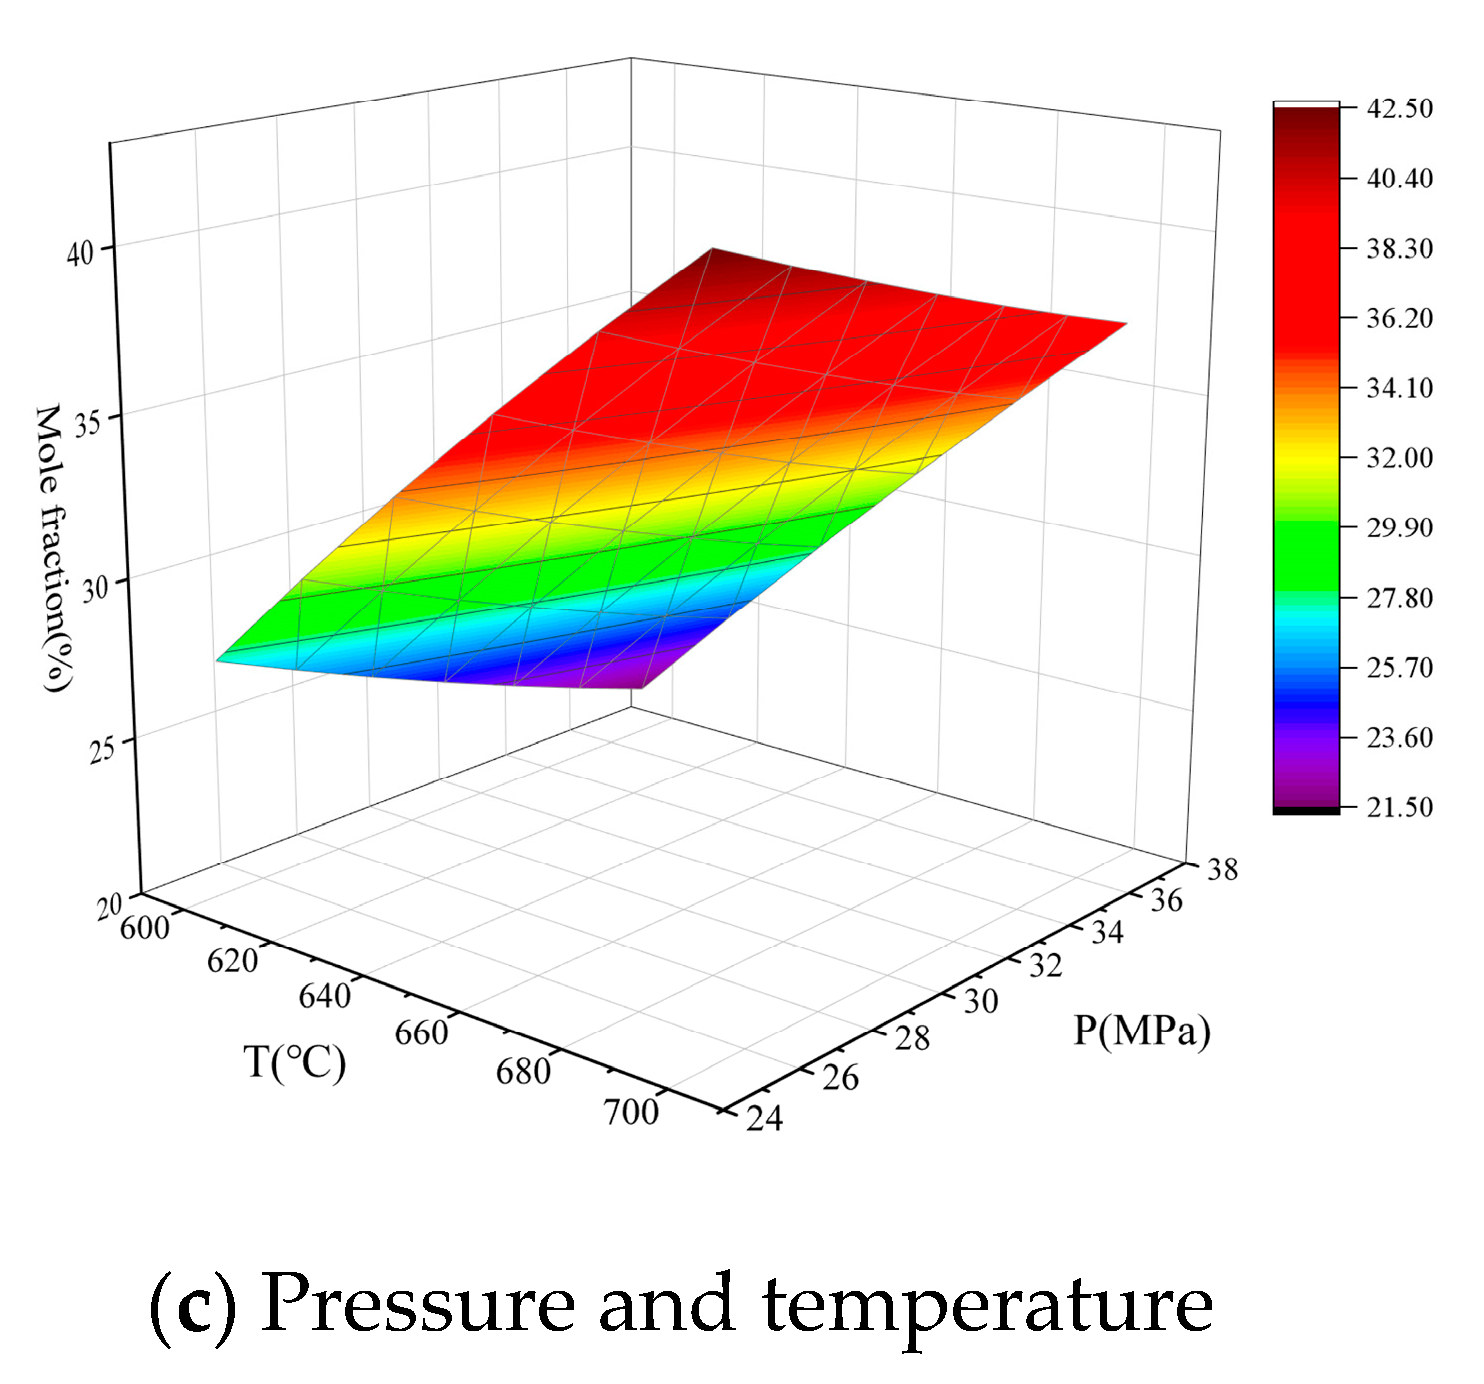
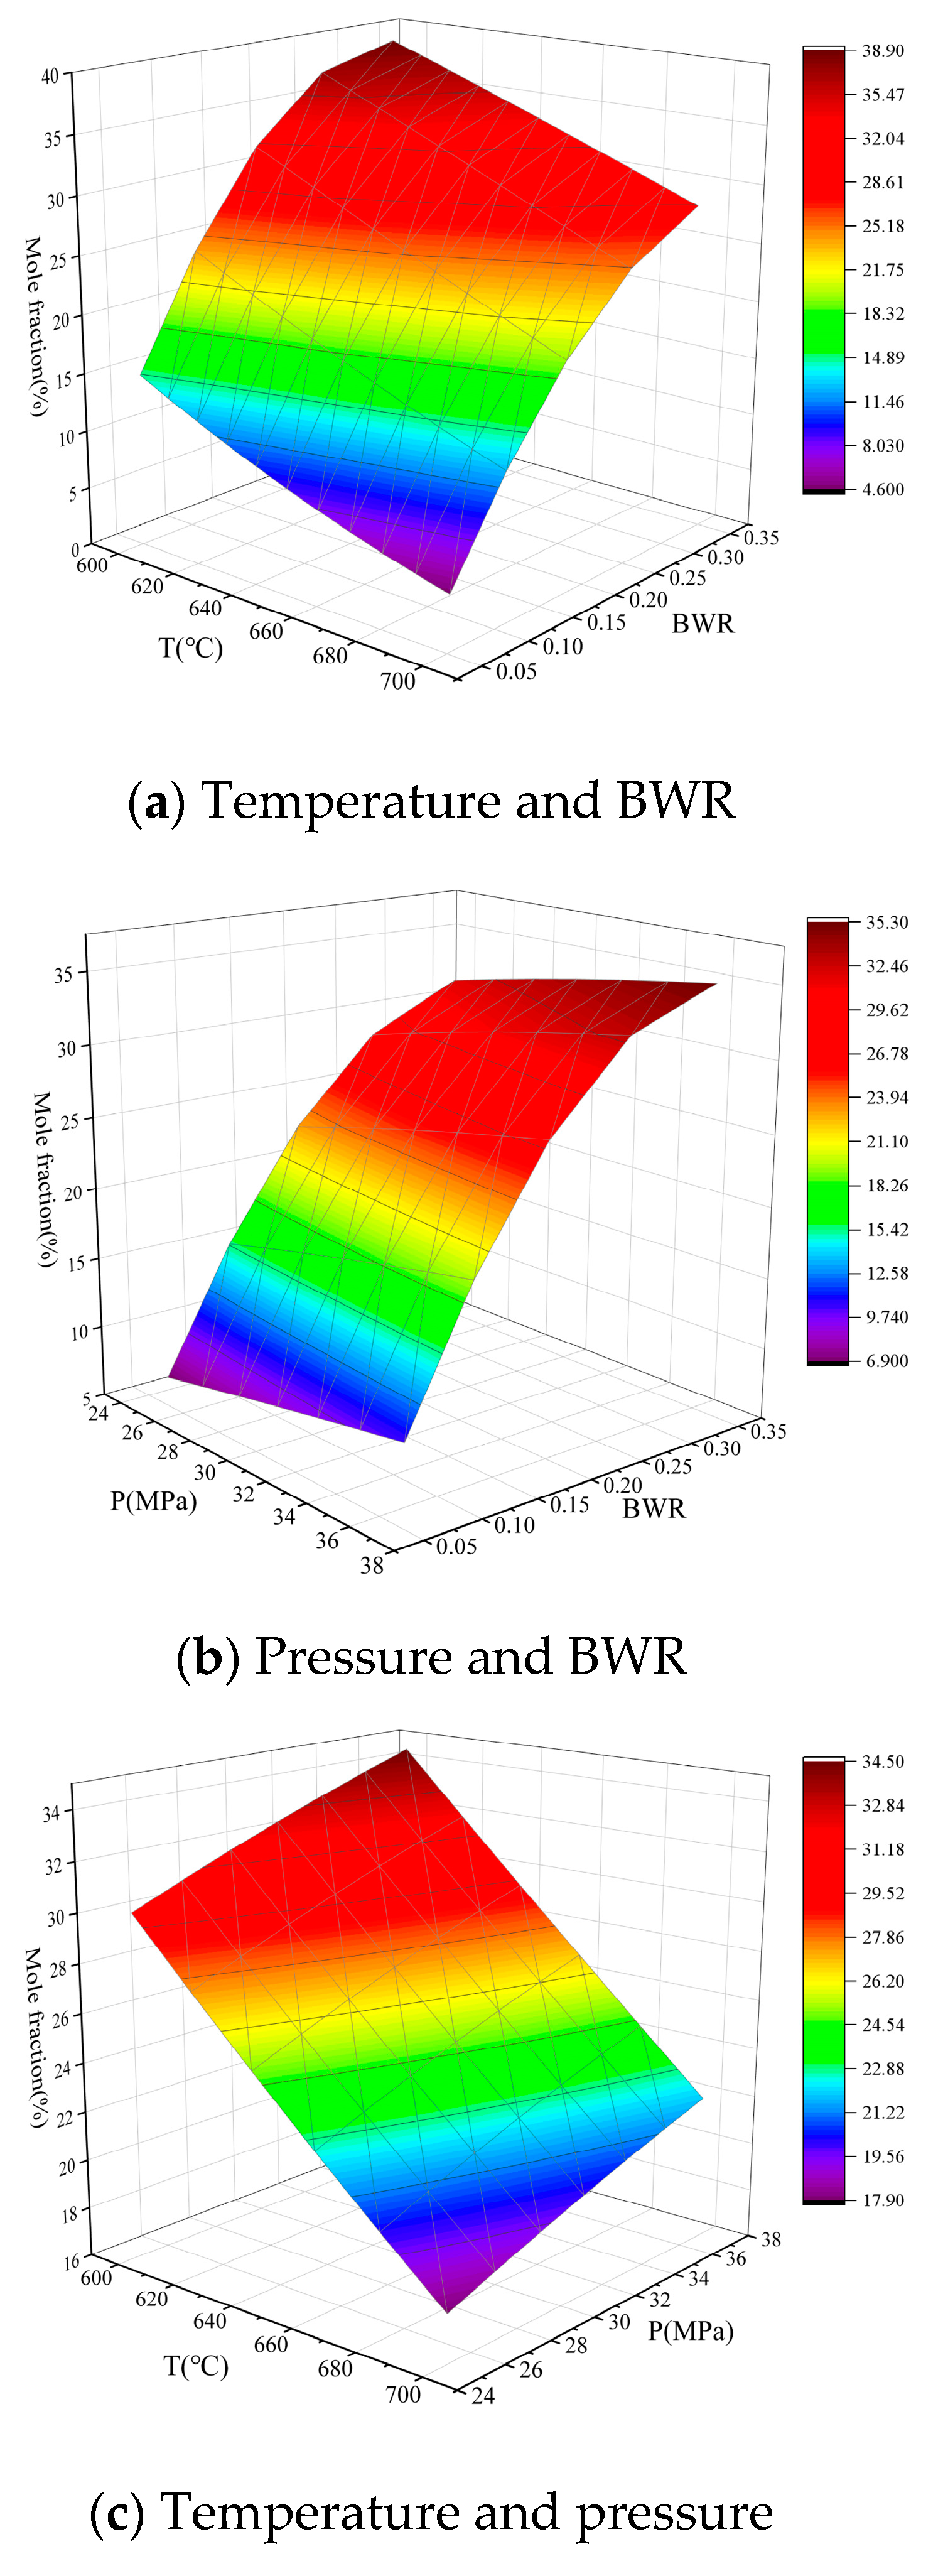
The effects of process operation parameters including temperature, the BWR, and pressure on the mole fraction of H2 and CH4 are illustrated in Figure 8 and Figure 9, respectively.
Figure 8a–c shows the effect of the BWR and temperature, the BWR and pressure, and temperature and pressure on the mole fraction of H2, respectively. Figure 8a indicates that the mole fraction of H2 has an intense tendency to increase when the BWR decreases and the temperature increase, and the BWR has a stronger effect on the mole fraction of H2 compared to temperature. As shown in Figure 8b, the mole fraction of H2 increases when the BWR and pressure increase. Compared with pressure, the mole fraction of H2 is more sensitive to the BWR. The phenomenon can be explained by the fact that water and biomass are direct reactants in Equations (16)–(19), and decreasing the BWR results in reactant water increasing. According to Equations (16)–(19), a high water content promotes the forward reaction of the steam reforming reaction and the water–gas shift reaction, and thus the mole fraction of H2 increases. Figure 8c shows the effects of temperature and pressure on the mole fraction of H2. According to Figure 8c, pressure has a slight effect on the mole fraction of H2 compared to temperature. The reason is that pressure has little effect on the reaction in the SCWG process when the temperature is fixed.
Figure 9a–c shows the effect of the BWR and temperature, the BWR and pressure, and temperature and pressure on the mole fraction of CH4, respectively. As shown in Figure 9a, the mole fraction of CH4 increases as the BWR increases and the temperature decreases, and the mole fraction of CH4 is more sensitive to the BWR compared to temperature. Increasing the BWR promotes the forward reaction of the steam reforming and water–gas shift reactions, resulting in an increase in the mole fraction of CH4. Figure 9b indicates that the mole fraction of CH4 has an intense tendency to increase as the BWR increases, and the growth rate of the mole fraction of CH4 slows down when the BWR ranges from 0.25 to 0.35. Figure 9c shows the effects of the interaction between temperature and pressure on the mole fraction of CH4. It can be seen that pressure has little effect on the mole fraction of CH4, and the explanation is provided in Section 3.3.

3.5. Multi-Objective Optimization

Multi-objective optimization provides a better solution for SCWG since the biomass gasification process is affected by multiple-variable coupling. The HDMR models constructed in Section 3.2 were applied to obtain the multi-objective optimal solution using the process parameters. Considering the economics and characteristics of syngas, the HDMR models for the gasification yield of H2 and the LHV of syngas are regarded as objective functions. The objective functions and the constraints are shown in Equations (20) and (21):
Max Gasification yield of H2 = fHDMR (T, BWR, P)
Max LHV of syngas = fHDMR (T, BWR, P)
s.t. 600 °C ≤ T ≤ 700 °C
0.052632 ≤ BWR ≤ 0.33
25 MPa ≤ P ≤ 38 MPa
where fHDMR (·) are the objective functions between the three operation parameters listed in Table 1. In this study, multi-objective optimization is carried out for five different types of biomass, including wheat straw, sugarcane bagasse, sewage sludge, food waste, and corn straw.
The HDMR models that satisfied the constraints in Equation (21) were developed. The multi-objective optimization results for the different types of biomass are shown in Table 5. The optimization results show that a low BWR contributes most to the gasification yield of H2 and LHV of syngas.

4. Conclusions

Firstly, in this study, a SCWG system coupled with photothermal energy storage was established using Aspen Plus. The biomass gasification process is supplied with energy using the photothermal storage system, which avoids the carbon emission problem of conventional fossil. Secondly, an HDMR model was established to predict and analyze the supercritical water gasification characteristics of five different types of biomass, and the multi-objective optimization analysis of the HDMR model was adopted. In this study, the HDMR-based prediction model was applied for SCWG. The HDMR model R2 values were 0.995, 0.996, 0.997, 0.996, 0.999, and 0.995 for mole fraction of H2, CH4, CO, CO2, gasification yield of H2, and the LHV of syngas, respectively, which indicated a good prediction effect. The operation parameters analysis showed that temperature and the BWR were the most contributing factors to the SCWG process compared to pressure. The non-dominated sorted genetic algorithm II (NSGA II) algorithm was used to maximize the gasification yield of H2 and the LHV of syngas in the SCWG process for five different types of biomass. The optimization results showed thata low BWR leads to a high gasification yield of H2 and LHV of syngas.

Author Contributions

Conceptualization, M.J.; Methodology, J.L.; Writing—original draft, H.L.; Writing—review & editing, H.X. and S.W. All authors have read and agreed to the published version of the manuscript.

Funding

This research is supported by the Fundamental Research Funds for the Central Universities, China: DUT21RC(3)043, and Natural Science Foundation of Hebei Province: E2021203041.

Data Availability Statement

Data is contained within the article. The data presented in this study are available in [17,41,42,54,55].

Conflicts of Interest

The authors declare no conflict of interest.

References

  1. Ramalingam, S.; Ezhumalai, M.; Govindasamy, M. Syngas: Derived from biodiesel and its influence on CI engine. Energy 2019, 189, 116–189. [Google Scholar] [CrossRef]
  2. Hanif, I.; Raza, S.M.F.; Gago-de-Santos, P.; Abbas, Q. Fossil fuels, foreign direct investment, and economic growth has triggered CO2 emissions in emerging Asian economies: Some empirical evidence. Energy 2019, 171, 493–501. [Google Scholar] [CrossRef]
  3. Darmawan, A.; Ajiwibowo, M.W.; Yoshikawa, K.; Aziz, M.; Tokimatsu, K. Energy-efficient recovery of black liquor through gasification and syngas chemical looping. Appl. Energy 2018, 219, 290–298. [Google Scholar] [CrossRef]
  4. Zheng, J.-L.; Zhu, M.-Q.; Wen, J.-L.; Sun, R.-C. Gasification of bio-oil: Effects of equivalence ratio and gasifying agents on product distribution and gasification efficiency. Bioresour. Technol. 2016, 211, 164–172. [Google Scholar] [CrossRef]
  5. Zhang, J.; Fu, H.; Liu, Y.; Dang, H.; Ye, L.; Conejio, A.N.; Xu, R. Review on biomass metallurgy: Pretreatment technology, metallurgical mechanism and process design. Int. J. Miner. Metall. Mater. 2022, 29, 1133–1149. [Google Scholar] [CrossRef]
  6. Taghizadeh-Alisaraei, A.; Tatari, A.; Khanali, M.; Keshavarzi, M. Potential of biofuels production from wheat straw biomass, current achievements and perspectives: A review. Biofuels 2022, 14, 79–92. [Google Scholar] [CrossRef]
  7. Shah, S.; Venkatramanan, V. Advances in microbial technology for upscaling sustainable biofuel production. In New and Future Developments in Microbial Biotechnology and Bioengineering; Elsevier: Amsterdam, The Netherlands, 2019; pp. 69–76. [Google Scholar]
  8. Mazaheri, N.; Akbarzadeh, A.; Madadian, E.; Lefsrud, M. Systematic review of research guidelines for numerical simulation of biomass gasification for bioenergy production. Energy Convers. Manag. 2019, 183, 671–688. [Google Scholar] [CrossRef]
  9. Safarian, S.; Unnthorsson, R.; Richter, C. Performance investigation of biomass gasification for syngas and hydrogen production using Aspen Plus. Open J. Model. Simul. 2022, 10, 71–87. [Google Scholar] [CrossRef]
  10. Moretti, L.; Arpino, F.; Cortellessa, G.; Dell’Isola, M.; Ficco, G.; Grossi, G.; Zuena, F.; Di Palma, M.; Vanoli, L. Analytical and numerical modelling of biomass gasification in downdraft gasifiers. J. Phys. Conf. Ser. 2022, 2177, 012028. [Google Scholar] [CrossRef]
  11. Zoppi, G.; Pipitone, G.; Pirone, R.; Bensaid, S. Aqueous phase reforming process for the valorization of wastewater streams: Application to different industrial scenarios. Catal. Today 2022, 387, 224–236. [Google Scholar] [CrossRef]
  12. Kanthasamy, R.; Ali, I.; Ayodele, B.V.; Maddah, H.A. Bio-hydrogen production from the photocatalytic conversion of wastewater: Parametric analysis and data-driven modelling using nonlinear autoregressive with exogeneous input and back-propagated multilayer perceptron neural networks. Fuel 2023, 344, 128026. [Google Scholar] [CrossRef]
  13. Meier, T.R.W.; Cremonez, P.A.; Maniglia, T.C.; Maddah, H.A. Production of biohydrogen by an anaerobic digestion process using the residual glycerol from biodiesel production as additive to cassava wastewater. J. Clean. Prod. 2020, 258, 120833. [Google Scholar] [CrossRef]
  14. Zhang, H.; Gong, M.; Ding, L.; Su, Y. Energy recovery and phosphorus phase behaviour from catalytic gasification of cyanobacterial biomass in supercritical water. Biomass Bioenergy 2020, 134, 105477. [Google Scholar] [CrossRef]
  15. Leong, Y.K.; Chen, W.-H.; Lee, D.-J.; Chang, J.-S. Supercritical water gasification (SCWG) as a potential tool for the valorization of phycoremediation-derived waste algal biomass for biofuel generation. J. Hazard. Mater. 2021, 418, 126278. [Google Scholar] [CrossRef]
  16. Wei, N.; Xu, D.; Hao, B.; Guo, S.; Guo, Y.; Wang, S. Chemical reactions of organic compounds in supercritical water gasification and oxidation. Water Res. 2021, 190, 116634. [Google Scholar] [CrossRef]
  17. Chen, J.; Liu, Y.; Wu, X.; Jiaqiang, E.; Leng, E.; Zhang, F.; Liao, G. Thermodynamic, environmental analysis and comprehensive evaluation of supercritical water gasification of biomass fermentation residue. J. Clean. Prod. 2022, 361, 132126. [Google Scholar] [CrossRef]
  18. Chen, J.; Wang, L.; Cheng, Z.; Lu, L.; Guo, L.; Jin, H.; Zhang, D.; Wang, R.; Liu, S. Performance simulation and thermodynamics analysis of hydrogen production based on supercritical water gasification of coal. Int. J. Hydrogen Energy 2021, 46, 28474–28485. [Google Scholar] [CrossRef]
  19. Rahbari, A.; Venkataraman, M.B.; Pye, J. Energy and exergy analysis of concentrated solar supercritical water gasification of algal biomass. Appl. Energy 2018, 228, 1669–1682. [Google Scholar] [CrossRef]
  20. Jiang, P.; Dong, J.; Huang, H. Optimal integrated demand response scheduling in regional integrated energy system with concentrating solar power. Appl. Therm. Eng. 2020, 166, 114754. [Google Scholar] [CrossRef]
  21. Bai, Z.; Liu, Q.; Lei, J.; Hong, H.; Jin, H. New solar-biomass power generation system integrated a two-stage gasifier. Appl. Energy 2017, 194, 310–319. [Google Scholar] [CrossRef]
  22. Ren, J.; Cao, J.-P.; Zhao, X.-Y.; Yang, F.-L.; Wei, X.-Y. Recent advances in syngas production from biomass catalytic gasification: A critical review on reactors, catalysts, catalytic mechanisms and mathematical models. Renew. Sustain. Energy Rev. 2019, 116, 109426. [Google Scholar] [CrossRef]
  23. Srinivas, T.; Gupta, A.; Reddy, B.V. Thermodynamic equilibrium model and exergy analysis of a biomass gasifier. J. Energy Resour. Technol. 2009, 131, 031801. [Google Scholar] [CrossRef]
  24. Formica, M.; Frigo, S.; Gabbrielli, R. Development of a new steady state zero-dimensional simulation model for woody biomass gasification in a full scale plant. Energy Convers. Manag. 2016, 120, 358–369. [Google Scholar] [CrossRef]
  25. Mendiburu, A.Z.; Carvalho, J.A., Jr.; Zanzi, R.; Coronado, C.R.; Silveira, J.L. Thermochemical equilibrium modeling of a biomass downdraft gasifier: Constrained and unconstrained non-stoichiometric models. Energy 2014, 71, 624–637. [Google Scholar] [CrossRef]
  26. Ding, G.; He, B.; Yao, H.; Kuang, Y.; Song, J.; Su, L. Synergistic effect, kinetic and thermodynamics parameters analyses of co-gasification of municipal solid waste and bituminous coal with CO2. Waste Manag. 2021, 119, 342–355. [Google Scholar] [CrossRef]
  27. Rabitz, H.; Aliş, Ö.F. General foundations of high-dimensional model representations. J. Math. Chem. 1999, 25, 197–233. [Google Scholar] [CrossRef]
  28. Li, G.Y.; Artamonov, M.; Rabitz, H.; Wang, S.W.; Georgopoulos, P.G.; Demiralp, M. High-dimensional model representations generated from low order Terms—1p-RS-HDMR. J. Comput. Chem. 2003, 24, 647–656. [Google Scholar] [CrossRef] [PubMed]
  29. Kargbo, H.O.; Zhang, J.; Phan, A.N. Optimisation of two-stage biomass gasification for hydrogen production via artificial neural network. Appl. Energy 2021, 302, 117567. [Google Scholar] [CrossRef]
  30. Sezer, S.; Özveren, U. Investigation of syngas exergy value and hydrogen concentration in syngas from biomass gasification in a bubbling fluidized bed gasifier by using machine learning. Int. J. Hydrogen Energy 2021, 46, 20377–20396. [Google Scholar] [CrossRef]
  31. Chinas-Palacios, C.; Vargas-Salgado, C.; Aguila-Leon, J.; Hurtado-Pérez, E. A cascade hybrid PSO feed-forward neural network model of a biomass gasification plant for covering the energy demand in an AC microgrid. Energy Convers. Manag. 2021, 232, 113896. [Google Scholar] [CrossRef]
  32. Musharavati, F.; Khoshnevisan, A.; Alirahmi, S.M.; Ahmadi, P.; Khanmohammadi, S. Multi-objective optimization of a biomass gasification to generate electricity and desalinated water using Grey Wolf Optimizer and artificial neural network. Chemosphere 2022, 287, 131980. [Google Scholar] [CrossRef] [PubMed]
  33. Sobol’, I.M.; Safety, S. Theorems and examples on high dimensional model representation. Reliab. Eng. Syst. Saf. 2003, 79, 187–193. [Google Scholar] [CrossRef]
  34. Alış, Ö.F.; Rabitz, H.J. Efficient implementation of high dimensional model representations. J. Math. Chem. 2001, 29, 127–142. [Google Scholar] [CrossRef]
  35. Zhang, Q.; Wu, Y.; Lu, L.; Qiao, P. An Adaptive Dendrite-HDMR Metamodeling Technique for High-Dimensional Problems. J. Mech. Des. 2022, 144, 081701. [Google Scholar] [CrossRef]
  36. Huang, Z.; Qiu, H.; Zhao, M.; Cai, X.; Gao, L. An adaptive SVR-HDMR model for approximating high dimensional problems. Eng. Comput. 2015, 32, 643–667. [Google Scholar] [CrossRef]
  37. Xie, Q.; Liu, H.; Bo, D.; He, C.; Pan, M. Data-driven Modeling and Optimization of Complex Chemical Processes Using a Novel HDMR Methodology. Comput. Aided Chem. Eng. 2018, 44, 835–840. [Google Scholar]
  38. Liu, S.; Yang, Y.; Yu, L.; Li, X. Thermodynamic and environmental analysis of solar-driven supercritical water gasification of algae for ammonia synthesis and power production. Energy Convers. Manag. 2021, 243, 114409. [Google Scholar]
  39. Striūgas, N.; Zakarauskas, K.; Džiugys, A.; Navakas, R.; Paulauskas, R. An evaluation of performance of automatically operated multi-fuel downdraft gasifier for energy production. Appl. Therm. Eng. 2014, 73, 1151–1159. [Google Scholar] [CrossRef]
  40. Chen, J.; Fan, Y.; Zhao, X.; Jiaqiang, E.; Xu, W.; Zhang, F.; Liao, G.; Leng, E.; Liu, S. Experimental investigation on gasification characteristic of food waste using supercritical water for combustible gas production: Exploring the way to complete gasification. Fuel 2020, 263, 116735. [Google Scholar] [CrossRef]
  41. Chen, Y.; Guo, L.; Cao, W.; Jin, H.; Guo, S.; Zhang, X. Hydrogen production by sewage sludge gasification in supercritical water with a fluidized bed reactor. Energy 2013, 38, 12991–12999. [Google Scholar]
  42. Cao, W.; Guo, L.; Yan, X.; Zhang, D.; Yao, X. Assessment of sugarcane bagasse gasification in supercritical water for hydrogen production. Int. J. Hydrogen Energy 2018, 43, 13711–13719. [Google Scholar] [CrossRef]
  43. Wang, X.; Yang, Z.; Liu, X.; Huang, G.; Xiao, W.; Han, L.J. The composition characteristics of different crop straw types and their multivariate analysis and comparison. Waste Manag. 2020, 110, 87–97. [Google Scholar] [CrossRef] [PubMed]
  44. Louw, J.; Schwarz, C.E.; Knoetze, J.H.; Burger, A. Thermodynamic modelling of supercritical water gasification: Investigating the effect of biomass composition to aid in the selection of appropriate feedstock material. Bioresour. Technol. 2014, 174, 11–23. [Google Scholar] [CrossRef]
  45. Mutlu, Ö.Ç.; Zeng, T. Challenges and opportunities of modeling biomass gasification in Aspen Plus: A review. Chem. Eng. Technol. 2020, 43, 1674–1689. [Google Scholar] [CrossRef]
  46. Ruya, P.M.; Purwadi, R.; Lim, S.S. Supercritical water gasification of sewage sludge for power generation–thermodynamic study on auto-thermal operation using Aspen Plus. Energy Convers. Manag. 2020, 206, 112458. [Google Scholar] [CrossRef]
  47. Gimenez, P.; Fereres, S. Effect of heating rates and composition on the thermal decomposition of nitrate based molten salts. Energy Procedia 2015, 69, 654–662. [Google Scholar] [CrossRef] [Green Version]
  48. Bernagozzi, M.; Panesar, A.S.; Morgan, R. Molten salt selection methodology for medium temperature liquid air energy storage application. Appl. Energy 2019, 248, 500–511. [Google Scholar] [CrossRef]
  49. Kenisarin, M.M. High-temperature phase change materials for thermal energy storage. Renew. Sustain. Energy Rev. 2010, 14, 955–970. [Google Scholar] [CrossRef]
  50. Zhao, Q.G.; Hu, C.X.; Liu, S.J.; Guo, H.; Wu, Y.T. The thermal conductivity of molten NaNO3, KNO3, and their mixtures. Energy Procedia 2017, 143, 774–779. [Google Scholar] [CrossRef]
  51. Gong, Q.; Shi, H.; Chai, Y.; Yu, R.; Weisenburger, A.; Wang, D.; Bonk, A.; Bauer, T.; Ding, W.J. Molten chloride salt technology for next-generation CSP plants: Compatibility of Fe-based alloys with purified molten MgCl2-KCl-NaCl salt at 700 °C. Appl. Energy 2022, 324, 119708. [Google Scholar] [CrossRef]
  52. Villada, C.; Ding, W.; Bonk, A.; Bauer, T. Engineering molten MgCl2–KCl–NaCl salt for high-temperature thermal energy storage: Review on salt properties and corrosion control strategies. Sol. Energy Mater. Sol. Cells 2021, 232, 111344. [Google Scholar] [CrossRef]
  53. Villada, C.; Ding, W.; Bonk, A.; Bauer, T. Simulation-assisted determination of the minimum melting temperature composition of MgCl2–KCl–NaCl salt mixture for next-generation molten salt thermal energy storage. Front. Energy Res. 2022, 10, 181. [Google Scholar] [CrossRef]
  54. Cao, C.; Xu, L.; He, Y.; Guo, L.; Jin, H.; Huo, Z.J. High-efficiency gasification of wheat straw black liquor in supercritical water at high temperatures for hydrogen production. Energy Fuels 2017, 31, 3970–3978. [Google Scholar] [CrossRef]
  55. Yan, M.; Su, H.; Hantoko, D.; Kanchanatip, E.; Hamid, F.B.S.; Zhang, S.; Wang, G.; Xu, Z. Experimental study on the energy conversion of food waste via supercritical water gasification: Improvement of hydrogen production. Int. J. Hydrogen Energy 2019, 44, 4664–4673. [Google Scholar] [CrossRef]
  56. Freitas, A.C.; Guirardello, R. Use of CO2 as a co-reactant to promote syngas production in supercritical water gasification of sugarcane bagasse. J. CO2 Util. 2015, 9, 66–73. [Google Scholar] [CrossRef]
  57. Moghaddam, E.M.; Goel, A.; Siedlecki, M.; Michalska, K.; Yakaboylu, O. Supercritical water gasification of wet biomass residues from farming and food production practices: Lab-scale experiments and comparison of different modelling approaches. Sustain. Energy Fuels 2021, 5, 1521–1537. [Google Scholar] [CrossRef]
  58. Macrì, D.; Catizzone, E.; Molino, A.; Migliori, M. Supercritical water gasification of biomass and agro-food residues: Energy assessment from modelling approach. Renew. Energy 2020, 150, 624–636. [Google Scholar] [CrossRef]
  59. Yakaboylu, O.; Harinck, J.; Smit, K.G. Supercritical water gasification of manure: A thermodynamic equilibrium modeling approach. Biomass Bioenergy 2013, 59, 253–263. [Google Scholar] [CrossRef]
  60. Li, G.; Wang, S.-W.; Rabitz, H. Practical approaches to construct RS-HDMR component functions. J. Phys. Chem. A 2002, 106, 8721–8733. [Google Scholar] [CrossRef]
  61. Horvat, A.; Pandey, D.S.; Kwapinska, M.; Mello, B.B.; Gómez-Barea, A.; Fryda, L.E.; Rabou, L.P. Tar yield and composition from poultry litter gasification in a fluidised bed reactor: Effects of equivalence ratio, temperature and limestone addition. RSC Adv. 2019, 9, 13283–13296. [Google Scholar] [CrossRef]
  62. Ziegel, E.R. The elements of statistical learning. Technometrics 2003, 45, 267–268. [Google Scholar] [CrossRef]
  63. Lu, Y.; Jin, H.; Guo, L.; Zhang, X.; Cao, C.; Guo, X. Hydrogen production by biomass gasification in supercritical water with a fluidized bed reactor. J. Supercrit. Fluids 2008, 33, 6066–6075. [Google Scholar] [CrossRef]
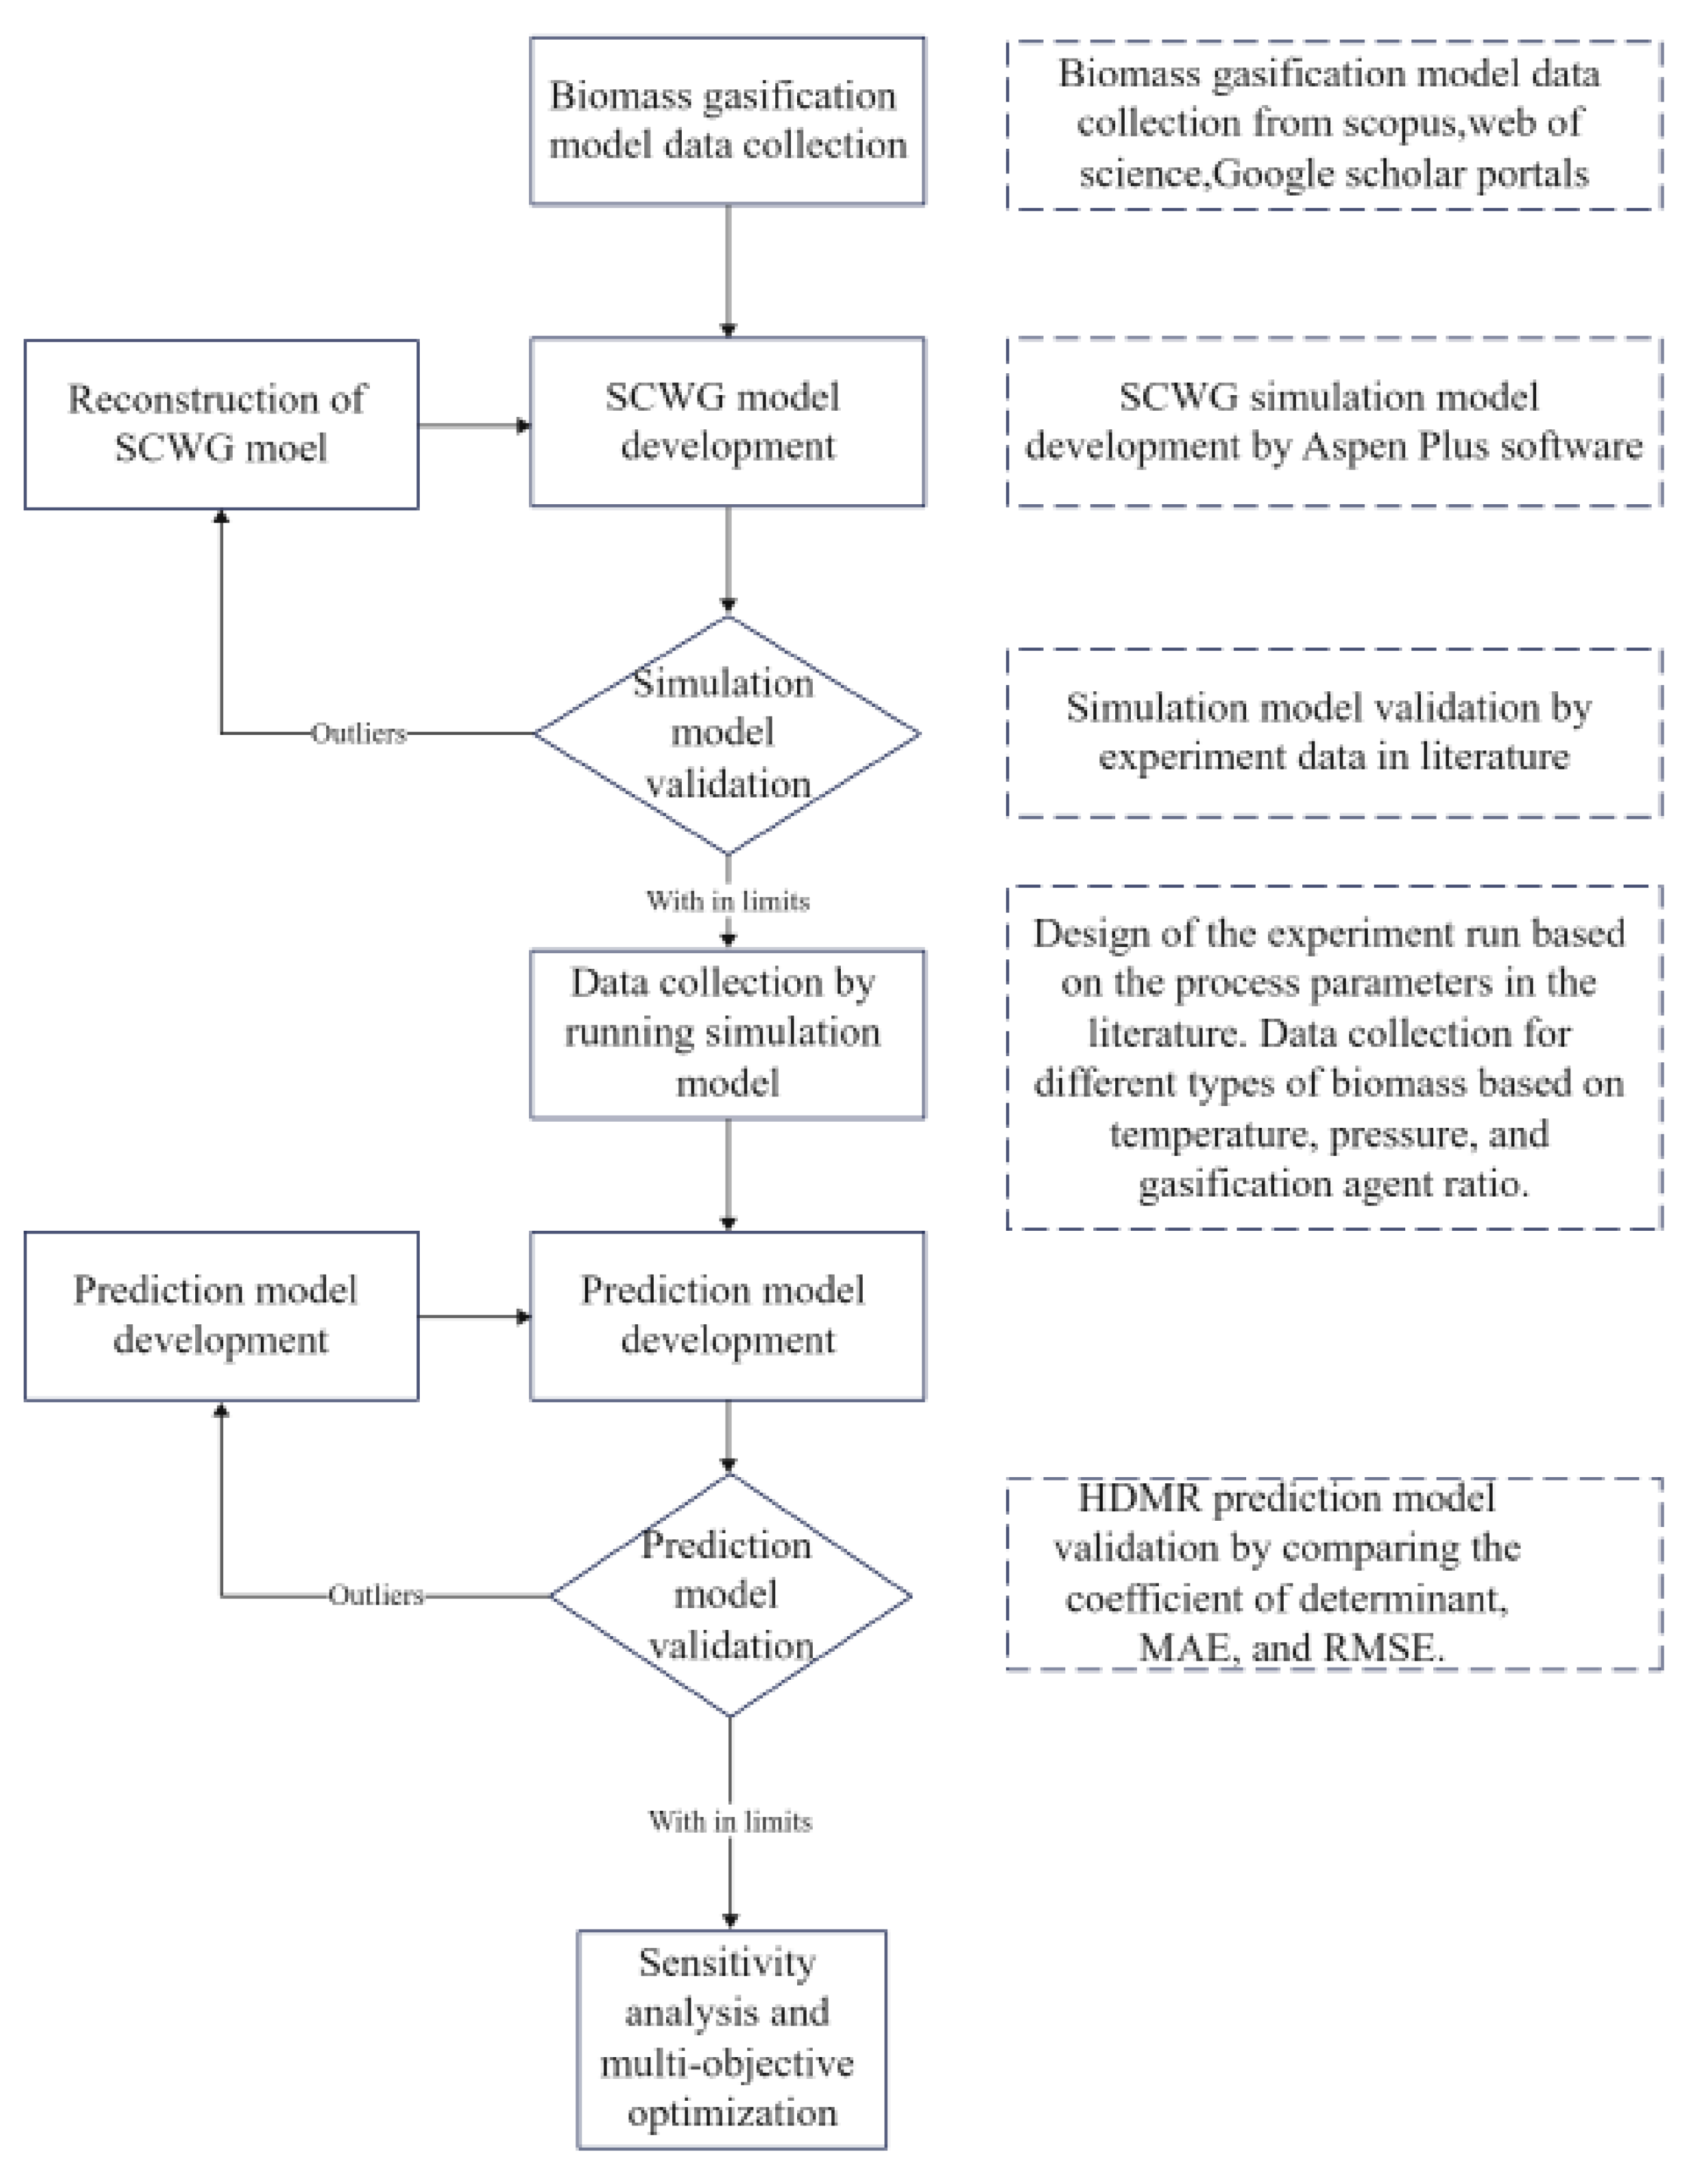
Figure 1. Flow diagram showing the research methodology.
Processes 11 02313 g001
Figure 2. Supercritical water gasification model designed using Aspen Plus.
Processes 11 02313 g002
Figure 3. Comparisons of experimental and simulation results.
Processes 11 02313 g003
Figure 4. Illustration showing the HDMR model.
Processes 11 02313 g004
Figure 5. Pearson correlation matrix showing the correlation between all pairs of variables.
Processes 11 02313 g005
Figure 6. HDMR model prediction values and actual values.
Processes 11 02313 g006
Figure 7. Effect of temperature, BWR, and pressure on the SCWG process.
Processes 11 02313 g007aProcesses 11 02313 g007b
Figure 8. The effect of the interaction between operation parameters on the mole fraction of H2.
Processes 11 02313 g008aProcesses 11 02313 g008b
Figure 9. The effect of the interaction between operation parameters on the mole fraction of CH4.
Processes 11 02313 g009
Table 1. Design of experiment model.
Temperature °C (T)Pressure MPa (P)Biomass-to-Water Ratio (BWR)Model Data
600250.0523Tij × Pij × BWRi = 70
610260.111Tij × Pij × BWRi = 70
620270.176Tij × Pij × BWRi = 70
630280.250Tij × Pij × BWRi = 70
640290.333Tij × Pij × BWRi = 70
65030Tij × Pij × BWRi = 70
66031Tij × Pij × BWRi = 70
67032Tij × Pij × BWRi = 70
68033Tij × Pij × BWRi = 70
69034Tij × Pij × BWRi = 70
70035Tij × Pij × BWRi = 70
36Tij × Pij × BWRi = 70
37Tij × Pij × BWRi = 70
38Tij × Pij × BWRi = 70
Table 2. Ultimate analysis of different types of biomass [17,40,41,42,43].
Ultimate Analysis (%)Wheat StrawSewage SludgeCorn WasteSugarcane BagasseFood Waste
C42.27038.18047.00047.09044.223
H5.3303.4005.1006.1606.134
O41.69623.74029.40042.50046.15
N0.5964.6702.1000.5201.651
S0.3681.0500.3001.0800.128
Ash9.74028.96016.1003.6501.714
Table 3. Parameters of MgCl2-NaCl-KCl [52].
Molten SaltMelting
Temperature (°C)
Degradation
Temperature (°C)
Heat Capacity (kJ/kg·K)Density
(kg/m3)
MgCl2-NaCl-KCl385800+0.82461680
Table 4. Performance of all the prediction models.
ModelMAERMSE
H2 (fraction)0.006240.00272
CH4 (fraction)0.004690.00577
CO (fraction)0.002350.00306
CO2 (fraction)0.001910.00987
H2 (mol/kg)0.001280.00161
LHV (kJ/mol)0.002410.00294
Table 5. Multi-objective optimization results.
BiomassT (°C)BWRP (MPa)H2 (mol/kg)LHV (kJ/mol)
Wheat straw6130.0530437.69.78225
Sugarcane bagasse6200.0526337.79.96231
Sewage sludge6090.0526336.410.05217
Food waste6000.052828.110.12220
Corn straw6240.0526837.810.07235
Disclaimer/Publisher’s Note: The statements, opinions and data contained in all publications are solely those of the individual author(s) and contributor(s) and not of MDPI and/or the editor(s). MDPI and/or the editor(s) disclaim responsibility for any injury to people or property resulting from any ideas, methods, instructions or products referred to in the content.