Article

Numerical Simulation of Electrical Properties of Carbonate Reservoirs Using Digital Rocks

1
National Engineering Laboratory for Exploration and Development of Low-Permeability Oil & Gas Fields, Xi’an 710018, China
2
Exploration Department, PetroChina Changqing Oilfield Company, Xi’an 710018, China
3
Exploration and Development Research Institute, PetroChina Changqing Oilfield Company, Xi’an 710018, China
4
Key Laboratory of Exploration Technologies for Oil and Gas Resources, Yangtze University, Wuhan 430100, China
*
Author to whom correspondence should be addressed.
Processes 2023, 11(7), 2214; https://doi.org/10.3390/pr11072214
Submission received: 20 June 2023 / Revised: 17 July 2023 / Accepted: 21 July 2023 / Published: 23 July 2023

Abstract

:
Rock electrical experiments are essential means of researching the conductive properties of rocks and are fundamental to interpreting resistivity logging. Carbonate rocks have more complex pore structures than sandstone, which results in more complex conductive properties. However, conducting experiments on representative rock samples from carbonate reservoirs is difficult, making it challenging to study the micro factors affecting electrical properties. Therefore, researching the conductive properties of carbonate rocks is difficult. To address this, in this paper, three-dimensional (3D) digital rock models with different porosities are generated, and conductive simulations are carried out on these models using the finite element method (FEM). Firstly, a micro-computed tomography (μ-CT) 3D image of a carbonate rock is obtained. Secondly, mathematical morphology-based methods are used on the μ-CT image to generate cores with varying porosities and fluid distributions. Then, the electrical properties are simulated using the FEM method, and the results are analyzed. The results reveal that the formation factor of the reservoir is mainly influenced by the shape and structure of the pores. The Archie equation is more suitable for carbonate reservoirs with water saturation levels greater than 60%. The wettability of the rock can alter the distribution of fluid in the reservoir space under different water saturation conditions. In pure water-wet rocks, the water phase mainly occupies small pores, while the oil phase occupies larger pores. As a result, compared to pure oil-wet rocks, water-wet rocks have more conductive channels and better conductivity. Therefore, it is important to determine the wettability of the rock when calculating water saturation using the Archie equation. The saturation index value of water-wet carbonate rock is about 2, while that of oil-wet rock is around 3–4. This research lays a foundation for studying the electrical conductivity of carbonate reservoirs using digital rocks.

1. Introduction

Carbonate reservoirs contribute to more than 50% of global oil and gas reserves [1,2,3], making the efficient exploration and development of these reservoirs highly significant. Carbonate reservoirs have very small primary porosity and poor oil and gas storage capacity. The main storage space consists of secondary pores formed through secondary reformation, such as dissolution pores or fractures [4]. Compared to clastic reservoirs, carbonate reservoirs have more complex pore structures and pronounced anisotropy [5,6]. Reservoir rock electrical properties play crucial roles in reservoir evaluation, logging interpretation, and reserve prediction [7,8]. The non-conductive skeleton formed by limestone or dolomite commonly found in carbonate reservoirs means that their electrical properties are primarily influenced by the structure of the storage space and the internal fluid properties [9]. The structure of the reservoir space in carbonate reservoirs refers to the shape and size of the pores, the width and angle of fractures, and the wettability of the reservoir space surface, whereas the fluid properties include water saturation and formation water salinity. Petrophysical experiments are a common method for studying the electrical properties of rocks. Early studies focused on understanding the electrical properties of sandstone rocks, serving as a foundation for evaluating carbonate reservoirs [10,11]. However, obtaining rock samples with variations in porosity, saturation, or wettability for petrophysical experiments is challenging. Additionally, conducting petrophysical experiments on carbonate rock samples with vugs or developed fractures poses difficulties [12]. Due to the complex pore space, full saturation with water during experiments is often challenging [13].
Using numerical simulations can effectively overcome the challenges brought about by heterogeneity in reservoirs and solve practical problems [14,15,16,17,18,19,20]. Digital rocks, which are obtained using imaging instruments like micro-computed tomography (μ-CT), enable detailed characterization of the internal structures of rocks. This technology enables us to obtain parameters such as the size, distribution, and connectivity of the pores or minerals [21,22]. Additionally, mathematical methods based on digital core images can generate a large number of core samples with varying porosities or fluid distributions. Liu (2010) [23] used mathematical morphology-based methods to determine the fluid distribution in the pores of sandstone rocks with different wettabilities. Nie et al. (2019) [24] established dissolution porosity models with the same pore shape for carbonate reservoirs using mathematical morphology, laying the foundation for simulating carbonate reservoir electrical properties. Numerical simulations based on digital core images can provide various rock properties. Several researchers have conducted simulations to obtain the electrical, acoustic, nuclear magnetic, and seepage characteristics of rocks based on 3D digital cores [21,25,26,27,28,29]. Numerical simulation methods, such as the Kirchhoff nodal voltage method, lattice Boltzmann method, and finite element method (FEM), are used to simulate rock electrical conductivity using digital cores [30,31]. Zhou et al. (2013) [32] calculated the electrical conductivity of complex sandstone using the Kirchhoff nodal voltage method. Yue and Tao (2013) [33] used the lattice Boltzmann method to study the electrical conductivity of rocks. Currently, FEM is the most widely used method for simulating electrical properties. Arns (2002) [34] used FEM to study the electrical properties of 3D digital cores of Fontainebleau sandstone and the results were in good agreement with experimental Archie’s law, confirming the reliability of this method. Jiang (2012) [35] utilized FEM to examine the pore structure, permeability, and wettability of rocks in relation to their electrical conductivity. Nie et al. (2016) [36] employed FEM to investigate the conductive properties of organic shale, focusing on the sensitivity of shale conductivity. Zhao et al. (2022) [37] used FEM to analyze the conductivity characteristics of fractures in shale formations. In the context of carbonate reservoirs, Nie et al. (2022) [38] manually introduced fractures into digital cores and simulated the electrical properties of fractured carbonate rocks, establishing the relationship between fracture properties and resistivity. Sun et al. (2022) [39] simulated the electrical properties of fractured vuggy carbonate reservoirs and proposed a novel saturation evaluation model.
However, few studies have focused on the relationship between the electrical properties of carbonate rocks and variations in their porosity, water salinity, water saturation, and wettability, especially for carbonate rocks with complex pore structures. This paper aimed to investigate the relationship between carbonate rock conductivity and porosity, water salinity, saturation, and wettability. To achieve this, a 3D image of carbonate rock obtained using μ-CT scanning was utilized, and mathematical morphology was employed to establish models with different porosities and oil saturation levels. FEM was then applied to simulate the conductivity characteristics of carbonate reservoirs, enabling an analysis of the impact of different parameters on the conductivity of carbonate rocks.

2. Data and Methods

2.1. μ-CT Based 3D Digital Rock

To investigate the impact of different micro factors on the conductivity characteristics of carbonate reservoirs, this study utilized a 3D carbonate digital rock image obtained by μ-CT scanning. The image, sourced from Imperial College London, was segmented into matrix and pore space [40]. The sample was a cube with dimensions of 400 × 400 × 400 voxels, a resolution of 2.85 μm/voxel, a porosity of 23.3%, and an average permeability of 1102 × 10−3 μm2 in three directions.
To improve the reliability of the research and increase the number of research samples, the main sample was divided into 8 sub-samples, labeled as samples 1 to 8, as shown in Figure 1. In Figure 1, the red, green, and blue axes are the x-, y-, and z-directions, respectively. Each sub-sample measured 200 × 200 × 200 voxels in size. The porosity of each sample is provided in Table 1. Samples 1 and 3 were chosen as the key research samples to investigate the electrical properties because sample 1 had the lowest porosity, while sample 3 had moderate porosity. It is important to note that the data used in this research may limit the representativeness of this study. The results and conclusions presented in this paper are mainly applicable to pore-type carbonate reservoirs with moderate to high porosity levels.

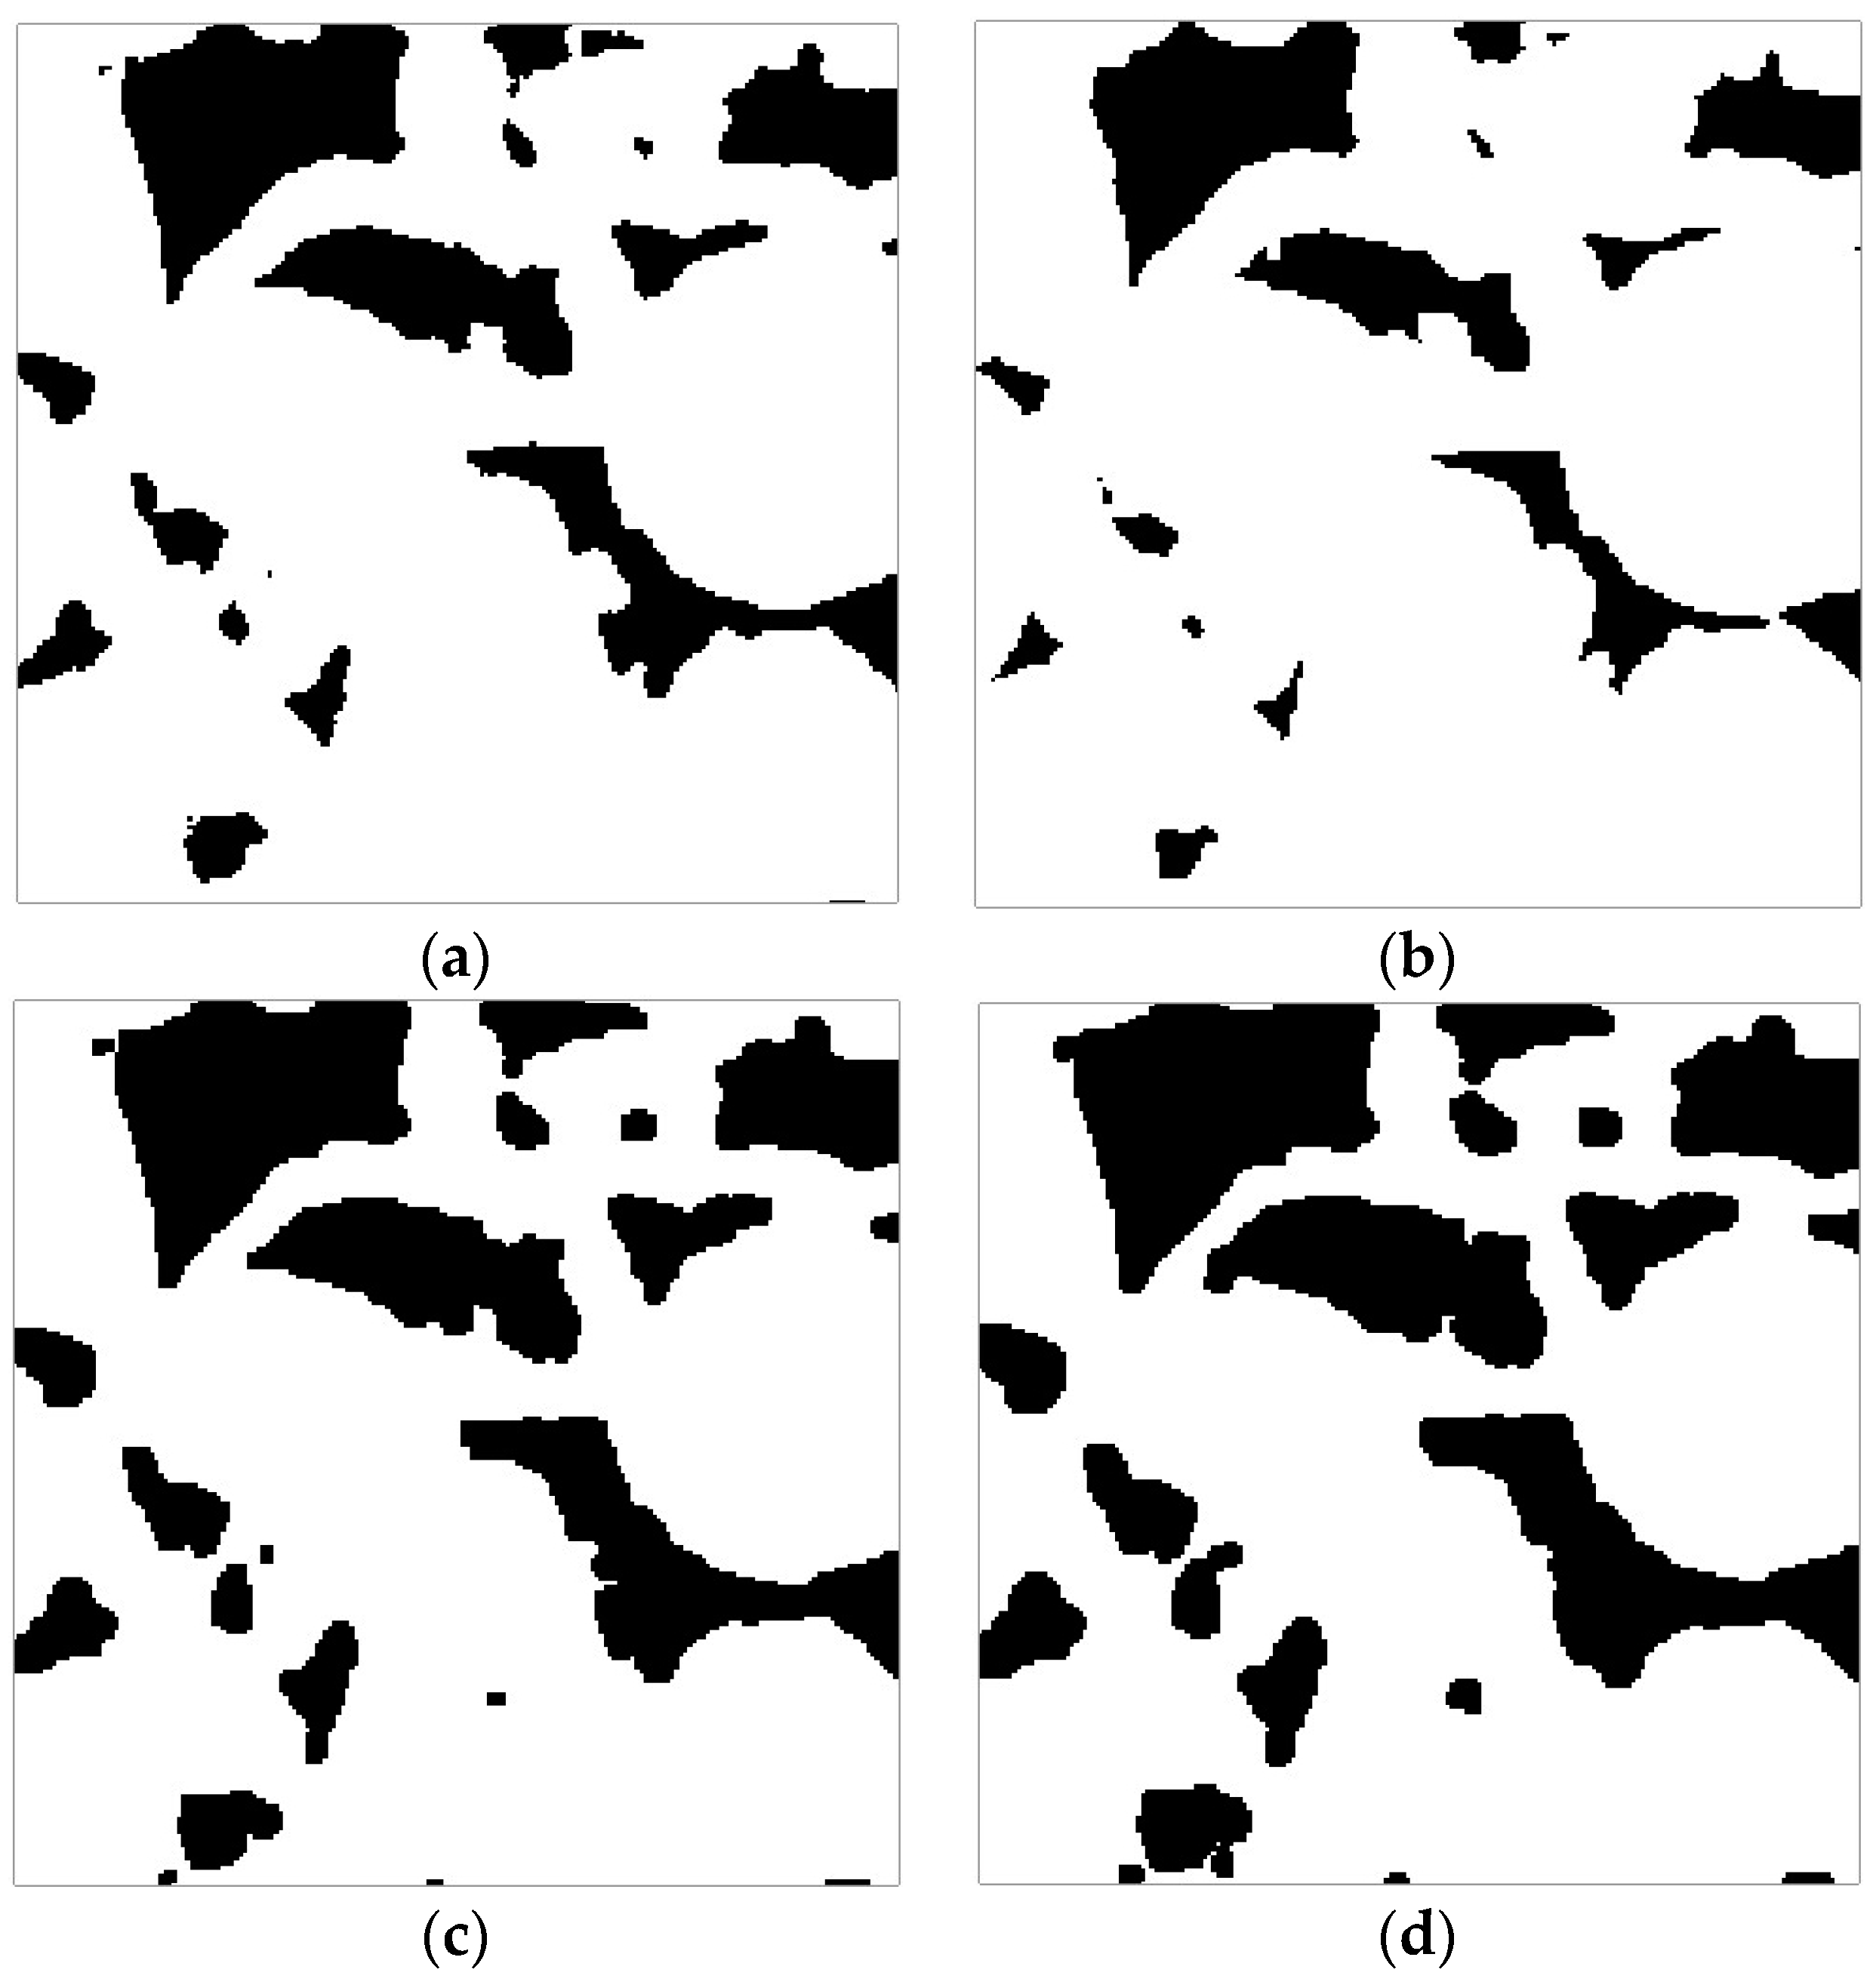
2.2. Establishment of Different Porosity and Oil Saturation Models Based on Mathematical Morphology

After the binarization operation, the 3D digital core image consisted only of the skeleton and pores. It essentially became a 3D data volume consisting of 0 and 1, allowing it to be processed using mathematical morphology. Mathematical morphology is a method used to analyze and recognize images by utilizing structural elements with specific morphologies to measure and extract the corresponding shapes in an image. It primarily involves four basic operations: dilation, erosion, opening, and closing [41].
Dissolution pores and caves in carbonate reservoirs are created by the dissolution of soluble minerals, resulting in pore spaces. The dilation and erosion operations in mathematical morphology align with the physical processes of carbonate porosity formation. The dilation operation enlarges the target image, increasing the porosity of the sample, while the erosion operation reduces the target image, decreasing the porosity. Previous studies have shown that dilation and erosion operations can generate different porosity levels while maintaining similar pore structures [24]. The opening operation involves performing the erosion operation followed by the dilation operation, which simulates the process of water flooding. Conversely, the closing operation entails performing the dilation operation followed by the erosion operation, effectively compensating for narrow regions in the image. Figure 2a represents a 2D section of the original 3D digital core, where the pore space is represented by 0 (black) and the skeleton (solid matrix) is represented by 1 (white). Mathematical morphology operates within the pore space. Figure 2b illustrates a section image created by the erosion operation applied to the original 3D digital core using a sphere with a radius of 1 pixel as the structural unit. Figure 2c,d depicts the slice images generated by the dilation operation of the original 3D digital core using spheres with radii of 1 and 2 pixels as the structural units, respectively.
The opening operation has the capability to create core models with different wettability and saturation [42]. Figure 3 represents a cross-sectional view of the fluid distribution in water-wet carbonate rocks with varying water saturation levels. Structural elements with radii ranging from 1 to 5 pixels were chosen, and the opening operation in mathematical morphology was performed within the pore space. The removed pore space simulates the pores occupied by water following water flooding. By comparing the results of the opening operation with the original image, the images in Figure 3b–f were obtained. In these figures, the gray region represents the skeleton, red represents oil, and blue represents water.

2.3. Finite Element Method

The numerical simulation method provides a solution to the challenges faced in quantitatively determining the structure of rock reservoir spaces using conventional rock experimentation. By treating the rock as a composite material consisting of multiple components, FEM was utilized in this study to simulate the 3D digital rock’s resistivity. Developed by Garboczi (1998) [25], this method was specifically designed to calculate the effective linear properties of random materials with their microstructures represented in 2D or 3D digital images. The digital core, serving as a unique digital image, contains essential information such as the mineral components and their spatial distribution.
The fundamental concept underlying FEM is the existence of a variational principle for linear electrical conductivity problems, where the model is divided into non-overlapping finite elements. In the case of a 3D digital core model, no division is required as the voxels serve as natural elements. For a given microstructure, subject to applied fields or other boundary conditions, the resulting voltage distribution is such that the total energy dissipated is extremized. This means that the gradient of the energy with respect to the voltage variables is zero. In the program, the goal is to minimize the real energy dissipation per unit time or power. Thus, the solution for the voltage at each unit point is transformed into finding the extremum value of the overall energy of the system in order to calculate the effective conductivity of the entire 3D digital core. The energy En must be minimized, which is achieved by setting the partial derivatives of the energy with respect to the variable um (node voltage) to zero:
E n u m = 0
When Equation (1) is solved, and the sum of the squares of the gradient vectors formed by the partial derivatives of the energy En with respect to the voltages of m nodes is below a predefined error threshold, it can be considered that Equation (1) is approximately valid. This implies that the voltage distribution and effective electrical conductivity of the 3D digital core are determined. Further details about this method can be found in the reference by Garboczi (1998) [25].
Each pixel in the digital core represents a different phase: solid grains, water, and oil. A digital core consists of matrix and fluid. The matrix is assumed to be nonconductive and is represented by zero in the digital core. Under varying water saturation levels, there are two types of fluid present in the pore space: water and oil. In the electrical property simulation, the conductivities of water and oil are assumed to be σw = 1 and σo = 0, respectively. Each pixel in the digital rock can represent either the matrix, water, or oil, depending on the simulated drainage process observed in the morphology. The conductivity of each cube is determined by the phase it represents. We applied an external electric field E and used FEM to determine the voltage distribution in the 3D digital core. From this, we could calculate the resistivities of the rock for different water saturation levels.

2.4. Archie’s Law

To study the conductivity parameters of a rock, the use of the Archie equation is essential. Archie (1942) [10] established the relationship between the resistivity of brine and the resistivity of water-saturated sandstone rock:
F = R 0 R w = a ϕ m
where F denotes the formation factor; R 0 is the water-saturated rock resistivity in ohms; R w is the brine resistivity in ohms; a is the tortuosity factor; m is the cementation exponent of the rock; and ϕ denotes the porosity. The value of F should not change with the brine resistivity in a sandstone rock.
Archie’s law also reveals the relationship between the water saturation and resistivity of a rock. The resistivity index I is defined as follows:
I = R t R 0 = b S w n
where R t is the oil-bearing rock resistivity in ohms; R 0 is the resistivity of water-saturated rock in ohms; S w is the water saturation; b is a lithology-related constant; and n is the saturation exponent, which depends on the fluid distribution in the pore space.

3. Numerical Simulation Results and Discussion on the Conductivity of Carbonate Reservoirs

The matrix pores in carbonate reservoirs are typically very small, and their electrical conductivity is significantly influenced by secondary dissolution pores and caves. Therefore, in this paper, certain carbonate digital core samples with dissolved pore and cave structures were selected for analysis. Reservoir simulations were conducted, considering various microscopic factors such as porosity, formation water salinity, wettability, and saturation.

3.1. Effect of Porosity on Reservoir Conductivity

Whether describing the laws of a core physical experiment or analyzing microscopic influencing factors, it is evident that the distribution and changes in the m value are primarily controlled by the rock’s pore structure, despite being influenced by various factors. Therefore, the m value can be defined as the pore structure index. In complex carbonate reservoirs, the distribution and variations of the Archie parameter m are mainly controlled by three different “elements,” i.e., matrix pores, fractures, and solution pores and holes, which comprise multiple pore structures and their interrelationships. Specifically, these distributions and variations are directly related to the geometrical parameters of the microstructures of their throats and cavities as well as their interrelationships. When considering the macroscopic characteristics of rock pore structures (at the macroscopic scale), porosity and permeability are the main influencing factors affecting the distribution and changes in the m value in complex reservoirs. Therefore, the m value can generally be expressed as a function of formation porosity and permeability [13].
Erosion and dilation operations were performed on digital core samples 1 and 3, respectively, resulting in core models with the same pore shape and tortuosity but different porosity sizes. Conductivity simulations were then conducted in the x-, y-, and z-directions for core samples 1 to 8. Additionally, conductivity simulations were performed for samples 1 and 3 with different pore sizes obtained after erosion and dilation. The simulation results are presented in Figure 4, Figure 5 and Figure 6 below.
The analysis and comparison revealed that the correlation between the formation factor (F) and porosity (ϕ) in Figure 4 was poor. However, in Figure 5 and Figure 6, the correlations for samples 1 and 3 were both above 0.99, indicating a very high correlation. This phenomenon highlighted the relatively discrete F–ϕ relationship in Figure 4, which was primarily influenced by pore structure factors such as pore morphology and tortuosity rather than pore size.
The fit equations provided us with the m values for each sample. For samples 1 to 8, the m values ranged from 2.181 to 2.301 in all three directions. For sample 1, the m values ranged from 2.352 to 2.675. For sample 3, the m values ranged from 2.003 to 2.201. In normal sandstone reservoirs, the typical m value is around 2. The results indicated that the m values of carbonate sample 3 were similar to those of sandstone. Figure 7 shows the pore–throat network model of the two samples. The balls represent pores and the sticks represent throats. The colors from green to red indicate the radii of pores and throats getting bigger. From Figure 7 it was easy to observe that the pores of sample 3 were well connected like a sandstone rock, while sample 1 had many fewer connected pores. Figure 8 reveals the distribution of pore size and the coordination number of the pores of samples 1 and 3. It was obvious that sample 3 had more bigger pores and fewer small pores than sample 1, and the mean coordination number of sample 3 was also higher than that of sample 1. This quantitively revealed that sample 3 had a better pore structure than sample 1. Therefore, the m value was affected significantly by the pore structure. Normally, the better the pores are connected, the smaller the m value.

3.2. Effects of Formation Water Salinity on Reservoir Resistivity under Different Porosity Conditions

Sample 1 underwent a dilation operation, resulting in the creation of multiple core models with varying porosities. These models were then used with FEM to simulate the impact of formation water salinity on reservoir resistivity under different porosity conditions. The results of the simulation are presented in Figure 9. The figure highlights the following key points:
  • There was a logarithmic relationship between the resistivity of pure carbonate matrix reservoirs and the conductivity of formation water;
  • Under the same formation water conductivity conditions, the reservoir resistivity decreased as porosity increased;
  • In pure carbonate matrix reservoirs, the curves under various porosity conditions were all parallel to each other, indicating that the rate of resistivity reduction had little relationship with the size of the pores if the porosity was high.

3.3. The Effect of Saturation on Reservoir Conductivity

The influencing factors and change rules of the saturation index (n) in heterogeneous reservoirs, such as carbonate rocks, have been the focus of attention for a long time. Early studies with rock electrical tests showed that the n value can change with factors such as rock wettability, formation water salinity, and porosity. It is generally believed that calcite tends to be more oil-wet than water-wet, which significantly affects the current transmission characteristics of carbonate reservoirs and the recovery of oil and gas, resulting in an increase in the n value. While there is a consensus on the influencing factors of the n value, there are different views on the range of its distribution. For example, Donaldson and Siddiqui (1987) [11] measured the saturation index of oil-wet Berea sandstone as high as 8, while Morgan and Pirson (1964) [43] showed that the saturation index value varied from 2.5 to 25, ranging from strongly water-wet to strongly oil-wet. Such variations make it difficult to understand the changes in the n value. These different interpretations not only increase the uncertainty in determining the Archie parameter n for practical interpretations, but they also challenge the applicability of the Archie equation in carbonate rocks and other strata. Therefore, based on extensive research results, it was necessary to sort out and demonstrate this key problem based on the actual state of a reservoir. The following analysis attempted to analyze the rule of the saturation index n through numerical simulations.
Based on core sample 3, we conducted a simulation of water flooding in oil-saturated, water-wet rocks within the pore space. We established core models with different water saturation levels using an opening operation. The conductivity of the formation water used in the simulation was 1 S/m, while the conductivity of the skeleton was 0 S/m.
Figure 10 shows a cross-sectional diagram depicting the relationship between the resistivity index (I) and water saturation (Sw) obtained from the numerical simulation of digital core sample 3. By analyzing the changing trend of the I–Sw curve in Figure 10, the following characteristics could be observed:
  • A non-Archie characteristic was observed because there was a turning point when Sw was about 60%. When the water saturation levels in Figure 10 were above and below 60% (orange dashed line), two different curve trends appeared;
  • When the water saturation level was less than 60%, the saturation index (n) values in the x-, y-, and z-directions were found to be 3.48, 3.28, and 3.6, respectively. These values of n were much higher than those of normal sandstone, indicating a deviation from typical behavior. This could be attributed to the water-wet wettability, where as the water saturation increased, water filled the smaller pores and pore surfaces first, creating a conductive path and causing a rapid drop in resistivity;
  • When the water saturation level was greater than 60%, the saturation index (n) values in the x-, y-, and z-directions were calculated to be 2.25, 1.54, and 1.97, respectively. These values were relatively close to 2, which aligned more with the Archie parameter values for sandstone. This was because at high water saturation levels, the conductive path within the core became more stable, resembling that of homogeneous sandstone.
In summary, the saturation index (n) value in a carbonate reservoir varied with the water saturation (Sw) level. Furthermore, the Archie equation was found to be more suitable for calculating the water saturation in carbonate reservoirs where the water saturation (Sw) level was greater than 60%.

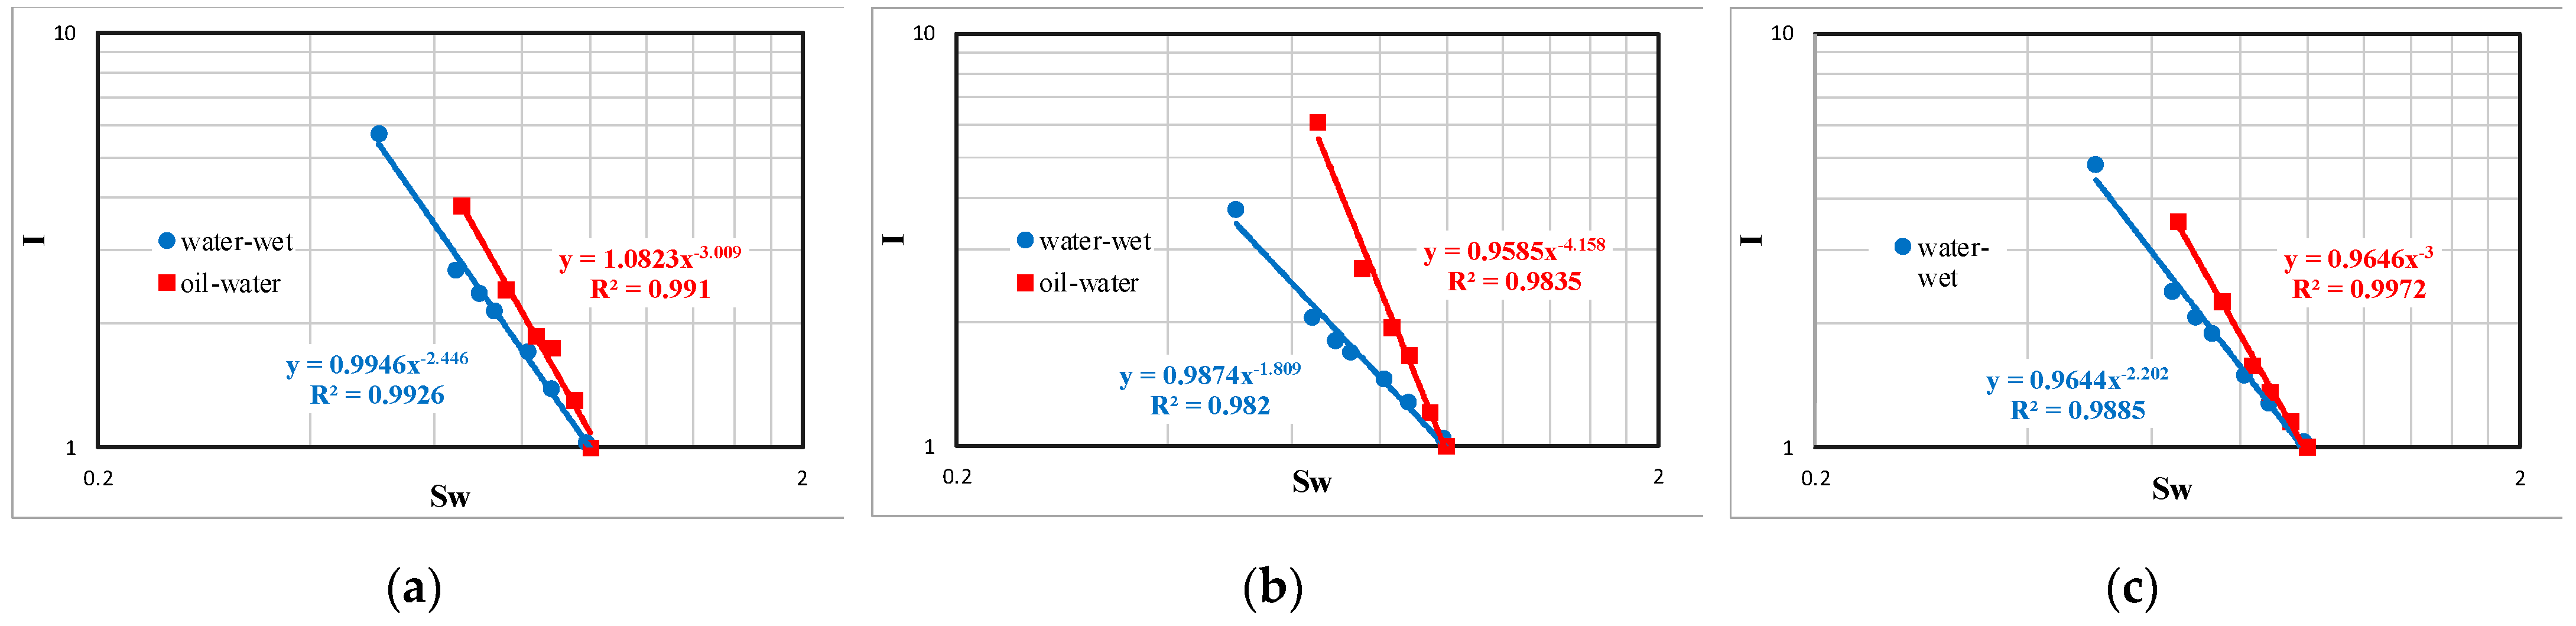
3.4. The Effect of Wettability on Reservoir Conductivity

Based on 3D digital core sample 3, the opening operation was utilized to simulate the oil-wet rock process of oil flooding water-saturated rock and the water-wet rock process of water flooding oil-saturated, water-wet rock in the pore space. Rock models with different water saturation levels were established accordingly. The water-wet core models with various water saturation levels were obtained using a structural element of 7–18 pixels for opening the sphere, while the oil-wet core models were obtained by employing a structural element of 1–5 pixels for the same procedure. Additionally, assuming the conductivity of the contained formation water to be 1 S/m and the conductivity of the framework to be 0 S/m, the resistivity indices in the x-, y-, and z-directions of different rock samples were obtained using numerical simulation calculations based on FEM. Moreover, it was observed that a non-Archie phenomenon occurred when the water saturation level obtained from Section 3.3 fell below 60%. Therefore, for the purpose of simulation and comparison, the core model with a water saturation level greater than approximately 60% was selected.
Figure 11 illustrates a cross-sectional diagram depicting the relationship between the resistivity index and water saturation resulting from the numerical simulation of rock samples exhibiting different wettabilities. By observing the changing trend of the oil-wet and water-wet I–Sw curves in Figure 11, we could observe that:
  • Under the same water saturation condition, the resistivity of oil-wet rock was significantly larger than that of water-wet rock. This difference was particularly pronounced at lower water saturation levels;
  • The saturation index of oil-wet rocks was significantly larger than that of water-wet rocks. The values of the saturation exponent for oil-wet rocks in the x-, y-, and z-directions were 3, 4.15, and 3, respectively, whereas for water-wet rocks, they were 2.44, 1.8, and 2.2, respectively.
The reason for the aforementioned phenomenon was that wettability could affect the distribution of relevant fluids in the reservoir pores under various water saturation conditions. In water-wet conditions, the water phase primarily occupied the small pores, while the oil phase occupied the larger pores. As a result, the water-wet phase possessed more conductive channels and superior electrical conductivity compared to the oil-wet phase. It is therefore crucial to determine the wettability of the rock when calculating the water saturation using the Archie equation. The value of the saturation index for water-wet rocks was typically around 2, whereas for oil-wet rocks, it ranged from 3 to 4. Consequently, the saturation index value fell between 2 and 4 depending on the wettability. This finding aligned with previous experimental research by Zeng et al. (2013) [13].

3.5. Limitations of the Results and Future Study Suggestion

In this study, we utilized mathematical morphology-based methods, specifically dilation, erosion, and opening operations, to generate digital core models with different degrees of dissolution and fluid saturation. During the process, all of the pore surfaces were dissolved at the same time and to the same degree, and the saturation model did not consider the isolated pores. Therefore, there were limitations and potential uncertainties associated with these assumptions.
In the simulation process, we assumed that the conductivity of the contained formation water was constant throughout the simulations, while the conductivity of the rock matrix was assumed to be zero. In reality, the conductivity of the formation water can vary due to factors such as salinity variations and dissolved ions. Incorporating more realistic fluid models that account for these variations could provide a more accurate representation of reservoir conductivity.
Therefore, in this study, the obtained values are provided for reference purposes only and do not necessarily reflect the behavior of carbonate rocks in practical scenarios. When applying these findings, it is important to conduct field calibrations to ensure accurate results.
This study specifically examined carbonate reservoirs with medium to high porosity; therefore, the conclusions are constrained and applicable only to this range. This study focused on the influence of porosity, formation water salinity, wettability, and saturation on reservoir conductivity. However, there are other factors that can impact the electrical properties of carbonate reservoirs, such as pore connectivity, pore size distribution, mineralogy, and fractures. These factors should be considered and their effects on conductivity should be evaluated.
In future studies, more rock samples with a wider range of porosity and pore geometry should be involved, and a more accurate saturation model considering the connectivity of the pores should be used to make sure the models are more realistic. And, other factors affecting rock conductivity should be comprehensively studied.

4. Conclusions

In this paper, we established digital core models with varying pore sizes and utilized FEM to investigate the electrical properties of dissolved pore carbonate reservoirs. We also analyzed the application of the Archie equation in these reservoirs. The following understandings and conclusions were derived from our study:
  • Based on CT scan images, models of different degrees of dissolution can be obtained using mathematical morphology-based dilation and erosion operations. Additionally, models of different fluid saturation levels can be obtained using the opening operation;
  • The formation factor and porosity of the reservoir are primarily influenced by the shape and structure of the pores;
  • There is a non-Archie phenomenon because there is a turning point when the water saturation level is approximately 60%;
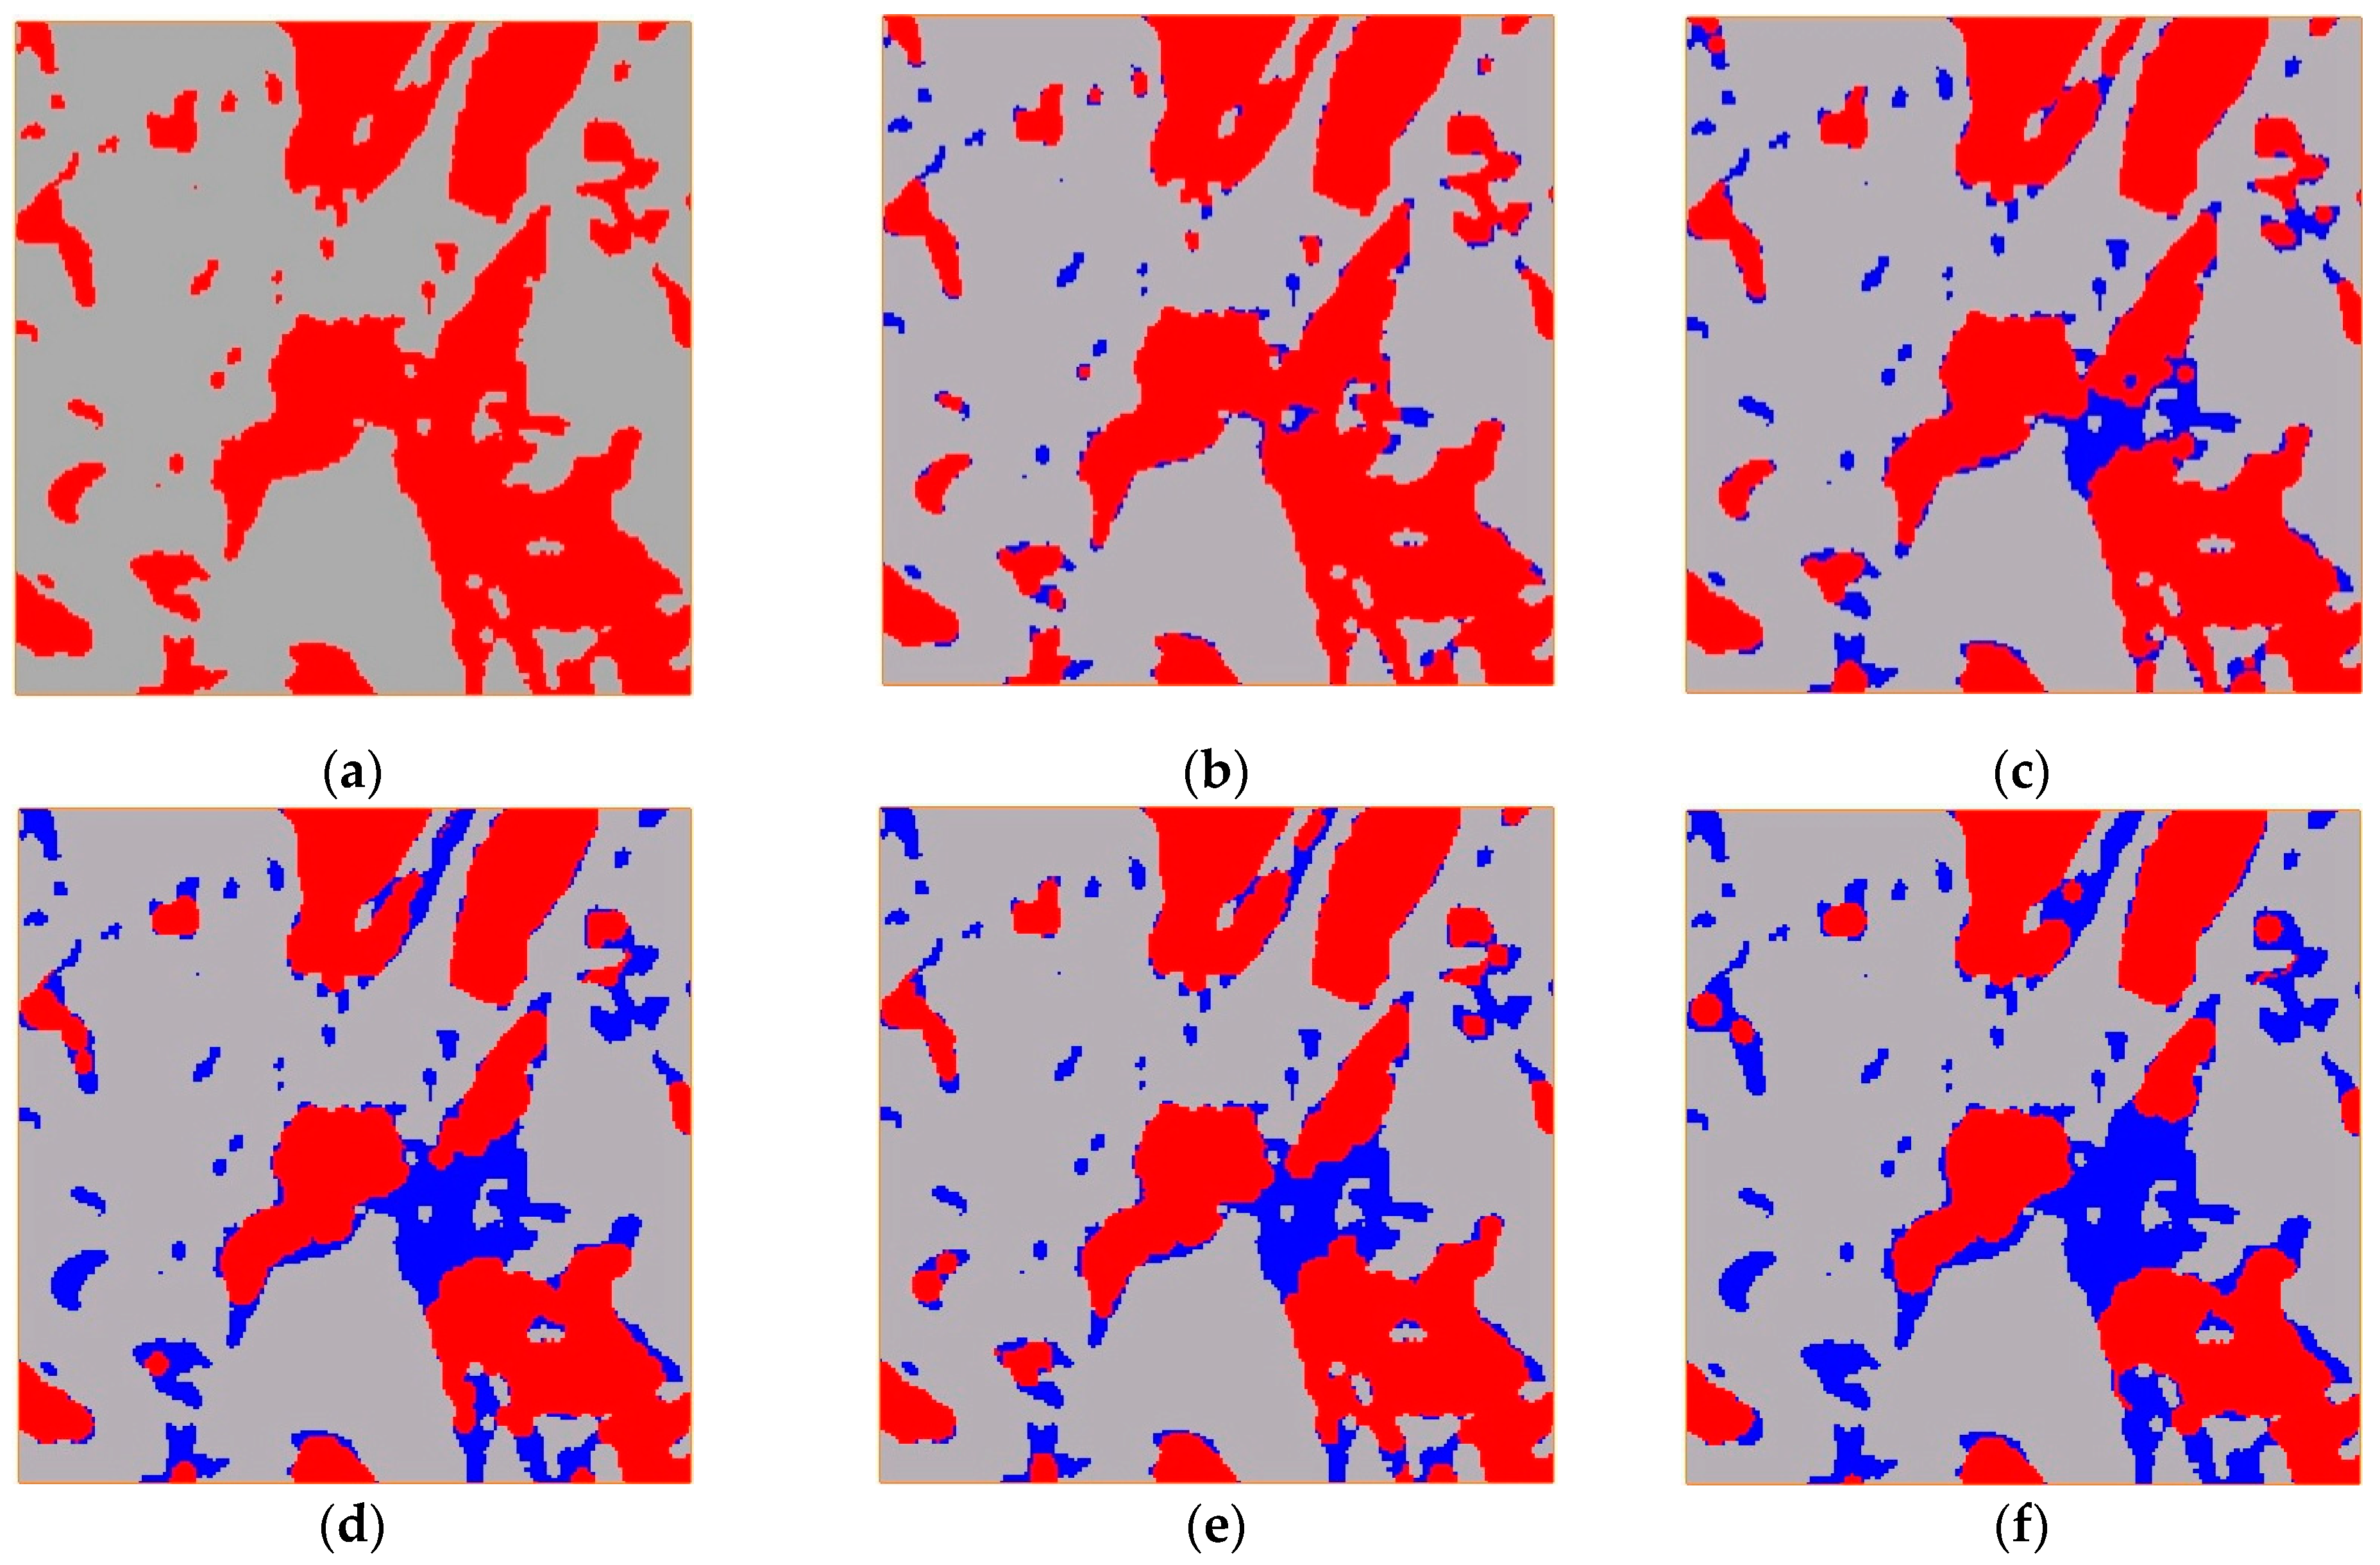
  • The wettability of rock can alter the distribution of fluids in the reservoir space under varying water saturation conditions. In water-wet rocks, the water phase predominantly occupies small pores, while the oil phase occupies larger pores. As a result, water-wet rocks have more conductive channels and higher conductivity than oil-wet rocks. Therefore, determining the wettability of the rock is crucial when calculating water saturation using the Archie equation. The saturation index value for water-wet rocks is typically around 2, whereas for oil-wet rocks, it ranges from 3 to 4;
  • In this study, the obtained values are provided for reference purposes only and do not necessarily reflect the behavior of carbonate rocks in practical scenarios. When applying these findings, it is important to conduct field calibrations to ensure accurate results. In future studies, more accurate models should be used and other factors affecting rock conductivity should be comprehensively studied.

Author Contributions

Conceptualization, X.N. and T.Z.; methodology, X.N. and J.Z.; software, Y.H. and D.L.; validation, L.T., X.K., and B.Z.; formal analysis, D.L.; investigation, D.L.; resources, X.N.; writing—original draft preparation, Y.H. and D.L.; writing—review and editing, Y.H. and X.N.; visualization, D.L.; supervision, J.Z.; project administration, J.Z.; funding acquisition, Y.H. and X.N. All authors have read and agreed to the published version of the manuscript.

Funding

This study was financially supported by the open foundation of National Engineering Laboratory for Exploration and Development of Low-Permeability Oil & Gas Fields and the National Natural Science Foundation of China (No. 41504094).

Data Availability Statement

The data can be acquired by contacting the corresponding author.

Acknowledgments

The authors express their gratitude to Imperial College for providing the carbonate digital rock sample, as well as to Jie Zhang and Chuanrui Sun for their assistance in providing and processing the data. Additionally, the authors would like to extend their appreciation to the three reviewers for their valuable comments and suggestions on this manuscript.

Conflicts of Interest

The authors declare that they have no conflict of interest. The funders played no part in the study design, data collection, analysis and interpretation, writing of the manuscript, or decision to publish the results.

References

  1. Chilingar, G.V. Carbonate Reservoir Characterization: A Geologic-Engineering Analysis; Mazzullo, S.J., Rieke, H.H., Eds.; Elsevier: Amsterdam, The Netherlands; New York, NY, USA, 1992. [Google Scholar]
  2. Burchette, T.P. Carbonate Rocks and Petroleum Reservoirs: A Geological Perspective from the Industry. Geol. Soc. Lond. Spec. Publ. 2012, 370, 17–37. [Google Scholar] [CrossRef]
  3. Tariq, Z.; Mahmoud, M.; Al-Youssef, H.; Rasheed Khan, M. Carbonate Rocks Resistivity Determination Using Dual and Triple Porosity Conductivity Models. Petroleum 2020, 6, 35–42. [Google Scholar] [CrossRef]
  4. Qajar, J.; Arns, C.H. Characterization of Reactive Flow-Induced Evolution of Carbonate Rocks Using Digital Core Analysis- Part 1: Assessment of Pore-Scale Mineral Dissolution and Deposition. J. Contam. Hydrol. 2016, 192, 60–86. [Google Scholar] [CrossRef] [PubMed]
  5. Clerke, E.A. Permeability and Microscopic Displacement Efficiency of M_1 Bimodal Pore Systems in Arab-D Limestone; OnePetro: Richardson, TX, USA, 2007; Volume 2. [Google Scholar]
  6. Sagbana, P.I.; Sarkodie, K.; Nkrumah, W.A. A Critical Review of Carbonate Reservoir Wettability Modification during Low Salinity Waterflooding. Petroleum 2022. [Google Scholar] [CrossRef]
  7. Zhu, L.; Zhang, C.; Zhang, Z.; Zhou, X. High-Precision Calculation of Gas Saturation in Organic Shale Pores Using an Intelligent Fusion Algorithm and a Multi-Mineral Model. Adv. Geo-Energy Res. 2020, 4, 135–151. [Google Scholar] [CrossRef]
  8. Cai, J.; Wei, W.; Hu, X.; Wood, D.A. Electrical Conductivity Models in Saturated Porous Media: A Review. Earth Sci. Rev. 2017, 171, 419–433. [Google Scholar] [CrossRef]
  9. Sok, R.M.; Arns, C.H.; Knackstedt, M.A.; Senden, T.J.; Sheppard, A.P.; Averdunk, H.; Pinczewski, W.V.; Okabe, H. Estimation of Petrophysical Parameters from 3D Images of Carbonate Core. In SPWLA Middle East Regional Symposium 2007, MERS 2007; OnePetro: Richardson, TX, USA, 2007. [Google Scholar]
  10. Archie, G.E. The Electrical Resistivity Log as an Aid in Determining Some Reservoir Characteristics. Trans. AIME 1942, 146, 54–62. [Google Scholar] [CrossRef]
  11. Donaldson, E.C.; Siddiqui, T.K. Relationship Between the Archie Saturation Exponent and Wettability. SPE Form. Eval. 1989, 4, 359–362. [Google Scholar] [CrossRef]
  12. Tan, M.; Su, M.; Liu, W.; Song, X.; Wang, S. Digital Core Construction of Fractured Carbonate Rocks and Pore-Scale Analysis of Acoustic Properties. J. Pet. Sci. Eng. 2021, 196, 107771. [Google Scholar] [CrossRef]
  13. Zeng, W.; Liu, X. Interpretation of Non-Archie Phenomenon for Carbonate Reservoirs. Well Logging Technol. 2013, 37, 341–351. [Google Scholar] [CrossRef]
  14. Zhu, L.; Zhang, C.; Zhang, C.; Zhou, X.; Zhang, Z.; Nie, X.; Liu, W.; Zhu, B. Challenges and Prospects of Digital Core-Reconstruction Research. Geofluids 2019, 2019, 7814180. [Google Scholar] [CrossRef] [Green Version]
  15. Li, X.; Li, B.; Liu, F.; Li, T.; Nie, X. Advances in Advances in the Application of Deep Learning Methods to Digital Rock Technology. Adv. Geo-Energy Res. 2023, 8, 5–18. [Google Scholar] [CrossRef]
  16. Andhumoudine, A.B.; Nie, X.; Zhou, Q.; Yu, J.; Kane, O.I.; Jin, L.; Djaroun, R.R. Investigation of Coal Elastic Properties Based on Digital Core Technology and Finite Element Method. Adv. Geo-Energy Res. 2021, 5, 53–63. [Google Scholar] [CrossRef]
  17. Xue, W.; Wang, Y.; Chen, Z.; Liu, H. An Integrated Model with Stable Numerical Methods for Fractured Underground Gas Storage. J. Clean. Prod. 2023, 393, 136268. [Google Scholar] [CrossRef]
  18. Alan, C.; Cinar, M. Interpretation of Temperature Transient Data from Coupled Reservoir and Wellbore Model for Single Phase Fluids. J. Pet. Sci. Eng. 2022, 209, 109913. [Google Scholar] [CrossRef]
  19. Wang, Y.; Sun, S.; Gong, L.; Yu, B. A Globally Mass-Conservative Method for Dual-Continuum Gas Reservoir Simulation. J. Nat. Gas Sci. Eng. 2018, 53, 301–316. [Google Scholar] [CrossRef] [Green Version]
  20. Liu, Y.; Jin, S.D.; Cao, Q.; Zhou, W. Tertiary Hydrothermal Activity and Its Effect on Reservoir Properties in the Xihu Depression, East China Sea. Pet. Sci. 2019, 16, 14–31. [Google Scholar] [CrossRef] [Green Version]
  21. Blunt, M.J.; Bijeljic, B.; Dong, H.; Gharbi, O.; Iglauer, S.; Mostaghimi, P.; Paluszny, A.; Pentland, C. Pore-Scale Imaging and Modelling. Adv. Water Resour. 2013, 51, 197–216. [Google Scholar] [CrossRef] [Green Version]
  22. Arif, M.; Mahmoud, M.; Zhang, Y.; Iglauer, S. X-ray Tomography Imaging of Shale Microstructures: A Review in the Context of Multiscale Correlative Imaging. Int. J. Coal Geol. 2021, 233, 103641. [Google Scholar] [CrossRef]
  23. Liu, X. Numerical Simulation of Elastic and Electrical Properties of Rock Based on Digital Cores; China University of Petroleum, East China: Beijing, China, 2010. [Google Scholar]
  24. Nie, X.; Zhang, C.; Wang, C.; Nie, S.; Zhang, J.; Zhang, C. Variable Secondary Porosity Modeling of Carbonate Rocks Based on μ-CT Images. Open Geosci. 2019, 11, 617–626. [Google Scholar] [CrossRef]
  25. Garboczi, E. Finite Element and Finite Difference Programs for Computing the Linear Electric and Elastic Properties of Digital Images of Random Materials; NIST: Gaithersburg, MD, USA, 1998. [Google Scholar]
  26. Garboczi, E.J.; Berryman, J.G. Elastic Moduli of a Material Containing Composite Inclusions: Effective Medium Theory and Finite Element Computations. Mech. Mater. 2001, 33, 455–470. [Google Scholar] [CrossRef]
  27. Jiang, L.; Sun, J.; Liu, X.; Wang, H. Study of Different Factors Affecting the Electrical Properties of Natural Gas Reservoir Rocks Based on Digital Cores. J. Geophys. Eng. 2011, 8, 366–371. [Google Scholar] [CrossRef]
  28. Zhao, J.; Sun, J.; Jiang, L.; Chen, H.; Yan, G. Effects of Cementation on Elastic Property and Permeability of Reservoir Rocks. Diqiu Kexue—Zhongguo Dizhi Daxue Xuebao/Earth Sci.—J. China Univ. Geosci. 2014, 39, 769–774. [Google Scholar] [CrossRef]
  29. Liu, X.; Yan, J.; Zhang, X.; Zhang, L.; Ni, H.; Zhou, W.; Wei, B.; Li, C.; Fu, L.Y. Numerical Upscaling of Multi-Mineral Digital Rocks: Electrical Conductivities of Tight Sandstones. J. Pet. Sci. Eng. 2021, 201, 108530. [Google Scholar] [CrossRef]
  30. Wang, C.C.; Yao, J.; Yang, Y.F.; Zhang, L.; Pang, P.; Yan, Y.P. Percolation Properties Analysis of Carbonate Digital Core Based on Lattice Boltzmann Method. Zhongguo Shiyou Daxue Xuebao (Ziran Kexue Ban)/J. China Univ. Pet. (Ed. Nat. Sci.) 2012, 36, 94–98. [Google Scholar] [CrossRef]
  31. Martys, N.; Garboczi, E.J. Length Scales Relating the Fluid Permeability and Electrical Conductivity in Random Two-Dimensional Model Porous Media. Phys. Rev. B 1992, 46, 6080–6090. [Google Scholar] [CrossRef]
  32. Zhou, C.; Li, C.; Wang, C.; Hu, F. Logging Petrophysical Evaluation and Process of Complex Clastic Rock; Petroleum Industry Press: Beijing, China, 2013. [Google Scholar]
  33. Yue, W.Z.; Tao, G. A New Non-Archie Model for Pore Structure: Numerical Experiments Using Digital Rock Models. Geophys. J. Int. 2013, 195, 282–291. [Google Scholar] [CrossRef] [Green Version]
  34. Arns, C.H. The Influence of Morphology on Physical Properties of Reservoir Rocks; The University of New South Wales: Sydney, Australia, 2002. [Google Scholar]
  35. Liming, J. Numerical Simulation of Acoustic and Electrical Properties of Natural Gas Reservoir Rocks Based on Digital Cores. Doctoral Dissertation, China University of Petroleum (East China), Dongying, China, 2012. [Google Scholar]
  36. Nie, X.; Zou, C.; Li, Z.; Meng, X.; Qi, X. Numerical Simulation of the Electrical Properties of Shale Gas Reservoir Rock Based on Digital Core. J. Geophys. Eng. 2016, 13, 481–490. [Google Scholar] [CrossRef]
  37. Zhao, Y.; Li, X.; Fang, Z.; Zhang, Y.; Zhang, M.; Dai, X. Numerical Simulation of Resistivity of 3D Digital Core of Fractured Shale Oil Reservoir. Xi’an Shiyou Daxue Xuebao (Ziran Kexue Ban)/J. Xi’an Shiyou Univ. Nat. Sci. Ed. 2022, 37, 51–57. [Google Scholar] [CrossRef]
  38. Nie, X.; Li, B.; Zhang, J.; Zhang, C.; Zhang, Z. Numerical Simulation of Electrical Properties of Fractured Carbonate Reservoirs Based on Digital Cores. J. Yangtze Univ. (Nat. Sci. Ed.) 2022, 19, 20–29. [Google Scholar]
  39. Sun, J.; Chi, P.; Cheng, Z.; Yang, L.; Yan, W.; Cui, L. A Novel Saturation Calculation Model of Fractured-Vuggy Carbonate Reservoir via Multiscale Pore Networks: A Case Study from Sichuan Basin, China. J. Geophys. Eng. 2021, 18, 85–97. [Google Scholar] [CrossRef]
  40. Dong, H.; Blunt, M.J. Micro-CT Imaging and Pore Network Extraction; Department of Earth Science and Engineering, Imperial College London: London, UK, 2007. [Google Scholar]
  41. Haralick, R.M.; Sternberg, S.R.; Zhuang, X. Image Analysis Using Mathematical Morphology. IEEE Trans. Pattern Anal. Mach. Intell. 1987, 4, 532–550. [Google Scholar] [CrossRef] [PubMed]
  42. Liu, X.; Sun, J.; Wang, H. Numerical Simulation of Rock Electrical Properties Based on Digital Cores. Appl. Geophys. 2009, 6, 1–7. [Google Scholar] [CrossRef]
  43. Morgan, W.B.; Pirson, S.J. The Effect of Fractional Wettability on the Archie Saturation Exponent. In Proceedings of the SPWLA Annual Logging Symposium, Midland, TX, USA, 13 May 1964. SPWLA-1964-B. [Google Scholar]
Figure 1. The entire digital carbonate core sample scanned by X-ray CT.
Processes 11 02214 g001
Figure 2. Sections of carbonate digital cores with different porosities: (a) original image (Por = 17.6%); (b) erosion operation (Por = 9.9%); (c) dilation operation (Por = 27.3%); (d) dilation operation (Por = 33.3%).
Processes 11 02214 g002
Figure 3. Sections of water-wet carbonate digital cores with different water saturation levels: (a) Sw = 0%; (b) Sw = 5.3%; (c) Sw = 11.7%; (d) Sw = 16.3%; (e) Sw = 24.3%; (f) Sw = 34.4%.
Processes 11 02214 g003
Figure 4. Cross-plots of formation factor and porosity of digital core samples 1–8. (a) x-direction; (b) y-direction; (c) z-direction.
Processes 11 02214 g004
Figure 5. Cross-plots of formation factor and porosity of digital core sample 1. (a) x-direction; (b) y-direction; (c) z-direction.
Processes 11 02214 g005
Figure 6. Cross-plots of formation factor and porosity of digital core sample 3. (a) x-direction; (b) y-direction; (c) z-direction.
Processes 11 02214 g006
Figure 7. Pore-throat network model of digital rock samples. (a) sample 1; (b) sample 3.
Processes 11 02214 g007
Figure 8. Pore size and coordination number distribution of digital rock samples 1 and 3. (a) pore radius distribution; (b) coordination number distribution.
Processes 11 02214 g008
Figure 9. Cross-plots of resistivity and formation water conductivity of digital core sample 1 with different porosities. (a) x-direction; (b) y-direction; (c) z-direction.
Processes 11 02214 g009
Figure 10. Relationship between resistivity index and water saturation of digital core samples. (a) sample 1; (b) sample 3.
Processes 11 02214 g010
Figure 11. Relationship between resistivity index and water saturation of digital core sample 3 with different wettabilities. (a) x-direction; (b) y-direction; (c) z-direction.
Processes 11 02214 g011
Table 1. Statistics of the porosity of carbonate digital core sample.
Sample12345678Entire
Porosity (%)17.6319.4425.7221.1919.3421.8326.4934.4523.26
Disclaimer/Publisher’s Note: The statements, opinions and data contained in all publications are solely those of the individual author(s) and contributor(s) and not of MDPI and/or the editor(s). MDPI and/or the editor(s) disclaim responsibility for any injury to people or property resulting from any ideas, methods, instructions or products referred to in the content.

