Abstract
Integration of source, grid, load, and storage is an important measure for energy transformation. However, at present, the oilfield industry lacks mature models and related technologies. Therefore, an oilfield intelligent energy system integrating source, power grid, load, and storage is proposed in this paper. In view of the poor oilfield data quality, abnormal/missing data diagnosis and repair methods are proposed to improve the information accuracy of the intelligent cloud management center. The improved photovoltaic prediction method of conditional generation countermeasure network (CGAN), PV-VSG control of additional control, and flexible load control are put forward to upgrade the intelligent deployment system. The system design and key technologies can provide reference for the construction of new power systems and energy Internet in the future oilfield industry.
1. Introduction
Vigorously developing the smart energy system with renewable energy as the main body is an important measure to comprehensively promote the transformation of clean energy and achieve the strategic goal of “double carbon” [1,2]. The core feature of a smart energy system is that it can adequately cope with changes on the source side, the grid side, and the load side, intelligent control technology, and information automation technology [3,4,5,6]. The aim is to build a new energy system featuring extensive access, smart allocation of resources at the grid end, and multiple flexible responses at the load end.
At present, more than 120 countries have defined the nodes for achieving the “double carbon” goal and promoted its implementation. Germany, Switzerland, the United States, China, and other countries have carried out research on smart energy systems. In 2003, the Energy Office of the Swiss Federal Government launched the Vision of Future Energy Networks project [7]. The Energy Hub model and Energy Inter-connector model were proposed. The optimal cold-heat-electricity scheduling model and strategy based on multi-energy system under multi-objective demand were studied. In 2008, The United States established the future renewable electric energy delivery and management system (FREEDM) research center in North Carolina, conducting research on smart energy distribution systems. It is planned to establish a safe, reliable, and environment-friendly modern energy network managed by an energy router [8]. In 2008, Germany built an energy system based on information and communication technology (ICT). The aim was to develop and test core technologies for smart energy, and try to tap into the huge potential of energy optimization by adopting ICT [9]. At the same time, the energy market should be further developed to achieve decentralization and liberalization. In 2010, Japan launched the smart community demonstration project, which integrates multiple energy supply systems [10]. In 2013, the Energy Systems Integration Program was established in the United States to continue to deepen research. In April 2022, the first large-scale “source-grid-load-storage” project in China—Ulanqab Base Phase I—was put into operation, realizing the complementary of wind power, photovoltaic, and hydrogen energy. However, at present, the research on smart energy systems at home and abroad is still in the preliminary stage [11,12,13,14,15,16]. The functional structure of the system is not comprehensive, and the specific research and application of key technologies are lacking, especially for the intelligent energy system with oilfield characteristics.
The application prospect of a cloud management center based on big data in oilfield power grid is becoming increasingly evident. The oilfield power grid has a large amount of data, poor data quality, and even some data cannot be used directly, and there is a lack of data. Therefore, it is urgent to study the data cleaning technology of the oilfield power grid to improve data quality and accuracy of the cloud management center. At present, the traditional data cleaning technology only considers the single data distribution law, ignoring the correlation between measurement points and collected variables in the power grid, as well as historical data change laws, resulting in low data repair accuracy. For example, the most commonly used method for identifying abnormal data is 3 σ criterion [17]. This criterion is only valid for large amounts of normally distributed or nearly normally distributed data. However, the data from the oilfield distribution grid such as voltage and line loss do not obey normal distribution, so the 3 σ criterion is not applicable. The commonly used methods for repairing abnormal data and filling gaps in oilfield power grids include the interpolation model, mean replacement model, and regression model [18]. In addition, there is an imbalance problem with datasets collected from different sources or fluctuating operating conditions, and data enhancement methods need to be used to expand minority samples [19]. However, all these methods fail to consider the correlation between the distributions of the entire dataset and cannot quickly clean the online sequential or stream data, let alone ensure the consistency of data detection in different periods.
Therefore, this paper proposes a method of oilfield abnormal/missing data diagnosis and repair, and comprehensively upgrades the intelligent cloud management center. On this basis, an improved conditional generation countermeasure network (CGAN) PV prediction algorithm and VSG control method of additional control are proposed at the source side. Flexible load control is proposed to increase oil production and reduce energy consumption. Finally, the accurate and intelligent control of the deployment system is realized.
2. Design of Oilfield Intelligent Energy System
An oilfield intelligent energy system is proposed, as shown in Figure 1, mainly including an intelligent energy cloud management center based on big data, intelligent power grid dispatching system based on distributed generation, and flexible load control. The technology is based on digital infrastructure, cloud-edge-end technology, and research and development of control center software. Multi-node redundancy, parallel computing, and edge intelligence are realized and new energy active support control and flexible load aggregation are promoted.
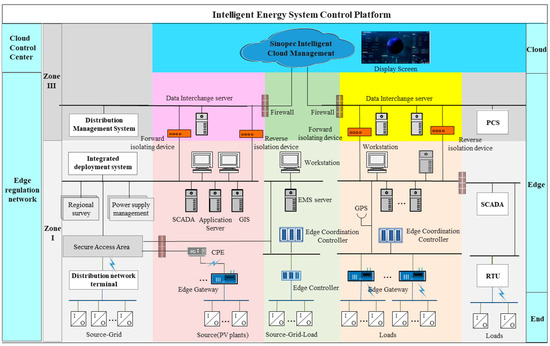
Figure 1.
The topology of the oilfield smart energy system.
3. Key Technologies for Energy Systems
3.1. Intelligent Energy Cloud Management Center
As shown in Figure 2, system source data such as electricity trading system, dispatching automation system, production command system (PCS), meteorological data, and related derived data are collected. A panoramic monitoring system is established. In addition, a method for diagnosing and repairing abnormal/missing data in oil fields is proposed. The “situation awareness” function of intelligent energy cloud management center is comprehensively improved.
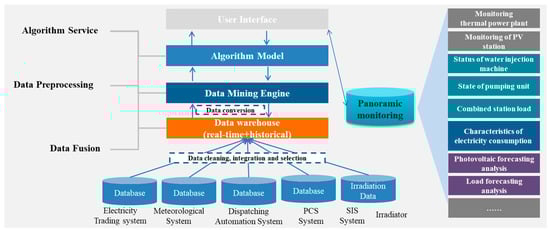
Figure 2.
Schematic diagram of intelligent perception.
3.1.1. Real-Time Identification of Oilfield Abnormal Data
Therefore, each sampled data point is regarded as the linear transformation of sampled data at each time, and then the correlation matrix is:
where is the coefficient matrix of the linear transformation:
The time-delay correlation of long time series of oilfield power data cannot be ignored. If is , when , and the row to column ratio C is fixed, the Stieltjes transformation of the limit spectral distribution h(x) of converges to:
where m(z) is the Stieltjes transformation value of the spectral density function h(x) at z. f(ω) is the spectral density of the linear transformation. The Auto-Regressive and Moving Average (ARMA) model is proposed for fitting time series. The spectral density of the ARMA model is estimated to be:
where , .
The line voltage data of Dongyi Transformer in Shengli Oilfield from January to June 2022 are collected at an interval of 1 h as example. First, the data identification results of spectral deviation and average spectral radius calculated from the time dimension are shown in Figure 3. Figure 3 shows that at the corresponding moment of the red circle, both the spectral deviation and the average spectral radius are abnormal, deviating from the normal indicator. Therefore, the two indicators confirm the time point of the abnormal data with each other. Then, taking the 1080th abnormal moment as an example, the spectral deviation degree is analyzed from the spatial dimension to find out the line where the abnormal data are located. The result is shown in Figure 4, the spectral deviation of the North 2nd Line and the East 1st Link Line is different from other lines, so it can be judged that the abnormal data appeared in the 1080 h measured voltage of these two lines. For further verification, the single ring theorem diagram of abnormal data and normal data is compared, as shown in Figure 5. Abnormal data can be clearly identified from the distribution of feature points in Figure 5. The abnormal data feature points are centrally distributed within the circle, while the normal data feature points are centrally distributed on the circle. Similarly, the M-P diagram can also be clearly compared to see the difference between normal data and abnormal data. As shown in Figure 6, the normal data curve should be close to the ideal state, while abnormal data deviates from the ideal state. The above results can be adopted to diagnose and identify the abnormal data of oil field.
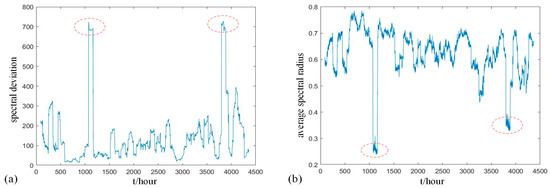
Figure 3.
Spectral deviation and average spectral radius of voltage data (time dimension). (a) Spectral deviation. (b) average spectral radius.
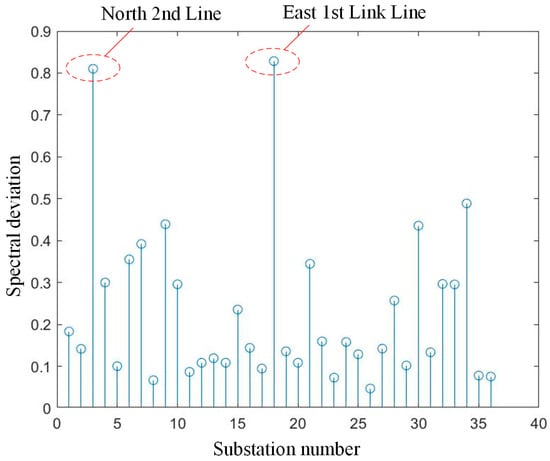
Figure 4.
Spectral deviation of voltage data (spatial dimension).
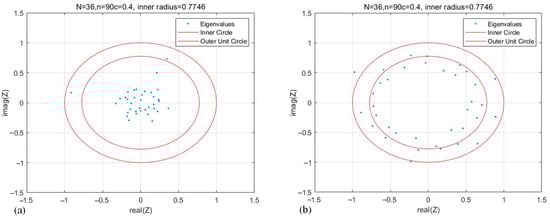
Figure 5.
Single ring theorem results of abnormal data and normal data. (a) Abnormal data. (b) Normal data.
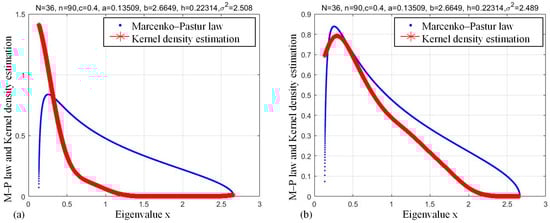
Figure 6.
M-P law results of abnormal data and normal data. (a) Abnormal data. (b) Normal data.
3.1.2. Oilfield Abnormal Data Repair and Missing Data Completion
After identifying the abnormal power data from the oilfield, the GAN algorithm based on Adam is proposed to repair the abnormal data or fill in the missing data. Each iteration of its training can be divided into two steps:
- (1)
- Fixed generator parameters, training update discriminator:Set γ—learning rate of neural networks, m—a batch of training data samples, φ—correction amount of network parameters, ndiscri, ngener—iterations of discriminator and generator networks, θd, θg—two network weights, initialized at the beginning of training. The specific process is as follows:
- (1)
- m batch data samples are obtained from the real data distribution Pdata;
- (2)
- m batch data samples are obtained from the random distribution Pz;
- (3)
- Enter into the generator to obtain , which is ;
- (4)
- Updating discriminator network by gradient descent methodAfter ndiscri iterations, θd is continuously updated to train the discriminator that is closest to the objective function.
- (2)
- Fixed discriminator parameters, training update generator:
- (1)
- m batch data samples {z1,z2⋯zm } are obtained from the random distribution Pz;
- (2)
- Update generator network by gradient descent method
After ngener iterations, θg is continuously updated to train the generator that is closest to the objective function.
After several iterations of discriminator and generator adversarial training, G and D performance continuously improved and finally reached stability. When Pz = Pdata, there is a global optimal solution. At this point, G learns the distribution of the real sample Pdata; that is, the data generated by the generator can effectively replace the missing or abnormal data in the oilfield data.
In order to visually show abnormal data in power data, the active power box diagram of Dongyi transformer on 30 May 2022 was created. The result is shown in Figure 7. It can be seen that there are abnormal values at every moment, so it is necessary to repair these data. The repair results are shown in Figure 8, the results are consistent with the actual operating conditions of the power grid, and the fluctuation of active power decreases obviously.
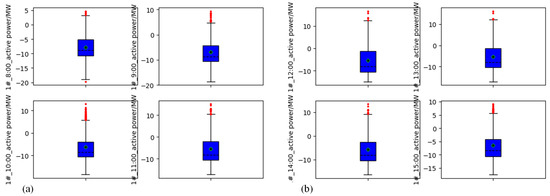
Figure 7.
The active power box diagram of Dongyi transformer on 30 May 2022. (a) 8:00–11:30. (b) 12:00–15:00.
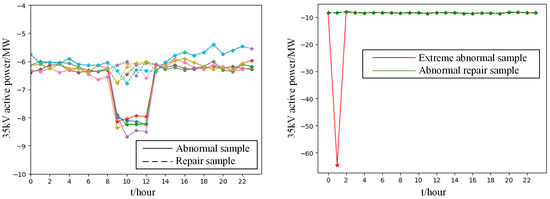
Figure 8.
Repair result of abnormal active power data.
For missing data completion, in order to obtain the accuracy of model completion data, this paper simulated the missing data, and took the average error percentage as the index to judge the model performance. The data completion results are shown in Figure 9. The average error percentages of active power and reactive power are 4.63% and 4.55%, respectively, which are less than 5%, indicating high accuracy. It can also be seen from Figure 9 that the filling value of the missing data is close to the real value measured, indicating that the data completion effect is excellent and can be effectively adopted to fill the missing data information.
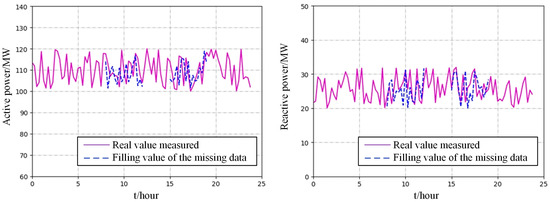
Figure 9.
The missing data completion results of active power and reactive power.
In addition, on the basis of complete data restoration, energy–flow transition modeling is carried out for power supply operation state and load flexible production state, combining the principles of electricity market trading and energy balance. The real-time optimization control model under multi-objective conditions is studied as shown in Figure 10. the optimal structural proportion of supply side was determined to achieve the “sources–loads” optimal matching. Finally, the panoramic monitoring of intelligent energy system was formed.
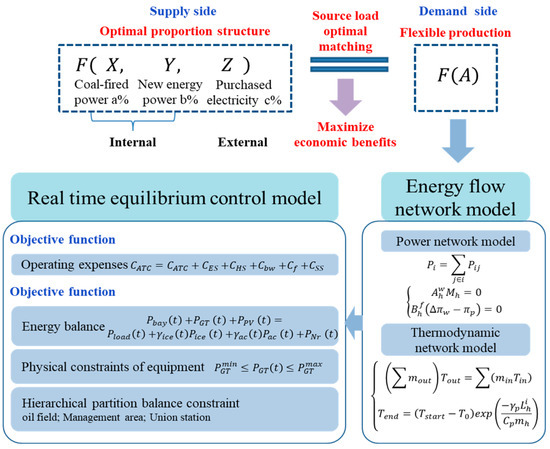
Figure 10.
Schematic diagram of algorithm optimization.
3.2. Intelligent Dispatching System of Power Grid
The upgrading of the intelligent dispatching system of the oilfield power grid mainly includes the source side and load side, which are realized from two levels of prediction and control, respectively.
3.2.1. Prediction and Control of Photovoltaic Power Generation
Traditional photovoltaic power generation forecasting methods, such as physical methods, statistical methods, and meta-heuristic learning methods, have high data requirements and are mainly used for photovoltaic power stations that have been in operation for a long time [20,21]. Therefore, it is not applicable to oilfield scenarios. The emerging recurrent neural network (RNN) prediction algorithm does not consider the correlation of variables, resulting in large prediction errors when affected by natural variables. The Elman neural network (ENN) based on Pearson correlation coefficients (PCCs) improves the problem of variable correlation, but the conditions for PCCs require that the variables be normally distributed and ENN converges slowly and is prone to falling into local optimizations. Therefore, an improved conditional generation adversarial network (CGAN) prediction algorithm is proposed. the time series is input before the prediction starting point as an additional condition into the model. The data after the starting point are applied as the real sample to solve the problem that traditional GAN cannot control the data generation mode under the condition of multi-noise in oilfield. Compared with traditional physical models, its significant advantage is that it does not involve any explicit modeling and only relies on a pure data-driven method to describe the possible fluctuation range of PV output. Compared with original GAN, CCAN comprehensively considers the mapping relationship between historical data and predicted power. The prediction is accurate and fast.
The overall algorithm flow of photovoltaic prediction in the oilfield distribution grid is shown in Figure 11.
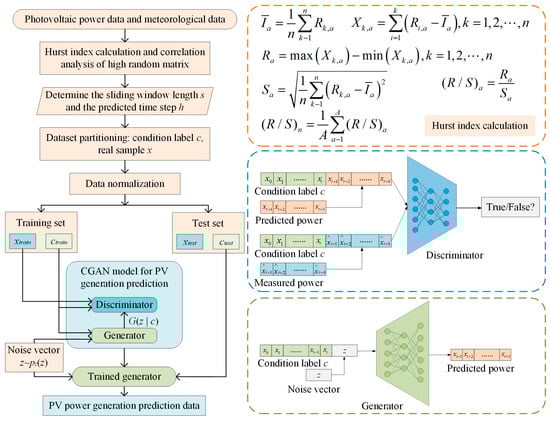
Figure 11.
The overall algorithm flow of photovoltaic prediction in oilfield distribution grid.
The CGAN loss function based on condition (composed of historical data and strongly correlated weather variables) is as follows:
where LG and LD are loss functions during the training of generator and discriminator, respectively. E is the calculation expectation. z~pz(z) represents the noise vector z sampled from the Gaussian distribution pz(z). x~pr(x) represents the measured power sampled from real data. is the predicted power under condition c. is the probability that the discriminator determines that the input sample is the measured power.
To avoid the problem of gradient disappearing in training, the traditional JS divergence is replaced by the loss function based on Wasserstein distance. Wasserstein distance is applied to measure the similarity between two distributions. The smaller the value, the higher the similarity. It is defined as:
where represents the set of joint probability distribution γ when actual distribution Pr and generated distribution Pg are applied as edge distribution. W (Pr, Pg) is the infimum of γ (x, y) expectation.
It is difficult to solve Wasserstein distance directly, so the Kantorovich–Rubinstein dual form is adopted:
where indicates that the gradient of the constraint discriminator parameter is within a certain range.
Modeling and training were conducted for YH, YW, EH, and EL photovoltaic power stations in Shengli Oilfield. Taking 23 November–3 December 2022 as an example, the actual and predicted results of PV power generation are shown in Figure 12. Figure 12 shows that the predicted and actual power generation curves of the four PV stations have similar variation trends, indicating that the improved CGAN model proposed can effectively solve the problem of oilfield photovoltaic power prediction.
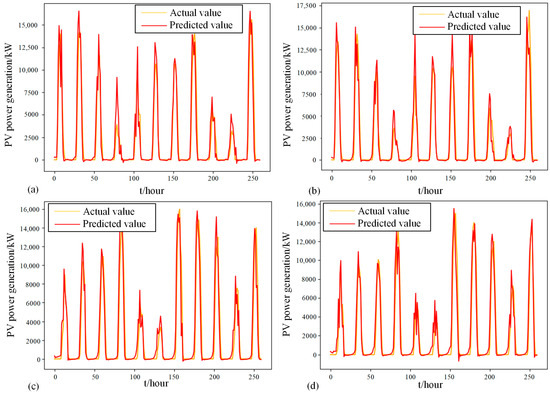
Figure 12.
Actual and predicted power of four PV stations (23 November–3 December 2022. (a) YH line. (b) YW line. (c) EH line. (d) EL line.
Root mean square error (RMSE) and mean absolute percent error (MAPE) were calculated:
where N is the number of samples. pi and Pi are the predicted and actual values of PV power, respectively.
The prediction error results of the four PV plants are shown in Table 1. Table 1 shows that the predicted RMSE for both YH and YW are less than 5 kW, and the MAPE are smaller than for both EH and EL. This is because there are relatively more missing values in the original data of EH and EL, which affects the prediction error. However, in general, the MAPE is less than 5%, indicating that the accuracy of the model prediction is still guaranteed even when the original data are missing.

Table 1.
Prediction error.
Based on accurate prediction of photovoltaic power generation, an additional photovoltaic control and transient process optimization based on MPPT evaluation of DC side voltage tolerance is proposed for source side photovoltaic dynamic virtual synchronization control. As shown in Figure 13, MPPT obtains the minimum DC voltage, then passes through PI controller with an upper limit of 0, and superposes with active/reactive power loop input to change the reference value of active/reactive power input. Then, the inertia parameters and damping coefficients under the approximate optimal strategy are further solved, and the analytical expressions are obtained by piecewise linearity to realize the online adjustment of key control parameters.
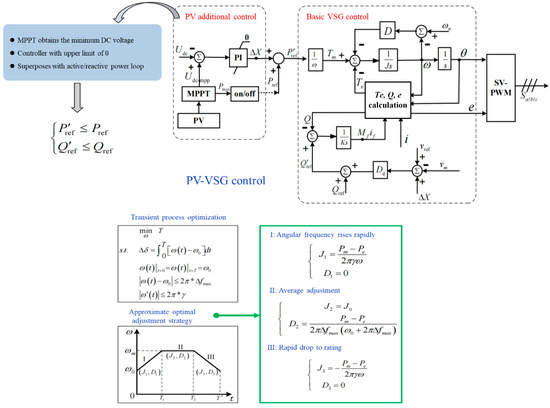
Figure 13.
PV−VSG control.
The result of the control applied to GD demonstration area is shown in Figure 14. When the angular frequency of the system rises rapidly and uniformly and drops rapidly, through additional control and adaptive adjustment of transient optimization key parameters J and D, the transient performance of the system is significantly improved when the frequency fluctuates. The frequency does not exceed the threshold, and the response is faster and smoother than before.
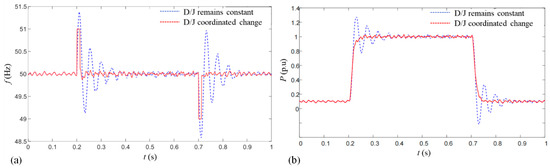
Figure 14.
Frequency and power response under different D/J: (a) Frequency response; (b) Power response.
3.2.2. Prediction and Control of Flexible Production
Shengli Oilfield Company has about 9000 oil wells and 308 plunger pumping stations with variable frequency capability, which can flexibly adjust loads. Although partial flexible production has been realized, there are still some problems: (1) Lack of interactive response between load side and source-grid-storage. (2) Lack of collaborative strategy for maximizing development benefit and flexible intelligent production. (3) The intelligent adjustment means of load side are obviously insufficient. To solve the above problems, this paper adopts the edge intelligence platform which integrates edge computing and artificial intelligence. Integrate intelligent tuning, demand side response, flexible follow-up, and other applications. Production optimization models such as oil well condition identification, production dynamic analysis, single well optimization, injection–production linkage, and block cooperation are constructed. Intelligent empowerment of flexible production loads through machine learning can reduce oil recovery costs, increase average oil recovery, and achieve efficient and sustainable development of oil fields.
The demonstration area of HK oil plant was established. The intelligent optimization results are shown in Figure 15. The BAE55-X10 well was optimized automatically based on the dynamic level in the early stage, and the frequency was reduced to 22 Hz. Then, the well was hot washed and the moving liquid level rose. The system automatically adjusted and increased the frequency to 25 Hz, which accelerated the drainage and increased the liquid yield by 45.9%. In the later stage, when the moving liquid level dropped, the frequency was automatically optimized to 21 Hz, and the liquid yield was still more than 10 tons. The results show that the single well optimization realizes the fine control and timeliness of oil well production.
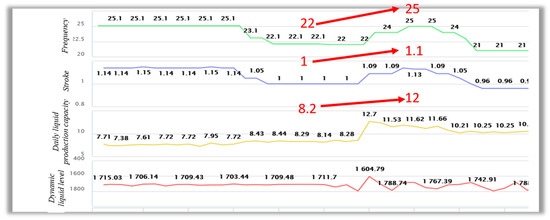
Figure 15.
Intelligent optimization of HK oil production plant.
As shown in Table 2 and Table 3, automatic real-time tuning of more than 300 frequency conversion wells was carried out in HK 4 zone, HK 5 zone, HX management zone, ZX 1 zone, GD 4 zone, and other management zones. The results show that the effect of increasing oil and saving electricity is obvious, with an annual increase of about 18 tons of oil per well and an annual reduction of about 327 USD.
Table 2.
Results of frequency conversion flexible adjustment for 300 wells.
Table 3.
Results of flexible production in five demonstration areas.
Flexible follow-up control is used to optimize the influence of the oil well string after multiple factors interweave, parameters are difficult to define and there are multiple rounds of changes in production. To realize the inverse ratio rule of the motor speed and load distribution to a certain extent, the rigid impact of the top and bottom dead center is reduced, and the service life of the equipment is extended. The optimization control 1 and 2 is to adjust the pumping unit speed by a small and a large amount near the dead point, respectively. As shown in Figure 16, the results show that the two optimal control methods improve the current impact better than constant speed control, and the effect of optimal control method 2 is better. Table 4 shows that the replacement cycle of flexible control belt and pump inspection is extended by 23.9% and 19.45%, respectively.
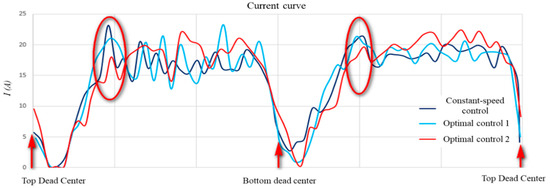
Figure 16.
Current curves under different flexible follower optimal control.
Table 4.
Flexible production results in extended pump and belt life cycles.
4. Conclusions
An oilfield intelligent energy system integrating source, grid, load, and storage is designed. We improved the situational awareness function of the intelligent cloud management center, and proposed a method to identify and repair abnormal/missing data of oilfield data with an accuracy of more than 95%. In terms of oilfield intelligent dispatching system, the improved CGAN photovoltaic prediction, VSG control method of additional control, and flexible load control of oilfield are proposed. The results show that the PV prediction deviation is less than 5%. Through the automatic optimization method of dynamic liquid level based on edge computing, the liquid yield is increased by 45.9%. Precise control of single well optimization was realized. Through the collaborative intelligent control of the oilfield area, the annual increase in oil production and cost savings of a single well are about 18 tons and 327 USD, respectively. The economic benefits are significant. An optimization method of flexible follow-up control was proposed. The results show that the replacement cycle of flexible control belt and pump inspection were extended by 23.9% and 19.45%, respectively. The system design and key technologies of the intelligent energy system integrated with source, grid, load, and storage in the oilfield provides technical support for building a clean, efficient, and sustainable energy consumption system.
Author Contributions
Conceptualization, H.S. and C.N.; methodology, formal analysis, writing—review and editing, L.W.; validation, C.Y. and D.S.; funding acquisition, W.L.; investigation, F.W.; resources, H.X.; data curation, Q.S. All authors have read and agreed to the published version of the manuscript.
Funding
This research received no external funding.
Data Availability Statement
No new data were created or analyzed in this study. Data sharing is not applicable to this article.
Acknowledgments
Thanks to Sinopec Shengli Oilfield Company for supporting the project.
Conflicts of Interest
The authors declare no conflict of interest.
References
- Frangopoulos, C.A. Recent developments and trends in optimization of energy systems. Energy 2018, 164, 1011–1020. [Google Scholar] [CrossRef]
- Gao, Y.; Ai, Q.; Yousif, M.; Wang, X. Source-load-storage consistency collaborative optimization control of flexible DC distribution network considering multi-energy complementarity. Int. J. Elec. Power 2019, 107, 273–281. [Google Scholar] [CrossRef]
- Liu, T. Energy management of cooperative microgrids: A distributed optimization approach. Int. J. Electr. Power. Energy. Syst 2018, 96, 335–346. [Google Scholar] [CrossRef]
- Hu, X.; Zhang, H.; Chen, D.; Li, Y.; Wang, L.; Zhang, F.; Cheng, H. Multi-objective planning for integrated energy systems considering both exergy efficiency and economy. Energy 2020, 197, 117155. [Google Scholar] [CrossRef]
- Li, R.; Wang, W.; Wu, X.; Tang, F.; Chen, Z. Cooperative planning model of renewable energy sources and energy storage units in active distribution systems: A bi-level model and pare to analysis. Energy 2019, 168, 30–42. [Google Scholar] [CrossRef]
- Li, S.; Zhu, J.; Wu, X.; Dong, H. A novel energy sharing mechanism for smart microgrid. IEEE. Trans. Smart. Grid 2021, 12, 5475–5478. [Google Scholar] [CrossRef]
- Favre-Perrod, P. A vision of future energy networks. In Proceedings of the Power Engineering Society Inaugural Conference and Exposition in Africa, Johannesburg, South Africa, 11–15 July 2005; IEEE: Piscataway, NJ, USA, 2005; pp. 13–17. [Google Scholar]
- Huang, A.; Crow, M.; Heydt, G.; Zheng, J.; Dale, S. The future renewable electric energy delivery and management (FREEDM) system: The energy internet. Proc. IEEE 2011, 99, 133–148. [Google Scholar] [CrossRef]
- Salahuddin, M.; Alam, K. Information and communication technology, electricity consumption and economic growth in OECD countries: A panel data analysis. Electr. Power Energy Syst. 2016, 76, 185–193. [Google Scholar] [CrossRef]
- Li, Y.; Gao, W.; Ruan, Y.; Yoshiaki, U. Demand response of customers in Kitakyushu smart community project to critical peak pricing of electricity. Energy Build. 2018, 168, 251–260. [Google Scholar] [CrossRef]
- Wu, J. Drivers and state-of-the-art of integrated energy systems in Europe. Autom. Electr. Power Syst. 2016, 40, 1–7. [Google Scholar]
- Wang, S.; Wang, X.; Wu, W. Cloud computing and local chip-based dynamic economic dispatch for microgrids. IEEE. Trans. Smart. Grid 2020, 11, 3774–3784. [Google Scholar] [CrossRef]
- Liu, J.; Yao, Q.; Hu, Y. Model predictive control for load frequency of hybrid power system with wind power and thermal power. Energy 2019, 172, 555–565. [Google Scholar] [CrossRef]
- Li, S.; Zhu, J.; Chen, Z.; Luo, T. Double-layer energy management system based on energy sharing cloud for virtual residential microgrid. Appl. Energy 2021, 282, 116089. [Google Scholar] [CrossRef]
- Dahab, Y.; Abubakr, H.; Mohamed, T. Adaptive load frequency control of power systems using electro-search optimization supported by the balloon effect. IEEE Access 2020, 8, 7408–7422. [Google Scholar] [CrossRef]
- Peng, C.; Zhang, J.; Yan, H. Adaptive event-triggering H∞ load frequency control for network-based power systems. IEEE. Trans. Ind. Electro. 2018, 65, 1685–1694. [Google Scholar] [CrossRef]
- Lei, Y.; Zhou, X.; Xu, X.; Jia, F. A dirty data recognition method for machinery condition monitoring in big data era. In Proceedings of the IECON 2017-43rd Annual Conference of the IEEE Industrial Electronics Society, Beijing, China, 29 October 2017; pp. 7061–7066. [Google Scholar]
- Yang, C.; Xu, X.; Kotagiri, R.; Chen, J. A Scalable Multi-Data Sources Based Recursive Approximation Approach for Fast Error Recovery in Big Sensing Data on Cloud. IEEE. Trans. Knowl. Data Eng. 2020, 32, 841–854. [Google Scholar] [CrossRef]
- Jiang, X.; Ge, Z. Data augmentation classifier for imbalanced fault classification. IEEE. Trans. Autom. Sci. Eng. 2020, 18, 1–12. [Google Scholar] [CrossRef]
- Goodfellow, I.J.; Pouget-Abadie, J.; Mirza, B.; Xu, D.; Warde-Farley, S.; Ozair, A.; Courville, A.; Bengio, Y. Generative adversarial nets. Adv. Neural Inf. Process. Syst. 2014, 27. [Google Scholar]
- Nelega, R.; Greu, D.I.; Jecan, E.; Rednic, V.; Zamfirescu, C.; Puschita, E.; Turcu, R.V.F. Prediction of Power Generation of a Photovoltaic Power Plant Based on Neural Networks. IEEE Access 2023, 11, 20713–20724. [Google Scholar] [CrossRef]
Disclaimer/Publisher’s Note: The statements, opinions and data contained in all publications are solely those of the individual author(s) and contributor(s) and not of MDPI and/or the editor(s). MDPI and/or the editor(s) disclaim responsibility for any injury to people or property resulting from any ideas, methods, instructions or products referred to in the content. |
© 2023 by the authors. Licensee MDPI, Basel, Switzerland. This article is an open access article distributed under the terms and conditions of the Creative Commons Attribution (CC BY) license (https://creativecommons.org/licenses/by/4.0/).