Abstract
Every year, the pulp and wood-processing industry produces large side streams of bark, the valorisation of which is desirable for both economic and environmental reasons. We investigated organosolv extraction of antioxidants from Picea abies bark using various ratios of ethanol/water with the goal of obtaining high yields of these desirable compounds. The resulting extracts were analysed (I) for their total contents of phenols (TPC), flavonoids (TFC) and tannins (TTC), and (II) for their antioxidant activity using the DPPH radical scavenging method. The highest total yield of bark extract (14.78%) and the highest concentrations of dry extracts of TPC (324.80 mg g−1), TFC (62.55 mg g−1) and TTC (83.63 mg g−1) were obtained under mild conditions (100 °C extraction temperature and an ethanol/water solvent ratio of 50%, v/v). DPPH antioxidant activity index (AAI) ranged from 0.68 (pure water extract) to 1.31. This antioxidant effect was increased to 1.59 by adding oligolignin from the organosolv process. In the extracts, gas chromatography–mass spectrometry (GC–MS) found nine aromatic carboxylic acids, including phenolic acids and the flavonoid compounds quercetin and (+)-catechin. Our environmentally friendly approach will form the basis for pilot plant and industrial applications.
Keywords:
phenolic compounds; organosolv extraction; spruce bark; GC–MS; GPC; FT-IR; 31P-NMR; antioxidant activity 1. Introduction
Many substances used or produced in industries pose a challenge in terms of disposal and impact on the environment due to their flammability, toxicity or volatility. Environmentally friendly processes in the chemical industry are one way to reduce emissions to the atmosphere and contamination of wastewater. Many organic solvents used in the chemical industry are harmful to health, carcinogenic or environmentally hazardous, which makes the importance of developing environmentally friendly processes even more important. The use of non-toxic solvents in the extraction and recovery of valuable substances offers a crucial opportunity here [1]. Lignin and extractives are by-products of the pulping process. The material use of lignin as a component of cardboard, resins or fillers has been established for a long time. The combination of lignin and extractives for use in the pharmaceutical and cosmetics industry is an innovation in this context. Bio-based phenolic compounds found in spruce bark are known to be value-added products with antioxidant capacity. The gain and isolation of these extractive compounds require suitable separation techniques. In recent decades, research into lignocellulosic biorefinery has focused on the contained aromatic compounds of agricultural and forestry waste [2]. In this context, the valorisation of process waste streams is a central objective. The organosolv process was chosen for this study because it improves the recovery of various phenolic and flavonoid substances. The advantage is that good yields of desired aromatic compounds are already achieved at low temperatures between 50 and 95 °C. This is particularly relevant in terms of energy and costs [3]. Bark, in particular, is currently regarded as one of the most abundant raw materials, since spruce and pine are usually used in the pulp, paper and woodworking industries. Greenwood of conifers contains around 10% bark, and per year, there is around 500,000 m3 of spruce bark (density = 380 kg m−3) in Slovakia and 900,000 t of bark per year in the Finnish forest industry [4]. In Germany, around 11% of the tree volume of conifers is determined as material loss during debarking of the wood logs [5]. In Central and Northern Europe, around 25 Mio m3 of bark of softwood conifer trees are available [6]. At present, most bark waste is combusted for heat or electricity, although it contains various useful aromatic compounds such as lignans, tannins and stilbenes [7]. Jablonsky et al. provided a comprehensive review of the extractive properties of softwood bark and of its valorisation by extraction of utilisable chemicals [7]. The extraction of phenolic components is also in line with Goal 8, “Sustainable Economic Growth”, and Goal 15, “Promote sustainable use of terrestrial ecosystems” of the SDG 2030 agenda. In this context, the substitution of fossil chemicals with bio-based chemicals is one of the most important tasks for the future [8].
Extraction and purification of these desired compounds are the key tasks in the side-stream valorisation of forestry waste. Organosolv solvents are the preferred process media for biorefining lignocellulosic feedstocks (e.g., wood) [9] and thus for bark, and were, therefore, the solvents of choice when working with tree bark. These bioactive compounds also exhibit anti-bacterial, anti-inflammatory, anti-viral, anti-malarial, anti-mutagenic, anti-tumour, cytotoxic, fungicidal, insecticidal, and pharmacokinetic activities and properties. The extraction of hydrophobic structures, such as phenolics and flavonoids, is of particular interest because their antioxidant capacity promises a wide range of potential applications [10]. There are various studies comparing different extraction techniques, such as pressurised liquid extraction (PLE), using different solvents, supercritical fluid extraction (SFE), microwave-assisted extraction (MAE) or reflux boiling (RB) [11]. Hot-water extraction processes, either under or without pressure, are well-known methods for isolating tannins from bark [12].
Co et al. showed that the yield of bark extraction is increased by using ethanol as a solvent which was one of the reasons for using this solvent in our present study [13]. Krogell et al. and Kreps et al. reported a method that uses hexane and acetone to extract aromatic compounds from spruce bark [7,8]. Burčova et al. used both ethanol and n-hexane as solvents in their Soxhlet bark extractions [14]. Jablonsky successfully obtained higher yields of phenolic compounds out of spruce bark by the use of deep eutectic solvents instead of conventional solvents [15]. Spinelli shows in her works that ultrasonic-assisted extraction shows a higher yield of transresveratrol compared to established pressurised liquid extraction [16]. All these studies were performed using accelerated extraction methods in laboratory experiments, e.g., ultrasonic or microwave assistance. The goal of our study was to implement an easier experimental setup that can be easily adapted by industrial partners. Throughout all the studies, we intended to use ethanol/water for solvent mixtures in our experiments due to their environmentally friendly and non-toxic properties.
The phenolic compounds are highly protective against bacteria and fungi and can act as antiproliferative compounds and as antioxidants, and exhibit 2,2-diphenyl-1-picrylhydrazyl (DPPH) free-radical scavenging activity [17,18]. Aufischer et al. found that phenolic hydroxyl groups in lignin and its degradation products react with free radicals and trap them within the sterically hindered phenolic structure [19]. Using the DPPH method, they compared lignin and its degradation products with the commercial reference substances butylated hydroxytoluene (BHT), butylated hydroxyanisole (BHA), and Irganox 1010 in terms of antioxidant activity [19]. The antioxidant activities of the degraded lignin fractions were better than those of BHT and BHA, and on par with commercially available Irganox 1010 [19]. Alzagameem et al. used various assays to examine the extracts from spruce bark waste for antioxidant activity of bioactive constituents and found correlations between antioxidant activities and minor structural differences of purified lignins [20]. The biomass source, the pulping process and the degree of purification have an influence on antioxidant activity [20]. Strižincová presented in her studies that the antioxidant activity not only depends on the concentration of phenolic compounds in the extract, but also on the sample composition [21].
Due to the better environmental impact and overall economical extract utilisation, this study focused on a systematic view of the extraction process of spruce bark and demonstrated the impacts of temperature and solvent polarity using various ethanol/water ratios. Our results form the basis for pilot plant and industrial applications. We used mild conditions and a relatively simple processing setup to address aspects of economical and cost-efficient upscaling. As part of designing an improved biorefinery, we investigated the total phenolic content as a function of solvent polarity, temperature, and time. Further, the antioxidant activity of the extracts alone and in combination with degraded lignin was studied.
2. Results and Discussion
2.1. Characterisation of Bark Extract
The bark raw material was purchased from an industrial partner and represented a mixture of different batches that were collected at various times. For this, the chemical composition of the main constituent’s lignin, cellulose and hemicelluloses was determined. Oligolignin from another previous work [9] was also analysed. Components of the bark and oligolignin composition are shown in Table 1.

Table 1.
Bark and o-lignin composition (wt.% of dm bark, n = 3, *AIL-acid-insoluble lignin; ASL-acid-soluble lignin).
Spruce bark composition was characterised according to the report TP-510-42621 of the National Refinery Energy Laboratories (NREL) [22]. Ash [23], carbohydrate, and lignin [24] contents were calculated relative to dry matter (dm). The sum of all lignin fractions, carbohydrates and ash was 93 wt.%. In the present method, no suberins, pectins and lipophilic components such as fats or waxes are determined. The high glucose content can be explained by the carbohydrate polymers cellulose and starch. All obtained carbohydrate results are normalised as anhydro polymers. The high content of mannose is due to the glucomannan contained in softwoods. Due to the strongly acidic digestion, the lignin is separated into both an acid-soluble and an acid-insoluble fraction. At 3.57%, the proportion of acid-soluble lignin is high compared to other raw materials, which confirms a higher content of low-molecular lignin in the bark material. The extractives were determined three times, and the mean values are listed in Table 1. The yields of crude bark extracts are shown in Table 2.
Table 2.
Yields of spruce bark extraction in % w/w of dry bark for various temperatures and various proportions of ethanol content of the solvent.
The extracts from the bark extraction process are complex mixtures of polar and non-polar compounds that include not only target compounds, but also impurities such as fatty acids, carboxylic acids and carbohydrate monomers. Le Normand et al. showed that saccharide hydrolysis of the non-cellulose polysaccharides starts at above 100 °C and increases rapidly at 140 °C and 160 °C [25]. They explained this observation by low hydrolysis reactions in the carbohydrate backbone of the bark material. Similar results concerning the yields of the crude extracts were described by Neiva et al., who showed 9.48 wt.% with ethanol extraction and 14.88 wt.% with hot-water extraction [26]. The high yield of ethanol extraction, even at lower temperatures, is influenced by the co-extraction of non-polar compounds, such as fatty acids and resin acids, for which a preliminary extraction with n-hexane has been suggested [27].
Ethanol is required to extract high molecular weight stilbenes, such as piceasides and astringins, as described in detail by Gabaston et al. [28]. Co et al. showed that ethanol and water as solvents lead to reliable yields of aromatic compounds [13]. Even with low amounts of water in the solvent, some carbohydrates are co-extracted due to hydrolysis of the glycosidic bonds between hemicelluloses and aromatic compounds. These residual carbohydrates can be removed by chromatographic purification of the crude extracts using an ion exchange resin and high-purity water [27] or by drying the crude extracts in ethyl acetate, as described by St. Pierre et al. [29].
The difference in saccharide concentrations, especially in the hot-water extractions between 80 and 100 °C, is probably due to enhanced hydrolysis reactions of hemicellulose and starch layers within the bark material compared to the results at lower temperatures. Hemicelluloses in lignocellulosic feedstocks are usually extracted at temperatures between 140 and 200 °C, as detailly described by Kilpelainen et al. [30]. Pectins and higher-molecular-weight non-cellulosic polysaccharides are quantified at larger concentrations using similar extraction temperatures of 140 and 160 °C, as reported by Le Normand et al. [25]. In our extraction experiments, we did not use such high temperatures to avoid excessive amounts of carbohydrates in the crude extracts. Detailed results of the measurements of total sugar are presented in Supplementary Table S1.
The effect of the extraction parameters temperature and solvent ratio on the yields of the soluble extract was determined gravimetrically (Table 2). The yield of total extracts was expressed as the mass of soluble extracts over the mass of bark material used. A 50% (v/v) solvent ratio of ethanol/water gave the highest crude-extract total yield of 14.78 wt.%. Hot-water extraction without ethanol resulted in a 10.62 wt.% yield at 100 °C. Crude extracts from ethanol/water extraction with 75% (v/v) ethanol content consistently showed yields of more than 10 wt.%. At 40 °C and 60 °C, higher amounts of ethanol significantly increased the extraction yield. Extracts were not treated further because saccharide monomers were quantified directly in the liquid phase. The saccharide results are given as the average of three measurements with a standard deviation ≤5% in Table S1. Pure-water extraction at 100 °C gave the highest content of carbohydrate monomers. In all extracts obtained, glucose was the predominant saccharide detected, with concentrations between 0.14 wt.% and 1.08 wt.% (Table S1). Mannose, the most abundant saccharide in softwood hemicelluloses, was found at concentrations of up to 0.79 wt.%.
In the present work, the bark extracts and oligolignin are mixed, and the individual samples are characterised using various analytical methods. The procedure is shown as a flow chart in Figure 1.
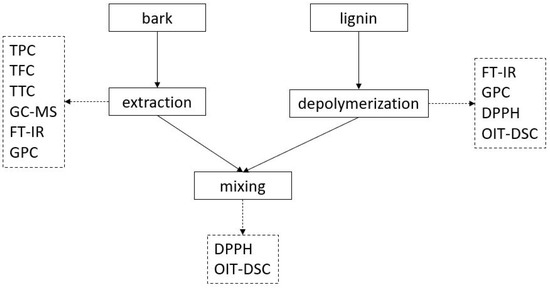
Figure 1.
Experimental procedure of this study.
Lignin and bark are by-products of the pulp industry. Our approach is to extract the sought-after substances from both waste fractions in order to be able to use them specifically. In the case of bark, the phenolic components have low molecular weights and are glycosidically bound to carbohydrates. For this, extraction with the appropriate solvent is the optimal process step. Lignin has aromatic structures with higher molecular masses than extractives of the bark. A homogeneously or heterogeneously catalysed depolymerisation is required to produce lignin with lower molecular mass and better properties. All fractions are analysed by GPC, FT-IR as well as antioxidant measurements. In addition, photometric analyses are required to quantify the content of phenolic, flavonoid and tannic substances in the bark extracts.
2.2. Characterisation of Total Content of Phenolics, Flavonoids and Tannins
Total phenolic content was determined in terms of gallic acid equivalent (GAE), total flavonoid content as quercetin equivalent (QE), and total tannin content as tannic acid (TA) equivalent. Experimental results are given as the average of two measurements and are shown in Table 3.
Table 3.
Concentrations of the compounds found in the extract.
The data obtained show that the TPC and the TFC depended on the ethanol/water ratio in the solvent. Without ethanol, TPC ranged between 11.65 and 29.65 g per gram of dry extract. Significantly higher concentrations of phenolic and flavonoid compounds were determined in the extracts with 50% and 75% ethanol/water ratio. The largest quantities of bioactive aromatic compounds were extracted using 50 wt.% and 75 wt.% ethanol. Talmaciu (Talmaciu 2016) and Ghitescu (Ghitescu 2015) [31,32] showed in their work that classical extraction has lower yields of phenolic components than, for example, microwave-assisted or ultrasound-assisted extraction. Both assisted methods have the disadvantage that they require more electricity and are not very suitable for upscaling in industry. Thus, the present values provide a fundamental basis for the development of bark waste extraction on a pilot scale.
Our study shows the importance of using ethanol to specifically extract phenolic compounds. Most of them are glycosidically bound to the cellulosic and/or hemicellulosic backbone in the lignocellulosic raw material. Thus, the corresponding hydrolysis of sugars should be considered in pilot plants or at the industrial scale. Increasing the temperature increased the concentrations of the target compounds in the crude extracts. This may contradict the results of Le Normand et al. [33], who used hot-water extractions to isolate condensed tannins from spruce bark. The disadvantages of pure-water extractions in biorefinery processing are the high temperatures required (>100 °C) and the resulting occurrence of pectins and hemicelluloses as impurities in the crude extracts. This effect is ameliorated by using a solvent mixture of ethanol and water for extraction. Ghitescu showed that supercritical CO2 and 70% ethanol are required to obtain high concentrations of phenolic compounds [31]. Sládková et al. carried out extraction experiments using pure 96% ethanol at 100 °C and proposed this as the optimal process [4]. Legault et al. showed that increasing the ethanol content leads to higher total yields of bark residuals [34]. All these findings are in line with our present study. The results obtained show not only the concentrations of the desired target compounds in the crude extracts, but also side effects like carbohydrate hydrolysis and co-extraction of impurities such as lipophilic compounds. All these thoughts are essential for the scale-up and are not discussed in the preliminary studies.
2.3. GC-MS Characterization of Bark Extract
GC-MS was used for compound profiling of the crude extract. Silylation rendered all types of hydrophilic and lipophilic extracted compounds volatile and identifiable in mass spectra. N,O-Bis(trimethylsilyl)trifluoroacetamide (BSTFA) was used in excess to ensure complete silylation of the phenolic compounds. The GC oven program and detection and injection conditions described by Zhong were used [35]. In Figure 2, the sample ethanol = 50% (T = 100 °C) is shown. All phenolic compounds were identified as trimethylsilyl (TMS) derivatives (Table 4). Chromatograms of the samples E = 0%, E = 25% and E = 75% are listed in Supplementary Figure S1.
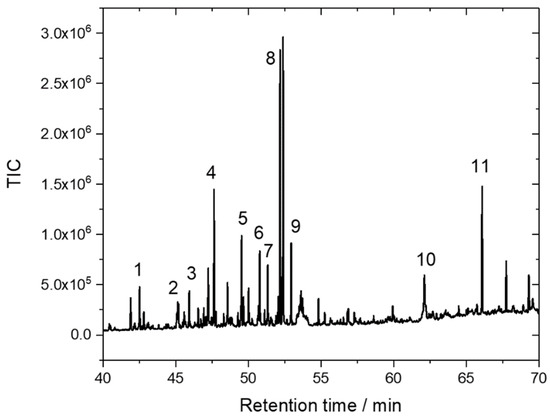
Figure 2.
GC-MS analysis of phenolic compounds of a representative bark extract; water/ethanol ratio = 50:50 (1 = o-hydroxybenzoic acid, 2 = ferulic acid, 3 = syringaldehyde, 4 = vanillic acid, 5 = p-hydroxybenzoic acid, 6 = protocatechuic acid, 7 = p-coumaric acid, 8 = gallic acid, 9 = cinnamic acid, 10 = quercetin, 11 = (+)-catechin).
Table 4.
Phenolic compounds are identified as trimethylsilyl derivatives.
In most of the mass spectra, the base peak of the histograms was m/z = 73 due to the trimethylsilyl substituent. This was also reported by Rohloff [36]. Ferulic acid, o-hydroxybenzoic acid, and gallic acid are typical phenolic compounds of Picea abies. Lazar et al. extracted Picea abies bark with an ethanol/water ratio of 70% (v/v) and, using HPLC-UV, identified aromatic carboxylic acids as the predominant compounds in the extracts [37]. All these phenolic compounds can undergo prooxidative or antioxidative reactions. Especially vanillic acid and coumaric acid can act as antioxidants [38], and the bark extracts, especially from conifers, are preferable for these desired antioxidant effects [39]. In the case of extraction with an ethanol/water ratio of 75% (v/v), our GC-MS measurements identified high concentrations of palmitic, stearic abietic, and pimaric acid in the extracts, which is an important finding for the processing of lignocellulosic waste in biorefineries. Processing should use a solvent with suitable polarity to avoid excessive hydrolysis on the one hand and impurities in the form of lipophilic compounds, such as resins or fatty acids, on the other.
The resolution of the peaks of aromatic carboxylic acids—the predominant phenolic compounds present—was sufficient to identify the compounds by more than 90% similarity of the NIST Wiley 2014 mass spectra library. Only the extraction experiments using water/ethanol = 50:50 showed a variety of aromatic compounds with various substituents in the GC-MS data. Experiments with an ethanol/water ratio of 25% (v/v) and without ethanol showed mostly hydroxyl carboxylic acids and saccharide monomers. More lipophilic compounds, such as fatty acids and resin acids, were detected in the extraction experiments using an ethanol/water ratio of 75% (v/v). All results of the GC-MS measurements are listed in Supplementary Table S1. Seven compounds were quantified by the GC-MS method. All compounds are listed in Table 5.
Table 5.
GC-MS data of phenolic compounds expressed in mg/g bark extract.
The extract using 50% Ethanol showed the most different phenolic compounds of all samples. In the bark extract E = 0%, no phenolic compounds were detected in the chromatograms. Gallic acid was the most abundant compound of all analysed samples. In the literature, it is shown that the yield of phenolic compounds by classical extraction is lower than with enhanced methods. Talmaciu showed that the content of ferulic and p-Coumaric acid can be increased by the use of ethanol and supercritical CO2 in the extraction process. In our present study, we showed that the classic extraction also appropriates good yields of phenolic compounds by the use of 50% ethanol.
2.4. Molar Weight Distributions of the Bark Extracts
All bark extracts were analysed for their molecular weight distribution. Obtained results are expressed in Table 6.
Table 6.
Size exclusion chromatography data of the bark extracts (MW = weight average, MN = numerous averages, PDI = Polydispersity Index) (n = 3).
It was shown in the table that the experiments using 50% and 75% ethanol-extracted compounds had high molecular weight. Experiments using 75% ethanol and 100 °C showed the highest MW value of all samples. The obtained data in samples 12 and 16 show similar values compared to commercial lignins. Due to the extraction method, especially with ethanol in the solvent mixture, the contained lignin in the bark was co-extracted.
2.5. DPPH Radical Scavenging Activity of the Bark Extracts
The DPPH radical scavenging assay is commonly used to evaluate the radical scavenging activity of plants and foods [40]. The bark extracts and also bark extracts mixed with oligolignin were tested for their radical scavenging activity. All antioxidant activity indicators and IC50 data of all bark extracts are listed in Table 7.
Table 7.
DPPH radical scavenging activity of crude bark extracts and bark extracts mixed 1:1 with oligolignin (measurements performed three times) E = ethanol in % (v/v), T = temperature, p = pressure (bar).
As indicated by Table 7, the hot-water bark extracts exhibited low scavenging activity for the DPPH free radical. In contrast, all ethanol/water extracts exhibited DPPH radical scavenging effects, with a higher effect at lower temperatures. Particularly high scavenging activity was observed for the 50:50 and 75:25 ethanol/water extracts. The addition of organosolv lignin enhanced the antioxidant activity of the samples. The oligolignin was prepared by alkaline depolymerisation as detailly described by Süss et al. [9]. During this degradation process, the lignin bondings, especially β-O-4, are cleaved into smaller polymers. These oligomeric fractions showed lower molecular weight and higher content of phenolic hydroxyl groups compared to the original lignin. This may lead to better antioxidant effects of these oligomeric fractions. In the present work, oligolignin was successfully used for the improvement of the antioxidant activity of the crude bark extracts, especially from the experiments with 0% and 25% of ethanol in the solvent mixture.
Aufischer et al. described a dependence of antioxidant activity on both DPPH concentration and sample concentration and introduced the Antioxidant Activity Index (AAI) to make samples comparable [19]. We have shown that both ethanol concentration and temperature have a significant influence on the antioxidant activity of the extracts obtained. The best result (AAI of 1.31) was achieved under extraction conditions that are very moderate (ethanol/water ratio of 50%, temperature of 40 °C) compared to those described in the literature. A correlation between phenolic hydroxyl groups and antioxidant activity has been reported in the literature [20]. The addition of oligolignin increased the total number of phenolic hydroxyl groups, which explains the significant increase in AAI. This may compensate for the effect of the decrease in AAI at higher temperatures, permitting more cost-effective extraction due to the increased yields under these conditions.
2.6. Oxidation Induction Time (OIT) of the Bark Extracts
The samples were analysed for their antioxidant potential in terms of their thermal oxidation behaviour. Chosen bark extracts and also bark extracts mixed with oligolignin were dissolved in Squalene and subjected to DSC. All OIT data are listed in Table 8.
Table 8.
Oxidation Induction Time of crude bark extracts and bark extracts mixed 1:1 with oligolignin (n = 2) in minutes.
Of all the samples, the raw bark extracts had very low OITs < 2 min. The bark extracts mixed with oligolignin had antioxidant activities for up to 5.50 min. This can be attributed to the higher molar mass of oligolignin compared to those of pure bark extracts. Irganox 1010, as the reference substance, exhibited the longest OIT of 25.02 min. The short OITs of the bark extracts are a result of their low molecular weights and the polar by-products they contain, such as sugar monomers. Tocháček and Kabir showed in their work that higher molecular weight and higher content of phenolic hydroxyl groups have a positive effect on OITs [34,35]. The present results correlate very well with the work of Aufischer. In addition to the DPPH analyses, the results demonstrate the high antioxidant activity of oligolignin-added bark extracts.
2.7. Fourier-Transformation-Infrared Spectroscopy (FT-IR) of the Bark Extracts
For the comparison of the samples concerning their fingerprint, all extracts and oligolignin mixed with extract were analysed by FT-IR in their fingerprint region. All spectra are shown in Figure 3 and Figure 4.
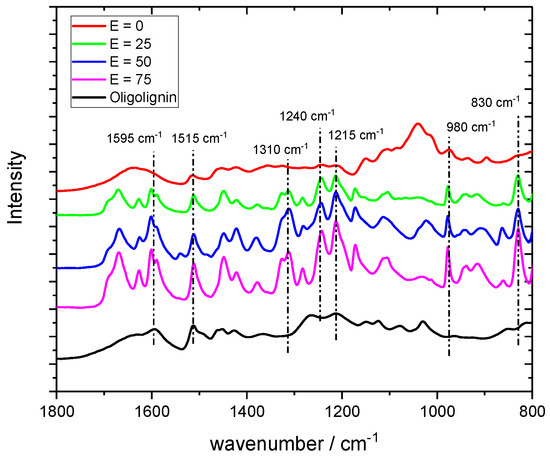
Figure 3.
FT-IR spectra of the crude bark extracts in the range 800–1800 cm−1.
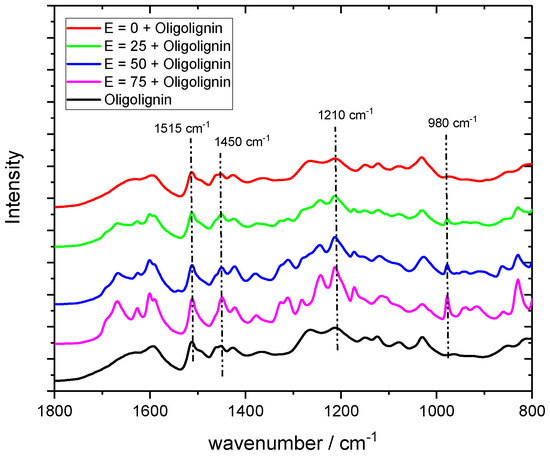
Figure 4.
FT-IR spectra of the crude bark extracts mixed 1:1 with oligolignin in the range 800–1800 cm−1.
FT-IR elucidates differences in the molecular fingerprints of the extracts. Aromatic bonds, especially 830 cm−1, 980 cm−1 and 1210 cm−1, can be found in the extracts that were obtained with ethanol. The extract obtained from only distilled water showed fewer bonds. The diagrams show that the samples mixed with oligolignin show less significant bonds than the ones only from the crude extracts. The regions between 1600 cm−1 and 1500 cm−1 are claimed for the C=C stretching vibrations of aromatic rings. The presence of peaks between 1200 cm−1 and 1350 cm−1 indicates that phenolic and anthocyanic compounds are contained in the samples. This was clearly pointed out by Marques [41].
2.8. P NMR of the Bark Extracts
All bark extracts were analysed for their hydroxyl group distributions. All results are shown in Figure 5 and Table 9.
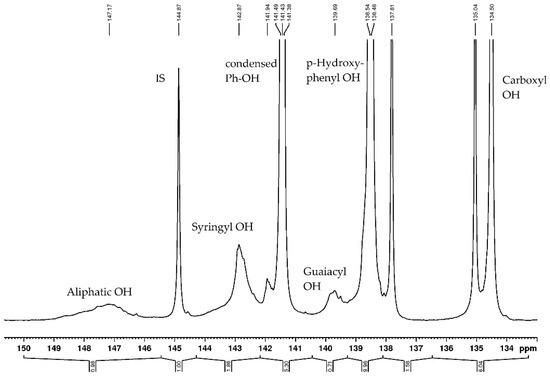
Figure 5.
31P NMR of bark extract sample (E = 50%).
Table 9.
Content of hydroxyl groups expressed in mmol/g.
In the present results, the condensed phenolic hydroxyl groups are predominant in the crude bark extracts. The condensed phenolic hydroxyl groups are in common with high total phenolic contents in Section 2.2 (Table 3). Similar ratios were also observed in the concentrations of p-Hydroxyphenyl hydroxyl groups in the bark extracts (Table 9). The content of carboxyl groups decreased with higher amounts of ethanol used in the extraction process.
3. Materials and Methods
3.1. Materials and Reagents
Spruce bark was purchased from SAPPI (Gratkorn, Austria). After drying at 90 °C, the bark was milled with a cutting mill and separated using a 1 mm sieve. Ethanol, anhydrous pyridine, aluminium chloride, sodium acetate, vanillic acid and p-hydroxybenzoic acid were obtained from Carl Roth (Karlsruhe, Germany). Bis(trimethylsilyl)-trifluoroacetamide (BSTFA), Folin-Ciocalteu reagent, ferulic acid, p-coumaric acid, cinnamic acid, o-hydroxybenzoic acid, quercetin and gallic acid were purchased from Sigma (Taufkirchen, Germany). Glucose, mannose, galactose, arabinose, and xylose were acquired from Alfa Aesar (Karlsruhe, Germany).
3.2. Extraction Method
Organosolv extraction was performed in a PARR 4560 autoclave with a volume of 450 mL (PARR Germany Frankfurt/Main, Germany). The set-up enabled monitoring of time, temperature, pressure, heating, and stirring velocity. Extractions were performed with a solid/liquid ratio of 1:20. In each case, 5 g of spruce bark was examined with specified solvent mixtures of ethanol/water: 0% (v/v), 25% (v/v), 50% (v/v) and 75% (v/v). The stirring was kept at 400 rpm. The extraction time was 2 h for all experiments, and the temperature was set to 40, 60, 80 and 100 °C. All extraction conditions were set to mimic ethanol-water pretreatments of bark in the biorefinery industry with Organosolv media.
Each experiment was conducted three times. After extraction, the crude suspension was filtered through a funnel with porosity 3. Residual bark was dried at 90 °C for 1.5 h, and analysed gravimetrically.
3.3. Determination of Extractives Yield
The yield of extractives (YE, %) in each experiment was determined by drying the bark samples at 105 °C to a constant weight. The results are expressed according to Strizincova et al. based on the dry matter weighed before and after extraction [21]:
where mi is the dry mass (g) of the bark before extraction and mj is the mass (g) of the bark after extraction and drying.
YE (%) = 100 × (mi − mj)/mi,
3.4. Determination of Chemical Composition
Ash content, acid-insoluble lignin, acid-soluble lignin and saccharides were determined according to NREL/TP-510-42618 [22,23,24]. In total, 300 mg of milled bark was suspended in 3 mL of 72 wt.% sulphuric acid at 30 °C in a heater bath. After a storage time of 1 h, 84 mL of distilled water was added to the sample tubes, which were heated to and then kept at 121 °C in an autoclave for 1 h. After cooling down, the suspension was filtered using porous crucibles. The acid-soluble lignin content was determined based on the absorbance at 215 nm wavelength. The acid-insoluble lignin (Klason lignin) content was determined gravimetrically after drying the crucibles at 105 °C (24 h). Carbohydrate monomers were quantified by High-Performance Anion Exchange Chromatography (HPAEC).
3.5. Determination of Total Phenolics Content (TPC)
1 mL of extract and 5 mL of Folin-Ciocalteu reagent were added to a 25 mL flask and dissolved with 0.1 M sodium hydroxide. In total, 10 mL of distilled water was added, and the samples were stored for 5 min for dissolution. In total, 5 mL of 20 wt.% sodium carbonate (Na2CO3) solution was added to the 50 mL flask containing the sample solution, which was then filled up with distilled water. Sample solutions were then stored for 2 h at room temperature and mixed every 20 min. The total phenolic content was determined based on the absorbance at 760 nm wavelength in polystyrene cuvettes, as described by Talmaciu et al. [32]. All UV/VIS measurements were performed twice on a Thermo Scientific Multiscan Go Spectrophotometer. In total, 10 mg of gallic acid was dissolved in a 50 mL flask of distilled water and used as a calibration substance. A 5-point calibration line of 10, 20, 40, 100 and 200 mg L−1 was used for quantification.
3.6. Determination of Total Flavonoid Content (TFC)
The TFC was determined as described in the literature [32]. In total, 5 mL of extracts and 15 mL of 96 wt.% ethanol were added into a 50 mL flask. After 10 min of dissolution time, 1 mL of aluminium(III) chloride-ethanol with a ratio of 10 wt.% (w/v) and 1 mL of 0.1 M sodium acetate solution was added to the sample. The flask was filled up with distilled water. The sample solution was stored for 2 h at room temperature. The total flavonoid content was determined in two parallel measurements based on the absorbance at 415 nm wavelength in polystyrene cuvettes. In total, 5 mg quercetin in a 50 mL flask was used as the standard solution at different dilutions (10, 25, 50, 75, 100 mg L−1) to produce a calibration curve.
3.7. Determination of Total Tannin Content (TTC)
To 1 mL of extract, 0.5 mL of Folin-Ciocalteu reagent was added in a 25 mL flask. In total, 1 mL of 20 wt.% Na2CO3 solution was added, and the flask was filled up with distilled water. After incubation for 2 h, the absorbance of the solution at 760 nm was measured three times. The TTC was determined using a calibration curve obtained with tannic acid (TA) in standard concentrations of 10, 20, 50, 100, and 200 mg L−1. Results were expressed in milligrams of tannic acid per gram of dry bark in accordance with the literature [32].
3.8. Determination of Saccharide’s Content
All liquid samples were diluted 1:100, and the saccharides contained were quantified by HPAEC with pulsed amperometric detection (HPAEC-PAD). All measurements were performed on a Dionex 5000+ (ThermoFisher Scientific, Waltham, MA) equipped with a CarboPac20 column (particle size = 6 µm, pore size ≤ 10 Å, crosslinking = 55%, ion exchange capacity = 65 µeq) and a VWD detector. A total of 1.5 mM NaOH was used as solvent A and 200 mM NaOH was used as solvent B. The flow rate was set isocratically with 0.8 mL min−1 of solvent ratio A/B = 80:20. Saccharides were quantified by a 5-point calibration. Each sample was measured three times, and the standard deviation was below 5%.
3.9. GC-MS Determination of Phenolic Compounds
200 µL of extract was pipetted into a 1.5 mL GC vial and subjected to lyophilisation at −54 °C for 48 h. In total, 900 µL of anhydrous pyridine was added to the sample and kept under 70 °C for 1 h. The sample was cooled down to room temperature, 100 µL BSTFA was added for derivatisation, and the mixture was heated to 70 °C for 1 h. After cooling down, samples were separated by gas chromatography and identified by mass spectrometry. GC-MS measurements were conducted on a Shimadzu QP2010 gas chromatograph coupled with a Shimadzu QP2020 Dual Stage Mass Spectrometer. An HP5-MS column (60 m length × 0.25 mm inner diameter × 0.25 µm film thickness; J&W Scientific, Folsom, CA, USA) was used. The injection port was operated under the following conditions: split injection, constant column flow: 1.2 mL min−1 with helium carrier gas, purge flow: 3.0 mL min−1, split ratio: 1:10, total flow: 15.2 mL min−1; injector temperature: 250 °C constant. Column temperature gradient profile: 50 °C (15 min), followed by 5 °C min−1 to 300 °C (5 min). The mass-spectrometric detector was operated in EI mode (70 eV ionisation energy at 1.13 × 10⁻⁷ Pa). Ion source temperature: 200 °C, transfer line: 250 °C. Data was acquired in Scan mode ranging from 45 to 500 m/z. A total of 1 µL aliquots were injected by an AOC 6000 autosampler. The NIST/Wiley 2014 database was used for compound identification. The method was described in detail by Liftinger [42].
3.10. DPPH Radical Scavenging Activity
The DPPH radical scavenging activity was determined according to the literature [19]. For the DPPH stock solution, 50 mg of DPPH was dissolved in absolute ethanol. Crude bark extracts were diluted in dimethyl sulfoxide (DMSO) using solutions of 2.0 g L−1, 1.0 g L−1, 0.5 g L−1, 0.25 g L−1 and 0.125 g L−1. In total, 100 µL of the samples and 3900 µL of the DPPH stock solution were added to 10 mL screw-cap vials. The vials were closed and stored for 90 min incubation time at room temperature. Absorption of the samples was determined at 517 nm wavelength. All measurements were performed three times. AA, AAI, and IC50 were calculated according to Aufischer et al. [19].
The antioxidant activity index (AAI) was calculated according to
where IC50 is the half-maximal inhibitory concentration.
3.11. Antioxidant Activity by OIT-DSC
Oxidation induction time differential scanning calorimetry (OIT-DSC) was used to characterise bark extracts, oligolignin and Irganox 1010, according to the works of Aufischer. A stock solution of each substance was prepared by dissolving it in EtAc at a concentration of 30.0 g L−1. In total, 100 µL of each stock solution was added to 3.00 g squalane and homogenised in an ultrasonic bath. Pristine squalane and each squalane spiked with the stock solution were transferred to a Tzero pan and analysed with a DSC TA Instrument Q20. In total, 20 mg of sample material were weighed into-gold crucibles. All samples were heated from 25 °C to 190 °C using 10 °C. min−1 as heating rate. After 5 min of 190 °C, the nitrogen (flow rate = 50 mL·min−1) was switched to oxygen (50 mL·min−1). Heat and oxygen flow were constantly kept for 100 min.
3.12. Molecular Weight Distribution
All samples were analysed for their molecular weight by Size Exclusion Chromatography. A total of 1 mg lignin sample is dissolved in 0.1 M NaOH and filtered through a 0.45 µm syringe filter. Polystyrene standards are prepared the same way.
Molar mass distributions of the lignin samples were performed on a Thermo Fisher Dionex ICS 5000+. The chromatographic system consists of a pre-column PSS MCX Guard 50 × 8 mm and three analytical (PSS Analytical 100 A, 300 × 8 mm; PSS Analytical 1000 A, 300 × 8 mm; PSS Analytical 100,000 A, 300 × 8 mm) columns. The UV detector used is a VWD detector with 280 nm as the standard wavelength. Molar mass calibrations are carried out using Polystyrene standards (Mw= 1000 g/mol, Mw= 3400 g/mol, Mw= 10,000 g/mol, Mw= 80,000 g/mol, Mw= 140,000 g/mol).
3.13. Fourier Transformation—Infrared Spectroscopy (FT-IR)
FT-IR spectra of all samples were recorded on a Bruker Vertex 70 infrared spectrometer equipped with a Pike Technologies monolithic diamond ATR. For each spectra, a resolution of 4 cm−1 and a measurement time of 32 scans with a wavenumber range of 4000 cm−1 to 600 cm−1 were used.
3.14. P NMR of Bark Extracts
40 mg of accurately weighted freeze-dried bark extracts were transferred into a sample vial, dissolved in 400 µL of pyridine and deuterated chloroform (1.6:1, v/v) and left at room temperature overnight with continuous stirring. Cholesterol (200 µL, 19 mg/mL) and chromium (III) acetylacetonate (50 µL, 11.4 mg/mL) were used as internal standard (IS) and relaxation reagents, respectively. After 2 h, 100 µL of phosphitylating reagent II (2-chloro-4,4,5,5-tetramethyl-1,3,2-dioxaphospholane) was added, and the mixture was transferred into a 5-mm-OD NMR tube. All measurements were performed at a Bruker 300 MHz NMR spectrometer, including the following conditions: relaxation delay = 10 s, pulsewidth = 4 us, pulseprogram = zgig (inverse gated), acquisition time = 1 s, Fid resolution = 0.5 Hz, temperature = 298 K, Offset = 153 ppm.
4. Conclusions
This study investigated a new approach to optimal conditions for extracting antioxidant constituents from Picea abies bark in biorefineries. The bark extracts were obtained under very mild conditions using environmentally friendly extraction agents. Phenolic compounds and by-products were identified and quantified in the crude bark extracts with gallic acid concentrations between 0.89 mg/g bark extract and 18.99 mg/g bark extract. Suitable choices of ethanol/water solvent ratio = 50:50 and temperatures until 100 °C minimised the number of by-products. The addition of oligolignin was effective in offsetting the decrease in antioxidant activity at higher extraction temperatures resulting in AAI = 1.55. This initial work provides a good overview of the possible yields of phenolic components from bark waste. Beyond that, however, further studies will be carried out in a follow-up project, as some factors regarding upscaling, such as cost efficiency or process optimisation, were still considered in the current study. In this context, attention will also be paid to statistical parameters. Since the addition of oligolignin enhanced the antioxidant activity of the bark extracts, we recommend their further investigation in the context of biorefinery development.
Supplementary Materials
The following supporting information can be downloaded at: https://www.mdpi.com/article/10.3390/pr11072145/s1, Figure S1: GC-MS chromatograms of all bark extracts; Table S1: Carbohydrate monomers content in % (w/w) in the freeze-dried extracts.
Author Contributions
Conceptualisation, design of the work, discussion and supervision, B.K., C.P. and I.Š.; writing—original draft preparation, I.Š., B.K. and F.Z.; data curation, F.Z., R.N., R.S., P.S., K.H. and A.L.; writing—review and editing, I.Š., C.P., B.K. and R.S.; project administration, B.K., I.Š. and R.F.P.; funding acquisition, I.Š. and R.F.P. All authors have read and agreed to the published version of the manuscript.
Funding
The authors would like to acknowledge the support of the Slovak Research and Development Agency (SRDA), grants APVV-14-0393 and APVV-22-0388, the Austrian Research Promotion Agency (FFG), Grant Number 844608, the Operational program Integrated Infrastructure within the project: Demand-driven research for the sustainable and innovative food, Drive4SIFood 313011V336, co-financed by the European Regional Development Fund and European Regional Development Fund (ERDF) with project Techbikom ATCZ287.
Institutional Review Board Statement
Not applicable.
Informed Consent Statement
Not applicable.
Data Availability Statement
Not applicable.
Acknowledgments
Authors would like to acknowledge Aleš Ház and Pascal Olschowski for technical support.
Conflicts of Interest
The authors declare no conflict of interest. The funders had no role in the design of this study; in the collection, analyses, or interpretation of data; in the writing of the manuscript, or in the decision to publish the results.
Abbreviations
Ara: Arabinose; BSTFA, Bis(trimethylsilyl)-trifluoro-acetamide; dm, dry matter; EtOH, Ethanol; GAE, Gallic Acid Equivalent; Gal, Galactose; GC, Gas chromatography; Glu, Glucose; HPAEC, High-Performance Anion Exchange Chromatography; Man, Mannose; MS, Mass spectrometry; NREL, National Renewable Energy Laboratory of the U.S. Department of Energy; PAD, Pulsed Amperometric Detection; QE, Quercetin Equivalent; RT, Retention time; S/L ratio, solid/liquid ratio, TFC, Total Flavonoid Content; TPC, Total Phenolic Content; TTC, Total Tannin Content; wt., weight; Xyl, Xylose, O-Lignin, Organosolv Lignin.
References
- Pham, T.P.T.; Cho, C.-W.; Yun, Y.-S. Environmental fate and toxicity of ionic liquids: A review. Water Res. 2010, 44, 352–372. [Google Scholar] [CrossRef]
- Kamm, B.; Gruber, P.R.; Kamm, M. Biorefineries-Industrial Processes and Products. In Ullmann’s Encyclopedia of Industrial Chemistry; Wiley-VCH: Weinheim, Germany, 2016; pp. 1–38. [Google Scholar]
- Sillero, L.; Prado, R.; Welton, T.; Labidi, J. Energy and environmental analysis of flavonoids extraction from bark using alternative solvents. J. Clean. Prod. 2021, 308, 127286. [Google Scholar] [CrossRef]
- Sládková, A.; Stopka, J.; Ház, A.; Strižincová, P.; Šurina, I.; Kreps, F.; Burčová, Z.; Jablonský, M. Microwave-assisted Extraction of Spruce Bark: Statistical Optimization Using Box-Behnken Design. BioResources 2018, 13, 8993–9004. [Google Scholar] [CrossRef]
- FAO; ITTO; United Nation. Forest Product Conversion Factors; Food and Agriculture Organization of the United Nations: Rome, Italy, 2020; ISBN 9251322473. [Google Scholar]
- Bianchi, S.; Kroslakova, I.; Janzon, R.; Mayer, I.; Saake, B.; Pichelin, F. Characterization of condensed tannins and carbohydrates in hot water bark extracts of European softwood species. Phytochemistry 2015, 120, 53–61. [Google Scholar] [CrossRef]
- Jablonsky, M.; Nosalova, J.; Sladkova, A.; Haz, A.; Kreps, F.; Valka, J.; Miertus, S.; Frecer, V.; Ondrejovic, M.; Sima, J.; et al. Valorisation of softwood bark through extraction of utilizable chemicals. A review. Biotechnol. Adv. 2017, 35, 726–750. [Google Scholar] [CrossRef] [PubMed]
- UNO. Transforming our World: The 2030 Agenda for Sustainable Development: A/RES/70/1; Uno: New York, NY, USA, 2015; Available online: https://sustainabledevelopment.un.org/content/documents/21252030%20Agenda%20for%20Sustainable%20Development%20web.pdf (accessed on 7 May 2020).
- Süss, R.; Kamm, B.; Arnezeder, D.; Zeilerbauer, L.; Paulik, C. Homogeneously catalyzed depolymerization of lignin from organosolv medium: Characterization, optimization, and minimization of coke formation. Can. J. Chem. Eng. 2022, 100, S38–S48. [Google Scholar] [CrossRef]
- García-Pérez, M.-E.; Royer, M.; Duque-Fernandez, A.; Diouf, P.N.; Stevanovic, T.; Pouliot, R. Antioxidant, toxicological and antiproliferative properties of Canadian polyphenolic extracts on normal and psoriatic keratinocytes. J. Ethnopharmacol. 2010, 132, 251–258. [Google Scholar] [CrossRef] [PubMed]
- Fridén, M.E.; Jumaah, F.; Gustavsson, C.; Enmark, M.; Fornstedt, T.; Turner, C.; Sjöberg, P.J.R.; Samuelsson, J. Evaluation and analysis of environmentally sustainable methodologies for extraction of betulin from birch bark with a focus on industrial feasibility. Green Chem. 2016, 18, 516–523. [Google Scholar] [CrossRef]
- Le Normand, M.; Moriana, R.; Ek, M. The bark biorefinery: A side-stream of the forest industry converted into nanocomposites with high oxygen-barrier properties. Cellulose 2014, 21, 4583–4594. [Google Scholar] [CrossRef]
- Co, M.; Fagerlund, A.; Engman, L.; Sunnerheim, K.; Sjöberg, P.J.R.; Turner, C. Extraction of antioxidants from spruce (Picea abies) bark using eco-friendly solvents. Phytochem. Anal. 2012, 23, 1–11. [Google Scholar] [CrossRef]
- Burčová, Z.; Kreps, F.; Greifová, M.; Jablonský, M.; Ház, A.; Schmidt, Š.; Šurina, I. Antibacterial and antifungal activity of phytosterols and methyl dehydroabietate of Norway spruce bark extracts. J. Biotechnol. 2018, 282, 18–24. [Google Scholar] [CrossRef]
- Jablonsky, M.; Majova, V.; Strizincova, P.; Sima, J.; Jablonsky, J. Investigation of Total Phenolic Content and Antioxidant Activities of Spruce Bark Extracts Isolated by Deep Eutectic Solvents. Crystals 2020, 10, 402. [Google Scholar] [CrossRef]
- Spinelli, S.; Costa, C.; Conte, A.; La Porta, N.; Padalino, L.; Del Nobile, M.A. Bioactive Compounds from Norway Spruce Bark: Comparison Among Sustainable Extraction Techniques for Potential Food Applications. Foods 2019, 8, 524. [Google Scholar] [CrossRef]
- Coșarcă, S.-L.; Moacă, E.-A.; Tanase, C.; Muntean, D.L.; Pavel, I.Z.; Dehelean, C.A. Spruce and beech bark aqueous extracts: Source of polyphenols, tannins and antioxidants correlated to in vitro antitumor potential on two different cell lines. Wood Sci. Technol. 2019, 53, 313–333. [Google Scholar] [CrossRef]
- Francezon, N.; Stevanovic, T. Integrated process for the production of natural extracts from black spruce bark. Ind. Crops Prod. 2017, 108, 348–354. [Google Scholar] [CrossRef]
- Aufischer, G.; Süss, R.; Kamm, B.; Paulik, C. Depolymerisation of kraft lignin to obtain high value-added products: Antioxidants and UV absorbers. Holzforschung 2022, 76, 845–852. [Google Scholar] [CrossRef]
- Alzagameem, A.; Khaldi-Hansen, B.E.; Büchner, D.; Larkins, M.; Kamm, B.; Witzleben, S.; Schulze, M. Lignocellulosic Biomass as Source for Lignin-Based Environmentally Benign Antioxidants. Molecules 2018, 23, 2664. [Google Scholar] [CrossRef]
- Strižincová, P.; Ház, A.; Burčová, Z.; Feranc, J.; Kreps, F.; Šurina, I.; Jablonský, M. Spruce Bark-A Source of Polyphenolic Compounds: Optimizing the Operating Conditions of Supercritical Carbon Dioxide Extraction. Molecules 2019, 24, 4049. [Google Scholar] [CrossRef]
- Sluiter, A.; Hames, B.; Hyman, D.; Payne, C.; Ruiz, R.; Scarlata, C.; Sluiter, J.; Templeton, D.; Wolfe, J. Determination of Total Solids in Biomass and Total Dissolved Solids in Liquid Process Samples: Laboratory Analytical Procedure (LAP) Issue Date: 3/31/2008; Technical Report NREL/TP-510-42621; National Renewable Energy Laboratory: Golden, CO, USA, 2008. [Google Scholar]
- Sluiter, A.; Hames, B.; Ruiz, R.; Scarlata, C.; Sluiter, J.; Templeton, D. Determination of Ash in Biomass: Laboratory Analytical Procedure (LAP) Issue Date: 7/17/2005; Technical Report NREL/TP-510-42622; National Renewable Energy Laboratory: Golden, CO, USA, 2008. [Google Scholar]
- Sluiter, A.; Hames, B.; Ruiz, R.; Scarlata, C.; Sluiter, J.; Templeton, D.; Crocker, D. Determination of Structural Carbohydrates and Lignin in Biomass: Laboratory Analytical Procedure (LAP)Issue Date: April 2008 Revision Date: August 2012 (Version 08-03-2012); Technical ReportNREL/TP-510-42618; National Renewable Energy Laboratory: Golden, CO, USA, 2012. [Google Scholar]
- Le Normand, M.; Mélida, H.; Holmbom, B.; Michaelsen, T.E.; Inngjerdingen, M.; Bulone, V.; Paulsen, B.S.; Ek, M. Hot-water extracts from the inner bark of Norway spruce with immunomodulating activities. Carbohydr. Polym. 2014, 101, 699–704. [Google Scholar] [CrossRef]
- Neiva, D.M.; Luís, Â.; Gominho, J.; Domingues, F.; Duarte, A.P.; Pereira, H. Bark residues valorization potential regarding antioxidant and antimicrobial extracts. Wood Sci. Technol. 2020, 54, 559–585. [Google Scholar] [CrossRef]
- Välimaa, A.-L.; Raitanen, J.-E.; Tienaho, J.; Sarjala, T.; Nakayama, E.; Korpinen, R.; Mäkinen, S.; Eklund, P.; Willför, S.; Jyske, T. Enhancement of Norway spruce bark side-streams: Modification of bioactive and protective properties of stilbenoid-rich extracts by UVA-irradiation. Ind. Crops Prod. 2020, 145, 112150. [Google Scholar] [CrossRef]
- Gabaston, J.; Richard, T.; Biais, B.; Waffo-Teguo, P.; Pedrot, E.; Jourdes, M.; Corio-Costet, M.-F.; Mérillon, J.-M. Stilbenes from common spruce (Picea abies) bark as natural antifungal agent against downy mildew (Plasmopara viticola). Ind. Crops Prod. 2017, 103, 267–273. [Google Scholar] [CrossRef]
- St-Pierre, A.; Blondeau, D.; Bourdeau, N.; Bley, J.; Desgagné-Penix, I. Chemical Composition of Black Spruce (Picea mariana) Bark Extracts and Their Potential as Natural Disinfectant. Ind. Biotechnol. 2019, 15, 219–231. [Google Scholar] [CrossRef]
- Kilpeläinen, P.; Leppänen, K.; Spetz, P.; Kitunen, V.; Ilvesniemi, H.; Pranovich, A.; Willför, S. BIOREFINERY. Pressurised hot water extraction of acetylated xylan from birch sawdust. Nord. Pulp Pap. Res. J. 2012, 27, 680–688. [Google Scholar] [CrossRef]
- Ghitescu, R.-E.; Volf, I.; Carausu, C.; Bühlmann, A.-M.; Gilca, I.A.; Popa, V.I. Optimization of ultrasound-assisted extraction of polyphenols from spruce wood bark. Ultrason. Sonochem. 2015, 22, 535–541. [Google Scholar] [CrossRef]
- Talmaciu, A.I.; Ravber, M.; Volf, I.; Knez, Ž.; Popa, V.I. Isolation of bioactive compounds from spruce bark waste using sub- and supercritical fluids. J. Supercrit. Fluids 2016, 117, 243–251. [Google Scholar] [CrossRef]
- Le Normand, M.; Edlund, U.; Holmbom, B.; Ek, M. Hot-water extraction and characterization of spruce bark non-cellulosic polysaccharides. Nord. Pulp Pap. Res. J. 2012, 27, 18–23. [Google Scholar] [CrossRef]
- Legault, J.; Girard-Lalancette, K.; Dufour, D.; Pichette, A. Antioxidant Potential of Bark Extracts from Boreal Forest Conifers. Antioxidants 2013, 2, 77–89. [Google Scholar] [CrossRef]
- Zhong, W.; Wang, D.; Xu, X.; Wang, B.; Luo, Q.; Senthil Kumaran, S.; Wang, Z. A gas chromatography/mass spectrometry method for the simultaneous analysis of 50 phenols in wastewater using deconvolution technology. Chin. Sci. Bull. 2011, 56, 275–284. [Google Scholar] [CrossRef]
- Rohloff, J. Analysis of phenolic and cyclic compounds in plants using derivatization techniques in combination with GC-MS-based metabolite profiling. Molecules 2015, 20, 3431–3462. [Google Scholar] [CrossRef]
- Lazar, L.; Talmaciu, A.I.; Volf, I.; Popa, V.I. Kinetic modeling of the ultrasound-assisted extraction of polyphenols from Picea abies bark. Ultrason. Sonochem. 2016, 32, 191–197. [Google Scholar] [CrossRef] [PubMed]
- Antolovich, M.; Bedgood, D.R.; Bishop, A.G.; Jardine, D.; Prenzler, P.D.; Robards, K. LC-MS investigation of oxidation products of phenolic antioxidants. J. Agric. Food Chem. 2004, 52, 962–971. [Google Scholar] [CrossRef] [PubMed]
- Aguiar, A.; Ferraz, A. Effect of aqueous extracts from Ceriporiopsis subvermispora-biotreated wood on the decolorization of Azure B by Fenton-like reactions. Int. Biodeterior. Biodegrad. 2012, 74, 61–66. [Google Scholar] [CrossRef]
- Hubert, J.; Angelis, A.; Aligiannis, N.; Rosalia, M.; Abedini, A.; Bakiri, A.; Reynaud, R.; Nuzillard, J.-M.; Gangloff, S.C.; Skaltsounis, A.-L.; et al. In Vitro Dermo-Cosmetic Evaluation of Bark Extracts from Common Temperate Trees. Planta Med. 2016, 82, 1351–1358. [Google Scholar] [CrossRef] [PubMed]
- Marques, S.R.R.; Azevêdo, T.K.B.; de Castilho, A.R.F.; Braga, R.M.; Pimenta, A.S. Extraction, quantification, and ftir characterization of bark tannins of four forest species grown in northeast brazil. Rev. Árvore 2021, 45. [Google Scholar] [CrossRef]
- Liftinger, E.; Zweckmair, T.; Schild, G.; Eilenberger, G.; Böhmdorfer, S.; Rosenau, T.; Potthast, A. Analysis of degradation products in rayon spinning baths. Holzforschung 2015, 69, 695–702. [Google Scholar] [CrossRef]


Disclaimer/Publisher’s Note: The statements, opinions and data contained in all publications are solely those of the individual author(s) and contributor(s) and not of MDPI and/or the editor(s). MDPI and/or the editor(s) disclaim responsibility for any injury to people or property resulting from any ideas, methods, instructions or products referred to in the content. |
© 2023 by the authors. Licensee MDPI, Basel, Switzerland. This article is an open access article distributed under the terms and conditions of the Creative Commons Attribution (CC BY) license (https://creativecommons.org/licenses/by/4.0/).