Abstract
Flavonoids are one of the most essential compounds in various plants. This study used the cellulase-assisted method to extract flavonoid-enriched antioxidants from Equisetum arvense L. (EAL). According to a three-factor and three-level central composite design, the response surface methodology was used to obtain the maximum total flavonoid yield, thereby providing the most potent antioxidant activity of EAL extracts. The results indicated that the optimal condition for the total flavonoid extraction was 0.52% (base substrate) enzyme concentration and enzymolysis for 50.58 min at 49.03 °C. The extraction rate of flavonoids from horsetail reached 4.88 mg/g under these optimal conditions. The yield was 51.23% higher than that from the traditional solid–liquid extraction method. The highest DPPH-scavenging ability of the extracts obtained under 0.50% enzyme concentration and enzymolysis for 49.41 min at 46.59 °C was 77.36%. HPLC results revealed that the antioxidant substances had diverse flavonoids. Thus, the extraction condition was consistent for antioxidant activity and total flavonoids. Therefore, the current study provided an efficient method to extract flavonoid compounds from EAL, facilitating technical support for utilizing the plant.
1. Introduction
Horsetail (Equisetum arvense L. [EAL]) is a nonflowering perennial plant distributed in China, North America, Europe, South America, Japan [1], and other regions. Horsetail has a long history of medicinal use as herbal medicine in China. According to the “Materia Medica Collection” and “Sichuan Traditional Chinese Medicine Annals”, horsetail can stop bleeding and diuresis as well as improve eyesight [2,3]. Numerous studies have revealed many bioactive substances in horsetail, such as flavonoids, saponins, silicates, and polysaccharides [4]. Modern pharmacological studies have confirmed that horsetail extract possesses good anti-inflammatory [5], antibacterial [6], hepatoprotective [7], antihypertensive [8], and antioxidant activities [9]. Clinical trials have indicated that EAL can be used for treating chronic musculoskeletal pain and brittle nail syndrome and possess a wound-healing effect [10]. EAL is a traditional and popular drug whose extraction is yet to be fully researched.
EAL is rich in flavonoids and might be useful for the development of anticancer, anti-aging, antioxidant, hair-regenerative, and anti-inflammatory agents [11,12,13]. As the main antioxidative compounds, flavonoids are important secondary metabolites in various plants. Flavonoid compounds have been widely used as health care food, medicine, and cosmetics owing to their significant antioxidant, antibacterial, and anti-inflammatory effects [14,15]. Using traditional extraction methods, scientific data have revealed the presence of 0.6–0.9% flavonoids in EAL [16]. Traditional extraction methods such as ethanol reflux extraction and hot water extraction are time-consuming, inefficient, and require a relatively large amount of solvents without effectively extracting the flavonoids. Microwave-assisted extraction, ultrasound-assisted extraction, supercritical fluid extraction, accelerated solvent extraction, and cellulase-assisted extraction show significant efficiency in extracting total flavonoids from plants. Among them, cellulase-assisted extraction has mild conditions, simple operation, high extraction efficiency, and simple industrial application [17,18]. Cellulase enzyme-assisted extractions can significantly improve the extraction efficiency of various plant components, such as polyphenols [19], polysaccharides [17,19], and flavonoids [20].
This study developed an optimal extraction process through a single-factor test and response surface optimization depending on the antioxidant activity. The process could provide an experimental basis for developing and utilizing EAL in pharmaceutical, food, cosmetic, and various other industries.
2. Materials and Methods
2.1. Materials and Chemicals
EAL was purchased from An Guo Jiu Guang Medicinal herb store and ground into powder. Standard rutin, quercetin, kaempferol, luteolin, apigenin, and cellulase were procured from Shanghai Yuanye Bio-Technology Co., Ltd. (Shanghai, China). 2,2-Diphenyl-1-picrylhydrazyl (DPPH) was obtained from TCI Development Co. (Shanghai, China). Analytical grade AlCl3, HAc, NaAC, and other chemicals were purchased from Kelong (Chengdu, China).
2.2. Single Factor Experimental Method for Cellulase-Assisted Extraction of Total Flavonoids from EAL
The optimal extraction parameters were determined using the preliminary single-factor experiment to investigate the cellulase treatment effects on the extraction rate of flavonoids and antioxidant activity under various conditions. A single-factor experiment helped determine the parameters of enzyme concentration (0.2–0.7%), enzyme hydrolysis time (30–80 min), extraction temperature (35–60 °C), liquid-to-solid ratio (5:1–0:1), and ethanol concentration (40–90%). One parameter was selected at one time for adjustment, and the tests were conducted sequentially. In brief, 50 g of EAL powder was weighed each time to prepare the extract, and it was diluted using an extraction solution with a crude drug ratio of 0.1 g/mL for antioxidant and flavonoid content detection. The extraction efficiency was optimized through the flavonoid yield.
2.3. Optimization of the Total Flavonoid Extraction Process via Response Surface Methodology (RSM)
Based on the single-factor experiment, the three factors, including enzyme concentration (X1, %), enzyme hydrolysis time (X2, min), and enzyme temperature (X3, °C), were considered independent variables. The response variables were as follows: the total flavonoid content (Y1), DPPH radical-scavenging activity (Y2), and hydroxyl radical-scavenging activity (Y3). As indicated in Table 1, a CCD of RSM (Design Expert Software, Version 8.0.6, Stat-Ease, Inc., Minneapolis, MN, USA) helped optimize the extraction conditions.

Table 1.
Values of the independent variables and RSM levels.
Based on the software design, the three independent variables (X1, X2, and X3) were coded at +1, 0, and −1 levels for high, medium, and low values, respectively. The complete design had 20 experimental runs with 6 central points. The three variables were coded as follows:
where Xi is the coded value for the independent variable; xi is the actual value of the variable; and is the step change. We analyzed the data of the CCRD experiments and fit them to the second-order polynomial model, including linear, quadratic, and interaction. The following second-order equation of the nonlinear multiple regression quadratic model was used:
where Y is the response variable; β0 is the constant; Xi and Xj are coded independent variables; and β, βii, and βij are the linear, quadratic, and interaction, respectively. The adequacy and statistical significance of the models were assessed using regression analysis (R2), analysis of variance (ANOVA) (p < 0.05), and the response surface. The optimal conditions provided the best yield after purification.
2.4. Determination of Total Flavonoid Content (TFC)
TFC in different extracts was determined based on a colorimetric method [21]. A total of 250 μL of extract (0.10 mg/mL) was added into a 10 mL volumetric flask. The extract was mixed with 2 mL AlCl3 (0.1 mol/L) and 2 mL HAc-NaAc buffer solution (pH 5.5), diluted to the scale with 60% ethanol, mixed well, and reacted for 20 min. Finally, the absorbance value was measured at 427 nm. The standard curve y = 58.606x + 0.0031 (y is the absorbance value of the sample and x is the sample concentration) ranged from 0 to 0.012 mg/mL (R2 = 0.9999) was used to determine the flavonoid concentration on a UV-2000 spectrophotometer (Shimadzu Corporation, Kyoto, Japan).
2.5. Purification of Total Flavonoids Using D101 Macroporous Resin
The total flavonoids of horsetail were purified from the crude extracts using the macroporous resin D101. The purification conditions were as follows: sample concentration of extract—2.5 mg/mL in ethanol; adsorption material to liquid ratio—10:1; eluent—85% ethanol; rest time—60 min; and amount of eluent—2 bed volumes. We determined the concentration and volume of total flavonoids in the eluent. A rotary evaporator helped remove the eluent, and the eluate was weighed after drying to measure the yield.
2.6. Antioxidant Activity Assay
2.6.1. DPPH Radical-Scavenging Capacity Assay
The free radical-scavenging activity of the extracts was measured based on Tan’s method with minor modifications [22]. The test samples were the extraction products from the different stages of process optimization. The DPPH solution (0.2 mmol/L) was prepared in ethanol. A total of 2 mL of extract (0.1 g/mL) was mixed with 2 mL of freshly prepared DPPH solution. Ascorbic acid was used as the positive control. The mixture was kept standing in the dark for 30 min at room temperature, and the absorbance was measured at 517 nm (Varioskan flash, Thermo Scientific, Waltham, MA, USA). The radical-scavenging assay was determined with the following equation:
where As is the absorbance of DPPH solution using the test sample (2 mL sample + 2 mL DPPH); Ac is the absorbance of the sample without DPPH solution (2 mL sample + 2 mL of ethanol); and A0 is the absorbance of DPPH solution without the sample (2 mL of ethanol + 2 mL DPPH).
2.6.2. Hydroxyl Radical-Scavenging Activity Assay
The hydroxyl radical-scavenging activity assay was based on Chang’s method with minor modifications [23]. The reaction mixture contained 2 mL of the test sample, 2 mL of 6 mM FeSO4, and 2 mL of 6 mM H2O2, which were mixed for 10 min. Then, 6 mM salicylic acid (2 mL) was added, and the absorbance was read at 510 nm (Asample) after mixing for 30 min. When the H2O2 solution was replaced with double distilled water, the measured absorbance was Acontrol. Another tube was taken, and 2 mL of distilled water was added instead of the sample, followed by repeating the above process and measuring the absorbance (Ablank). The above experiments were run in parallel three times, and the average was calculated based on the following formula to determine the clearance rate. Ascorbic acid was the positive control.
2.7. HPLC Analysis of Flavonoid Compounds from EAL
HPLC was used to perform a simple qualitative analysis of the flavonoid compounds from EAL on the Agilent 1260 (Santa Clara, USA) equipped with an Agilent C18 column (4.6 × 250 mm, 5μm) and ultraviolet detector (G1314B). The mobile phase was methanol (A) and 0.2% acetic acid aqueous solution (B) at a 45:55 ratio. The injection volume was 10 μL, and the column temperature was 28 °C. The volume flow rate and detection wavelengths were 1.0 mL/min and 360 nm, respectively. Five compounds have been selected as the reference ingredients for the flavonoids, including rutin [24], quercetin [25], kaempferol [26], luteolin [27], and apigenin [27]. The standards of rutin, quercetin, kaempferol, luteolin, and apigenin were accurately weighed, and their standard working solutions were prepared with the concentrations of 13.4, 13.4, 31.4, 11.5, and 15.1 μg/mL, respectively, using methanol. EAL extract was prepared using 10 mg/mL methanol solution, filtered with a 0.22-μm microporous nylon membrane, and then evaluated.
2.8. Statistical Analysis
Statistical analyses were performed using the SPSS 25 (IBM Inc., Armonk, NY, USA, 2019) software package. Data sets were analyzed using Design-Expert Software (Version 10), and the differences were calculated at 95% (p < 0.05) or 99% (p < 0.05) confidence limits.
3. Results and Discussion
3.1. Single Factor Test
3.1.1. Enzyme Concentration
Enzyme extraction technology is becoming an alternative method to conventional technology for natural extraction because of being an efficient and eco-friendly extraction technology. Cellulose concentration is a crucial parameter that limits total flavonoid extraction, and the appropriate cellulase content helps optimize extraction efficiency [28]. The experimental data indicated that the enzyme concentration significantly affected the flavonoid yield (p < 0.05). As shown in Figure 1C, the total flavonoid yield increased with the increase in enzyme concentration of up to 0.5%. However, the yield significantly decreased when the enzyme concentration exceeded 0.5%. The DPPH radical-scavenging capacity (Figure 1B) significantly increased when the enzyme content rose from 0.2% to 0.5%. Simultaneously, hydroxyl radical-scavenging capacity (Figure 1A) rose from 0.2% to 0.6% and then dropped from 0.6%. The results indicated that the appropriate enzyme content could contribute to extracting flavonoids and antioxidants. The enzyme catalytic efficiency increased with the rising enzyme concentration (0.2% to 0.5%). Thus, it positively affected cellulose degradation in the cell wall of horsetail extracts, thereby enhancing flavonoid dissolution [17,29]. However, the interaction reached saturation when the added enzyme concentration was above 0.5%. Due to molecular competition, the transmission and release of the active ingredients were inhibited, preventing flavonoid dissolution. The data established that the optimal added enzyme concentration should be 0.5–0.6% to achieve the highest flavonoid yield and antioxidative activities, which is similar to a former report [30].
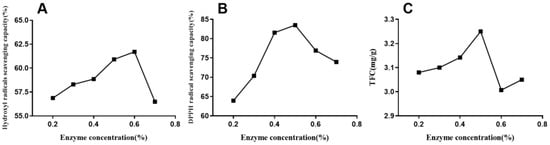
Figure 1.
Effect of enzyme concentration on DPPH (B) and hydroxyl radical (A)-scavenging capacities and total flavonoid yield (C) of EALE.
3.1.2. Enzymatic Hydrolysis Time
Different enzymatic hydrolysis times (30, 40, 50, 60, 70, and 80 min) were selected with the other conditions being enzyme concentration of 0.3%, enzyme temperature of 50 °C, liquid-to-solid ratio of 10:1 (mL/g), and ethanol concentration of 60%. As shown in Figure 2A, the extraction time significantly affected the flavonoid yield. The yield of flavonoids increased when time ranged from 30 to 50 min. Beyond 50 min, the yield decreased, possibly due to the initial extraction and increased cellular fragmentation degree under the enzymatic action. Thus, the extraction rate was increased with the increase in flavonoid secretion from the cells. The highest extraction was 3.88 mg/g at 50 min, with a significant difference at 30 min. The yield declined with the extension of time. For the radical-scavenging capacities of antioxidants, the result was similar. In Figure 2B, DPPH radical-scavenging capacity gradually increased with time, peaked at 50 min, and subsequently decreased from 50 to 80 min. Moreover, the maximum clearance rate was 50 min for hydroxyl radicals (Figure 2C). Therefore, the optimal extraction time was considered 50 min.
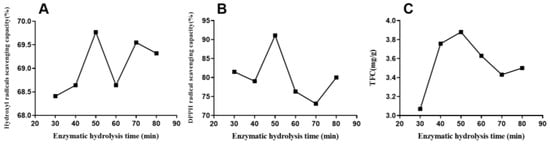
Figure 2.
Effect of enzymatic hydrolysis time on hydroxyl radical (A) and DPPH (B)-scavenging capacities and total flavonoid yield (C) of EALE.
3.1.3. Enzymatic Hydrolysis Temperature
The optimal extraction temperature was a significant variable. Temperature can affect the movement of molecules, and an optimal temperature can improve enzymatic activity. We analyzed the effect of extraction temperatures (35, 40, 45, 50, 55, and 60 °C) on enzyme activity by maintaining the extraction conditions of 0.3% enzyme concentration, hydrolysis time of 50 min, liquid–solid ratio of 1:10 (mL/g), and ethanol concentration of 60%. The results are depicted in Figure 3. As shown in Figure 3, the optimal temperature for TFC, DPPH, and hydroxyl radicals in all the selected temperature parameters were 50, 45, and 50 °C, respectively. Moreover, the maximum content and scavenging capacities were 3.4 mg per g of dry extract, 82.8%, and 67.82%, respectively. The three curves followed the law, which first increased and subsequently decreased. The molecular motion strengthened with the increase in temperature. This promoted the enzymatic reaction, accelerated flavonoid leaching, and increased the extraction rate of total flavonoids. However, the excessive temperature might degrade proteins, leading to the loss of their activities and a decrease in catalytic activities [31]. The ethanol solvent was gradually reduced, affecting the extraction. Therefore, these results indicated that the best extraction temperature should be controlled at 50 °C to get the largest TFC yield and anti-oxidative activity.
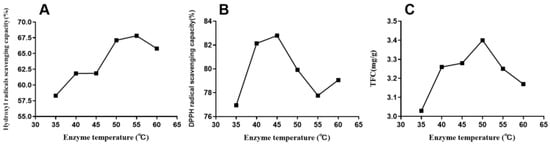
Figure 3.
Effect of enzyme hydrolysis temperature on DPPH (B) and hydroxyl radical (A)-scavenging capacities and total flavonoid yield (C) of EALE.
3.1.4. Effect of the Ratio of Liquid to Solid
Based on the balance principle of the solutes between the materials and the solvent, the extraction rate was enhanced with the solvent. The flavonoids were not extracted when the liquid–solid ratio was too small, and the energy consumption would have increased if the ratio was too large. Therefore, the effect of altering the ratio (10:1, 15:1, 20:1, 25:1, and 30:1) was investigated (Figure 4), and the remaining conditions were 0.3% enzyme concentration, 50 min extraction time, 50 °C enzyme temperature, and 60% ethanol concentration. The data from Figure 4 indicated that the yield increased when the liquid-to-solid ratio increased from 10:1 to 25:1. The TFC curve slowly increased while the scavenging capacities (DPPH and hydroxyl radicals) peaked at 25:1. This could be explained as the continuous increase in the solvent reducing the concentration of the enzyme, leading to a low substrate per unit volume. In short, the 25:1 ratio was selected as the central point of the RSM experiment.
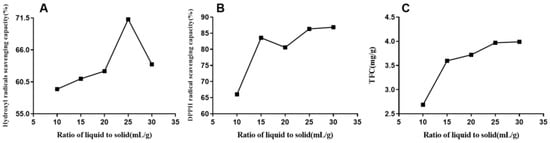
Figure 4.
Effect of liquid-to-solid ratio on DPPH (B) and hydroxyl radical (A)-scavenging capacities and total flavonoid yield (C) of EALE.
3.1.5. Ethanol Concentration
Owing to its efficiency of extraction and safety with regard to humans, ethanol has been the best choice for TFC extraction [29]. A suitable solvent mixing ratio is essential for obtaining a higher extraction rate. In Figure 5, the chosen ethanol concentrations in this single-factor experiment were 40, 50, 60, 70, 80, and 90%. The data indicated (Figure 5) that the ethanol concentration affected the extraction rate of total flavonoids from horsetail extracts. TFC was low when the concentration was less than 60%, and the extraction rate peaked in the concentration range of 60%–80%, which was consistent with many other reports [32]. By contrast, prolonged increased concentration led to the loss of extraction rate. Therefore, 70–80% concentration was chosen for the subsequent experiments.
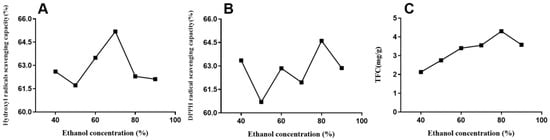
Figure 5.
Effect of ethanol concentration on DPPH (B) and hydroxyl radical (A)-scavenging capacities and total flavonoid yield (C) of EALE.
3.2. Analysis of RSM
3.2.1. Verification and Analysis of the Fitting Model
We optimized the extraction yield and radical-scavenging rate of the total flavonoids from horsetail using RSM. All experiments were randomly designed, as depicted in Table 2. The maximum TFC content was 4.98 mg/g (run 4), and the 14th combination is shown in Table 2. The highest scavenging capacities of DPPH and hydroxyl radical were 78.85% and 62.70%, respectively. Based on the multiple regression analysis of the data, the second-order polynomial equation of the independent variable was calculated as follows (where Y1, Y2, and Y3 are the response values and A, B, and C are the coded enzyme concentration values, enzyme times, and temperatures, respectively):
Y1 = 4.88 + 0.076A − 0.019B − 0.011C + 0.2AB + 0.039AC + 0.11BC − 0.2A2 − 0.22B2 − 0.32C2
Table 2.
Factors and corresponding responses with central composite design for RSM.
Table 2.
Factors and corresponding responses with central composite design for RSM.
| Run | Independent Variables | Responses | |||||||
|---|---|---|---|---|---|---|---|---|---|
| A (%) | B (min) | C (°C) | Y1 (mg/g) | Y2 (%) | Y3 (%) | ||||
| Act | Pred | Act | Pred | Act | Pred | ||||
| 1 | 0.50 | 50.00 | 50.00 | 4.91 | 4.88 | 75.68 | 76.56 | 61.55 | 62.17 |
| 2 | 0.50 | 66.82 | 50.00 | 4.21 | 4.22 | 69.10 | 69.27 | 57.89 | 57.74 |
| 3 | 0.50 | 50.00 | 50.00 | 4.81 | 4.88 | 76.70 | 76.56 | 62.70 | 62.17 |
| 4 | 0.50 | 50.00 | 50.00 | 4.98 | 4.88 | 75.13 | 76.56 | 62.09 | 62.17 |
| 5 | 0.50 | 50.00 | 58.41 | 3.97 | 3.96 | 67.99 | 68.17 | 58.38 | 58.21 |
| 6 | 0.50 | 33.18 | 50.00 | 4.31 | 4.29 | 70.78 | 70.38 | 58.73 | 58.78 |
| 7 | 0.40 | 60.00 | 55.00 | 3.89 | 3.90 | 64.56 | 64.75 | 57.45 | 57.65 |
| 8 | 0.40 | 40.00 | 45.00 | 4.42 | 4.44 | 69.93 | 70.6 | 57.82 | 57.84 |
| 9 | 0.60 | 60.00 | 45.00 | 4.25 | 4.26 | 67.64 | 68.32 | 58.32 | 58.42 |
| 10 | 0.50 | 50.00 | 50.00 | 4.83 | 4.88 | 78.85 | 76.56 | 62.50 | 62.17 |
| 11 | 0.33 | 50.00 | 50.00 | 4.17 | 4.18 | 66.87 | 67.05 | 59.11 | 58.05 |
| 12 | 0.50 | 50.00 | 41.59 | 3.99 | 3.99 | 70.34 | 69.93 | 58.94 | 59.01 |
| 13 | 0.40 | 40.00 | 55.00 | 4.13 | 4.13 | 67.54 | 67.02 | 58.85 | 58.83 |
| 14 | 0.40 | 60.00 | 45.00 | 3.81 | 3.78 | 70.05 | 69.54 | 58.23 | 58.19 |
| 15 | 0.60 | 60.00 | 55.00 | 4.54 | 4.53 | 70.32 | 69.80 | 56.42 | 56.48 |
| 16 | 0.60 | 40.00 | 45.00 | 4.11 | 4.11 | 67.39 | 67.36 | 58.60 | 58.47 |
| 17 | 0.50 | 50.00 | 50.00 | 4.86 | 4.88 | 75.83 | 76.56 | 62.57 | 62.17 |
| 18 | 0.67 | 50.00 | 50.00 | 4.45 | 4.43 | 68.97 | 68.57 | 57.65 | 57.60 |
| 19 | 0.60 | 40.00 | 55.00 | 3.92 | 3.95 | 69.39 | 70.06 | 57.95 | 58.06 |
| 20 | 0.50 | 50.00 | 50.00 | 4.90 | 4.88 | 77.16 | 76.56 | 61.57 | 62.17 |
Note: A: enzyme concentration; B: enzymolysis time; C: enzymolysis temperature; Y1: total flavonoid content; Y2: DPPH radical-scavenging capacities; Y3: hydroxyl radical-scavenging capacities. Act: actual; Pred: predicted.
Y2 = 76.56 + 0.45A − 0.33B − 0.52C + 0.51AB + 1.57AC − 0.30BC − 3.10A2 − 2.38B2 − 2.66C2
Y3 = 62.17 − 0.13A − 0.31B − 0.24C − 0.10AB − 0.35AC − 0.38BC − 1.53A2 − 1.38B2 − 1.26C2
The determination coefficients (R2) of the extraction yield, DPPH radical-scavenging rate, and hydroxyl radical-scavenging rate were 0.9922, 0.9623, and 0.9810 (Table 3 and Table 4), respectively. This indicated a good correlation between the experimental and predicted results in the model. The lack of fit of all the models was insignificant, indicating that the experimental error was small. Thus, the coefficients of variance (CV) of all the models were relatively low, which showed good accuracy and model reliability [33].
Table 3.
Analysis of variance (ANOVA) of the quadratic model for TFC.
Table 4.
Analysis of variance (ANOVA) of the quadratic model for DPPH and hydroxyl radical scavenging capacities.
ANOVA helped evaluate the significance of the secondary model. The smaller the p values were, the greater the significance of the corresponding coefficient [34]. The three models (Table 3 and Table 4) were significant (p ˂ 0.01), indicating their appropriateness in this study.
According to the three equations, the extraction yield of the total flavonoids and the scavenging activity of DPPH and hydroxyl radicals were affected by many factors. These included three independent variables (A, B, and C), three quadratic terms (A2, B2, and C2), and their interactions (A.B., A.C., and BC) (Table 4). For TFC (Table 3), the interaction parameter of A.C. was significant (p ˂ 0.05), except for extraction temperature and extraction time, and the others were highly significant (p ˂ 0.01). Equation (3) indicated that the influence of the linear parameters was negative, except for the enzyme concentration, and all the secondary parameters were also negative. Thus, TFC increased with decreasing enzyme degradation temperature and time with increased enzyme concentration. The influence of different variables on TFC was as follows: enzyme concentration > enzyme time > enzyme temperature. Similarly, for Equations (4) and (5) and Table 4, the linear parameters B and C were significant (p ˂ 0.05) for hydroxyl radicals, and three quadratic terms for DPPH and hydroxyl radicals were highly significant (p ˂ 0.01). The scavenging rate of antioxidants varied across different parameters.
3.2.2. Analysis of Response Surface
Three-dimensional response surface diagrams could describe the extraction yield of TFC and scavenging rate of antioxidants from the horsetail extracts in Figure 6, Figure 7 and Figure 8. The influence could be directly reflected in independent variables on the response values by the response surface plots. This could facilitate the identification of the optimal extraction parameters and the interaction among the different parameters [35].
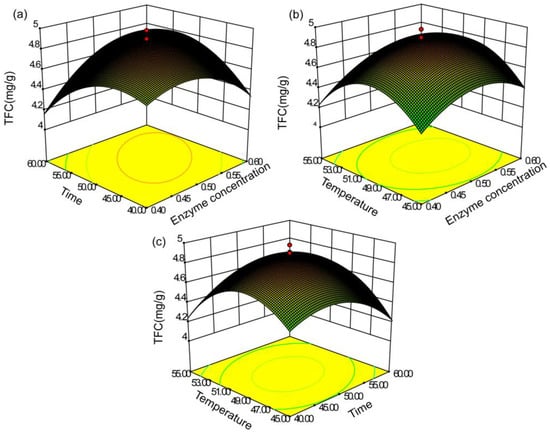
Figure 6.
Response surface (3D) indicating the effects of (a) enzyme concentration, (b) extraction time, and (c) extract temperature on the total flavonoid yield.
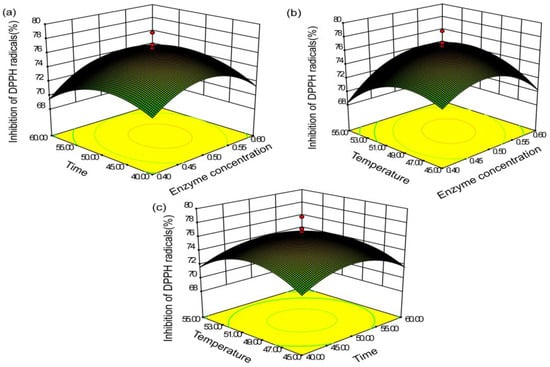
Figure 7.
Response surface (3D) depicting the effects of (a) enzyme concentration, (b) extraction time, and (c) extract temperature on the DPPH-scavenging capacity.
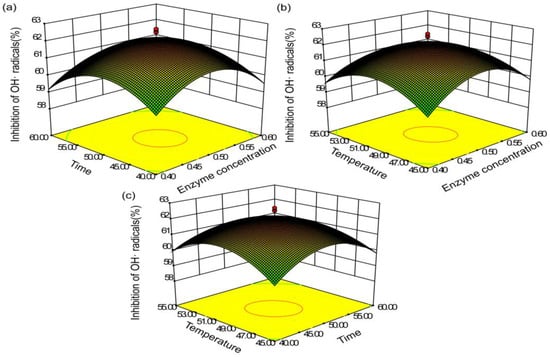
Figure 8.
Response surface (3D) demonstrating the effects of (a) enzyme concentration, (b) extraction time, and (c) extract temperature on the hydroxyl radical-scavenging capacity.
Figure 6a, Figure 7a, Figure 8a represent the influence of enzyme concentration and extraction time on TFC yield and scavenging capacity of DPPH and hydroxyl radicals. As shown in Figure 6a, the TFC yield was positively associated with increased enzyme content when the concentration was <0.52%; the yield subsequently decreased. Additionally, the enzyme time had little effect on the yield when the enzyme content was small. The yield gradually increased with increased concentration, and the interaction between enzyme concentration and enzyme time was highly significant. In Figure 7a, Figure 8a, the effects of enzyme concentration and other factors on the radical-scavenging capacity of DPPH and hydroxyl were relatively small. The clearance rate of the two radicals was elevated before the enzyme content reached 0.5%, with reduced antioxidant activity.
When the temperature was low, the yield of total flavonoids increased with an increase in enzyme time from 40 to 51 min. The time curve was balanced at 51 min, indicating that the yield peaked at 51 min. Likewise, the maximum clearance rate was 49 min.
We analyzed the relationship between the extraction temperature and the other factors using the response surface (Figure 6a). The extraction rate reached the maximum at 50 °C. When the temperature was too high, the yield reduced rapidly, possibly owing to excessive temperature leading to enzyme inactivation. In Figure 7c, Figure 8c, the effect of the temperature on the scavenging rate of antioxidants was evident, with constant enzyme concentration. Moreover, the scavenging capacity increased and decreased with the increase in temperature.
3.2.3. Model Validation
The ultimate purpose of the study was to determine the optimal conditions of the maximum total flavonoids from EAL and the most significant antioxidant activity. In Table 5, the optimum conditions had an enzyme concentration of 0.52%, process time of 50.57 min, temperature of 50 °C, liquid-to-solid ratio of 25:1 (mL/g), and ethanol concentration of 80%. The optimal TFC was 4.88 mg/g, and DPPH and hydroxyl radical-scavenging activity was 77.36% and 62.02%, respectively. The optimized extraction method yields a total flavonoid extract with higher yield and antioxidant capacity compared with ordinary extraction methods [36,37]. Therefore, the prediction value error was relatively small, indicating the feasibility of the model.
Table 5.
Predicted and actual values for the response variables under optimal conditions.
3.3. Flavonoid Content in the Extract
Five representative flavonoid components were detected in EALE, depicted by the chromatograms in Figure 9. The five components that accounted for 37.62% of the EALE extraction include rutin, quercetin, kaempferol, luteolin, and apigenin (Table 6). Other flavonoid compounds that may be present in EALE need further analysis. The optimized process enhanced the extraction efficiency of flavonoids. These compounds have been extensively researched as representative antioxidants owing to their consistent antioxidative activity.
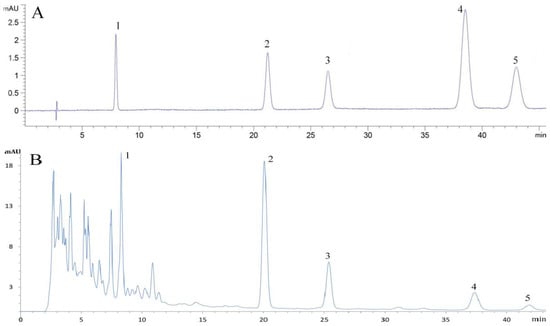
Figure 9.
Chromatograms of flavonoid standards (A) and EALE (B). Numbers 1 to 5 indicate the compounds of rutin, quercetin, kaempferol, luteolin, and apigenin, respectively.
Table 6.
Flavonoids of EALE.
4. Conclusions
RSM was used in this study to optimize the cellulase-assisted process for extracting total flavonoids from EAL. The optimal extraction conditions combined with the actual process were as follows: enzyme concentration of 0.52%, process time of 50.57 min, temperature of 50 °C, liquid-to-solid ratio of 25:1 (mL/g), and ethanol concentration of 80%. The optimal extraction content was 4.88 mg/g, which is 51.23% higher than that obtained using the traditional ethanol method. The results indicated that total flavonoid extraction was improved via cellulase-assisted extraction. This established the theoretical basis for the further processing of total flavonoids. The method was simple with better extraction efficiency, providing a novel technical method for developing and utilizing the total flavonoids of EAL.
Author Contributions
H.Y. and Y.Z.: conceptualization, methodology, and writing—original draft. T.H. and W.L.: methodology and validation. Y.D. and X.W.: visualization and supervision. H.T., L.Z., and G.Y.: methodology and writing—review and editing. All authors have read and agreed to the published version of the manuscript.
Funding
This work was supported by the Ph.D. Project of Xichang University (YBZ202257).
Data Availability Statement
All data have been included in this paper.
Conflicts of Interest
The authors declare no conflict of interest.
References
- Do Monte, F.H.M.; dos Santos, J.G., Jr.; Russi, M.; Lanziotti, V.M.N.B.; Leal, L.K.A.M.; de Andrade Cunha, G.M. Antinociceptive and anti-inflammatory properties of the hydroalcoholic extract of stems from Equisetum arvense L. in mice. Pharmacol. Res. 2004, 49, 239–243. [Google Scholar] [CrossRef] [PubMed]
- Zhang, Y.-L.; Ferguson, D.K.; Ablaev, A.G.; Wang, Y.-F.; Li, C.-S.; Xie, L. Equisetum cf. pratense (Equisetaceae) from the Miocene of Yunnan in southwestern China and its paleoecological implications. Int. J. Plant Sci. 2007, 168, 351–359. [Google Scholar] [CrossRef]
- Cook, R.; Hennell, J.R.; Lee, S.; Khoo, C.S.; Carles, M.C.; Higgins, V.J.; Govindaraghavan, S.; Sucher, N.J. The Saccharomyces cerevisiae transcriptome as a mirror of phytochemical variation in complex extracts of Equisetum arvense from America, China, Europe and India. BMC Genom. 2013, 14, 445. [Google Scholar] [CrossRef] [PubMed]
- Dormousoglou, M.; Efthimiou, I.; Antonopoulou, M.; Fetzer, D.L.; Hamerski, F.; Corazza, M.L.; Papadaki, M.; Santzouk, S.; Dailianis, S.; Vlastos, D. Investigation of the genotoxic, antigenotoxic and antioxidant profile of different extracts from Equisetum arvense L. Antioxidants 2022, 11, 1393. [Google Scholar] [CrossRef]
- Milutinović, M.; Radovanović, N.; Rajilić-Stojanović, M.; Šiler-Marinković, S.; Dimitrijević, S.; Dimitrijević-Branković, S. Microwave-assisted extraction for the recovery of antioxidants from waste Equisetum arvense. Ind. Crops Prod. 2014, 61, 388–397. [Google Scholar] [CrossRef]
- Suciu, M.; Mic, F.A.; Barbu-Tudoran, L.; Muntean, V.; Gruia, A.T. Effects of Lycopodium clavatum and Equisetum arvense extracts from Western Romania. Rom. Biotechnol. Lett. 2017, 22, 13005. [Google Scholar]
- Suciu, M.; Ardelean, A. Hepatoprotective and Microbiological Studies of Three Genera: Equisetum, Lycopodium, AND Gentiana. An. Univ. Oradea Fasc. Biol. 2012, 19, 116–122. [Google Scholar]
- Carneiro, D.M.; Jardim, T.V.; Araújo, Y.C.L.; Arantes, A.C.; de Sousa, A.C.; Barroso, W.K.S.; Sousa, A.L.L.; de Carvalho Cruz, A.; da Cunha, L.C.; Jardim, P.C.B.V. Antihypertensive effect of Equisetum arvense L.: A double-blind, randomized efficacy and safety clinical trial. Phytomedicine 2022, 99, 153955. [Google Scholar] [CrossRef]
- Oniszczuk, A.; Podgórski, R.; Oniszczuk, T.; Żukiewicz-Sobczak, W.; Nowak, R.; Waksmundzka-Hajnos, M. Extraction methods for the determination of phenolic compounds from Equisetum arvense L. herb. Ind. Crops Prod. 2014, 61, 377–381. [Google Scholar] [CrossRef]
- Carneiro, D.; Tresvenzol, L.M.F.; Jardim, P.C.B.V.; Cunha, L.C.D. Equisetum arvense: Scientific evidences for clinical use. Int. J. Biol. Pharm. Allied Sci. 2013, 2, 1579–1596. [Google Scholar]
- Luanda, A.; Ripanda, A.; Makangara, J.J. Therapeutic potential of Equisetum arvense L. for management of medical conditions. Phytomedicine Plus 2023, 3, 100444. [Google Scholar] [CrossRef]
- Cerna, C.Q.; Segura, N.L.; Plasencia, E.B.; Pisconte, F.C.; López, W.P.; Velásquez, M.L. Effect of flavonoids extracted from Equisetum bogotense (Equisetaceae) on the levels of TNF-α in experimentally induced inflammation in Mus musculus BALB/c. Arnaldoa 2019, 26, 1075–1082. [Google Scholar]
- David, P.P.; Santiago, C.D.; Castillo, A.L.; De Guzman, G.Q. Hair regenerative activities of flavonoid-rich extract of Equisetum hyemale L. (Equisetaceae) in chemically-induced alopecia in Sprague Dawley rats. J. Pharm. Pharmacogn. Res. 2019, 7, 323–330. [Google Scholar]
- Jain, M.; Parmar, H.S. Evaluation of antioxidative and anti-inflammatory potential of hesperidin and naringin on the rat air pouch model of inflammation. Inflamm. Res. 2011, 60, 483–491. [Google Scholar] [CrossRef]
- Favela-Hernández, J.; García, A.; Garza-Gonzalez, E.; Rivas-Galindo, V.; Camacho-Corona, M.D.R. Antibacterial and antimycobacterial lignans and flavonoids from Larrea tridentata. Phytother. Res. 2012, 26, 1957–1960. [Google Scholar] [CrossRef] [PubMed]
- Parameshwaran, K.; Almaghrabi, M.; Govindarajulu, M.; Clark, R.C.; Dhanasekaran, M. Bioactives and Pharmacology of Equisetum arvense L. In Bioactives and Pharmacology of Medicinal Plants; Apple Academic Press: Palm Bay, FL, USA, 2023; pp. 429–440. [Google Scholar]
- Rostami, H.; Gharibzahedi, S.M.T. Cellulase-assisted extraction of polysaccharides from Malva sylvestris: Process optimization and potential functionalities. Int. J. Biol. Macromol. 2017, 101, 196–206. [Google Scholar] [CrossRef] [PubMed]
- Liu, X.; Zhang, M.; Guo, K.; Jia, A.; Shi, Y.; Gao, G.; Sun, Z.; Liu, C. Cellulase-assisted extraction, characterization, and bioactivity of polysaccharides from Polygonatum odoratum. Int. J. Biol. Macromol. 2015, 75, 258–265. [Google Scholar] [CrossRef]
- Martillanes, S.; Ayuso-Yuste, M.C.; Bernalte, M.J.; Gil, M.V.; Delgado-Adámez, J. Cellulase-assisted extraction of phenolic compounds from rice bran (Oryza sativa L.): Process optimization and characterization. J. Food Meas. Charact. 2021, 15, 1719–1726. [Google Scholar] [CrossRef]
- Wang, W.; Gao, Y.-T.; Wei, J.-W.; Chen, Y.-F.; Liu, Q.-L.; Liu, H.-M. Optimization of ultrasonic cellulase-assisted extraction and antioxidant activity of natural polyphenols from passion fruit. Molecules 2021, 26, 2494. [Google Scholar] [CrossRef] [PubMed]
- Sadeghi-Kiakhani, M.; Tehrani-Bagha, A.R.; Safapour, S.; Eshaghloo-Galugahi, S.; Etezad, S.M. Ultrasound-assisted extraction of natural dyes from Hawthorn fruits for dyeing polyamide fabric and study its fastness, antimicrobial, and antioxidant properties. Environ. Dev. Sustain. 2021, 23, 9163–9180. [Google Scholar] [CrossRef]
- Wan, P.; Sheng, Z.; Han, Q.; Zhao, Y.; Cheng, G.; Li, Y. Enrichment and purification of total flavonoids from Flos Populi extracts with macroporous resins and evaluation of antioxidant activities in vitro. J. Chromatogr. B 2014, 945, 68–74. [Google Scholar] [CrossRef] [PubMed]
- Mohamed Isa, S.S.P.; Ablat, A.; Mohamad, J. The antioxidant and xanthine oxidase inhibitory activity of Plumeria rubra flowers. Molecules 2018, 23, 400. [Google Scholar] [CrossRef]
- Kianersi, F.; Abdollahi, M.R.; Mirzaie-Asl, A.; Dastan, D.; Rasheed, F. Identification and tissue-specific expression of rutin biosynthetic pathway genes in Capparis spinosa elicited with salicylic acid and methyl jasmonate. Sci. Rep. 2020, 10, 8884. [Google Scholar] [CrossRef] [PubMed]
- Naveen, P.; Lingaraju, H.; Prasad, K.S. Simultaneous determination of rutin, isoquercetin, and quercetin flavonoids in Nelumbo nucifera by high-performance liquid chromatography method. Int. J. Pharm. Investig. 2017, 7, 94. [Google Scholar] [CrossRef] [PubMed]
- Prakash, O.; Mahapatra, D.K.; Singh, R.; Singh, N.; Verma, N.; Ved, A. Development of a New Isolation Technique and Validated RP-HPLC method for Quercetin and Kaempferol from Azadirachta indica leaves. Asian J. Pharm. Anal. 2018, 8, 164–168. [Google Scholar] [CrossRef]
- Li, L.; Jiang, H.; Wu, H.; Zeng, S. Simultaneous determination of luteolin and apigenin in dog plasma by RP-HPLC. J. Pharm. Biomed. Anal. 2005, 37, 615–620. [Google Scholar] [CrossRef]
- Qian, Z.-G. Cellulase-assisted extraction of polysaccharides from Cucurbita moschata and their antibacterial activity. Carbohydr. Polym. 2014, 101, 432–434. [Google Scholar] [CrossRef]
- Panouillé, M.; Thibault, J.-F.; Bonnin, E. Cellulase and protease preparations can extract pectins from various plant byproducts. J. Agric. Food Chem. 2006, 54, 8926–8935. [Google Scholar] [CrossRef]
- Huynh, N.T.; Smagghe, G.; Gonzales, G.B.; Van Camp, J.; Raes, K. Enzyme-assisted extraction enhancing the phenolic release from cauliflower (Brassica oleracea L. var. botrytis) outer leaves. J. Agric. Food Chem. 2014, 62, 7468–7476. [Google Scholar] [CrossRef]
- Zhang, Y.; Zhang, S. Optimization of Cellulase-assisted Extraction and Antioxidant Activity of Polysaccharides from Taraxacum Mongolicum Hand.-Mazz. In IOP Conference Series: Earth and Environmental Science; IOP Publishing: Bristol, UK, 2021; p. 012036. [Google Scholar]
- Nurcholis, W.; Putri, D.N.S.B.; Husnawati, H.; Aisyah, S.I.; Priosoeryanto, B.P. Total flavonoid content and antioxidant activity of ethanol and ethyl acetate extracts from accessions of Amomum compactum fruits. Ann. Agric. Sci. 2021, 66, 58–62. [Google Scholar] [CrossRef]
- Karazhiyan, H.; Razavi, S.M.; Phillips, G.O. Extraction optimization of a hydrocolloid extract from cress seed (Lepidium sativum) using response surface methodology. Food Hydrocoll. 2011, 25, 915–920. [Google Scholar] [CrossRef]
- Sheng, Z.; Li, J.; Li, Y. Optimization of ultrasonic-assisted extraction of phillyrin from Forsythia suspensa using response surface methodology. J. Med. Plants Res. 2012, 6, 1633–1644. [Google Scholar]
- Sheng, Z.-L.; Wan, P.-F.; Dong, C.-L.; Li, Y.-H. Optimization of total flavonoids content extracted from Flos Populi using response surface methodology. Ind. Crops Prod. 2013, 43, 778–786. [Google Scholar]
- Čanadanović-Brunet, J.M.; Ćetković, G.S.; Djilas, S.M.; Tumbas, V.T.; Savatović, S.S.; Mandić, A.I.; Markov, S.L.; Cvetković, D.D. Radical scavenging and antimicrobial activity of horsetail (Equisetum arvense L.) extracts. Int. J. Food Sci. Technol. 2009, 44, 269–278. [Google Scholar] [CrossRef]
- Ismail, A.; Al-Khasreji, T.; Maulood, B. Flavonoids content in methanolic extract of Equisetum arvense L. (Horsetail) from Kurdistan region-Iraq. J. Biotechnol. Res. Cent. 2020, 14, 47–51. [Google Scholar]
Disclaimer/Publisher’s Note: The statements, opinions and data contained in all publications are solely those of the individual author(s) and contributor(s) and not of MDPI and/or the editor(s). MDPI and/or the editor(s) disclaim responsibility for any injury to people or property resulting from any ideas, methods, instructions or products referred to in the content. |
© 2023 by the authors. Licensee MDPI, Basel, Switzerland. This article is an open access article distributed under the terms and conditions of the Creative Commons Attribution (CC BY) license (https://creativecommons.org/licenses/by/4.0/).