Article

Numerical Simulation of Pore Pressure Change Caused by Hydrocarbon Generation in Chezhen Sag and Its Influence on Hydrocarbon Accumulation

1
School of Geodesy and Geomatics, Wuhan University, Wuhan 430079, China
2
Exploration and Development Research Institute, Shengli Oilfield Company, China Petroleum & Chemical Corporatio, Dongying 257015, China
3
State Key Laboratory of Petroleum Resources and Prospecting, China University of Petroleum (Beijing), Beijing 102249, China
*
Author to whom correspondence should be addressed.
Processes 2023, 11(7), 1976; https://doi.org/10.3390/pr11071976
Submission received: 31 May 2023 / Revised: 23 June 2023 / Accepted: 25 June 2023 / Published: 30 June 2023

Abstract

:
The pore fluid pressure is important for the generation, migration, and accumulation of hydrocarbons. The Chezhen Sag region in the Bohai Bay Basin is typically characterized by pore fluid overpressure, which is the difference between the pore fluid pressure and the hydrostatic pore pressure. The formation mechanisms of pore overpressure and the accumulation regularity of the “upper source-lower reservoir” type in this region remain unknown. In order to investigate these problems, based on the existing seismic, logging data, and regional tectonic stress environment, we established a two-dimensional finite element model to simulate the fluid–solid coupling processes in the Chegu 25 block of the Chezhen depression. We calculated the abnormal overpressure generated at the source rock during hydrocarbon generation and the processes of hydrocarbon migration and accumulation along the faults and analyzed the dynamic conditions of the hydrocarbon downward accumulation. The results showed that overpressure could accelerate the migration of hydrocarbon and improve the efficiency of hydrocarbon accumulation. When the overpressure was too large, tensile fractures and shear fractures could occur, resulting in hydrocarbon dissipation, and changing the results of the oil and gas accumulation. The overpressure at the source rock was mainly caused by hydrocarbon generation, while the overpressure at the reservoir was primarily created by unbalanced compaction. As the dominant channel of hydrocarbon migration that exists, overpressure will change the direction and path of hydrocarbon migration in the fault. Therefore, the high permeability of the fault and the existence of pore fluid overpressure can explain the “upper source-lower reservoir” hydrocarbon accumulation model strongly explained the high permeability of faults and the presence of overpressure. The simulated overpressure results were also in good agreement with the mud weight equivalent overpressure and the drill stem tests (DSTs).

1. Introduction

With the emergence of new technologies for petroleum exploration and development, as well as the large-scale exploitation of shallow petroleum resources, deep basin reservoirs have gradually become the primary target strata of exploration [1,2]. The existing research and petroleum development practices indicate that under the conventional basin hydrocarbon accumulation mode (under hydrostatic pressure), the hydrocarbon generated by the source rock mainly migrates and accumulates to the overlying stratum and accumulates under the action of buoyancy [3]. In particular, pore fluid pressure plays an important role in the generation, migration, and accumulation of hydrocarbons in sedimentary basins [4,5,6]. Overpressure, for instance, hinders the maturation of kerogen, alters the fluid movement path, and affects the hydrocarbon accumulation model [5,7,8]. Thus, under overpressure and other geological conditions, hydrocarbons can migrate downward from the upper source rock to the lower reservoir and accumulate [8]. Examples of this phenomenon include the Fuyang–Qingshankou petroleum system in the Songliao Basin [9,10], the Najmah–Marrat petroleum system in Kuwait, and the Macasty–Mingan–Romaine petroleum system in the Anticosti Basin in eastern Canada [9,11].
There have been many studies on and explorations of the “upper source-lower reservoir” hydrocarbon accumulation model. They found that continuous hydrocarbon generation from source rocks, sufficient overpressure, and a smooth hydrocarbon migration channel between the overlying source rock and underlying reservoir are the essential conditions for the hydrocarbon downward migration [12,13]. Additionally, these works also conducted a large number of numerical calculations to quantitatively analyze the mechanisms of overpressure formation, as well as hydrocarbon migration and accumulation [13,14,15,16]. Some studies based on the principle of overpressure sealing suggested that overpressure is a crucial factor that affects the depth of downward hydrocarbon migration [13,14,17]. Furthermore, Zhuang et al. used the Bernoulli equation to describe the flow state of oil and suggested that the permeability coefficient of rocks is another significant factor that greatly influences and determines the distance of hydrocarbon downward migration and the release rate of overpressure [18].
Nevertheless, it is clear that many researchers have begun to pay attention to the evolutionary histories of hydrocarbon generation and overpressure in basins and their influence on hydrocarbon migration and accumulation due to advancements in basin simulation technology. In particular, Wang et al. demonstrated the possibility of hydrocarbon downward migration through physical simulation experiments [19]. They analyzed the differences in geological reserves of petroleum reservoirs formed by skeleton sand bodies and faults as migration pathways [19]. Luo et al. simulated a simplified model of sand–mudstone and quantitatively studied the processes of overpressure formation and dissipation [20]. Guo, Wang, and Li et al. utilized basin-modeling technology to examine the growth mechanism and evolution process of overpressure in the Bohai Bay Basin [21,22,23,24]. They believed that the main factors for the formation of overpressure in different regions of the basin would be different. For example, the primary cause for the formation of overpressure in the Dongying Depression was unbalanced compaction, and the main reason for the formation of overpressure in the Chexi area was hydrocarbon generation.
Overall, these works constructed a simplified geological model, where most studies only quantitatively considered the impact of a single dynamic factor (such as fluid overpressure or the permeability coefficient) on the “upper source and lower storage” hydrocarbon accumulation model. Unfortunately, these studies did not comprehensively consider the influence of overpressure, rock permeability coefficient, or even the coupling of unbalanced compaction and hydrocarbon generation during overpressure generation and the pressure–stress coupling during overpressure evolution.
Based on the available data, we first calculated the overpressure generated by unbalanced compaction. We then systematically analyzed and discuss the impact of this overpressure mechanism on the overall overpressure. Two overpressure-generation mechanisms of unbalanced compaction and hydrocarbon generation were coupled in the finite element model. In addition, we also evaluated the dynamic conditions of the “upper source-lower reservoir” hydrocarbon accumulation model, as well as the disparity between the simulated and observed overpressure values. This study will help people to better understand the mechanisms of hydrocarbon migration and accumulation, as well as the laws governing the spatial distribution of hydrocarbons.

2. Geological Background

The Chezhen Sag, which is located in the Bohai Bay Basin, is a secondary sag within the Jiyang Depression (Figure 1a). It is a half-graben continental fault basin that is wide along the east–west direction but narrow along the north–south direction, covering an area of about 2390 km2 (Figure 1a) [25]. It is surrounded by the Wudi uplift, Qingyun uplift, Chengzikou uplift, and Yihezhuang uplift in clockwise order from west to east (Figure 1b) [26]. Many faults have developed in the sag, and the tectonic units are highly segmented (Figure 1b). Three sub-depressions, namely, Chexi, Dawangbei, and Guojuzi, have developed from west to east (Figure 1b) [25].
The northern part of the Chezhen Sag has experienced several strong regional tectonic movements [27]. During the early Yanshan Movement, the area experienced compression along the NE trend, resulting in the development of a local anticline [28]. In the late Yanshan Movement to the Himalayan Movement, the Chengnan faults and step faults began to become active [28]. Additionally, the prefabricated buried hill folds in the north of the Chezhen Sag underwent significant extension, leading to the formation of numerous secondary faults and fractures [29]. During the depositional period of the Shahejie Formation in the Paleogene, the buried hill structure was ultimately formed and subsequently cut into a series of complex fault blocks, which gave rise to buried hill hydrocarbon reservoirs [28,29].
The strata in the Chezhen Depression include the Paleogene Kongdian Formation (Ek), Shahejie Formation (Es) and Dongying Formation (Ed), Neogene Guantao Formation (Ng) and Minghuazhen Formation (Nm), and Quaternary Plain Formation (Qp) (Figure 1c,d) [24,30]. The Shahejie Formation consists of Es1, Es2, Es3, and Es4. Es3 is the main source rock and it is mature, while the source rock of the Es1 is still immature [31]. There are abundant caprocks in the entire stratigraphic column of the Chezhen Sag, including Es4–Es3, Es1–Ed3, and Ng–Nm mudstone sections, all of which are regional seals with extremely low permeability. The Guantao Formation and Minghuazhen Formation (Ng and Nm) show similar sedimentary sequences and strata throughout the Bohai Bay Basin [30].
The reservoir in this area consists of marine carbonate strata in the Lower Paleozoic, mainly including relatively dense limestone and dolomite, whose primary pores are not developed, and the matrix porosity and permeability are generally low. Due to the transformation of tectonic movement and dissolution, faults in the Lower Paleozoic were very developed, and a large number of secondary genetic reservoir spaces were formed in the rocks [32]. The Yanshanian and Himalayan periods are two important periods, during which complex fault systems were finally formed, greatly enhancing the permeability of the carbonate reservoirs [27].

3. Model Settings

According to the drilling results, the petroleum in the lower Paleozoic buried hill in the study area basically comes from the Paleogene Shahejie Formation, while the Cambrian and Ordovician do not have the ability to generate hydrocarbons [33]. The middle and lower Es3 of the Shahejie Formation is the main source rock of the lower Paleozoic buried hill [34]. The reservoirs below the lower Es3 of the main source rock are rich in hydrocarbon resources and have great exploration potential [23].

3.1. Fault Sealing Properties

Two main types of migration systems between source rocks (Es3) and reservoirs (C) were recognized by previous studies. One migration system is composed of small faults and micro-cracks that are difficult to identify on the seismic profile, and in this case, the micro-crack is mainly caused by pore fluid overpressure fracturing the rock [14]. The other migration system is the fault with a certain fault throw [15]. Considering the three-dimensional structure of the fault (not a single surface), it has a typical dual structure composed of a fault core and a fracture zone (Figure 2b) [35,36].
According to the carbonate rock field outcrops, reservoir core data, and permeability data from experimental results of rock samples in the fault zone (permeability data from personal communication with Zonghu Liao), the sealing properties of the two faults (Che 571 fault and Chegu 25 fault) in the study area can be explained. We found that the fractures of the fault core in this area were highly cemented and filled, primarily with calcite (Figure 2c). There were also muddy particles on the fault surface (Figure 2a). The fault core had low permeability, indicating that the lateral side of the fault effectively sealed hydrocarbons. The fractures that were filled with calcite were subsequently dissolved through corrosion, leading to the formation of dissolution cavities (Figure 2d) [27]. The fractures of the fault fracture zone were developed and its permeability was high, indicating that the fracture zone exhibited extensive fracturing and high permeability, suggesting that it provided convenient conditions for the vertical migration of hydrocarbons.
Furthermore, the seismic profile interpretation results show that the Che 571 fault and the Chegu 25 fault effectively cut the source rocks of the Shahejie Formation. Hence, we suggest that for hydrocarbon migration, these two faults are major channels (Figure 2 and Figure 3) and micro-fractures are secondary channels.

3.2. Finite Element Model

We utilized the finite element software Abaqus (2016) to develop a poroelastic numerical model and to simulate the evolution of overpressure resulting from the hydrocarbon generation process, which we call hydrocarbon generation overpressure. We assumed that the faults on both sides of the Chegu 25 well were highly permeable. According to the results of the fault throw interpreted using seismic coherence attributes, we determined that the average fault throw of the Chegu 25 fault was 350 m, and the average fault throw of the Che 571 fault was 800 m (Figure 3) [37]. After some modeling experiments and a comparison between the modeling results and observation data, we selected the average hydrocarbon generation rate of the model to be 10−13 m3/s. Our model domain was 8 km long and 6 km deep (Figure 4a). The upper boundary of the model was the displacement-free boundary and the zero-pore pressure boundary (drainage boundary). The left and right boundaries had a fixed normal displacement (zero) and hydrostatic pore pressure (drainage boundary, P H = ρ w g h ). The bottom boundary had a fixed normal displacement (zero) and a fixed pore pressure that equaled the hydrostatic pore pressure value at the depth (drainage boundary) (Figure 4a,b).
Permeability is related to lithology and effective stress. The commonly used permeability range in previous numerical simulation studies is 10−17 ~ 10−21 m2 [38,39]. Based on the experimental results of permeability from rock samples in the fault zone and previous research findings, it can be concluded that the third section of the Shahejie Formation (Es3) to the Carboniferous (C) consisted mainly of sandstone. The permeability of these strata ranged from 1–5 × 10⁻¹⁸ m2 or 1–5 × 10⁻³ mD. The formations of the Guantao Formation (Ng), Dongying Formation (Ed), and the second section of Shahejie Formation (Es2) were used as caprocks, whose permeability was set to 1 × 10⁻¹⁹ m2 or 1 × 10⁻⁴ mD. The fracture zone had high permeability, up to 1 × 10⁻¹⁵ m2 (1 mD) (Table 1). The experimental results indicate that with the increase in effective pressure, the permeability decreased, and the decline could reach 2–4 orders of magnitude [39,40]. Thus, we set two permeability coefficients according to the different depths of the fault, and the permeability coefficient of the shallow fault was larger (Table 1).
The primary period for hydrocarbon generation and overpressure formation is from the end of the uplift and denudation in the Neogene (14 Ma) to the present time [23]. During this stage, the tectonic activity has been weakened or even stopped, and the underground sedimentary environment has been basically stable [27]. The sedimentary process before hydrocarbon generation in the study area possibly formed an overpressure environment due to unbalanced compaction [41].
Of interest here is the fact that this overpressure result can be calculated using logging data (mudstone porosity). Specifically, the calculation method and process are referred to in Appendix A. From the comparison between the overpressure caused by unbalanced compaction (later referred to as the unbalanced compaction overpressure) and the overpressure measured using the mud weight, we found that the unbalanced compaction overpressure could not reach the measured overpressure value (Figure 5a). Hence, we conducted a finite element numerical simulation of the hydrocarbon generation process using the overpressure calculated from the unbalanced compaction. The initial pore pressure field before the hydrocarbon generation simulation (Figure 4c) was obtained via regional interpolation of the overpressure data from four wells near the study area (Figure 5).
Table 1. Material parameters of the finite element model.
StratumYoung’s Modulus (GPa)Poisson RatioHigher Permeability (m2)Lower Permeability (m2) [38,39]
Ng30 [42]0.25 [42]1.5 × 10−151.5 × 10⁻²⁰
Ed32 [42]0.25 [42]1 × 10−151 × 10−20
Es232 [42]0.25 [42]1 × 10−151 × 10−20
Es335 [43]0.3 [43]5 × 10−155 × 10−20
Es435 [43]0.3 [43]3 × 10−153 × 10−20
C35 [44]0.3 [44]2 × 10−152 × 10−20
O35 [44]0.3 [44]1 × 10−161 × 10−21
35 [44]0.35 [44]1 × 10−161 × 10−21
Art350.351 × 10−161 × 10−21
Fault-L-Es335 [27]0.3 [27]1 × 10−121 × 10−17
Fault-L-Es435 [27]0.3 [27]1 × 10−131 × 10−18
Fault-R-Es335 [27]0.3 [27]1 × 10−121 × 10−17
Fault-R-Es435 [27]0.3 [27]1 × 10−131 × 10−18

3.3. Governing Equations

3.3.1. Equilibrium Equation

The equilibrium equation that was solved using the model is shown below:
σ i j x j + ρ g i = 0 ,
where σ i j is the total stress tensor (i, j = 1, 2, 3) and ρ g i is the body force. In this study, the compressive stress was positive.

3.3.2. Principle of Effective Stress

An extended form of Terzaghi’s effective stress principle was used to calculate the effective stress state in Abaqus [45]. According to the improved effective stress law proposed by Nur and Byerlee [46], the effective stress is shown below:
σ i j = λ δ i j ε V + 2 G ε i j δ i j α P p ,
where λ = E v 1 + v 1 2 v and G = E 2 + 2 v . When i = j, δ i j = 1 , and when i ≠ j, δ i j = 0 . α is the Biot constant, which equals   1 K b K g , where K b is the “drainage” bulk modulus of rock and K g   is the bulk modulus of the skeleton material [47]. When α = 0, the rock has no connected pores, and the pore pressure has no effect on the rock. When α = 1 , the pore pressure has the greatest impact on the rock. In this study, we assumed that α equals one [38,48].

3.3.3. Constitutive Relations of Pore Fluids

Darcy’s law was used to describe the relationship between the fluid flow velocity (q) and the pore fluid pressure ( P p ) [49]:
q = k η w P p ρ f g h ,
where k is the permeability of sediments,   η w is the viscosity of the pore fluid ( η w = 1.0 × 10⁻³ Pa s), h is the depth from the top of the model and ∇ is the gradient sign.

3.3.4. Continuous Equation of Seepage

The seepage continuity equation was established according to the persistent condition that the amount of net outflow of water from the micro-element is equal to the variation in the micro-element volume at the same time [50]. In Abaqus, only the solid phase is meshed with finite elements, while pore water can flow in the meshes [51]. Therefore, for a pore fluid, a continuous equation is needed to calculate the relationship between the growth rate of the pore water quality at a point and the flow rate of pore water within a certain time increment.
The continuity equation at the non-source rock is as follows:
S ρ f ϕ t + · ρ f q = 0 ,
where t is time, S is the saturation, and ϕ is the porosity.
The continuity equation of the source rock is as follows:
S ρ o i l ϕ t + · ρ o i l q = ρ o i l Q ,
where Q is the flow velocity at the source (positive when the rocks serve as a source and negative when the rocks serve as a sink, kg/m3) and ρ o i l is the density of oil.

4. Model Results

The first step of the model calculation was the geostatic stress step (in situ stress equilibrium step). The pore fluid pressure field in this step was equal to the sum of the hydrostatic pressure and the unbalanced compaction overpressure.
Considering the strike-slip tectonic stress environment in the study area, the ratio of the horizontal effective stress ( σ x x ) to the vertical effective stress ( σ y y ) in the initial state was 1.4, and the out-of-plane effective stress ( σ z z ) to the vertical effective stress ( σ y y ) was 0.7 [52]. For the density and porosity data used in the model, please refer to Figure A1 in Appendix A.
In the geostatic stress step, the pore fluid overpressure of the model was only caused by unbalanced compaction. In this step, the hydrocarbon generation process and its generated pore fluid pressure were not included in the model. The goal of the geostatic stress step was to establish an initial pore fluid pressure field and an initial effective stress field for the following numerical simulation of the hydrocarbon generation process.
The second step of the modeling was to calculate the pore fluid pressure or overpressure caused by the hydrocarbon generation process since the Neogene (14 Ma). On the basis of the initial pore pressure field and the initial effective stress field obtained from the geostatic stress step simulation, we included the hydrocarbon generation and its resulting overpressure in the middle and lower sub-sections of the third and fourth members of the Shahejie Formation (see the red dotted box in Figure 4) between the two faults in the study area in this step.
The simulated overpressure was mainly concentrated in the area between the two faults (Figure 6a), and the magnitude of the overpressure decreased in the vertical direction. Due to its low permeability, the formation above Es2 acted as a seal for hydrocarbons and functioned as a good cap rock. As a result, the overpressure in these formations was not significant. The maximum overpressure appeared in the Es3 formation between the two faults, and the maximum value exceeded 30 MPa (Figure 6a).
Under the action of overpressure and buoyancy, the fluid flowing from Es3 and Es4 mainly flowed along the fault to the shallow strata and the flow velocity was large (Figure 6b). Near the Es2 formation, due to its sealing effect, the fluid could not continue to move up and had to accumulate and change the flow direction; therefore, a large downward flow velocity was generated at the top of the fault (Figure 6b). Because continuous hydrocarbon generation was still occurring and the lateral migration resistance was lower than the resistance through the caprock, the direction of fluid movement in the fault changed. It began to migrate toward the strata on both sides of the fault, such as the velocity direction of the Es3 formation of the Che 571 well, Chegu 204 well, and Chegu 201 well. Under the influence of the pressure difference and high permeability of the fault, fluid could migrate from Es3 and Es4 to the Carboniferous formation (C) along the fault, leading to overpressure accumulation (Figure 6b). Its flow rate was also lower than that of the upward migration fluid. Although overpressure could exist in the strata of the Mantou Formation (ε) and Majiagou Formation (O), the magnitude of overpressure was significantly reduced (Figure 6a). In addition, the overpressure area above the source rock was larger than that below it. This was because the fluid had difficulty continuing to move down under the action of buoyancy, capillary resistance, and hydrodynamics [53].
In order to further quantitatively verify the reliability of the model, we compared the simulation results of the pore fluid pressure in the Chegu 25 well with the overpressure measured using the mud weight. We found that the simulated pore fluid pressure and the mud weight equivalent pressure were in good agreement with the overall trend (Figure 7a). The simulated pore pressure agreed well with the mud weight equivalent pressure in Es2 and Es3 (Figure 7a). In Es3 and Es4, the simulated pore pressures were slightly higher than the mud weight equivalent pressures. The reservoir drilled in this well was a typical type of “upper source-lower reservoir”, but the reservoir drilled in the Chegu 25 well only appeared in a limited area between two faults. The overpressures of the K571, Chegu 204, and Chegu 201 wells did not change much during hydrocarbon generation (Figure 7b–d), and there was no accumulation condition for the hydrocarbon to migrate downward. Because of the obvious overpressure at the deep source rock, the hydrocarbons in the reservoirs drilled by these three wells mainly came from the deep source rock and migrated upward along the fault or microfracture.
It is noteworthy that the distance or depth over which the fluid overpressure is transmitted can be affected by various factors [16]. However, it can be determined that if the source rocks continue to generate hydrocarbons and the tectonic environment of the model area remains unchanged, overpressure may also occur in deeper strata (near the gray arrow of Figure 7a). By utilizing the overpressure results calculated by the model and referring to the previous maximum distance model of the hydrocarbon migration [15], we could determine the maximum hydrocarbon downward migration distance near the maximum overpressure position of the Chegu 25 well (Figure 4a red solid line and Figure 8a). Note that it can be seen from the results that the maximum hydrocarbon migration distance was directly related to the overpressure. The greater the overpressure, the greater the distance of hydrocarbon migration. The maximum overpressure in the Chegu 25 well was located in the Es4 formation (the corresponding depth was about 4800 m). The maximum hydrocarbon migration distance was more than 800 m (Figure 8a), and this distance decreased rapidly with the distance away from the Chegu 25 well (Figure 8a).
During the process of increasing overpressure, hydraulic fracturing and shear fractures can occur in rocks, thus forming cracks or fracture systems [54,55]. Additionally, it can also re-activate or open pre-existing faults [52]. Taking the stress state of Point A in the Carboniferous (C) reservoir as an example (Figure 4 and Figure 8b), during the process of hydrocarbon generation (simulation time was 24 Ma), the pore fluid pressure of this point increased continuously, while the effective minimum principal stress ( σ 1 ) decreased from 60 MPa to 10 MPa. As a result, the risk of rock tensile fracture rose. When the effective minimum principal stress decreases to the tensile strength of the rock, it will lead to rock fracture. This also provides more channels for the propagation and dissipation of overpressure. In addition, we also analyzed the stress state of point B of the C571 fault and found that during the hydrocarbon generation process of 24 Ma, the mean effective stress ( σ m = σ 1 + σ 2 + σ 3 ) of this point decreased by about 2 MPa and the shear stress (q =   1 / 2 σ 1 σ 2 2 + σ 1 σ 3 2 + σ 2 σ 3 2 ) increased by about 11 MPa (the direction indicated by the arrow in Figure 8c). This shows that the risk of shear failure of rocks near the fault increased. Similarly, the risk of shear failure of rock at point C at the caprock stratum (Es2) also increased (Figure 8d). Consequently, the overpressure in this area had an upper limit. When this limit was reached, the overpressure caused the rock to break and form new cracks such that the overpressure was then reduced or dissipated.

5. Discussion

5.1. Effect of Fault Sealing on Hydrocarbon Accumulation

Hydrocarbon migration always moves from a high potential area to a low potential area, following the direction of minimum capillary resistance [52]. We observed hydrocarbons migrating down the fault due to overpressure when the fault was open and served as the primary pathway for migration. Studies showed that the geometry of the basin, the characteristics of the reservoir, and the drainage layer (such as inclination and relative permeability) will affect the migration rate and direction of hydrocarbons [55,56]. It can be seen from Figure 9 that hydrocarbons were generated in the Es3 and Es4 formations, and primarily migrated to both sides of the fault through the highly permeable Es3 formation. Due to its low porosity and low permeability, the flow rate of Es2 and Ed was significantly reduced, resulting in a noticeable sealing effect on the fluid migration.

5.2. Influence of Formation Permeability on Hydrocarbon Accumulation

In order to investigate and compare the influence of formation permeability on the model results, we utilized a high-permeability example (Table 1) to simulate the overpressure caused by the hydrocarbon generation process. During the continuous hydrocarbon generation process, there was no increase in overpressure, and overpressure dissipation occurred. When the simulation time reached 24 Ma, the overpressure had essentially dissipated and the pore fluid pressure had returned to almost the hydrostatic state (solid blue curve in Figure 10). This result is inconsistent with the existing research findings on petroleum exploration and development in the region. Hence, the permeability parameters of rock are very important to the hydrocarbon generation overpressure.

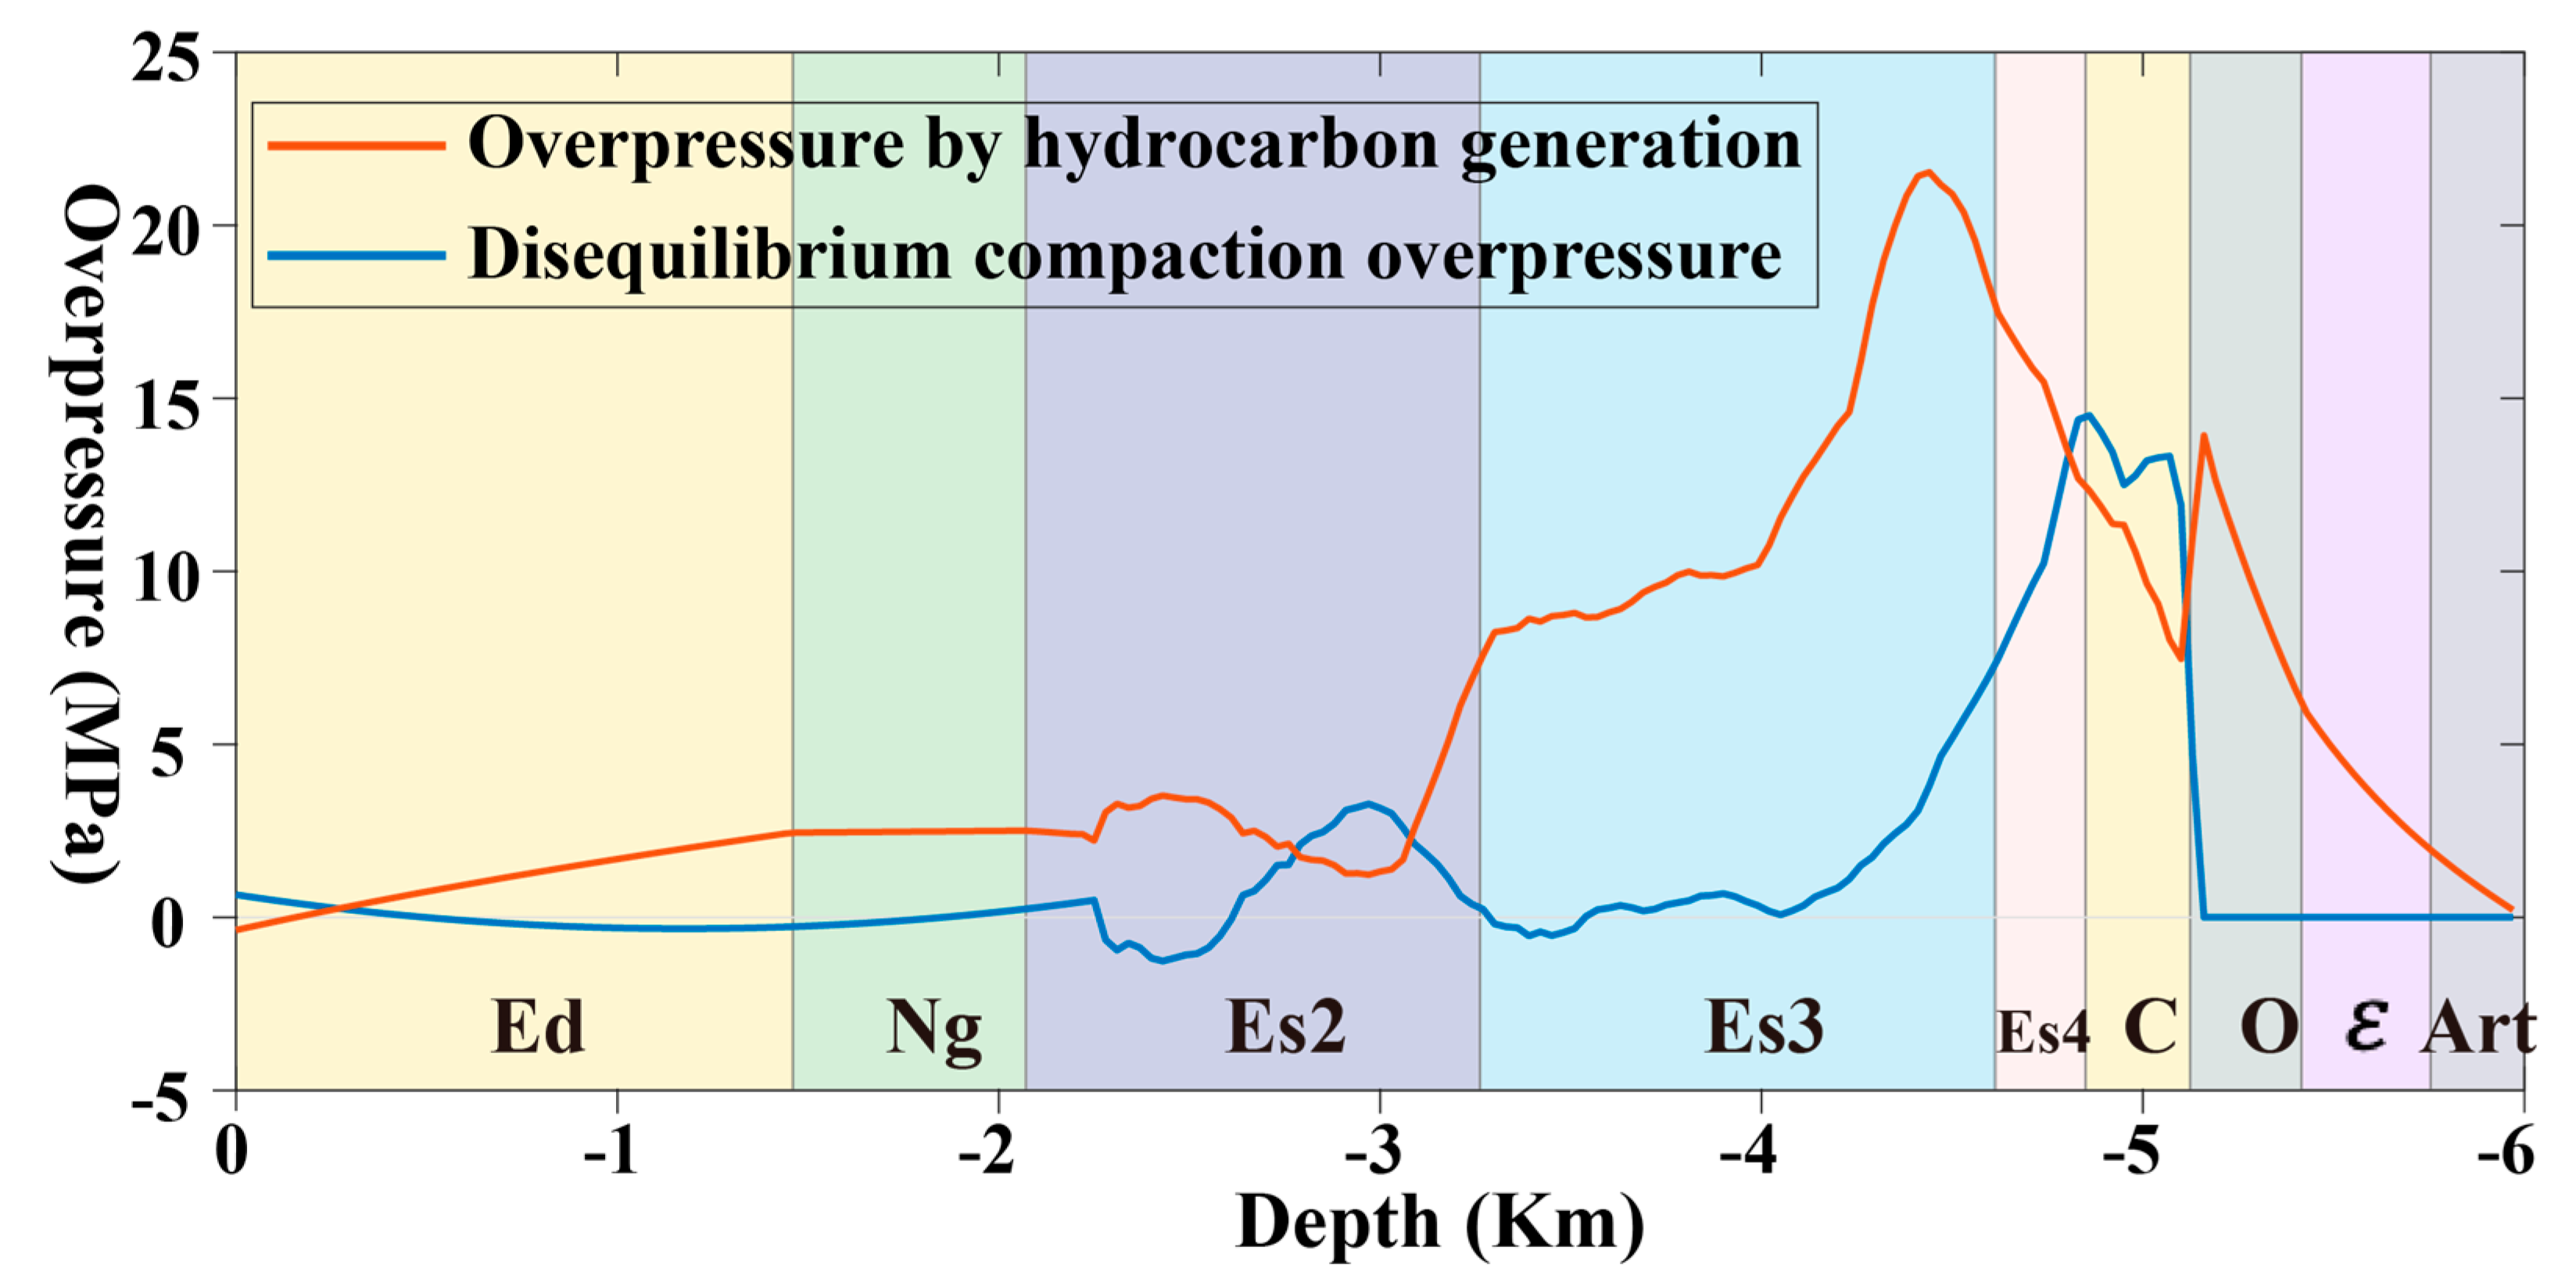
5.3. Quantitative Comparison of Hydrocarbon Generation Overpressure and Unbalanced Compaction Overpressure

We compared the unbalanced compaction overpressure with the hydrocarbon generation overpressure of the Chegu 25 well to assess the disparity in the contributions of hydrocarbon generation and unbalanced compaction to the overall overpressure in the formation (Figure 11). The results indicate that the overpressure value in the shallow strata (above 2800 m) was not big, typically less than 3 MPa. The total overpressure was mainly caused by hydrocarbon generation. The hydrocarbon generation overpressures in the Es3 and Es4 formations were much higher than the unbalanced compaction overpressure. The difference in overpressure generated by these two mechanisms even exceeded 10 MPa, as the formations (Es3 and Es4) were the main hydrocarbon generation positions. In the strata below the source rock, the fluid generated by hydrocarbon generation had difficulty migrating downward, resulting in a rapid decline in hydrocarbon-generated overpressure. In the Carboniferous strata (C), the hydrocarbon generation overpressure was lower than the unbalanced compaction overpressure. In deeper formations, the unbalanced compaction overpressure could not be accurately calculated because of the lack of logging data. Thus, the contribution of the two overpressure mechanisms to the total overpressure has not been discussed (Figure 11).
The comparison of the hydrocarbon overpressure and unbalanced compaction in this study can offer a viable approach to analyzing the composition of overpressure in strata via numerical simulation. However, this approach still has some limitations. Consequently, we utilized the normal compaction trend (NCT) method to calculate the overpressure resulting from unbalanced compaction, which calculates the overpressure by analyzing the relationship between the porosity and the vertical effective stress in sediments. Some previous studies pointed out that this method does not consider the effects of lateral deformation and shear-induced compaction when predicting pore pressure [37,57,58]. As a result, the calculated results would deviate from the actual overpressure (or pore pressure). In addition, this method has limitations in predicting the overpressure in deep formations. The porosity in deep formations will be very small or even negative (Figure A1b), which does not align with reality. Therefore, this method requires modification or improvement.

5.4. Model Limitations

The model used in this study only considered the two phases of fluid and solid; it did not consider the gas phase. Because the reservoir of the Chegu 25 block in the Chezhen Sag is a reservoir [15,59], it is appropriate to use this model to study the evolution of overpressure in this area and the effect of overpressure on oil and gas migration and accumulation. However, for gas reservoirs or gas-dominated reservoirs, the applicability of this model is limited because it does not consider the influence of gas generation on overpressure.

6. Conclusions

In this study, the pore fluid pressure field and stress field near the Chegu 25 block in the Chezhen Sag were investigated via numerical simulation, taking into account the two overpressure mechanisms of hydrocarbon generation and unbalanced compaction. Overall, the model evaluated the overpressure in different formations under these two mechanisms and verified the accuracy of the simulation calculations by comparing them with the results of the mud weight equivalent pressure and drill stem tests (DSTs). Additionally, in the process of simulating hydrocarbon generation, we analyzed the variations in the hydrocarbon accumulation modes for the four wells in the profile. This analysis provided evidence for the potential existence of the “upper source-lower reservoir” accumulation mode in the location of the Chegu 25 well. We also analyzed the necessary conditions for the existence of this accumulation mode. The simulation results show the following:
(1)
When a fault was open and had high permeability, it could serve as the major or dominant channel for hydrocarbon migration. Overpressure could then affect the direction and path of hydrocarbon migration. In the closed state of a fault, hydrocarbon migration was primarily driven by buoyancy, moving from deep source formations to shallow reservoirs, where it eventually accumulated. This process is characteristic of conventional petroleum reservoirs. Under the condition of a fault opening, hydrocarbons could not only be trapped in conventional reservoirs but could also migrate downward along the fault and eventually accumulate. Although this condition is more strict, this situation can still exist.
(2)
The overpressure could alter the direction and pathway of hydrocarbon migration, thereby promoting the migration of hydrocarbons and enhancing the efficiency of hydrocarbon accumulation. However, excessive pore fluid overpressure could lead to hydraulic fracturing or shear fractures in rocks, resulting in the formation of a fault system. This could cause the dissipation of hydrocarbons and prevent their accumulation.
(3)
The permeability of rock plays an important role in the generation and maintenance of overpressure and the mechanism of the accumulation mode. High-permeability rocks allowed for the rapid flow of hydrocarbons and rapid dissipation of overpressure, and did not form overpressure in the formation. In contrast, low-permeability rocks impeded the movement of hydrocarbons, causing them to accumulate slowly. This accumulation could lead to overpressure, which, in turn, promoted the downward migration and accumulation of hydrocarbons along faults.

Author Contributions

M.W.: planned and designed the research work, writing—original draft preparation; G.L.: software and methodology, writing—review and editing; F.Q., S.Z. and Z.L.: writing—review and editing; N.Y.: data processing. All authors have read and agreed to the published version of the manuscript.

Funding

This research was funded by the National Key R&D Program of the Ministry of Science and Technology of China with the Project “Integration Platform Construction for Joint Inversion and Interpretation of Integrated Geophysics (2018YFC0603500)”.

Data Availability Statement

The data are available from the corresponding author on reasonable request.

Conflicts of Interest

The authors declare no conflict of interest.

Appendix A

In sedimentary basins, the porosity of sediments decreases regularly with depth as long as the pore fluid remains hydrostatic [60]. We call this decrease in porosity with depth the normal compaction trend. In this case, porosity is directly related to the effective stress. When the unbalanced compaction produces overpressure, the variation curves in the acoustic time difference and porosity with depth will deviate from the trend under normal compaction, which is manifested as the measured porosity and is smaller than that under normal compaction [61,62,63].
The overpressure caused by unbalanced compaction can be expressed using the following formula [61]:
δ p z = δ ϕ z Φ 0 β 0 z ρ m ρ f g δ ϕ z d z ,
where ρ f is the fluid density that is related to the water saturation S w and gas density according to ρ g . ρ f   = S w ρ w + (1 − S w ), where ρ w is the water density. The organic matter type of source rocks in the middle and lower sub-members of Es3 is type I and the Ro value is 0.54~0.64%, which is kerogen with a high oil yield [23,59]. In the model of this study, we mainly focused on the formation mechanism of overpressure and its influence on hydrocarbon migration and accumulation. At the same time, in order to simplify the calculation, we only considered the phase state of water, the density of water instead of the density of oil, and did not consider the influence of gas on the overpressure evolution and hydrocarbon migration and accumulation. Therefore, we took S w = 1, that is, ρ f = ρ w .
The porosity profile can be calculated via density logging [64]:
ϕ = ρ m ρ ρ m ρ f .
In this study area, the Chegu 25 well is normally compacted in the depth range below 3600 m without abnormal pressure, and the overpressure occurs above 3600 m [24]. According to Formula (A3), the normal compaction curve of the Chegu 25 well (Figure A1b) and the values of ϕ 0 and z c can be obtained by using the porosity data above 3600 m for nonlinear regression analysis [61]. From the compaction curve of Figure A1b, according to the trend of the normal compaction curve below 4500 m, it can be observed that the porosity had a negative value (the green dotted line in Figure A1b), which contradicted the actual situation. André’s unbalanced compaction pressure prediction model may have certain limitations, which prevent its use from predicting pressure in deep strata. Therefore, we simplified the porosity below 4500 m and standardized it to 0.03 (the green solid line in Figure A1b). Due to the strong discreteness of the original data, we smoothed the porosity data (the red line Figure A1b):
Φ H z = 1 1 Φ 0 exp z z c ,
where ϕ H is the “hydrostatic porosity” and the characteristic depth z c is defined as
z c = 1 / Φ 0 β g ρ m ρ f .
According to Formula (A4), the average compression coefficient β was calculated by using the average uncompacted porosity ϕ 0 and characteristic depth z c .
We used the logging data of the Chegu 25 well to analyze the unbalanced compaction of the strata. Figure A1 shows the results of the density (DEN), acoustic time difference (AC), and neutron (CNL) logging data. The depth range of the logging data was 2300–5100 m. The model assumed that the strata above 2000 m were in the stress and pressure state of normal compaction. Based on the above data using formula (A1), we could obtain the pore pressure changes caused by unbalanced compaction (Figure A1b). The results embodied the fact that the overpressure produced by unbalanced compaction was relatively weak in Es2 (2700–3200 m), and the value was generally less than 3 MPa. The larger overpressure was found in the lower Es3 and below strata (4000–5100 m). The acoustic time difference, neutron, and density logging data in this depth range were all greater than the normal compaction curve, and the maximum overpressure value was close to 10 MPa (Figure A1b).
Figure A1. Logging data of the Cg25 well. (a) Density data. (b) Porosity data. (c) Neutron logging data. (d) Acoustic time difference data.
Processes 11 01976 g0a1

References

  1. Krayushkin, V.A. The plutonic oil-gas fields. Xinjiang Pet. Geol. 2009, 30, 136–141. (In Chinese) [Google Scholar]
  2. Jia, C.Z.; Pang, X.Q.; Jiang, F.J. Research status and development directions of hydrocarbon resources in China. Pet. Sci. 2016, 1, 2–23. [Google Scholar]
  3. Zou, C.N.; Tao, S.Z.; Bai, B.; Yang, Z.; Zhu, R.K.; Hou, L.H.; Yuan, X.J.; Zhang, G.S.; Wu, S.T.; Pang, Z.L.; et al. Differences and relations between unconventional and conventional Oil and Gas. China Pet. Explor. 2015, 20, 1–16. (In Chinese) [Google Scholar]
  4. Hunt, J.M. Generation and migration of petroleum from abnormally pressured fluid compartments. AAPG Bull. 1990, 74, 1–12. [Google Scholar]
  5. Hao, F.; Zou, H.Y.; Gong, Z.S.; Yang, S.G.; Zeng, Z.P. Hierarchies of overpressure retardation of organic matter maturation: Case studies from petroleum basins in China. AAPG Bull. 2007, 91, 1467–1498. [Google Scholar] [CrossRef]
  6. Li, C.; Zhang, L.; Luo, X.R.; Wang, B.; Lei, Y.H.; Cheng, M.; Luo, H.M.; Wang, C.J.; Yu, L. Modeling of Overpressure Generation–Evolution of the Paleogene Source Rock and Implications for the Linnan Sag, Eastern China. Front. Earth Sci. 2022, 10, 829322. [Google Scholar] [CrossRef]
  7. Chi, G.; Lavoie, D.; Bertrand, R.; Lee, M.K. Downward hydrocarbon migration predicted from numerical modeling of fluid overpressure in the Paleozoic Anticosti Basin, eastern Canada. Geofluids 2010, 10, 334–350. [Google Scholar] [CrossRef] [Green Version]
  8. Gao, C.W.; Luo, Q. A new plan for dividing source-reservoir-cap rock assemblage and its exploration meanings. Pet. Explor. Dev. 2022, 6, 29–31. [Google Scholar]
  9. Chi, Y.L.; Xiao, D.M.; Yin, J.Y. The Injection Pattern of Oil and Gas Migration and Accumulation in the Sanzhao Area of Songliao Basin. Acta Geol. Sin. 2000, 74, 371–377. (In Chinese) [Google Scholar]
  10. Lv, Y.F.; Li, J.M.; Fu, X.F.; Fu, G.; Wang, Y.G.; Xuan, C.J. Geologic conditions of oil gas downward discharging and exploration direction in the Sanzhao Sag, Songliao Basin. Chin. J. Geol. 2009, 2, 525–533. (In Chinese) [Google Scholar]
  11. Dubille, M.; Maury, G.; Al-Ali, S.A.K.; Alkhamiss, A. Downward Migration, Theory and Application to Najmah-Marrat Petroleum System. In Proceedings of the 79th EAGE Conference and Exhibition 2017, Paris, France, 12–15 June 2017; European Association of Geoscientists & Engineers: Utrecht, The Netherlands, 2017; Volume 2017, pp. 1–5. [Google Scholar]
  12. Tóth, J.; Maccagno, M.D.; Otto, C.J.; Rostron, B.J. Generation and migration of petroleum from abnormally pressured fluid compartments: Discussion. AAPG Bull. 1991, 75, 331–335. [Google Scholar]
  13. Zou, C.N.; Jia, C.Z.; Zhao, W.Z.; Tao, S.Z.; Gu, Z.D.; Hou, Q.J.; Zhao, Z.Y.; Song, L.Z. Accumulation dynamics and distribution of lithostratigraphic reservoirs in South Songliao Basin. Pet. Explo. Dev. 2005, 32, 2–20. [Google Scholar]
  14. Fu, G.; Wang, Y.G. Migration horizons downward of oil from k1-qn source rock of F, Y oil layer in sanzhao depression and its significance. Acta Sedimentol. Sin. 2008, 26, 355–360. (In Chinese) [Google Scholar]
  15. Xiang, L.H.; Hao, X.F. Hydrocarbon “downward migration” mechanism and maximum migration distance estimation in Chexi Sag. Spec. Oil Gas Reserv. 2016, 23, 34–37. (In Chinese) [Google Scholar]
  16. Shi, J.J.; Fu, G.; Li, L.L. The quantitative research of the downward migration distance and target horizons of K1 qn, oil and gas in Binbei area. Pet. Geol. Recovery Effic. 2009, 16, 26–29. (In Chinese) [Google Scholar]
  17. Feng, L.H. A method for upper and down expulsion hydrocarbon amount of overpressured sourcerock by interval transit time. J. Daqing Pet. Inst. 2007, 31, 22–24. (In Chinese) [Google Scholar]
  18. Zhuang, J.C.; Zhang, S.W.; Wang, Y.S.; Lin, H.X. Pressure fall model of hydrocarbon conducted by fault. Pet. Geol. Recovery Effic. 2008, 15, 46–48. (In Chinese) [Google Scholar]
  19. Wang, Y.S.; Shan, Y.X.; Lao, H.G. Physical Simulation of Oil and Gas Backflow and Its Geological Significance. J. Southwest Pet. Univ. (Sci. Technol. Ed.) 2014, 36, 45. (In Chinese) [Google Scholar]
  20. Luo, X.; Vasseur, G. Overpressure dissipation mechanisms in sedimentary sections consisting of alternating mud-sand layers. Mar. Pet. Geol. 2016, 78, 883–894. [Google Scholar] [CrossRef]
  21. Guo, X.; He, S.; Liu, K.; Song, G.; Wang, X.; Shi, Z. Oil generation as the dominant overpressure mechanism in the Cenozoic Dongying depression, Bohai Bay Basin, China. AAPG Bull. 2010, 94, 1859–1881. [Google Scholar] [CrossRef]
  22. Li, C.; Zhang, L.; Luo, X.R.; Lei, Y.H.; Yu, L.; Cheng, M.; Wang, Y.S.; Wang, Z.L. Overpressure generation by disequilibrium compaction or hydrocarbon generation in the Paleocene Shahejie Formation in the Chezhen Depression: Insights from logging responses and basin modeling. Mar. Pet. Geol. 2021, 133, 105258. [Google Scholar] [CrossRef]
  23. Wang, Y.L. Hydrocarbon Migration Dynamic Conditions and Accumulation Models of Lower Paleozoic in Chexi Area. Master’s Thesis, China University Petroleum (East China), Qingdao, China, 2016. (In Chinese). [Google Scholar]
  24. Li, C.; Luo, X.; Zhang, L.; Wang, B.; Guan, X.; Luo, H.; Lei, Y. Overpressure generation mechanisms and its distribution in the Paleocene Shahejie Formation in the Linnan sag, Huimin depression, eastern China. Energies 2019, 12, 3183. [Google Scholar] [CrossRef] [Green Version]
  25. Sun, Y.T.; Dong, L.F.; Liu, F.F.; Meng, T.; Zhang, B.; Shi, Q.Q. Tectonic evolution and dynamic origin mechanism in Chezhen Sag, Jiyang Depression (in Chinese). Chin. J. Geol. 2022, 57, 427–438. [Google Scholar]
  26. Liu, L.J.; Lin, C.S. The control effect of sedimentary filling patterns and fault slope break zones of sha 3 member of shahejie formation in Chezhen Sag, Jiyang Depression. J. Yangtze Univ. (Nat. Sci. Ed.) 2020, 17, 10–17. (In Chinese) [Google Scholar]
  27. Shang, L. Research on Developing Regularity of Multiperiod Structural Fractures in Futai Carbonate Buried Hill. Ph.D. Thesis, China University Petroleum (East China), Qingdao, China, 2014. (In Chinese). [Google Scholar]
  28. Wang, Y.S. Detachment buried-hill oil-gas reservoir forming pattern in half-graben fault depression lake basin-taking Futai oil field as example. Pet. Geol. Recovery Effic. 2004, 11, 13–15. (In Chinese) [Google Scholar]
  29. Liang, S.R. Geoburried-Hills Reservoir Characteristics and Forming-Mechanism in Chexi Are. Ph.D. Thesis, China University Petroleum (East China), Qingdao, China, 2007. (In Chinese). [Google Scholar]
  30. Jin, S.; Cao, H.; Wang, H.; Chen, S. The Paleogene multi-phase tectono-sedimentary evolution of the syn-rift stage in the Nanpu Sag, Bohai Bay Basin, East China. Energy Explor. Exploit. 2018, 36, 1519–1545. [Google Scholar] [CrossRef] [Green Version]
  31. Zhu, Y.G.; Jin, Q.; Zhang, Y.C.; Zhang, L.H.; Zhang, S.W.; Guo, C.C. Study on hydrocarbon generation system of Lower Tertiary Shahejie Formation in Chezhen depression. Nat. Gas Ind. 2006, 26, 19–22. (In Chinese) [Google Scholar]
  32. Zhang, J.Z.; Wang, Y.S.; Wang, X.J.; Cao, S.M.; Wang, X.F.; Bi, C.Q. Buried hill reservoir characteristic of the lower Palaeozoic in Futai oilfield. Pet. Geol. Recovery Effic. 2003, 04, 23–25+5. [Google Scholar]
  33. Ma, L.C.; Wang, Y.S.; Jing, A.Y. New understanding and discovery in exploration of Lower Paleozoic buried hills in Jiyang Depression, Bohai Bay Basin. Pet. Geol. Recovery Effic. 2021, 28, 10–16. (In Chinese) [Google Scholar]
  34. Xue, H.T.; Lu, S.F.; Zhang, X.J.; Li, Z.; Shen, J.N. Evaluation of Lower Paleozoic carbonate source rocks in Jiyang depression. Geochimica 2006, 35, 609–614. [Google Scholar]
  35. Chester, F.M.; Evans, J.P.; Biegel, R.L. Internal structure and weakening mechanisms of the San Andreas fault. J. Geophys. Res.-Solid Earth 1993, 98, 771–786. [Google Scholar] [CrossRef]
  36. Caine, J.S.; Evans, J.P.; Forster, C.B. Fault zone architecture and permeability structure. Geology 1996, 24, 1025–1028. [Google Scholar] [CrossRef]
  37. Liao, Z.H.; Liu, H.; Carpenter, B.M.; Marfurt, K.J.; Reches, Z.E. Analysis of fault damage zones using three-dimensional seismic coherence in the Anadarko Basin, Oklahoma. AAPG Bull. 2019, 103, 1771–1785. [Google Scholar] [CrossRef]
  38. Gao, B.; Flemings, P.B. Pore pressure within dipping reservoirs in overpressured basins. Mar. Pet. Geol. 2017, 80, 94–111. [Google Scholar] [CrossRef]
  39. Luo, G.; Flemings, P.B.; Hudec, M.R.; Nikolinakou, M.A. The role of pore fluid overpressure in the substrates of advancing salt sheets, ice glaciers, and critical-state wedges. J. Geophys. Res.-Solid Earth 2015, 120, 87–105. [Google Scholar] [CrossRef]
  40. Chen, J.Y.; Yang, X.S.; Dang, J.X.; He, C.R.; Zhou, Y.S.; Ma, S.L. Internal structure and permeability of Wenchuan earthquake fault (in Chinese). Chin. J. Geophys. 2011, 54, 1805–1816. [Google Scholar]
  41. Zhang, J.L.; He, S.; Wang, Y.Q.; Hao, X.F.; Luo, S.Y.; Li, P.; Dang, X.W.; Yang, R.Z. Main mechanism for generating overpressure in the Paleogene source rock series of the Chezhen depression, Bohai Bay Basin. J. Earth Sci. 2019, 30, 775–787. [Google Scholar] [CrossRef]
  42. Feng, J.; Qu, J.; Wan, H.; Ren, Q.Q. Quantitative prediction of multiperiod fracture distributions in the Cambrian-Ordovician buried hill within the Futai Oilfield, Jiyang Depression, East China. J. Struct Geol. 2021, 148, 104359. [Google Scholar] [CrossRef]
  43. Wu, G.C.; Zhao, X.L.; Tang, J.; Du, Z.Y. First-order perturbation approximation for rock elastic moduli in transversely isotropic media. Sci. China Earth Sci. 2017, 60, 1645–1654. [Google Scholar] [CrossRef]
  44. Duan, Q.B.; Yang, X.S.; Chen, J.Y. A preliminary experimental study on permeability of samples collected from Wenchuan earthquake fault zone. Prog. Earthq. Sci. 2012, 6, 55. [Google Scholar]
  45. Terzaghi, K. Theoretical Soil Mechanics; John Wiley and Sons, Inc.: New York, NY, USA, 1948. [Google Scholar]
  46. Nur, A.; Byerlee, J.D. An exact effective stress law for elastic deformation of rock with fluids. J. Geophys. Res. 1971, 76, 6414–6419. [Google Scholar] [CrossRef]
  47. Fjaer, E.; Holt, R.M.; Horsrud, P.; Raaen, A.M. Petroleum Related Rock Mechanics; Elsevier: Amsterdam, The Netherlands, 1992; Volume 33. [Google Scholar]
  48. Chang, C.; Luo, G.; Wang, M.W.; Sun, Y.Q. Near-salt perturbations of stresses and pore fluid pressures and their impacts on wellbore stability in the Kuqa depression of the Tarim Basin, China. Interpretation 2020, 8, SG33–SG49. [Google Scholar] [CrossRef]
  49. Joshua, P.E. Coupled Fluid Flow and Geomechanical Modeling of Fault Activated Induced Seismicity. Ph.D. Thesis, Texas A&M University, College Station, TX, USA, 2018. [Google Scholar]
  50. Zhang, H.Y. Fluid Mechanics; Science Press: Beijing, China, 2004. [Google Scholar]
  51. Simulia. Abaqus, a General Purpose Finite Element Analysis Code: Dassault Systémes Simulia Corp. 2016. Available online: https://www.simulia.com (accessed on 18 December 2018).
  52. Yu, L.G. The FEM simulating of hydrocarbon migration in dongying depression. Master’s Thesis, China University Petroleum (East China), Qingdao, China, 2007. (In Chinese). [Google Scholar]
  53. Xie, X.N.; Li, S.T.; Liu, X.F. Fluid Dynamics of Abnormal Pressure Basin; China University of Geosciences Press: Beijing, China, 2006. [Google Scholar]
  54. Hubbert, M.K.; Willis, D.G. Mechanics of hydraulic fracturing. Trans. AIME 1957, 210, 153–168. [Google Scholar] [CrossRef]
  55. Osiptsov, A.A. Fluid mechanics of hydraulic fracturing: A review. J. Pet. Sci. Eng. 2017, 156, 513–535. [Google Scholar] [CrossRef]
  56. Pratsch, J.C. Focused gas migration and concentration of deep-gas accumulations. Erdoel Kohle Erdgas Petrochem. Brennst.-Chem. (Ger. Fed. Repub.) 1982, 35, 59–65. [Google Scholar]
  57. Hindle, A.D. Petroleum migration pathways and charge concentration: A three-dimensional model. AAPG Bull. 1997, 81, 1451–1481. [Google Scholar]
  58. Luo, G.; Hudec, M.R.; Flemings, P.B. Deformation, stress, and pore pressure in an evolving suprasalt basin. J. Geophys. Res.-Solid Earth 2017, 122, 5663–5690. [Google Scholar] [CrossRef]
  59. Xiang, L.H.; Wang, X.J.; Hao, X.F.; Li, X.Y. The study of reservoir forming conditions about hc migration downward in chexi sag. Offshore Oil 2013, 33, 42–47. (In Chinese) [Google Scholar]
  60. Nikolinakou, M.A.; Heidari, M.; Flemings, P.B. Geomechanical modeling of pore pressure in evolving salt systems. Mar. Pet. Geol. 2018, 93, 272–286. [Google Scholar] [CrossRef]
  61. Revil, A.; Pezard, P.A.; de Larouzière, F.D. 10. Fluid overpressures in western mediterranean sediments. SITES 974–979 1999, 48, 697–709. [Google Scholar]
  62. Tingay, M.R.; Hillis, R.R.; Swarbrick, R.E.; Morley, C.K.; Damit, A.R. Origin of Overpressure and Pore-Pressure Prediction in the Baram Province, Brunei. AAPG Bull. 2009, 93, 51–74. [Google Scholar] [CrossRef]
  63. Sharp, J.M. Momentum and Energy Balance Equations for Compacting Sediments. J. Int. Assoc. Math. Geol. 1976, 98, 305–322. [Google Scholar] [CrossRef]
  64. Rubey, W.W.; Hubbert, M.K. Role of fluid pressure in mechanics of overthrust faulting, II. Overthrust Belt in geosynclinal area of western Wyoming in light of fluid-pressure hypothesis. AAPG Bull. 1959, 70, 167–205. [Google Scholar]
Figure 1. Geological map and seismic profile results of the study area. (a) Location of the Chezhen Sag. (b) Tectonic units, major fault, and well distribution of the Chezhen Sag. (c) Seismic profile results of the study area. (d) Results of the seismic profile interpretation.
Processes 11 01976 g001
Figure 2. The dual structure of fault- and fault-sealing-related data. (a) Buried hill carbonate outcrops. (b) The dual structure of the fault. (c,d) Core data of the fault zones, Inside the elliptical box are dissolution cavities.
Processes 11 01976 g002
Figure 3. Fault throws explained by fault coherence attributes.
Processes 11 01976 g003
Figure 4. Finite element model setting of the hydrocarbon generation process. (a) Finite element meshes and boundary conditions. The red dotted line area shows the location of the hydrocarbon-generating strata. (b) The left and right pore fluid pressure boundary of the model was the hydrostatic pore pressure boundary. (c,d) The initial pore fluid pressure field of the model.
Processes 11 01976 g004
Figure 5. Overpressure caused by the unbalanced compaction of four wells in the study area. (a) Overpressure of the Chegu 25 well. (b) Overpressure of the Che 571 well. (c) Overpressure of the Che 572 well. (d) Overpressure of the Chegu 209 well. The red solid curve represents the overpressure interpreted using the mud weight data. The black solid curve represents the overpressure caused by the unbalanced compaction, as interpreted using logging data. The asterisk indicates the overpressure interpreted using drill stem tests (DSTs). The results in (c,d) were modified from Wang, 2016 [23].
Processes 11 01976 g005
Figure 6. Simulation of the current pore fluid overpressure and fluid velocity field results. (a) Simulated present overpressure results. (b) Simulated current fluid velocity field results.
Processes 11 01976 g006aProcesses 11 01976 g006b
Figure 7. The pore pressure profiles of four wells in the study area. (a) The Chegu 25 well pore pressure simulation results. (b) The Che 571 well pore pressure simulation results. (c) The Chegu 204 well pore pressure simulation results. (d) The Chegu 201 well pore pressure simulation results. The asterisk represents the pore pressure value obtained using the DSTs. The plus sign represents the pore pressure result interpreted using the mud weight data, and the overpressure result was equal to the simulated pore fluid pressure minus the hydrostatic pore pressure.
Processes 11 01976 g007
Figure 8. The simulation results of the local pressure, stress, and oil and gas backflow distance. (a) The maximum hydrocarbon downward migration distance near the maximum overpressure position (about 4800 m) of the Chegu 25 well. DMD represents the downward migration distance. (b) The evolution of the overpressure at point A with time. (c) The stress state change of point B at the fault. The arrow indicates the increase in simulation time. (d) The stress state change of point C at the caprock layer. The arrow indicates the increase in simulation time. The location of the maximum overpressure area in the Chegu 25 well, and the three points of A, B, and C are shown in Figure 4a.
Processes 11 01976 g008
Figure 9. Flow velocity diagram of the fault-sealing model.
Processes 11 01976 g009
Figure 10. Pore fluid pressure change in the Chegu 25 well. The asterisk represents the pore pressure value obtained using the DSTs. The plus sign represents the pore pressure result interpreted using the mud weight. The overpressure result was equal to the simulated pore fluid pressure minus the hydrostatic pressure.
Processes 11 01976 g010
Figure 11. Comparison of hydrocarbon generation overpressure and unbalanced compaction overpressure in the Chegu25 well section. The orange curve represents the overpressure caused by hydrocarbon generation. The blue curve represents the overpressure caused by unbalanced compaction.
Processes 11 01976 g011
Disclaimer/Publisher’s Note: The statements, opinions and data contained in all publications are solely those of the individual author(s) and contributor(s) and not of MDPI and/or the editor(s). MDPI and/or the editor(s) disclaim responsibility for any injury to people or property resulting from any ideas, methods, instructions or products referred to in the content.

