
Development of an MCTS Model for Hydrogen Production Optimisation

 , ,
, ,  ,
,  and
and
Abstract
1. Introduction
- Advanced Process Control (APC): APC techniques involve using sophisticated algorithms and models to optimise the performance of electrolysis processes [27]. These methods take into account various process parameters and use real-time data to adjust operating conditions and optimise energy efficiency.
- Model Predictive Control (MPC): MPC is an advanced control strategy that uses mathematical models of the process to predict its behaviour and optimise control actions [28]. By considering process constraints and objectives, MPC can determine the optimal setpoints for various process variables, such as temperature, current density and electrolyte flow rate.
- Machine Learning and Artificial Intelligence (AI): Machine learning and AI techniques have gained significant attention in process control applications. These methods involve developing models and algorithms that can learn from data and make predictions or control decisions. By utilizing historical data and real-time measurements, machine learning algorithms can optimise the electrolysis process and improve its performance [29].
2. Materials and Methods
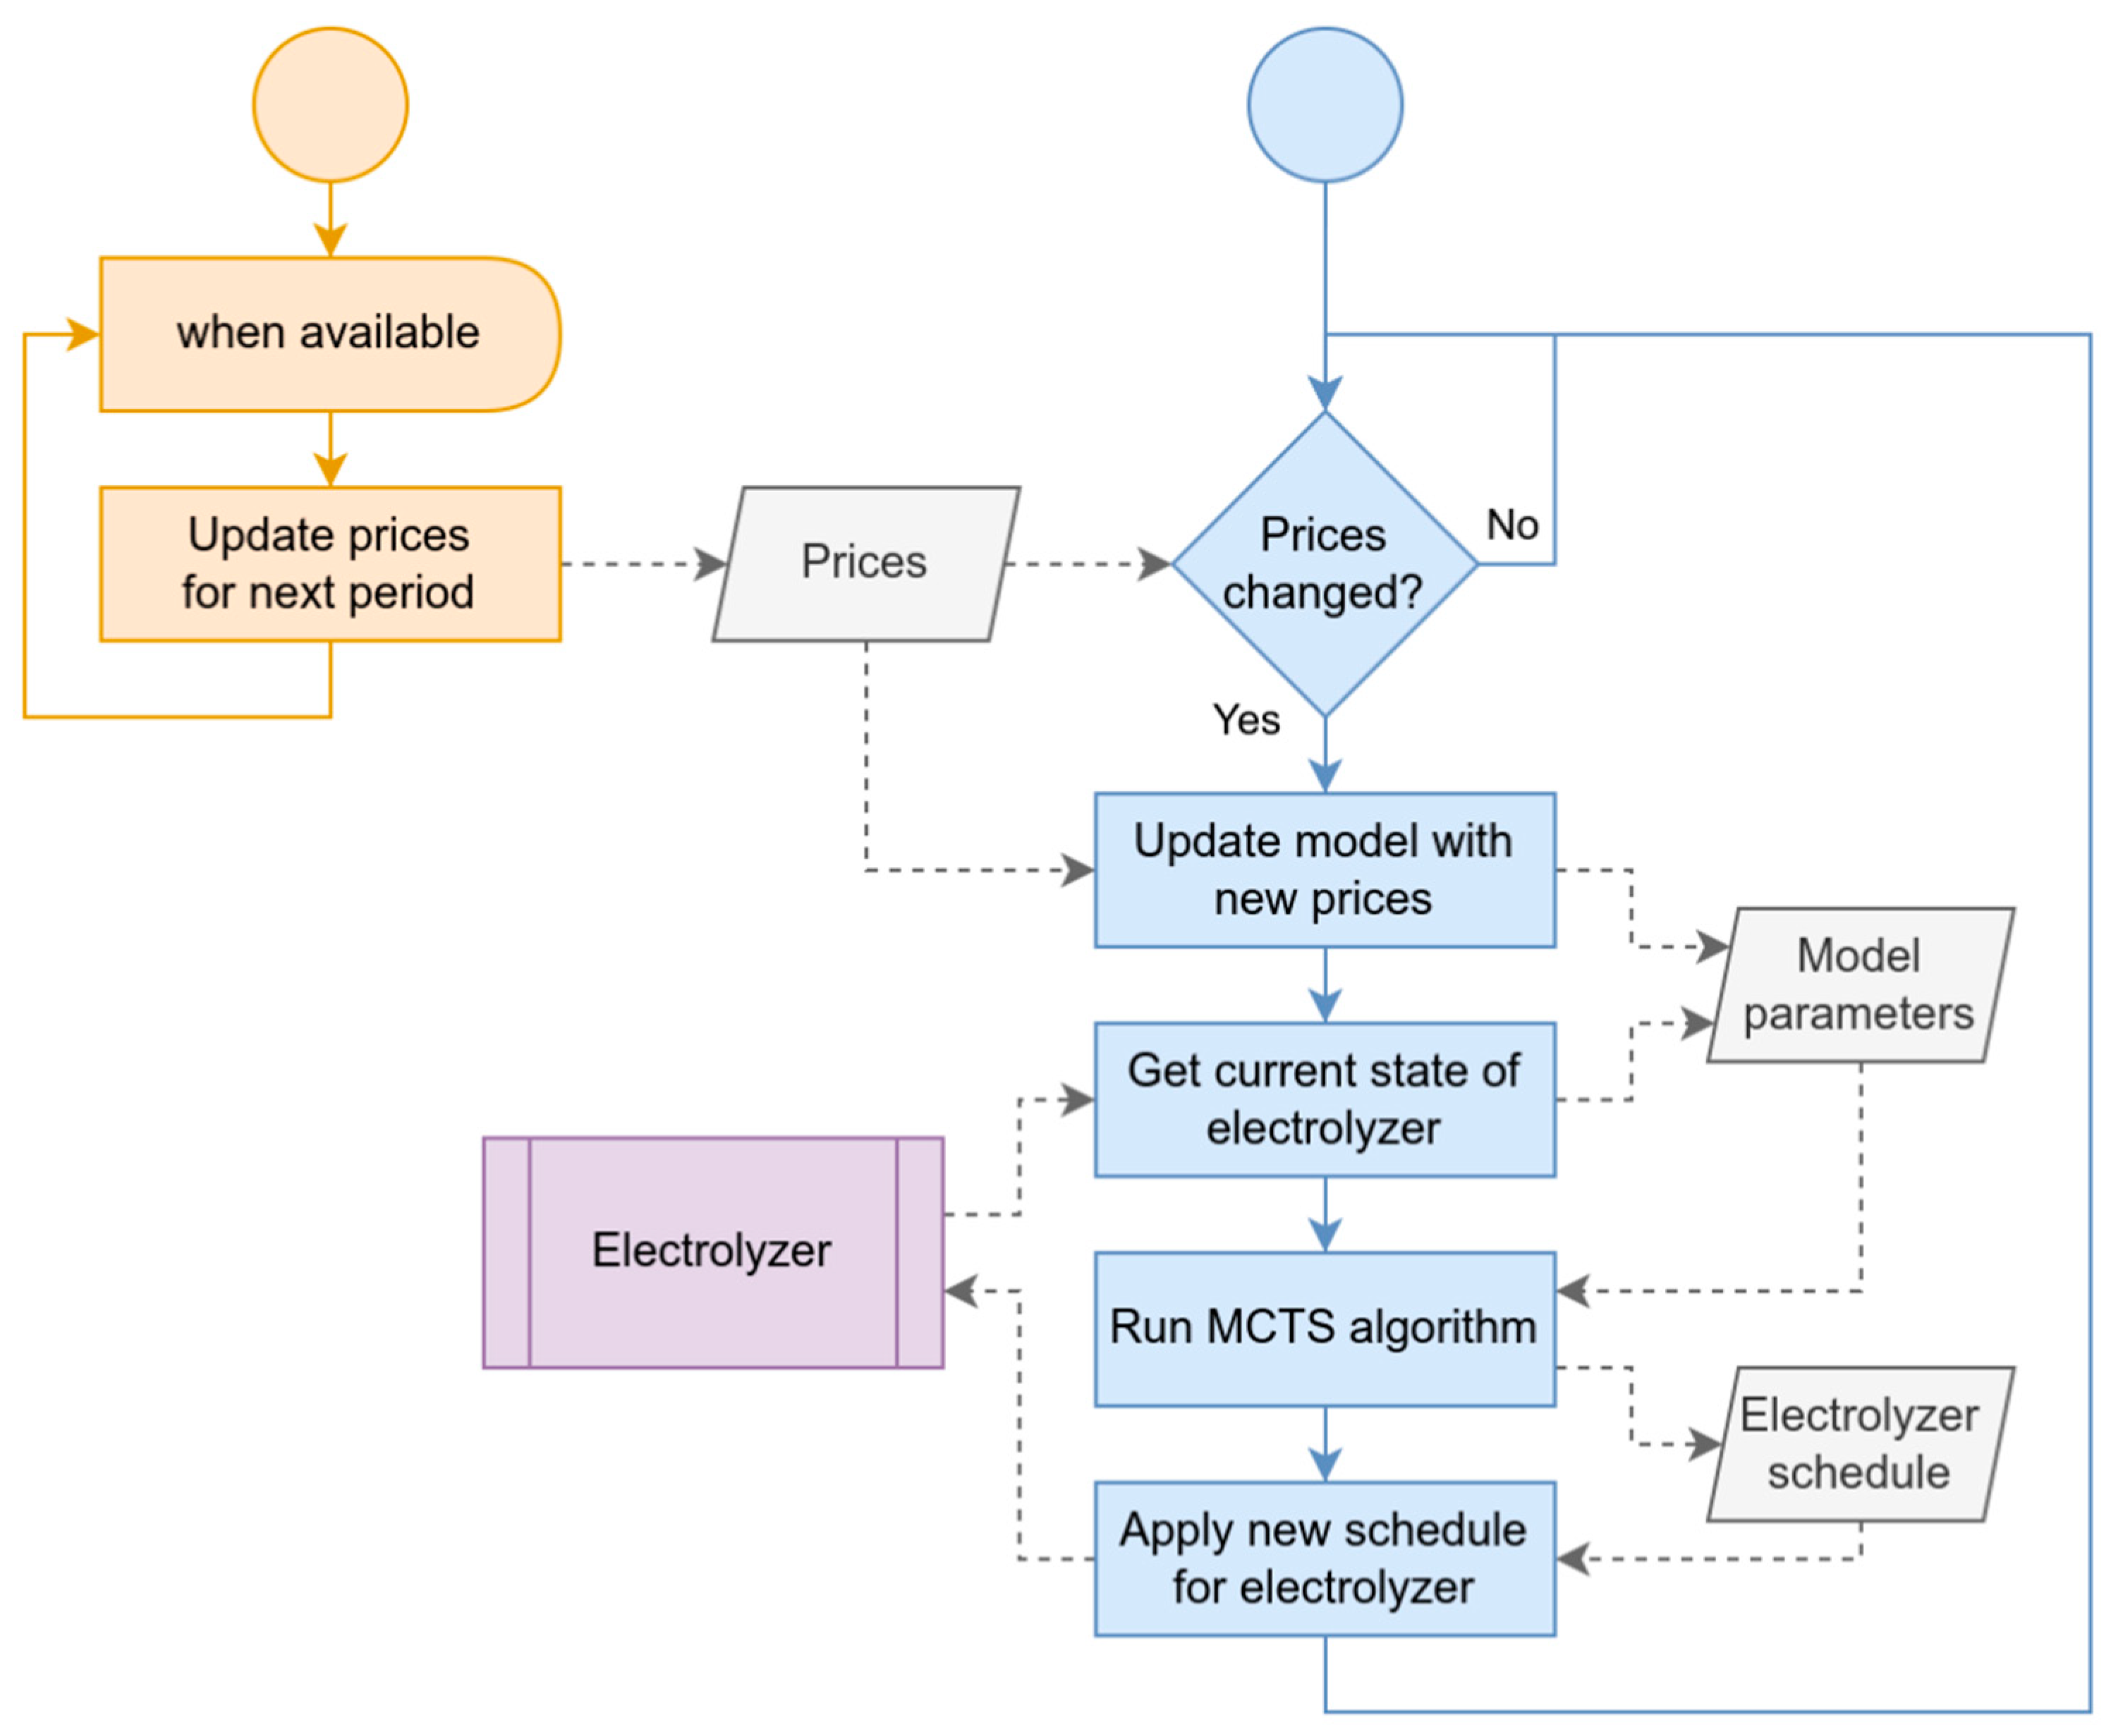
2.1. Electricity-Price-Based Electrolyser Control
2.2. Electrolyser Schedule Optimisation Using the MCTS Algorithm
2.3. Optimisation Problem Setup
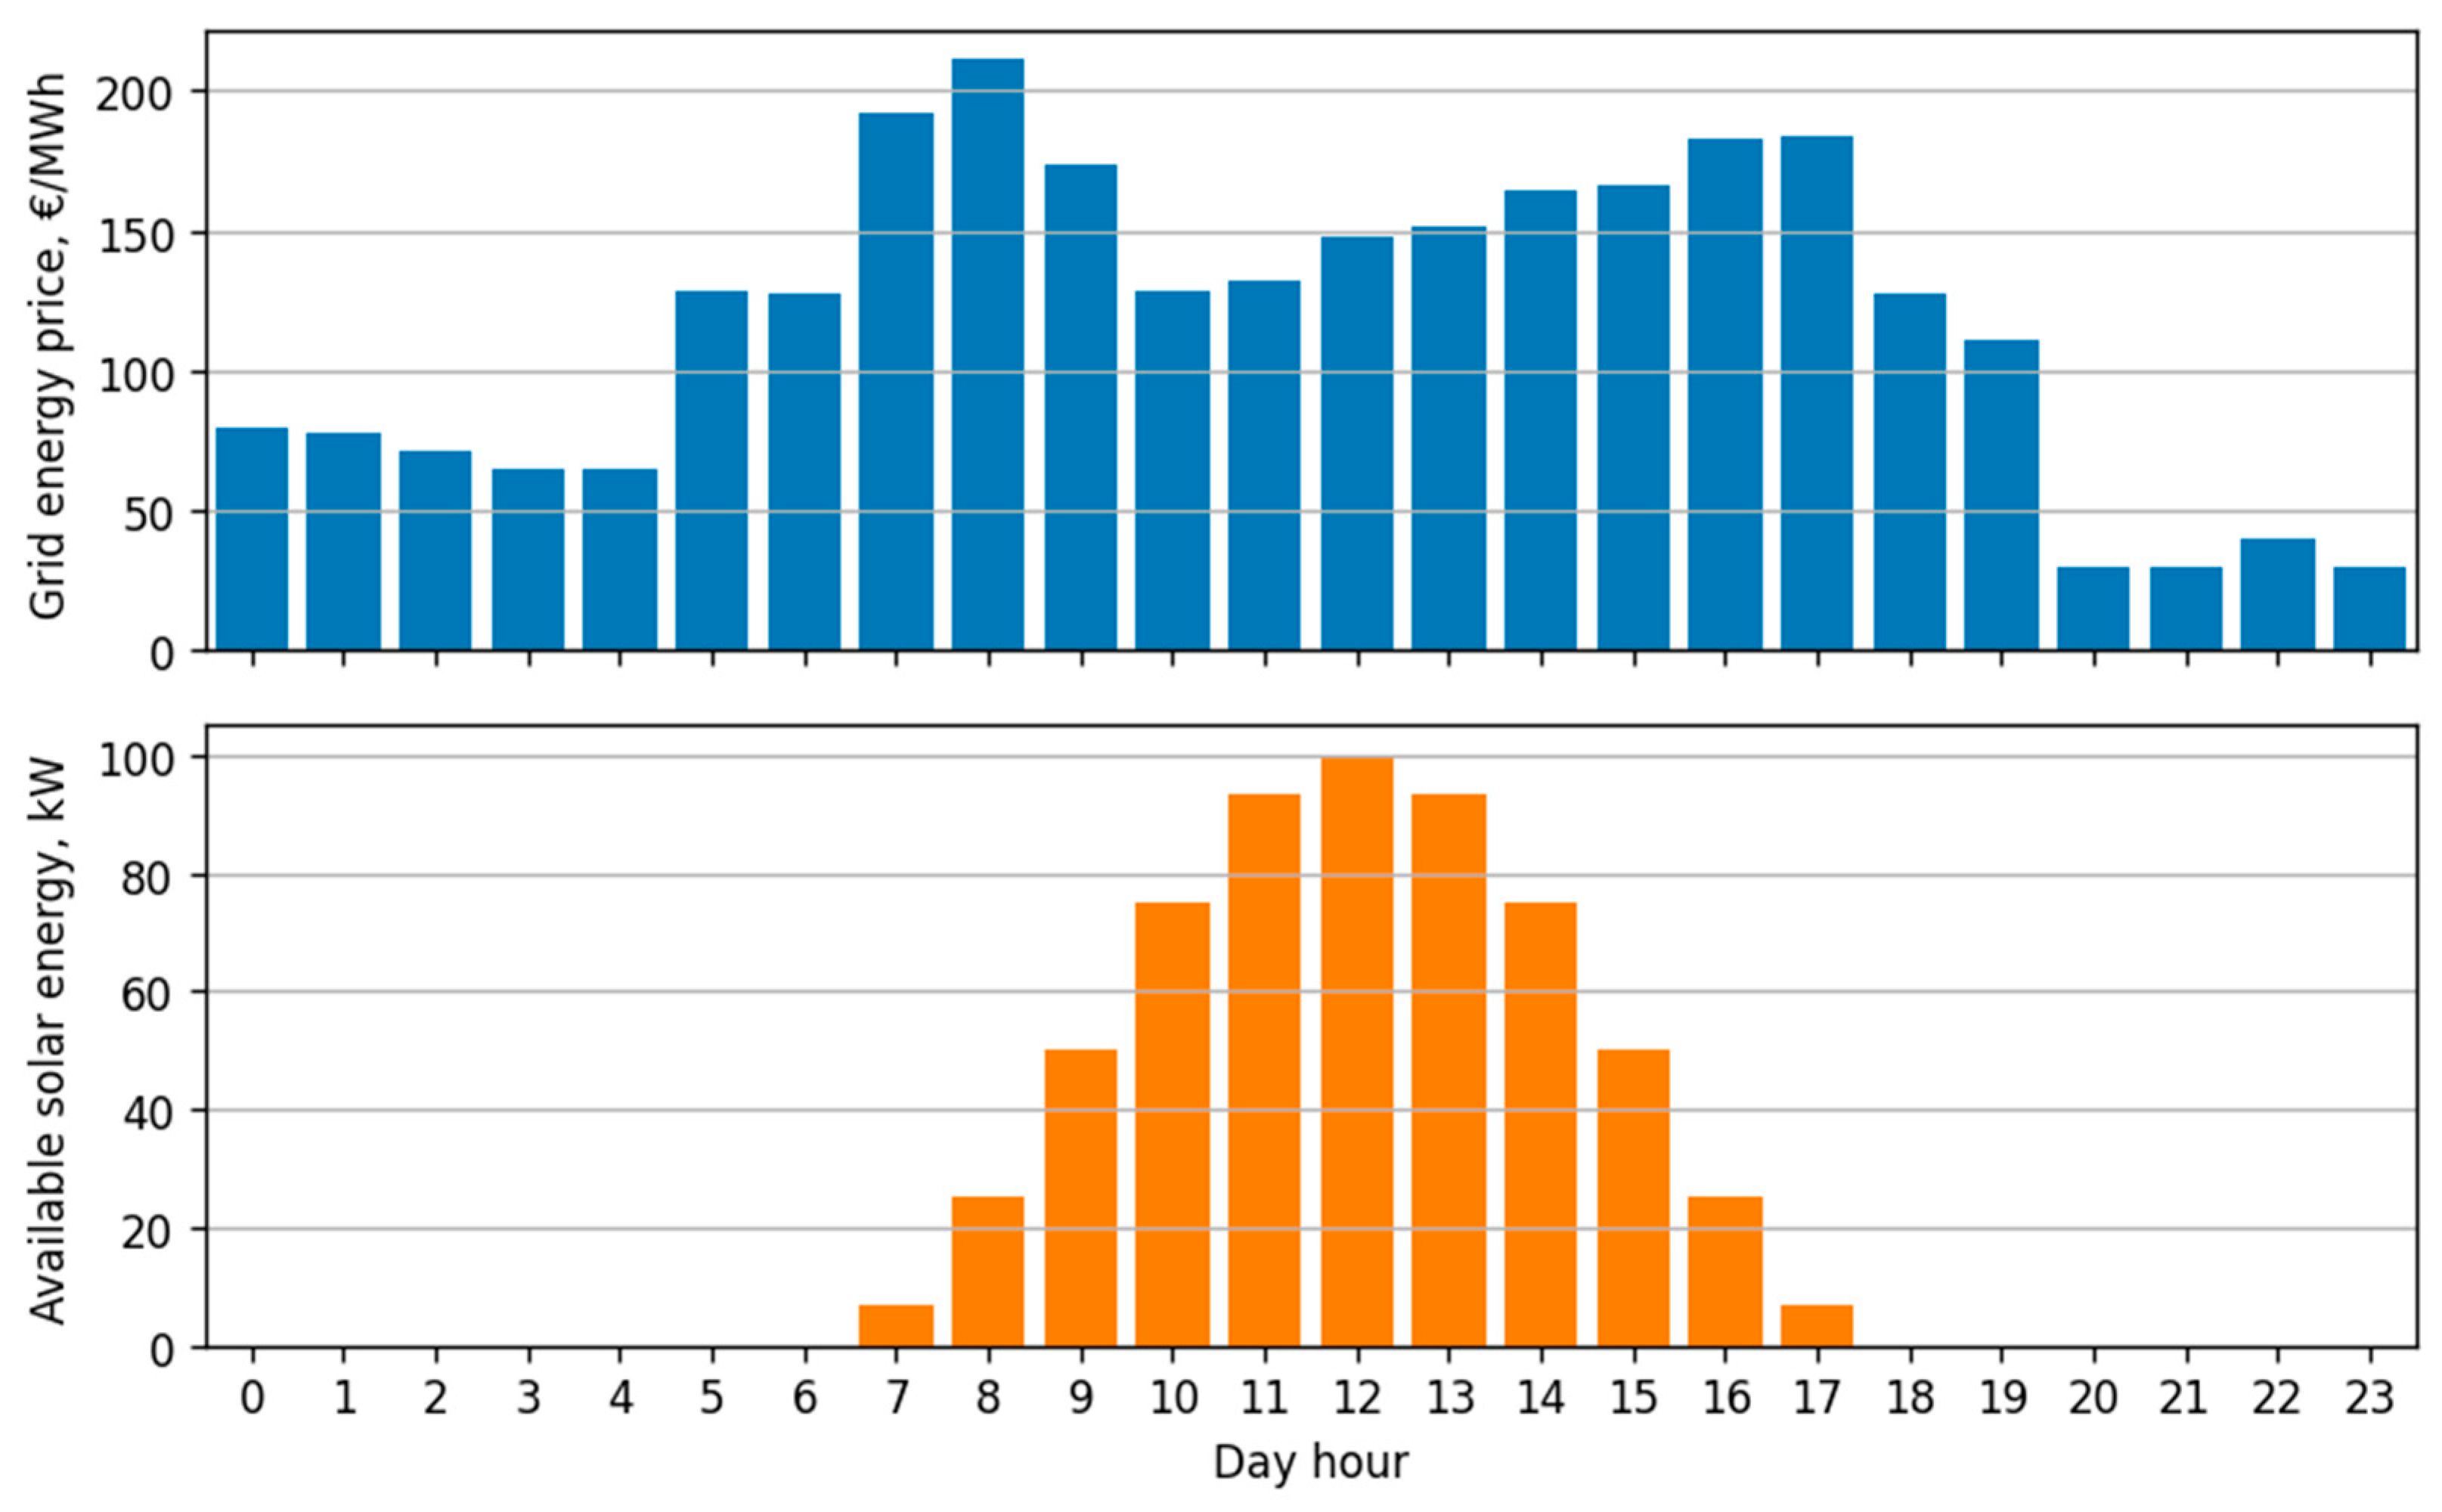
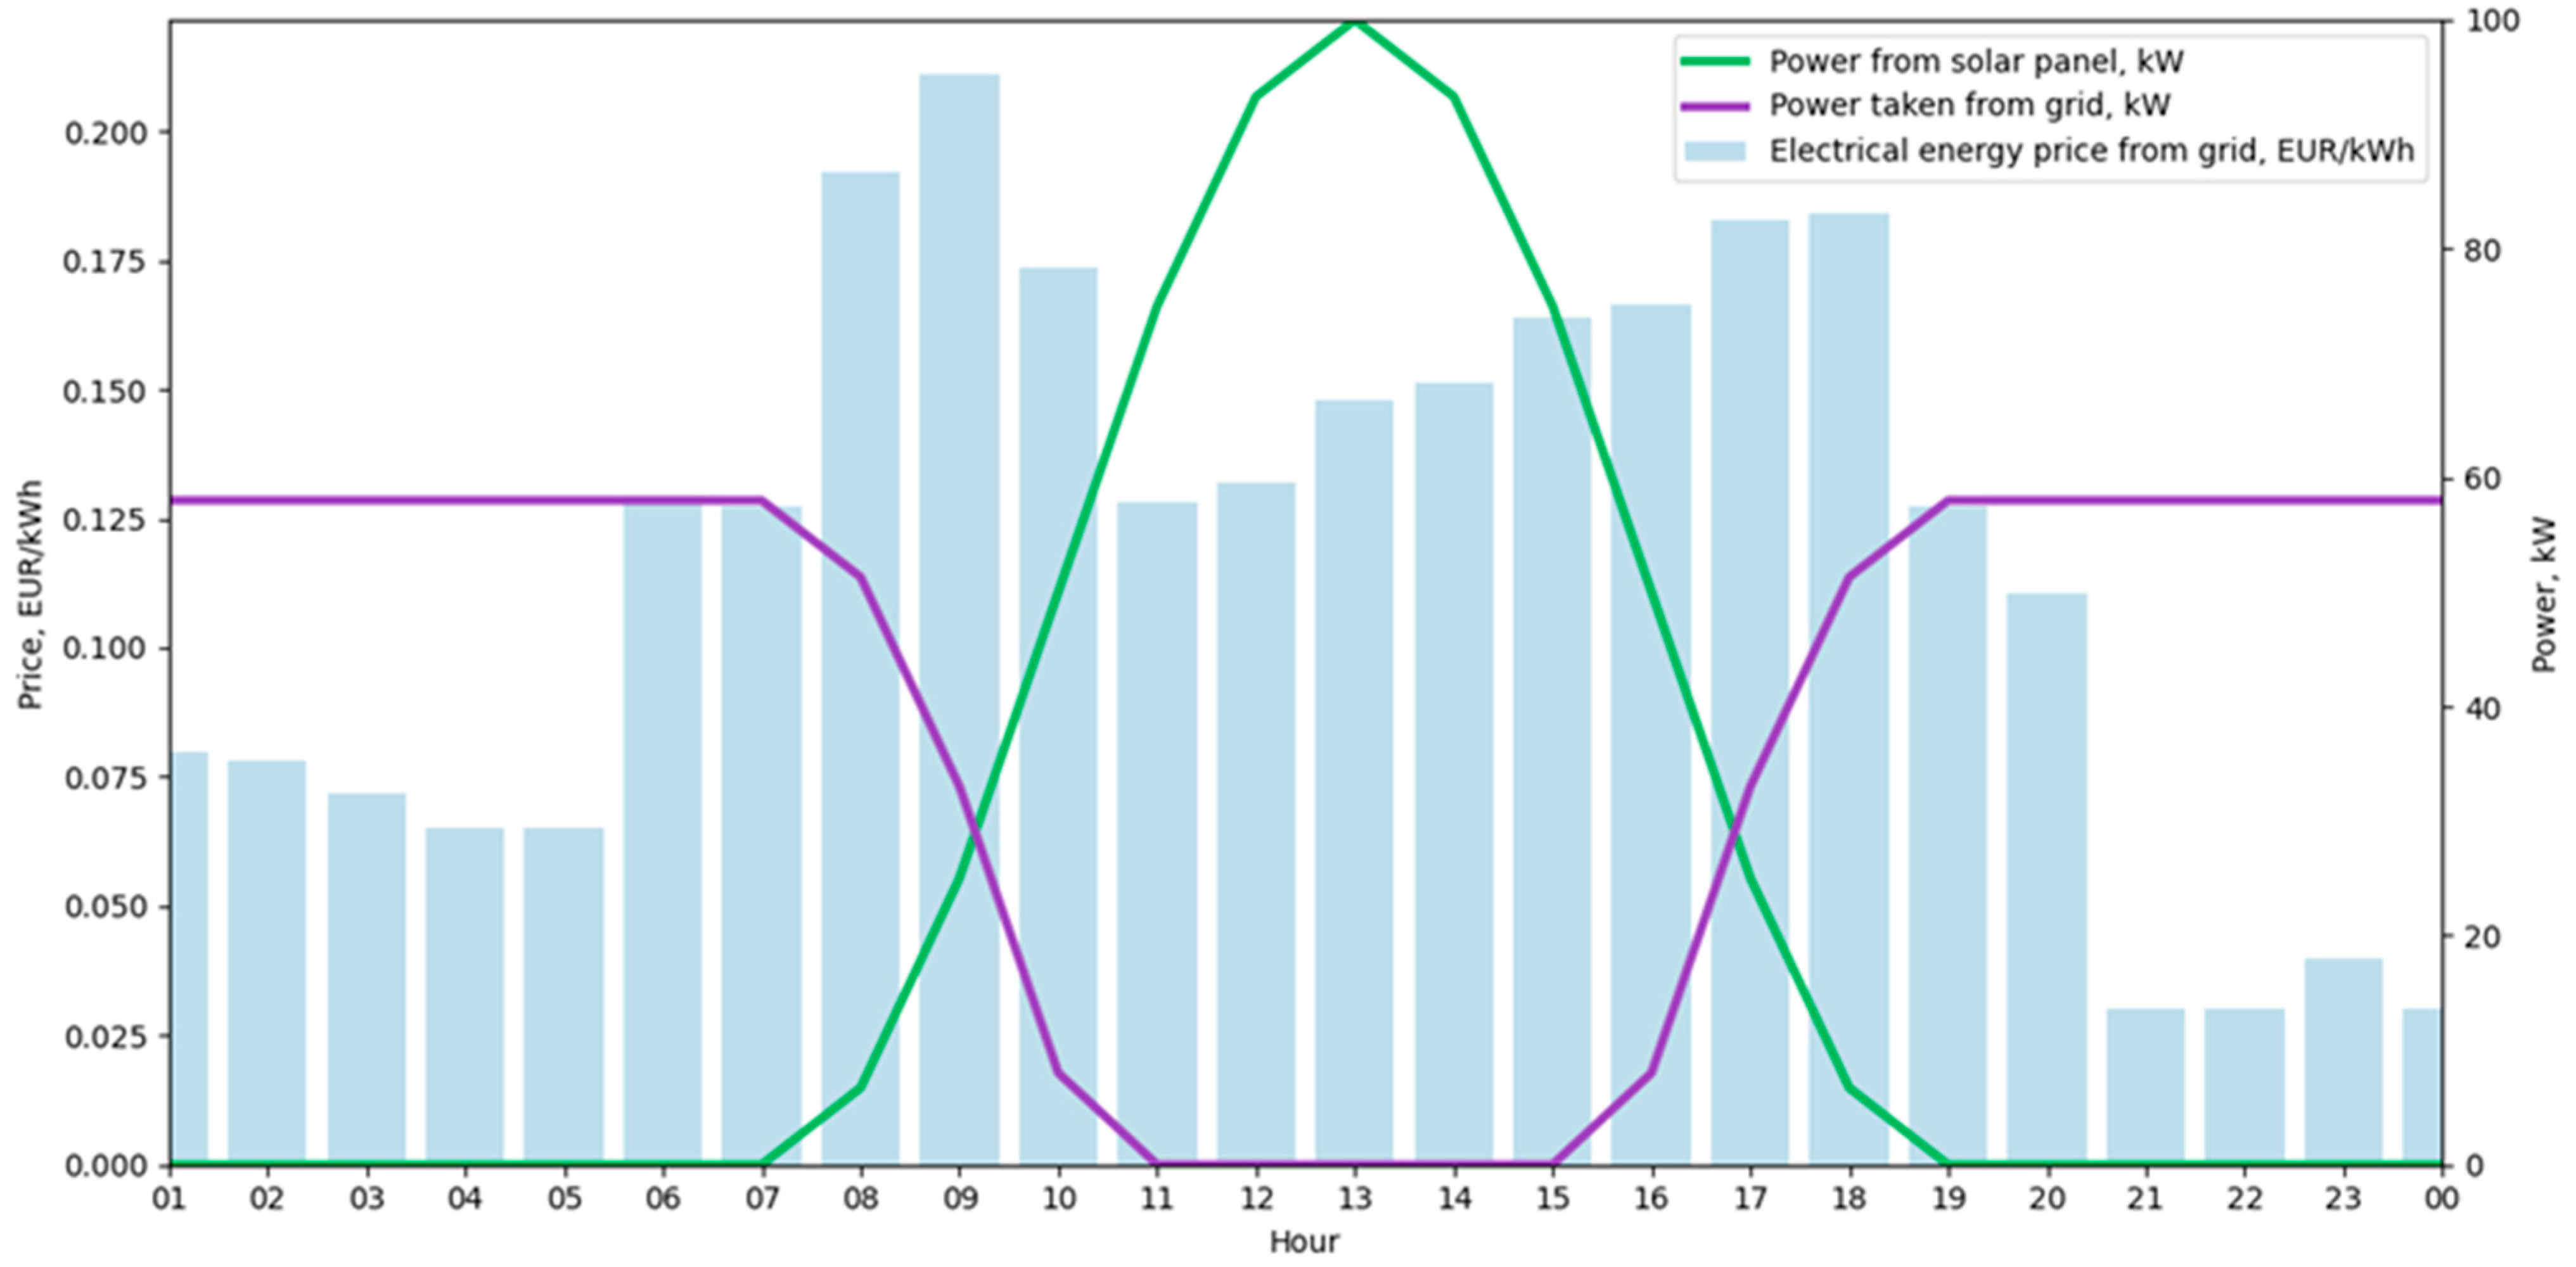
- An array of photovoltaic solar (PV) cells with a maximum capacity of 100 kW of energy. This represents a source of renewable energy with available excess power that varies over the day.
- The relative solar irradiation is modelled for a 12 h long light day, which roughly corresponds to the spring or fall equinoxes. Depending on the actual day of the year and the latitude the solar declination angle will change further, affecting the solar irradiation captured by the PV cells.
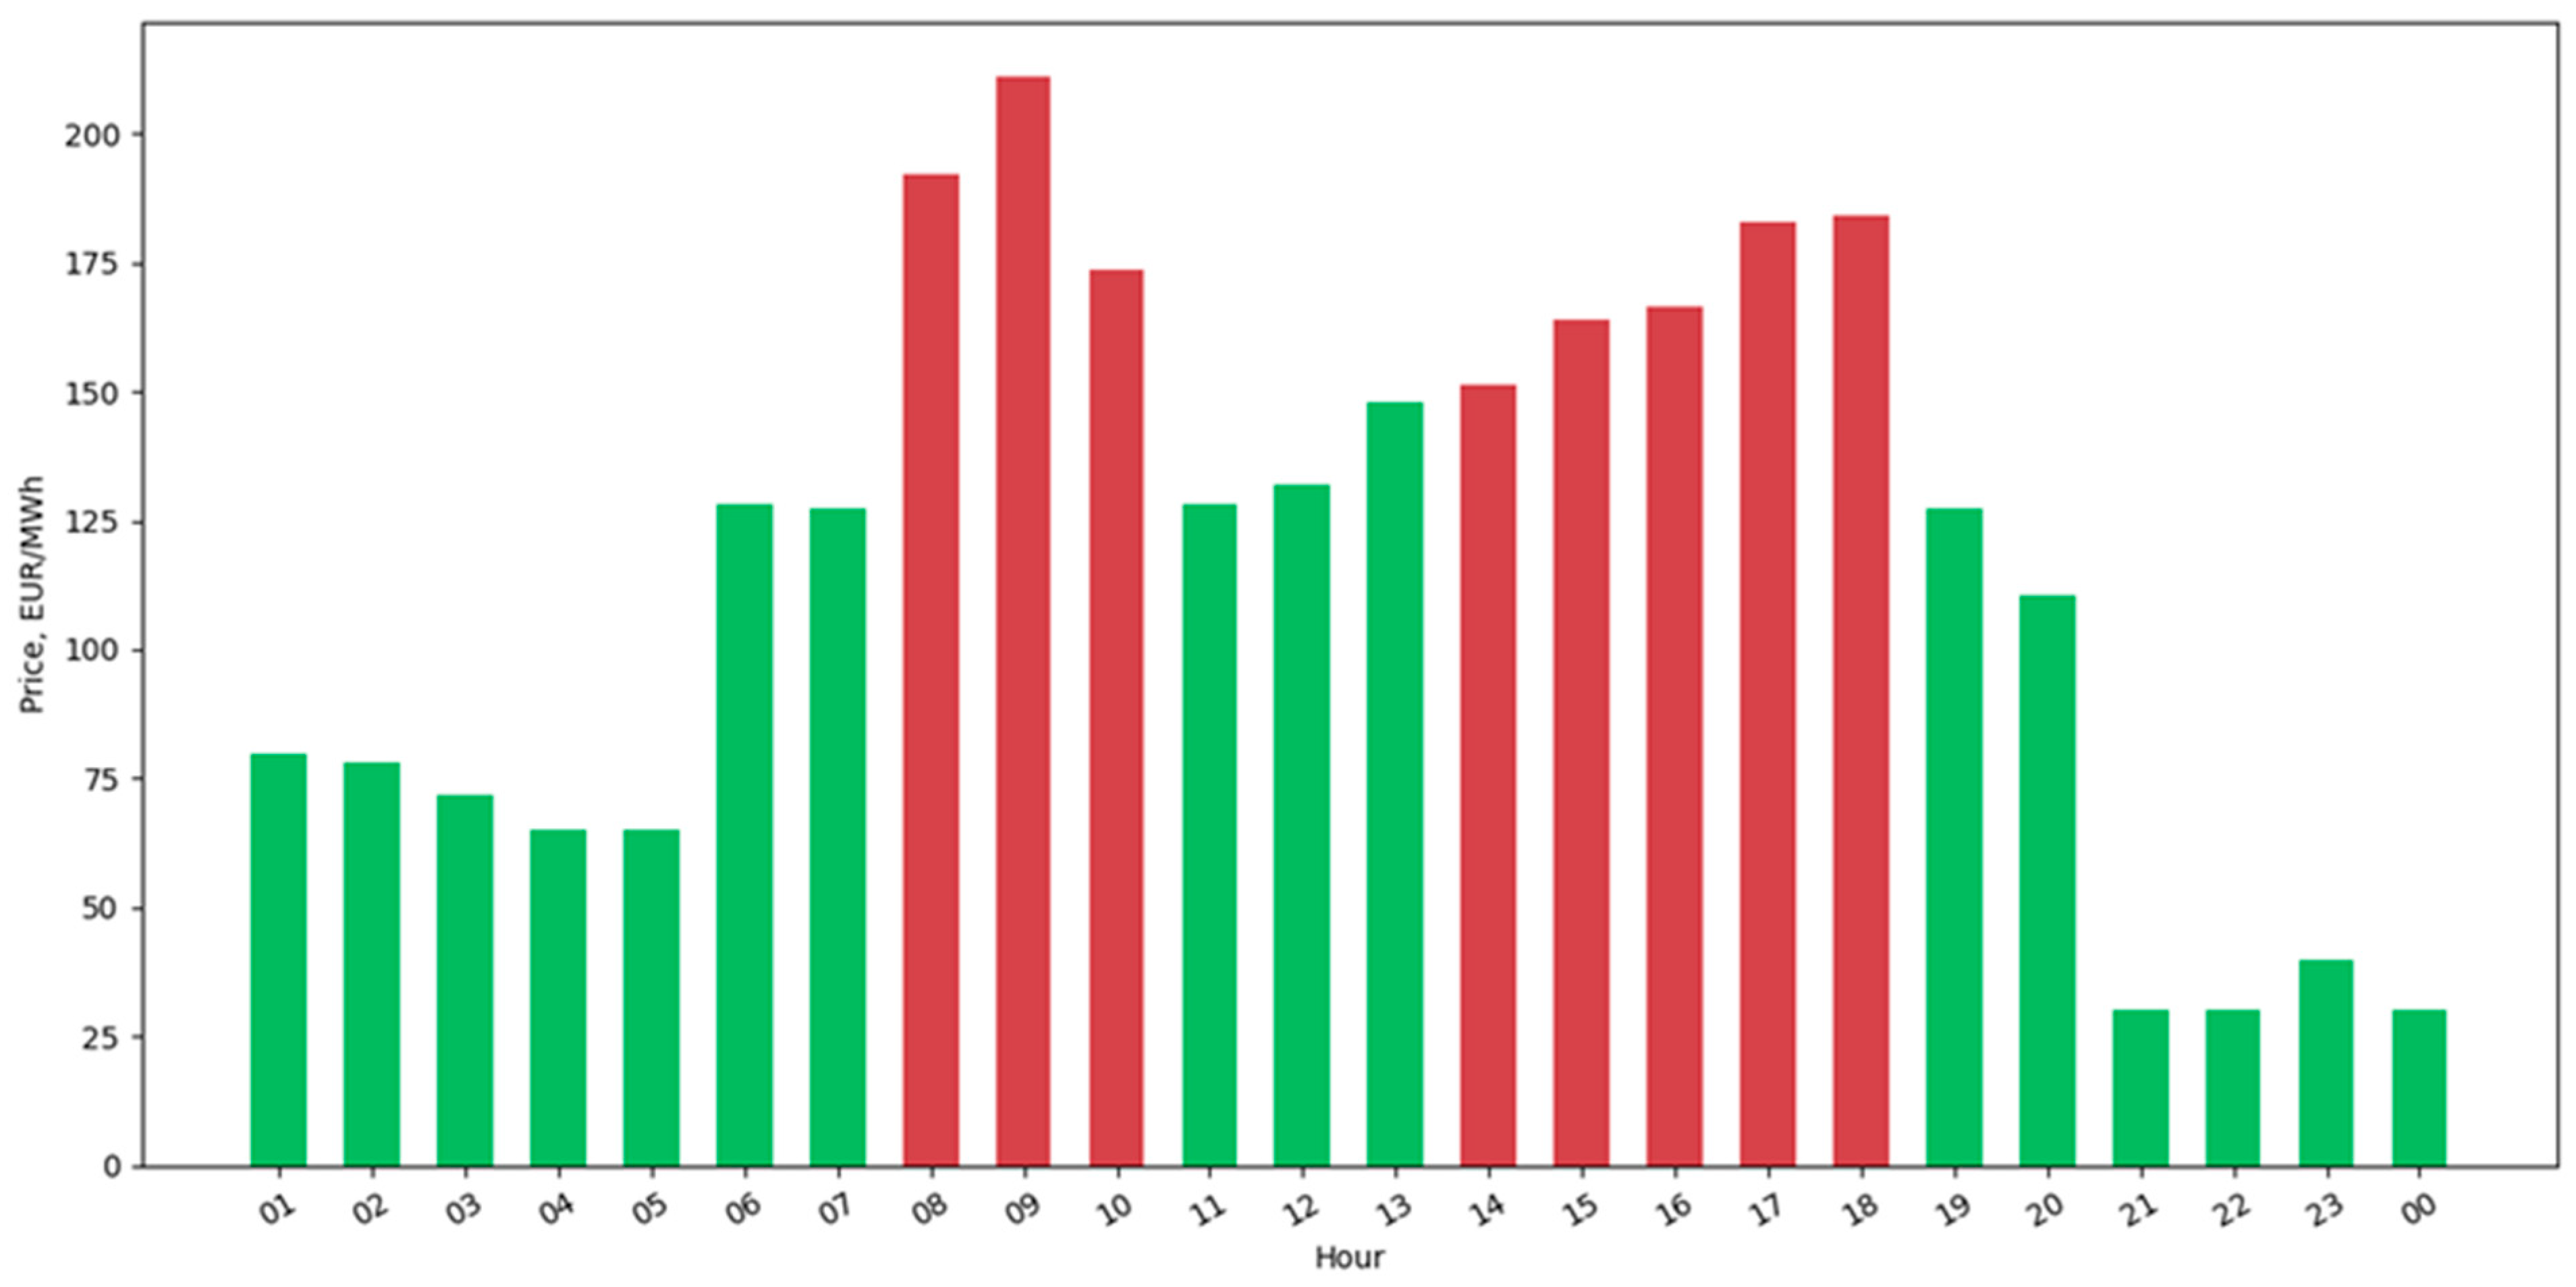
- The power grid connection represents a source of energy with virtually unlimited capacity but with prices changing every hour. Real “Nord Pool” spot market prices for 8 February 2023 were used for modelling (see Figure 3). The model assumes that all available renewable energy is used first and that only the remaining demand is covered by the power grid.
- Output products (H2 and O2) are considered as income for the production process and modelled as sold for a fixed price. The H2 price can vary based on various factors and production methods [42]. The oxygen generated by electrolysis can be used for some medical and niche applications [43], so can also provide additional income. The prices considered for the model were: PH2 for 5.00 EUR/kg and PO2 for 0.10 EUR/kg.
- T is the timespan;
- Qt is the quantity of products produced;
- P is the price of products;
- Et is the energy consumed by the electrolyser;
- is the energy provided by the PV cells;
- is the grid energy price;
- Ct is the fixed maintenance cost (component degradation).
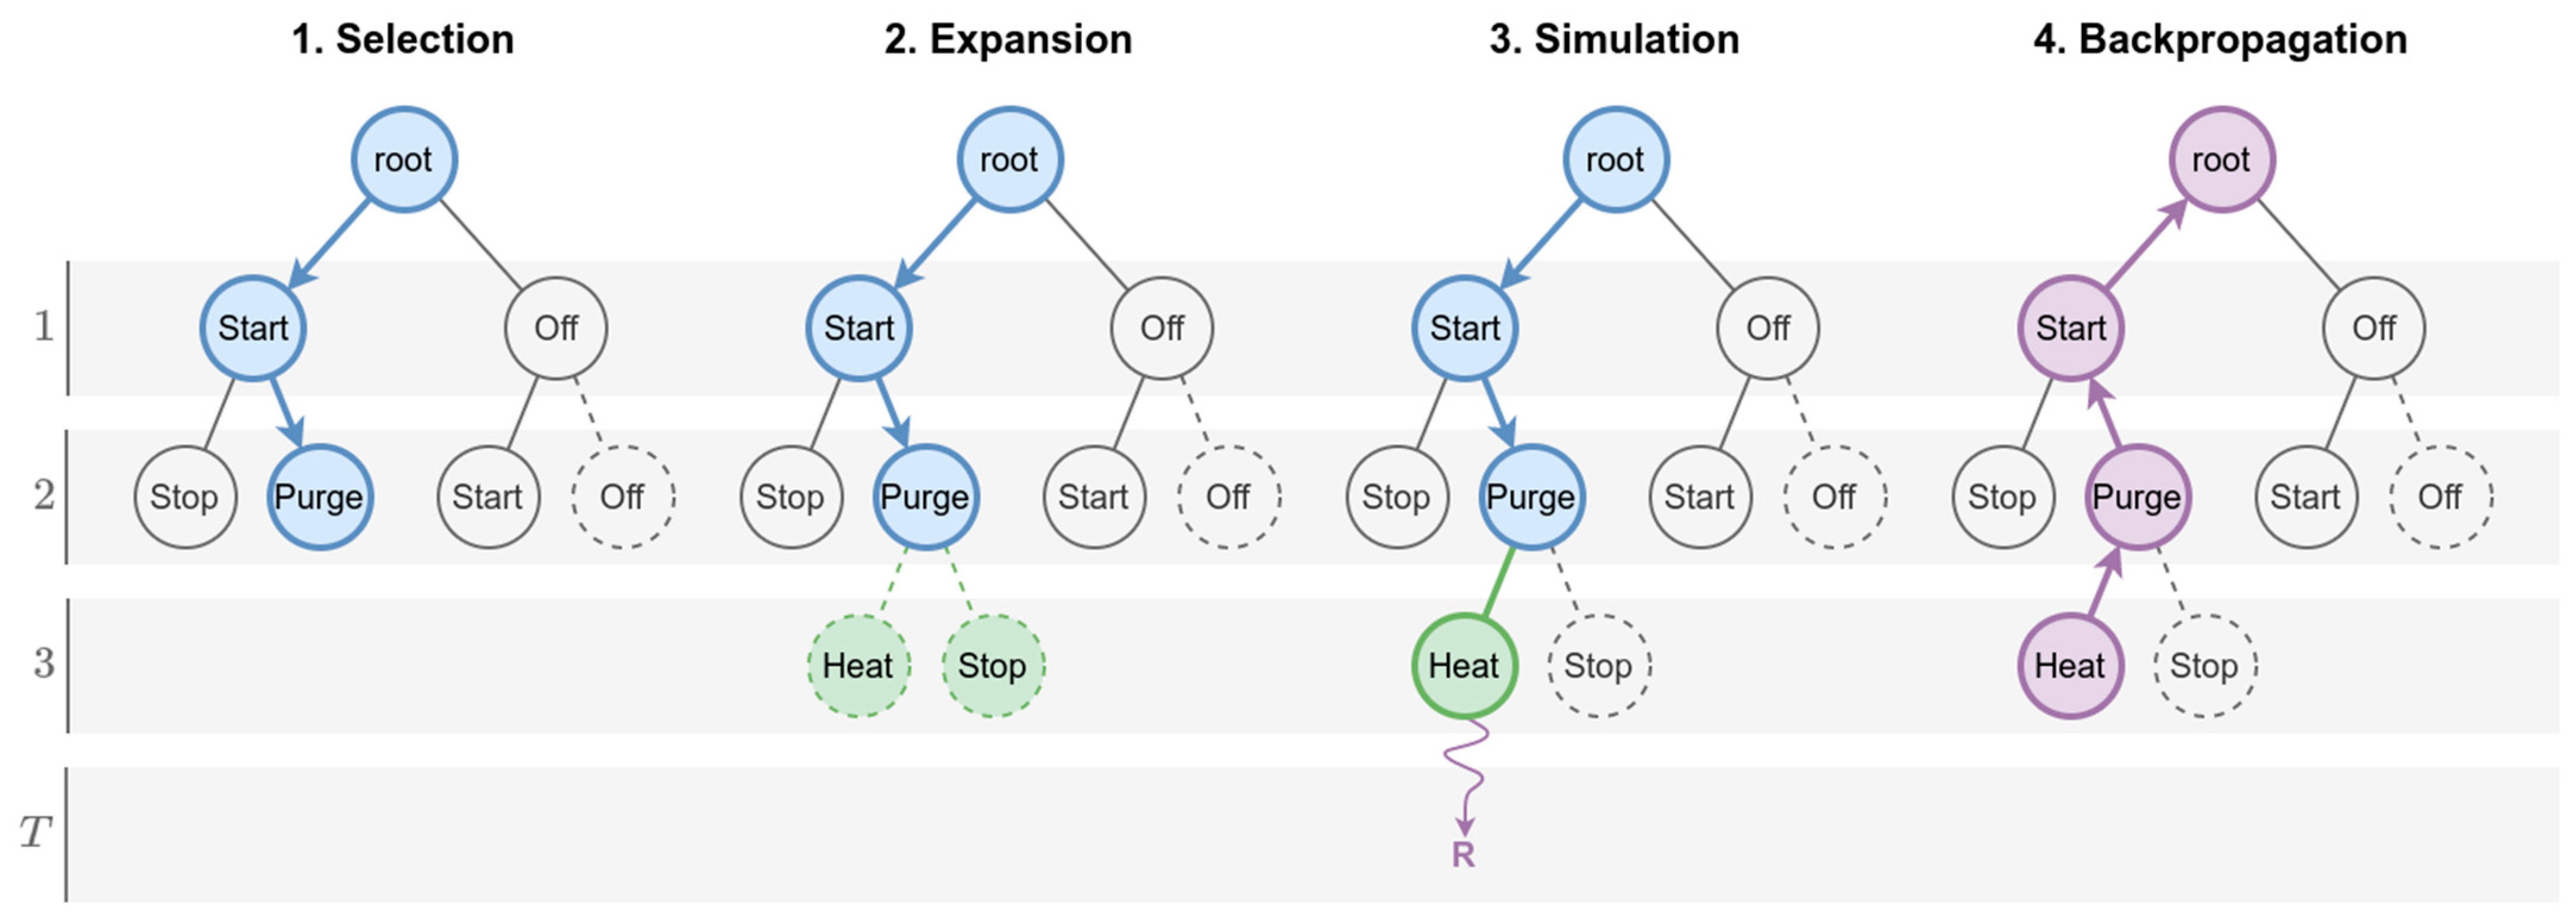
2.4. MCTS Adaptation for Electrolyser Schedule Optimisation
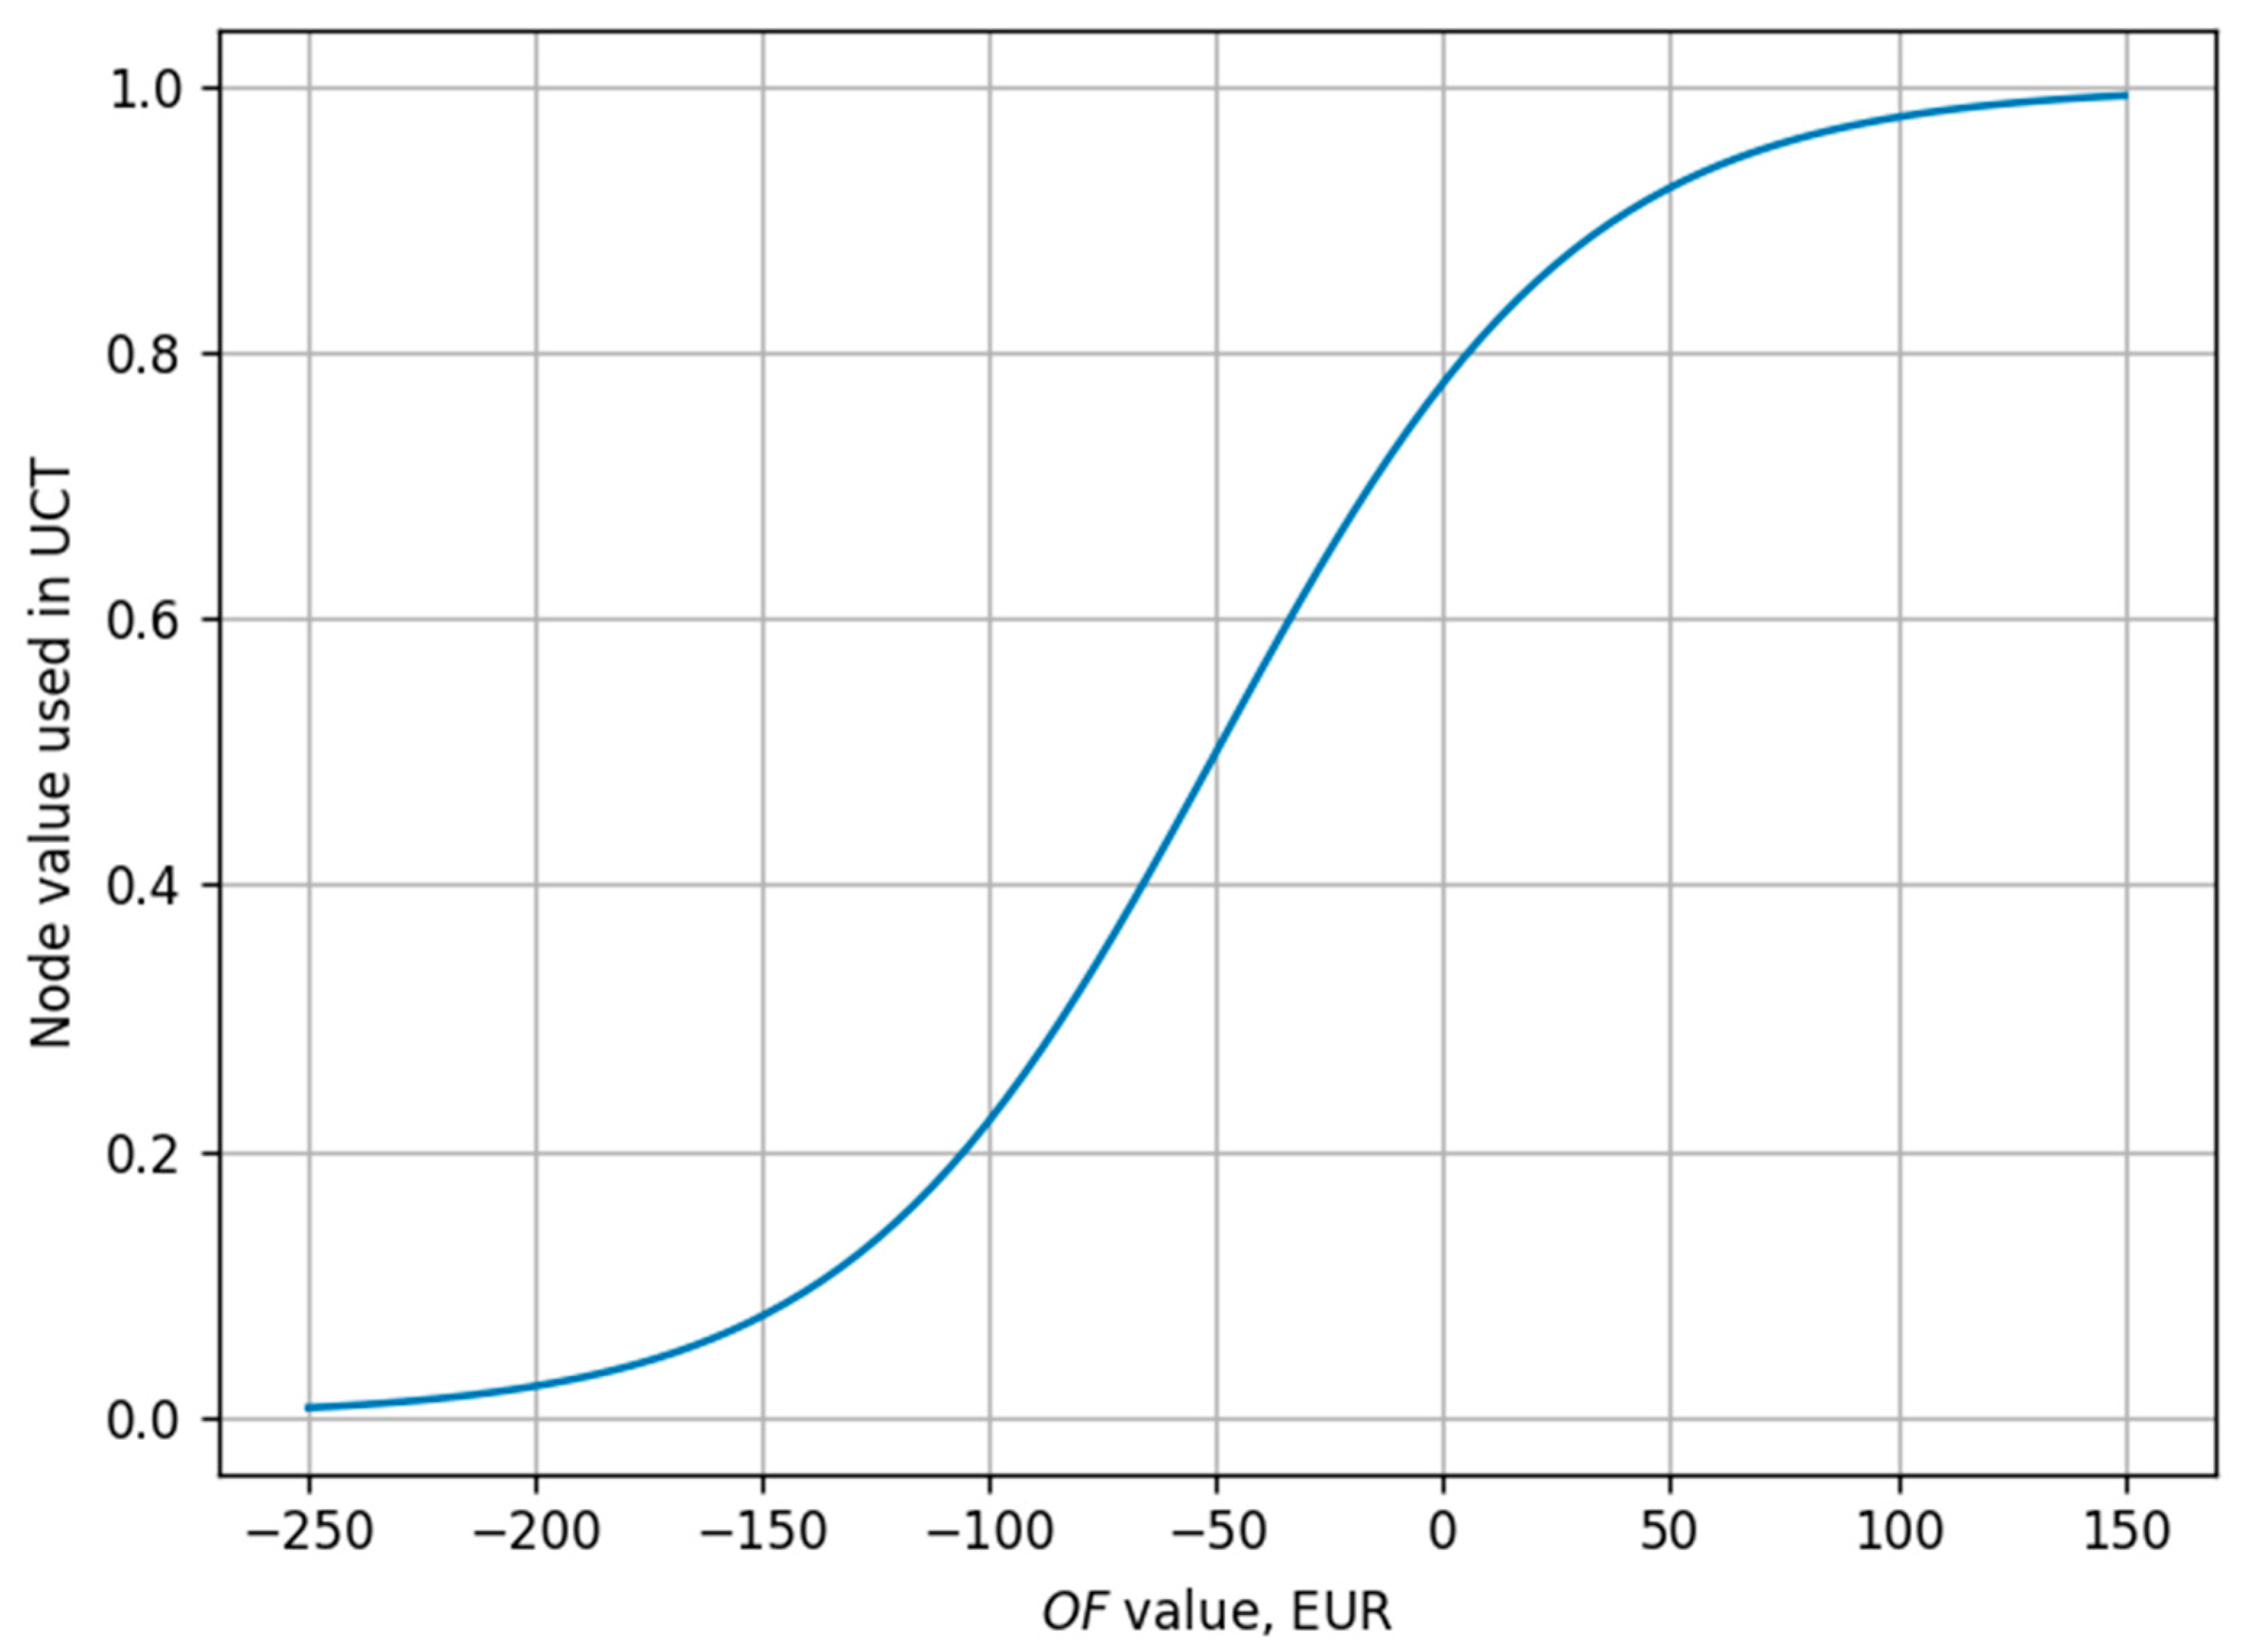
- v is the raw value of the objective function OF
- vmin is the lower range bound (−250)
- vmax is the upper range bound (150)
- v is the total value of the node;
- n is the total number of simulations from the node;
- N is the total number of simulations from the node’s parent;
- c is the exploration parameter; a value of 1.5 is used by the authors.
3. Results
3.1. The Economic Results of Electricity-Price-Based Electrolyser Control
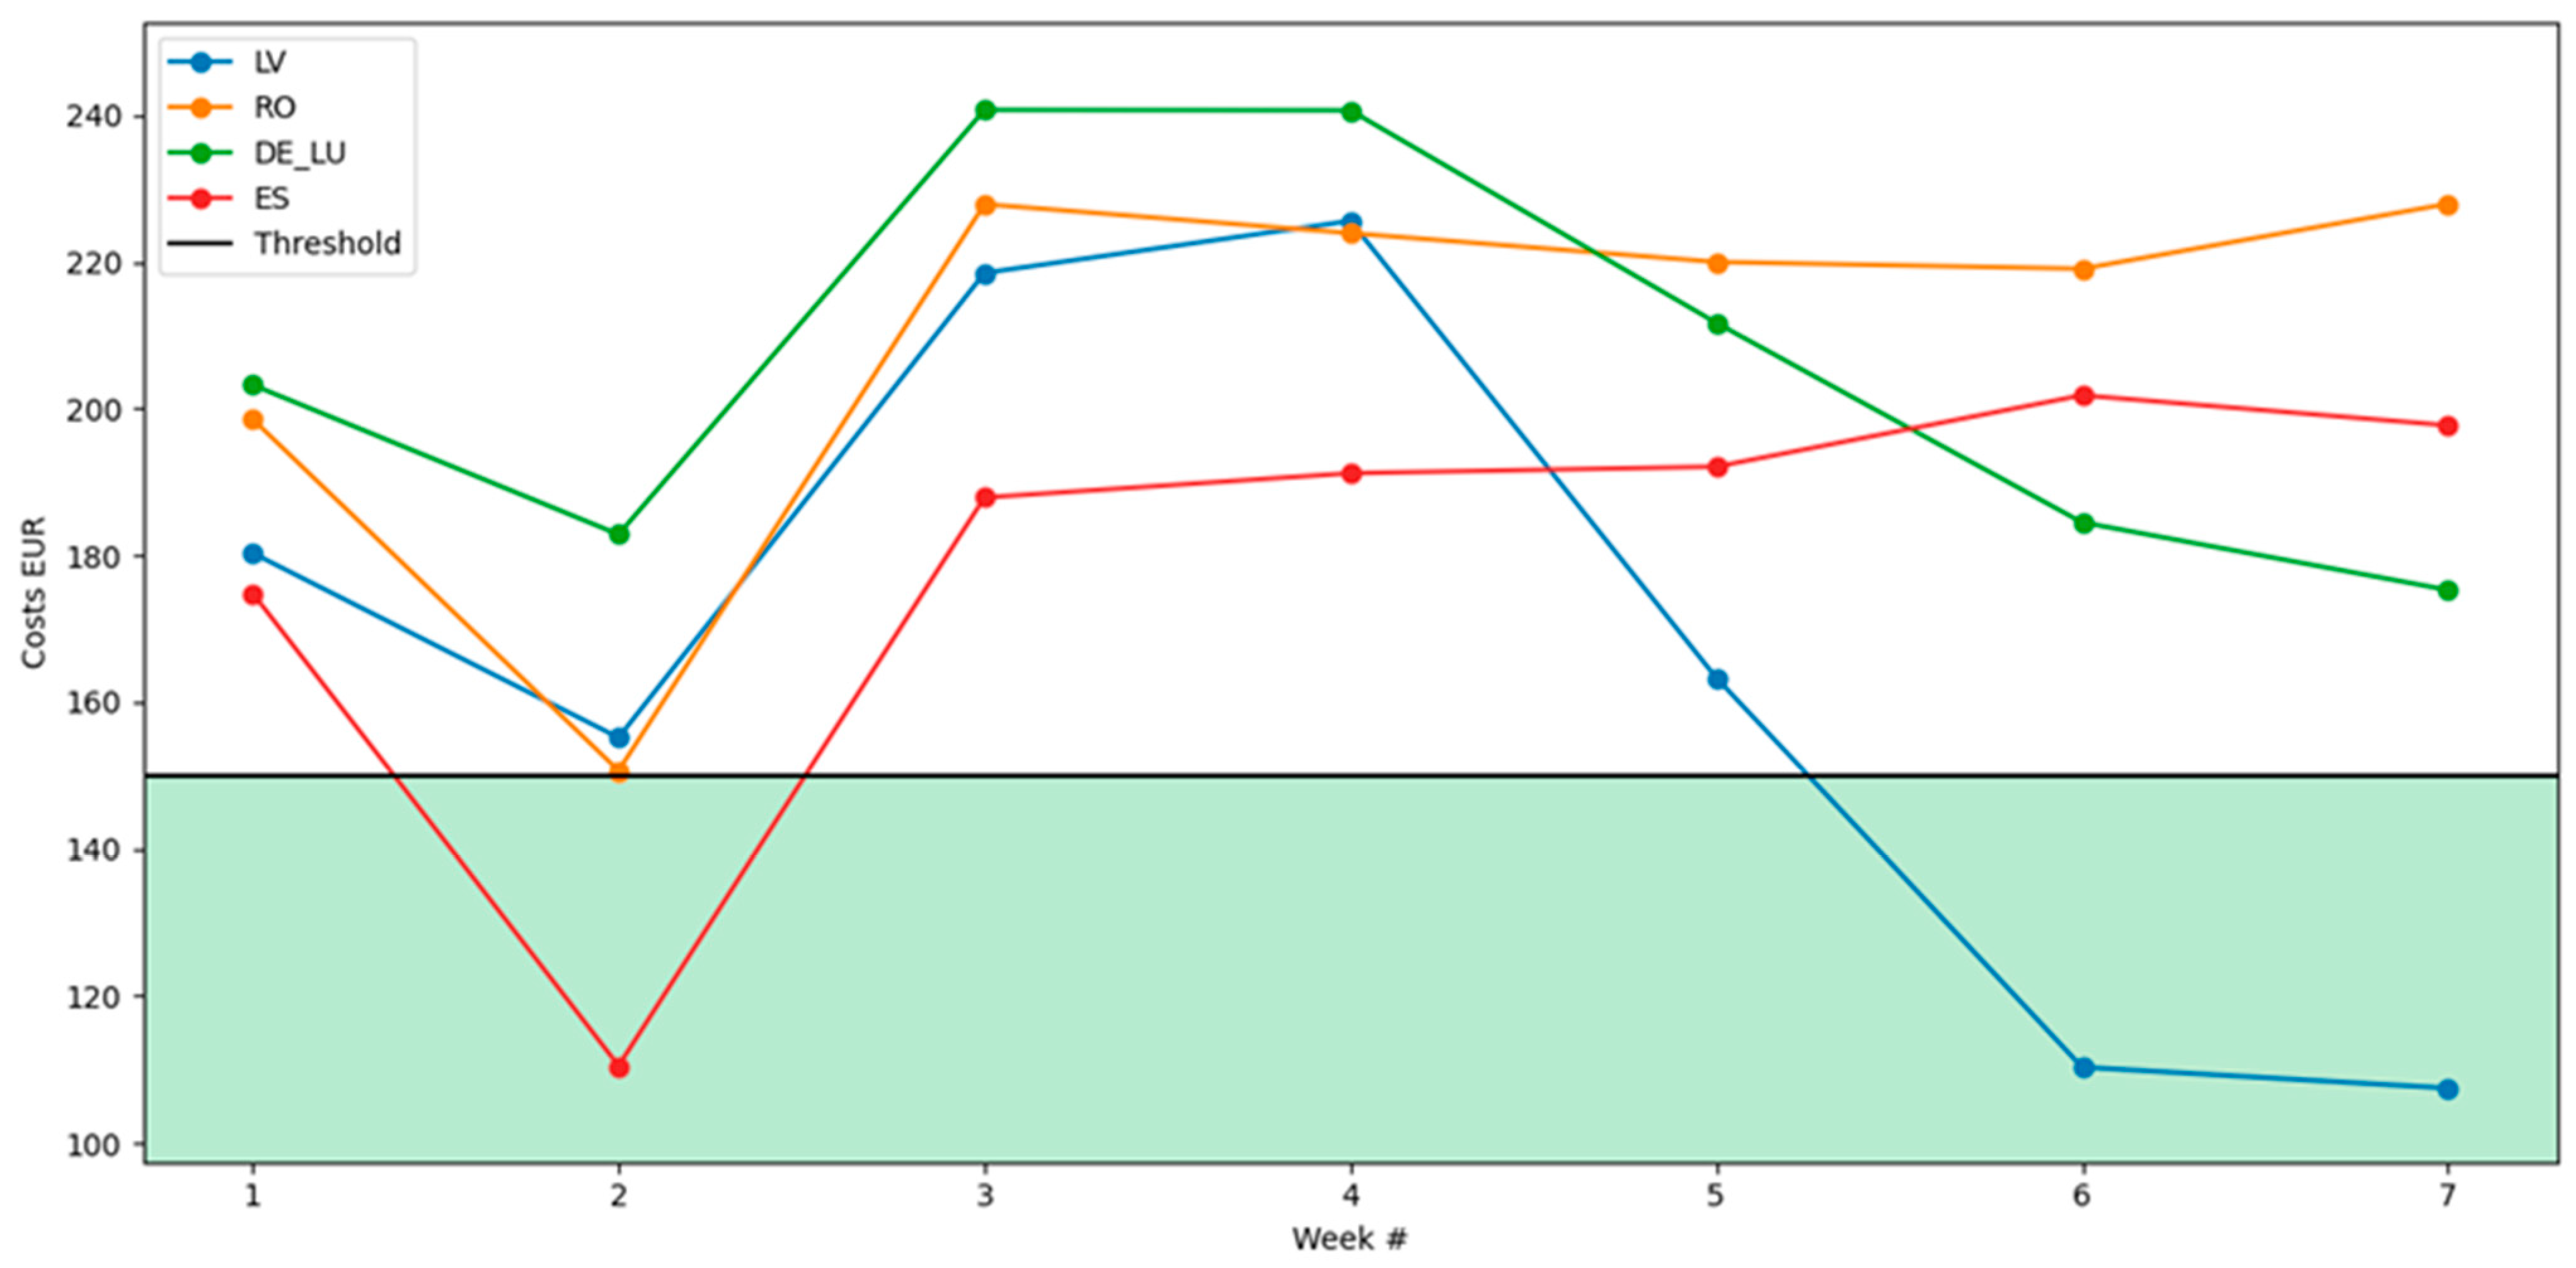
- 24 × 6.25 = EUR 150 (income per day when using a ~60 kWh electrolyser that produces ~1 kg of H2 per h) as a threshold (shown in Figure 6);
- The overall income per week = 150 × 7 = EUR 1050;
- The overall costs for H2 production for the selected countries are: LV—EUR 1160.71; RO—EUR 1468.17; DE—EUR 1439.10; ES—EUR 1256.10.
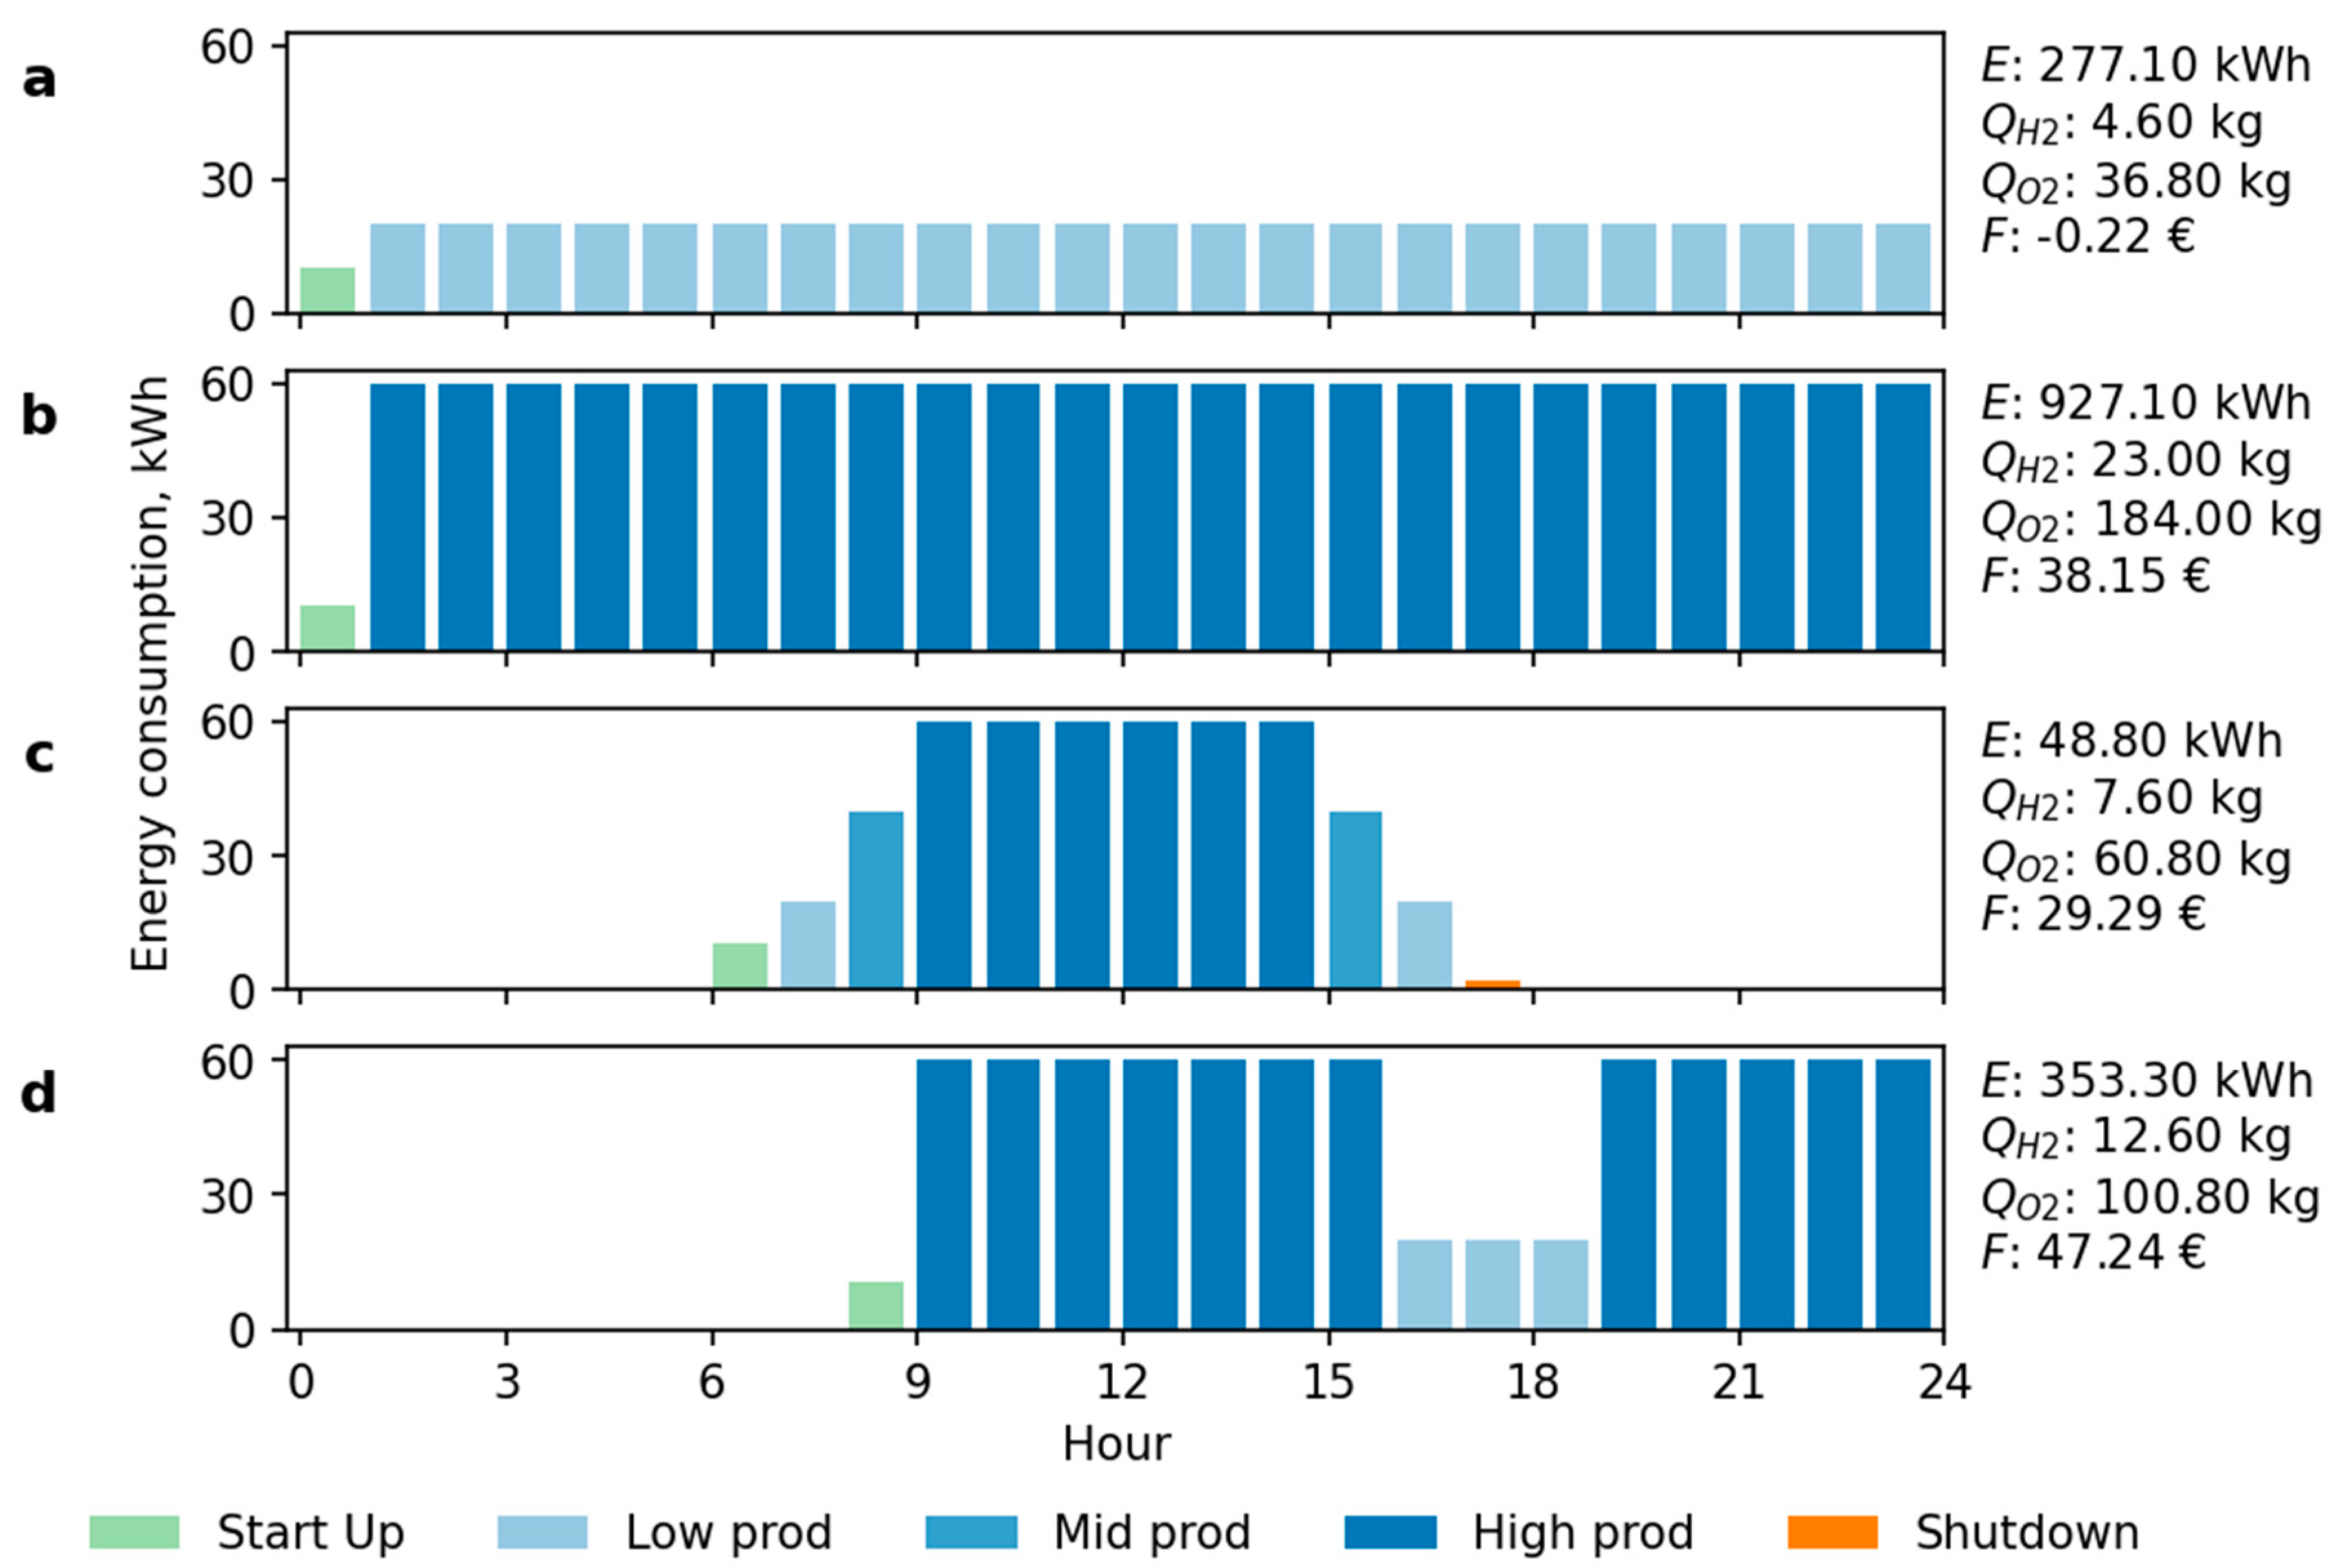
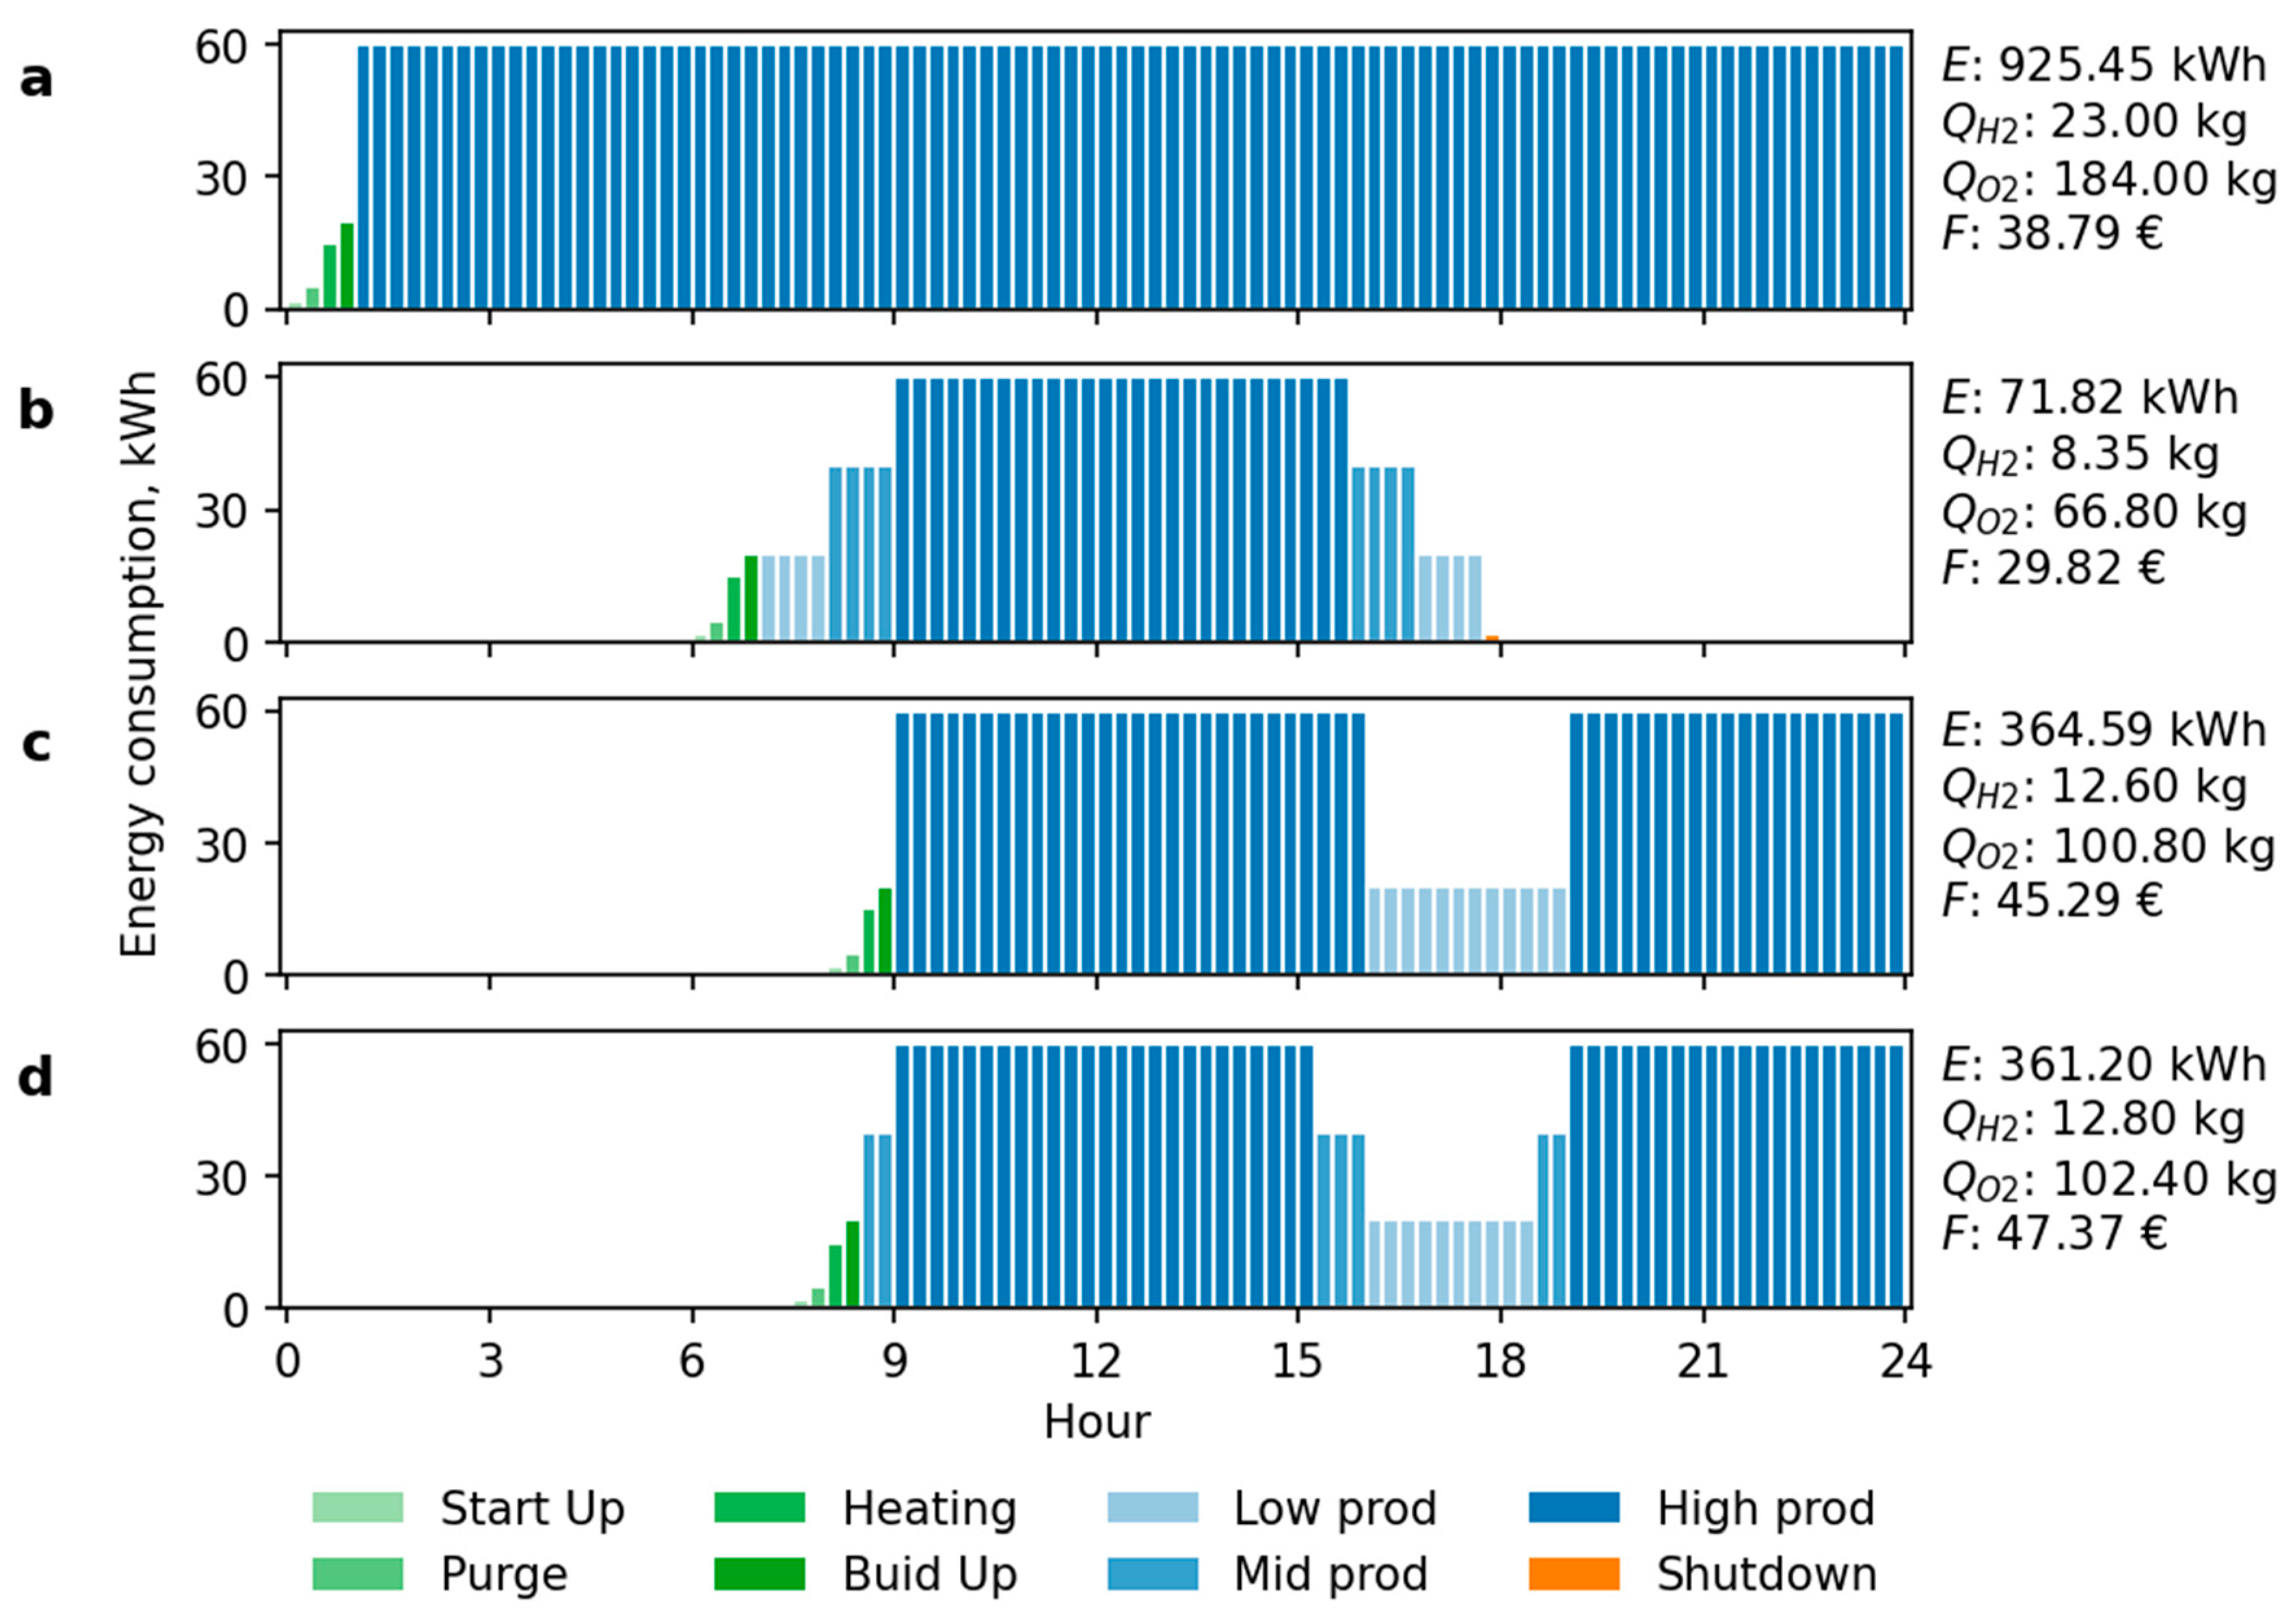
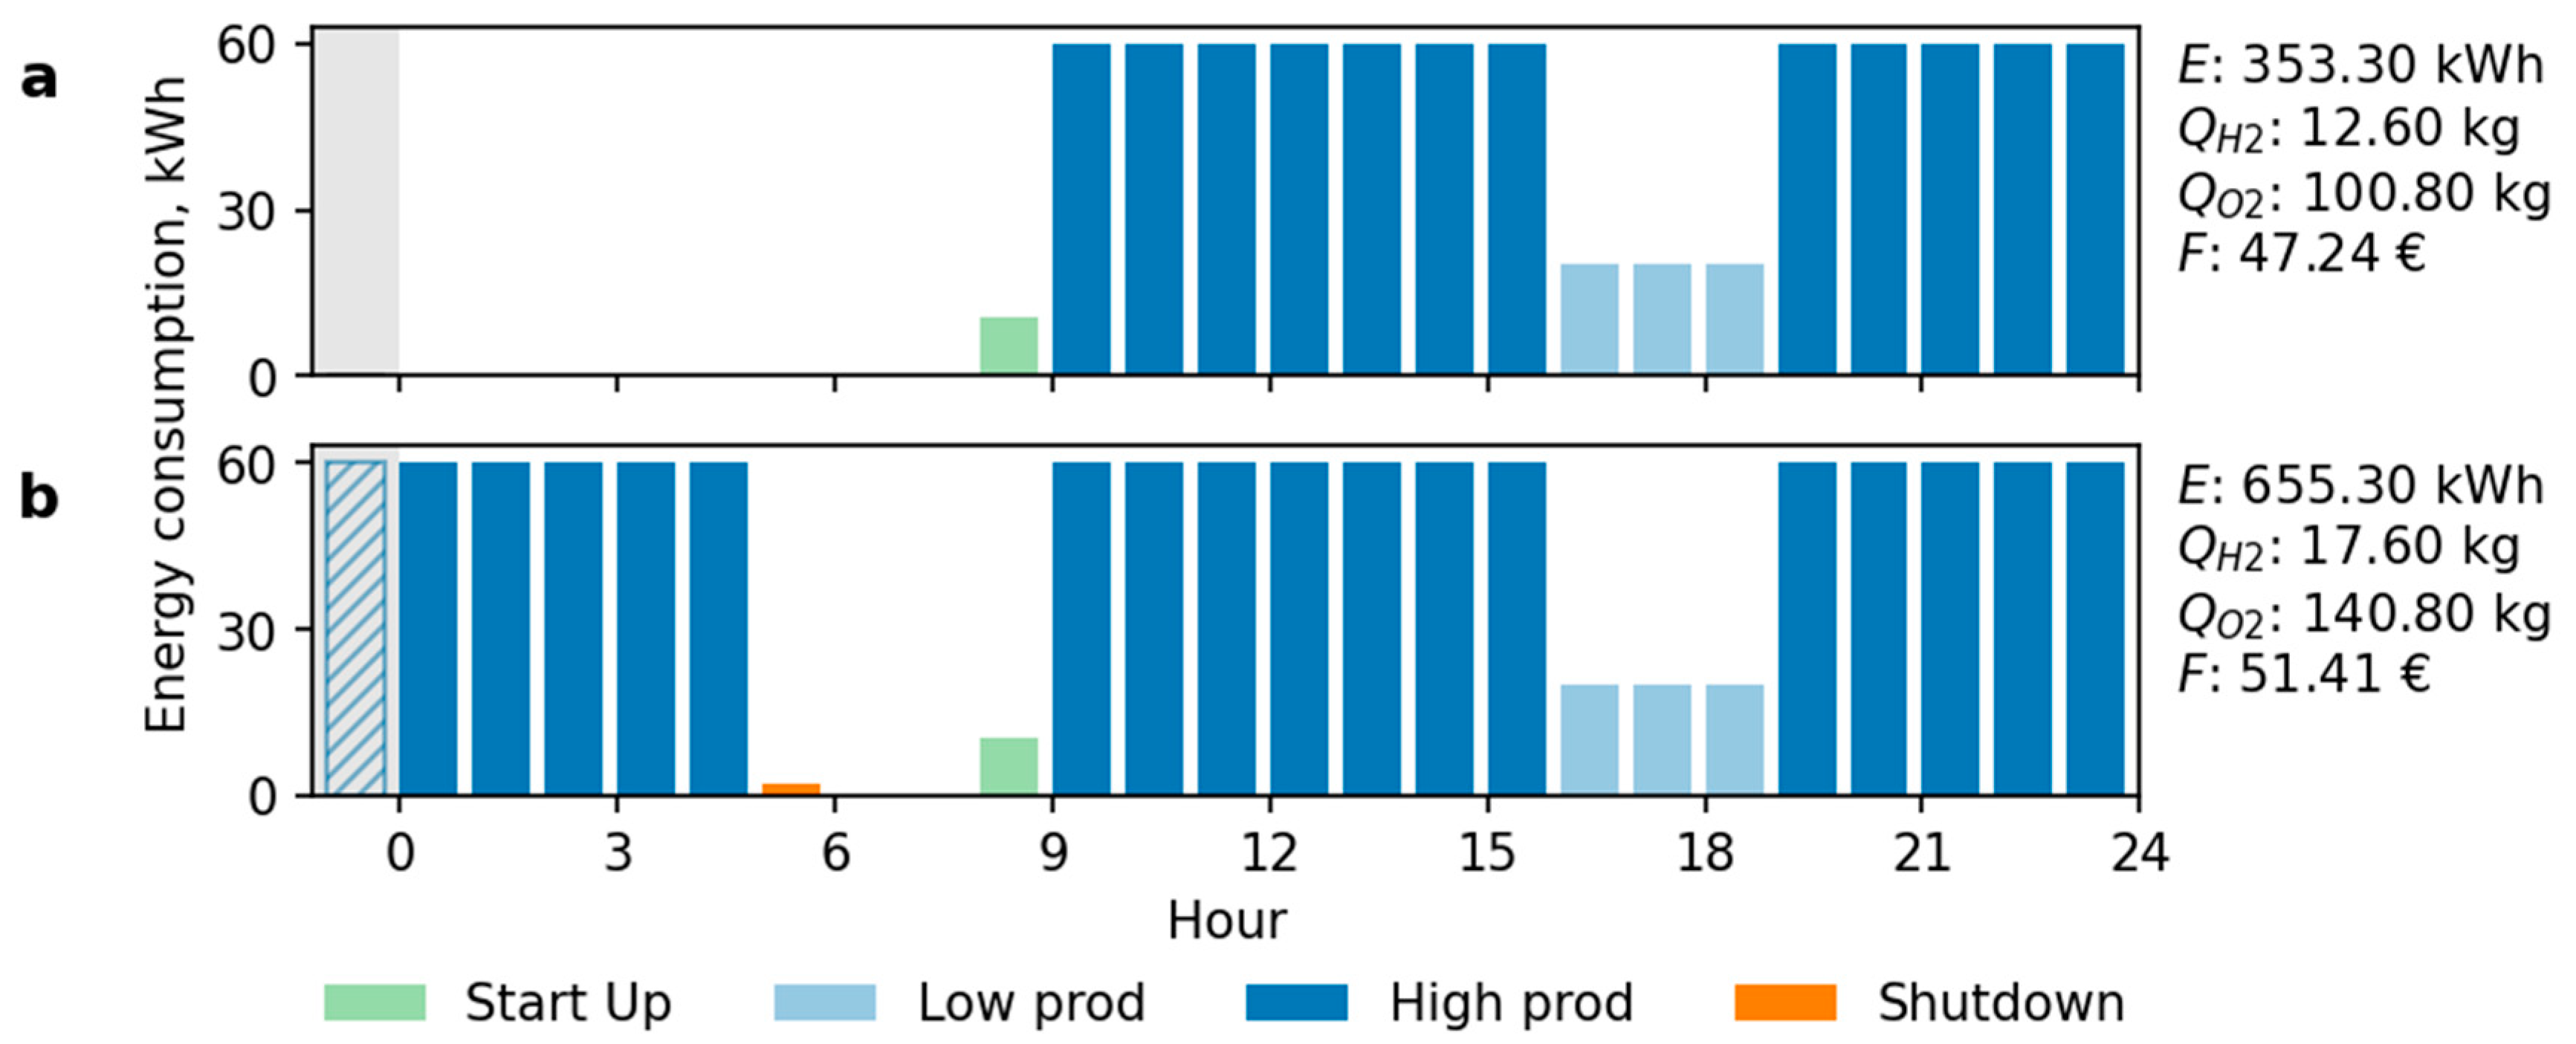
3.2. MCTS Results
4. Discussion
5. Conclusions
Author Contributions
Funding
Data Availability Statement
Conflicts of Interest
References
- Alanne, K.; Cao, S. An overview of the concept and technology of ubiquitous energy. Appl. Energy 2019, 238, 284–302. [Google Scholar] [CrossRef]
- Dawood, F.; Anda, M.; Shafiullah, G.M. Hydrogen Production for Energy: An Overview. Int. J. Hydrogen Energy 2020, 45, 3847–3869. [Google Scholar] [CrossRef]
- Boudellal, M. Power-to-Gas: Renewable Hydrogen Economy for the Energy Transition; Walter de Gruyter GmbH & Co KG: Berlin, Germany, 2023. [Google Scholar]
- Strielkowski, W.; Civín, L.; Tarkhanova, E.; Tvaronavičienė, M.; Petrenko, Y. Renewable Energy in the Sustainable Development of Electrical Power Sector: A Review. Energies 2021, 14, 8240. [Google Scholar] [CrossRef]
- Marbán, G.; Valdés-Solís, T. Towards the hydrogen economy? Int. J. Hydrogen Energy 2007, 32, 1625–1637. [Google Scholar] [CrossRef]
- Shatnawi, M.; Al Qaydi, N.; Aljaberi, N.; Aljaberi, M. Hydrogen-based energy storage systems: A review. In Proceedings of the 2018 7th International Conference on Renewable Energy Research and Applications (ICRERA), Paris, France, 14–17 October 2018; pp. 697–700. [Google Scholar]
- Staffell, I.; Scamman, D.; Abad, A.V.; Balcombe, P.; Dodds, P.E.; Ekins, P.; Shah, N.; Ward, K.R. The role of hydrogen and fuel cells in the global energy system. Energy Environ. Sci. 2019, 12, 463–491. [Google Scholar] [CrossRef]
- Kumar, S.S.; Himabindu, V. Hydrogen production by PEM water electrolysis—A review. Mater. Sci. Energy Technol. 2019, 2, 442–454. [Google Scholar]
- El-Shafie, M.; Kambara, S.; Hayakawa, Y. Hydrogen Production Technologies Overview. J. Power Energy Eng. 2019, 7, 107–154. [Google Scholar] [CrossRef]
- Oliveira, A.M.; Beswick, R.R.; Yan, Y. A green hydrogen economy for a renewable energy society. Curr. Opin. Chem. Eng. 2021, 33, 100701. [Google Scholar] [CrossRef]
- El-Emam, R.S.; Özcan, H. Comprehensive review on the techno-economics of sustainable large-scale clean hydrogen production. J. Clean. Prod. 2019, 220, 593–609. [Google Scholar] [CrossRef]
- Kannah, R.Y.; Kavitha, S.; Karthikeyan, O.P.; Kumar, G.; Dai-Viet, N.V.; Banu, J.R. Techno-economic assessment of various hydrogen production methods—A review. Bioresour. Technol. 2021, 319, 124175. [Google Scholar] [CrossRef]
- Gielen, D.; Boshell, F.; Saygin, D.; Bazilian, M.D.; Wagner, N.; Gorini, R. The role of renewable energy in the global energy transformation. Energy Strategy Rev. 2019, 24, 38–50. [Google Scholar] [CrossRef]
- Ji, Y.; Wang, J.; Xu, J.; Fang, X.; Zhang, H. Real-Time Energy Management of a Microgrid Using Deep Reinforcement Learning. Energies 2019, 12, 2291. [Google Scholar] [CrossRef]
- Kojima, H.; Nagasawa, K.; Todoroki, N.; Ito, Y.; Matsui, T.; Nakajima, R. Influence of renewable energy power fluctuations on water electrolysis for green hydrogen production. Int. J. Hydrogen Energy 2023, 48, 4572–4593. [Google Scholar] [CrossRef]
- Mehmeti, A.; Angelis-Dimakis, A.; Arampatzis, G.; McPhail, S.J.; Ulgiati, S. Life Cycle Assessment and Water Footprint of Hydrogen Production Methods: From Conventional to Emerging Technologies. Environments 2018, 5, 24. [Google Scholar] [CrossRef]
- Gondal, I.A.; Masood, S.A.; Khan, R. Green hydrogen production potential for developing a hydrogen economy in Pakistan. Int. J. Hydrogen Energy 2018, 43, 6011–6039. [Google Scholar] [CrossRef]
- Schmidt, O.; Gambhir, A.; Staffell, I.; Hawkes, A.; Nelson, J.; Few, S. Future cost and performance of water electrolysis: An expert elicitation study. Int. J. Hydrogen Energy 2017, 42, 30470–30492. [Google Scholar] [CrossRef]
- IRENA. Hydrogen from renewable power: Technology outlook for the energy transition. Int. Renew. Energy Agency Abu Dhabi 2018, 2018, 52. [Google Scholar]
- Motamedi, A.; Zareipour, H.; Rosehart, W.D. Electricity market price forecasting in a price-responsive smart grid environment. In Proceedings of the IEEE PES General Meeting, Minneapolis, MN, USA, 25–29 July 2010; pp. 1–4. [Google Scholar]
- Arsad, A.; Hannan, M.; Al-Shetwi, A.Q.; Hossain, M.; Begum, R.; Ker, P.J.; Salehi, F.; Muttaqi, K. Hydrogen electrolyser for sustainable energy production: A bibliometric analysis and future directions. Int. J. Hydrogen Energy 2023, 48, 4960–4983. [Google Scholar] [CrossRef]
- Ulleberg, Ø. The importance of control strategies in PV–hydrogen systems. Sol. Energy 2004, 76, 323–329. [Google Scholar] [CrossRef]
- Varela, C.; Mostafa, M.; Zondervan, E. Modeling alkaline water electrolysis for power-to-x applications: A scheduling approach. Int. J. Hydrogen Energy 2021, 46, 9303–9313. [Google Scholar] [CrossRef]
- Yang, Y.; De La Torre, B.; Stewart, K.; Lair, L.; Phan, N.L.; Das, R.; Gonzalez, D.; Lo, R.C. The scheduling of alkaline water electrolysis for hydrogen production using hybrid energy sources. Energy Convers. Manag. 2022, 257, 115408. [Google Scholar] [CrossRef]
- Hong, Z.; Wei, Z.; Han, X. Optimization scheduling control strategy of wind-hydrogen system considering hydrogen production efficiency. J. Energy Storage 2022, 47, 103609. [Google Scholar] [CrossRef]
- Brauns, J.; Turek, T. Alkaline Water Electrolysis Powered by Renewable Energy: A Review. Processes 2020, 8, 248. [Google Scholar] [CrossRef]
- Bauer, M.; Craig, I.K. Economic assessment of advanced process control—A survey and framework. J. Process. Control. 2008, 18, 2–18. [Google Scholar] [CrossRef]
- Shin, Y.; Smith, R.; Hwang, S. Development of model predictive control system using an artificial neural network: A case study with a distillation column. J. Clean. Prod. 2020, 277, 124124. [Google Scholar] [CrossRef]
- Salari, A.; Shakibi, H.; Habibi, A.; Hakkaki-Fard, A. Optimization of a solar-based PEM methanol/water electrolyzer using machine learning and animal-inspired algorithms. Energy Convers. Manag. 2023, 283, 116876. [Google Scholar] [CrossRef]
- Świechowski, M.; Godlewski, K.; Sawicki, B.; Mańdziuk, J. Monte Carlo Tree Search: A review of recent modifications and applications. Artif. Intell. Rev. 2023, 56, 2497–2562. [Google Scholar] [CrossRef]
- Bai, F.; Ju, X.; Wang, S.; Zhou, W.; Liu, F. Wind farm layout optimization using adaptive evolutionary algorithm with Monte Carlo Tree Search reinforcement learning. Energy Convers. Manag. 2022, 252, 115047. [Google Scholar] [CrossRef]
- Rakotoarison, H.; Schoenauer, M.; Sebag, M. Automated machine learning with monte-carlo tree search. arXiv 2019, arXiv:1906.00170. [Google Scholar]
- Chaslot, G.; Bakkes, S.; Szita, I.; Spronck, P. Monte-carlo tree search: A new framework for game ai. In Proceedings of the AAAI Conference on Artificial Intelligence and Interactive Digital Entertainment, Palo Alto, CA, USA, 22–24 October 2008; Volume 4, pp. 216–217. [Google Scholar]
- Liu, X.; Fotouhi, A. Formula-E race strategy development using artificial neural networks and Monte Carlo tree search. Neural Comput. Appl. 2020, 32, 15191–15207. [Google Scholar] [CrossRef]
- Ponsen, M.J.; Gerritsen, G.; Chaslot, G. Integrating Opponent Models with Monte-Carlo Tree Search in Poker. In Proceedings of the 3rd AAAI Conference on Interactive Decision Theory and Game Theory; AAAI Press: Washington, DC, USA, 2010; pp. 37–42. [Google Scholar]
- Robles, D.; Rohlfshagen, P.; Lucas, S.M. Learning non-random moves for playing Othello: Improving Monte Carlo tree search. In Proceedings of the 2011 IEEE Conference on Computational Intelligence and Games (CIG’11), Seoul, Republic of Korea, 31 August–3 September 2011; pp. 305–312. [Google Scholar]
- Szita, I.; Chaslot, G.; Spronck, P. Monte-carlo tree search in settlers of catan. In Proceedings of the Advances in Computer Games: 12th International Conference, ACG 2009, Pamplona, Spain, 11–13 May 2009; Revised Papers 12. Springer: Berlin/Heidelberg, Germany, 2009; pp. 21–32. [Google Scholar]
- Silver, D.; Huang, A.; Maddison, C.J.; Guez, A.; Sifre, L.; van den Driessche, G.; Schrittwieser, J.; Antonoglou, I.; Panneershelvam, V.; Lanctot, M.; et al. Mastering the game of Go with deep neural networks and tree search. Nature 2016, 529, 484–489. [Google Scholar] [CrossRef]
- Brown, N.; Bakhtin, A.; Lerer, A.; Gong, Q. Combining deep reinforcement learning and search for imperfect-information games. Adv. Neural Inf. Process. Syst. 2020, 33, 17057–17069. [Google Scholar]
- Crippa, M.; Lanzi, P.L.; Marocchi, F. An analysis of Single-Player Monte Carlo Tree Search performance in Sokoban. Expert Syst. Appl. 2022, 192, 116224. [Google Scholar] [CrossRef]
- Schadd, M.P.; Winands, M.H.; Van Den Herik, H.J.; Chaslot, G.M.B.; Uiterwijk, J.W. Single-player monte-carlo tree search. In Proceedings of the Computers and Games: 6th International Conference, CG 2008, Beijing, China, 29 September–1 October 2008; Proceedings 6. Springer: Berlin/Heidelberg, Germany, 2008; pp. 1–12. [Google Scholar]
- Gandhi, K.; Apostoleris, H.; Sgouridis, S. Catching the hydrogen train: Economics-driven green hydrogen adoption potential in the United Arab Emirates. Int. J. Hydrogen Energy 2022, 47, 22285–22301. [Google Scholar] [CrossRef]
- Nicita, A.; Maggio, G.; Andaloro, A.; Squadrito, G. Green hydrogen as feedstock: Financial analysis of a photovoltaic-powered electrolysis plant. Int. J. Hydrogen Energy 2020, 45, 11395–11408. [Google Scholar] [CrossRef]
- Mnih, V.; Kavukcuoglu, K.; Silver, D.; Rusu, A.A.; Veness, J.; Bellemare, M.G.; Graves, A.; Riedmiller, M.; Fidjeland, A.K.; Ostrovski, G.; et al. Human-level control through deep reinforcement learning. Nature 2015, 518, 529–533. [Google Scholar] [CrossRef] [PubMed]
- Yang, J.; You, X.; Wu, G.; Hassan, M.M.; Almogren, A.; Guna, J. Application of reinforcement learning in UAV cluster task scheduling. Futur. Gener. Comput. Syst. 2019, 95, 140–148. [Google Scholar] [CrossRef]
- Mason, K.; Grijalva, S. A review of reinforcement learning for autonomous building energy management. Comput. Electr. Eng. 2019, 78, 300–312. [Google Scholar] [CrossRef]
- Nguyen, H.; La, H. Review of deep reinforcement learning for robot manipulation. In Proceedings of the 2019 Third IEEE International Conference on Robotic Computing (IRC), Naples, Italy, 25–27 February 2019; pp. 590–595. [Google Scholar]
- Coronato, A.; Naeem, M.; De Pietro, G.; Paragliola, G. Reinforcement learning for intelligent healthcare applications: A survey. Artif. Intell. Med. 2020, 109, 101964. [Google Scholar] [CrossRef]
- Hsu, R.C.; Liu, C.-T.; Chen, W.-Y.; Hsieh, H.-I.; Wang, H.-L. A Reinforcement Learning-Based Maximum Power Point Tracking Method for Photovoltaic Array. Int. J. Photoenergy 2015, 2015, 496401. [Google Scholar] [CrossRef]


| Symbol | Property | Units |
|---|---|---|
| RH2 | H2 production rate | kg/h |
| RO2 | O2 production rate | kg/h |
| C | Fixed costs | EUR |
| E | Electrical energy | kWh |
| T | Timespan | s |
| PH2 | Price of H2 | EUR |
| PO2 | Price of O2 | EUR |
| PE | Price of electricity per kWh | EUR |
| F | Profit | EUR |
| QH2 | Quantity of H2 produced | kg |
| QO2 | Quantity of O2 produced | kg |
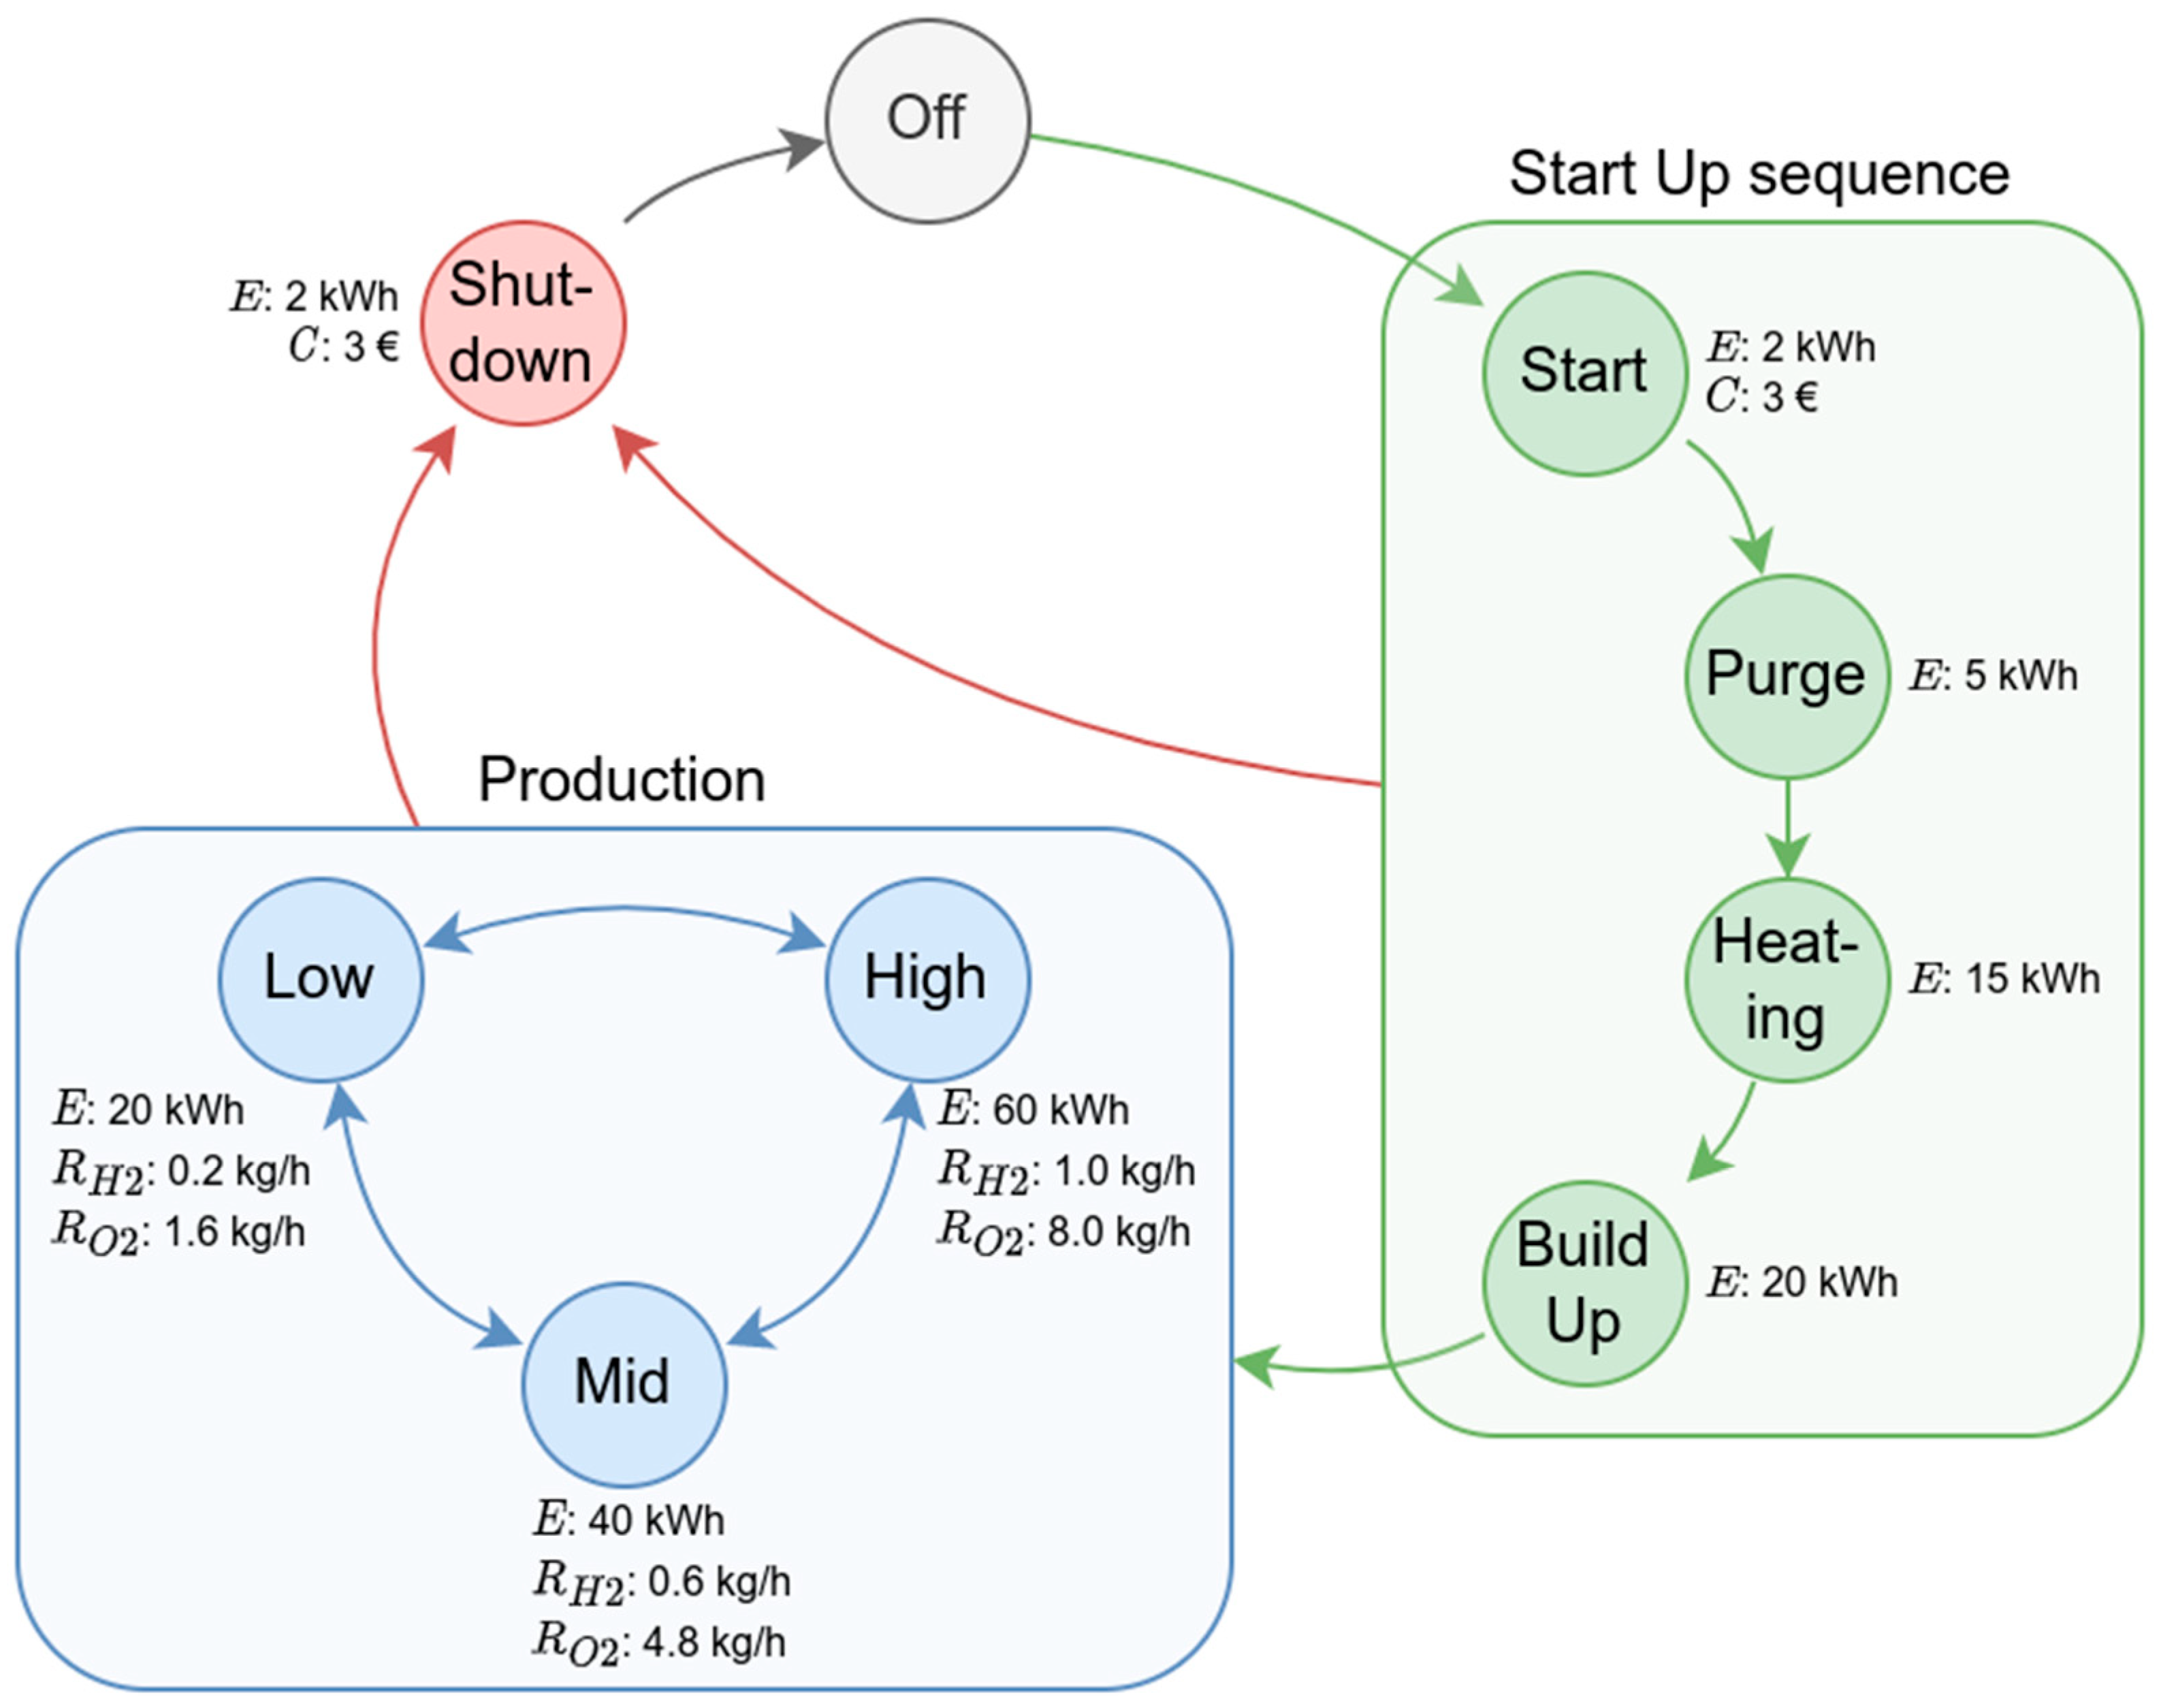
| Electrolyser State | Electrical Energy E, kWh | Fixed Costs C, EUR | RH2, kg/h | RO2, kg/h | Remarks |
|---|---|---|---|---|---|
| Start | 2.0 | 3.00 | - | - | Flat maintenance costs represent membrane degradation over time |
| Purge | 5.0 | - | - | - | Electrolyser purging (water pumping) before starting production |
| Heating | 15.0 | - | - | - | Energy consumption for reaching optimal electrolyte temperature |
| BuildUp | 20.0 | - | - | - | Pressure build-up phase with no product output |
| Shutdown | 2.0 | 3.00 | - | - | Flat maintenance costs represent membrane degradation over time |
| Low production | 20.0 | - | 0.2 | 1.6 | H2 production on low energy profile |
| Mid production | 40.0 | - | 0.6 | 4.8 | H2 production on medium energy profile |
| High production | 60.0 | - | 1.0 | 8.0 | H2 production on high energy profile |
Disclaimer/Publisher’s Note: The statements, opinions and data contained in all publications are solely those of the individual author(s) and contributor(s) and not of MDPI and/or the editor(s). MDPI and/or the editor(s) disclaim responsibility for any injury to people or property resulting from any ideas, methods, instructions or products referred to in the content. |
© 2023 by the authors. Licensee MDPI, Basel, Switzerland. This article is an open access article distributed under the terms and conditions of the Creative Commons Attribution (CC BY) license (https://creativecommons.org/licenses/by/4.0/).
Share and Cite
Komasilovs, V.; Zacepins, A.; Kviesis, A.; Ozols, K.; Nikulins, A.; Sudars, K. Development of an MCTS Model for Hydrogen Production Optimisation. Processes 2023, 11, 1977. https://doi.org/10.3390/pr11071977
Komasilovs V, Zacepins A, Kviesis A, Ozols K, Nikulins A, Sudars K. Development of an MCTS Model for Hydrogen Production Optimisation. Processes. 2023; 11(7):1977. https://doi.org/10.3390/pr11071977
Chicago/Turabian StyleKomasilovs, Vitalijs, Aleksejs Zacepins, Armands Kviesis, Kaspars Ozols, Arturs Nikulins, and Kaspars Sudars. 2023. "Development of an MCTS Model for Hydrogen Production Optimisation" Processes 11, no. 7: 1977. https://doi.org/10.3390/pr11071977
APA StyleKomasilovs, V., Zacepins, A., Kviesis, A., Ozols, K., Nikulins, A., & Sudars, K. (2023). Development of an MCTS Model for Hydrogen Production Optimisation. Processes, 11(7), 1977. https://doi.org/10.3390/pr11071977