
Development of a Lux Meter for the Identification of Liquids in Post-Consumer Polyethylene Terephthalate Bottles for Collection Centers in Mexico

 ,
,  ,
,  ,
,  and
and
Abstract
:1. Introduction
- This paper aims to develop an automatic liquid identification system for recyclable polyethylene terephthalate bottles with an affordable design.
- A new methodology is developed and implemented to identify dark liquids.
- In conclusion, it is possible to quantify the number of dark liquids that post-consumer PET bottles may contain by implementing an affordable design.
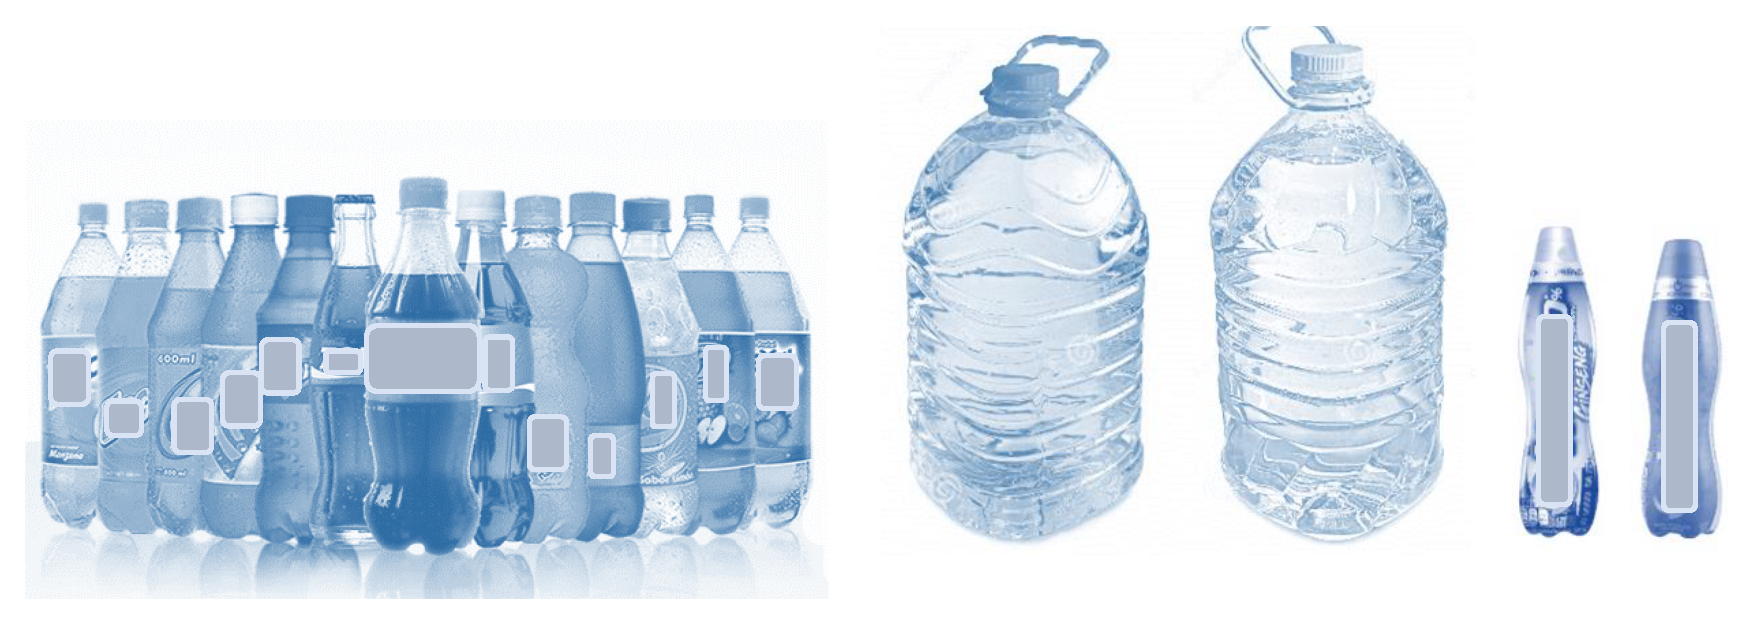
1.1. Post-Consumer PET Bottles
1.1.1. Physical Characteristics of Post-Consumer PET Bottles
1.1.2. Reducing the Problem to an Empirical Level
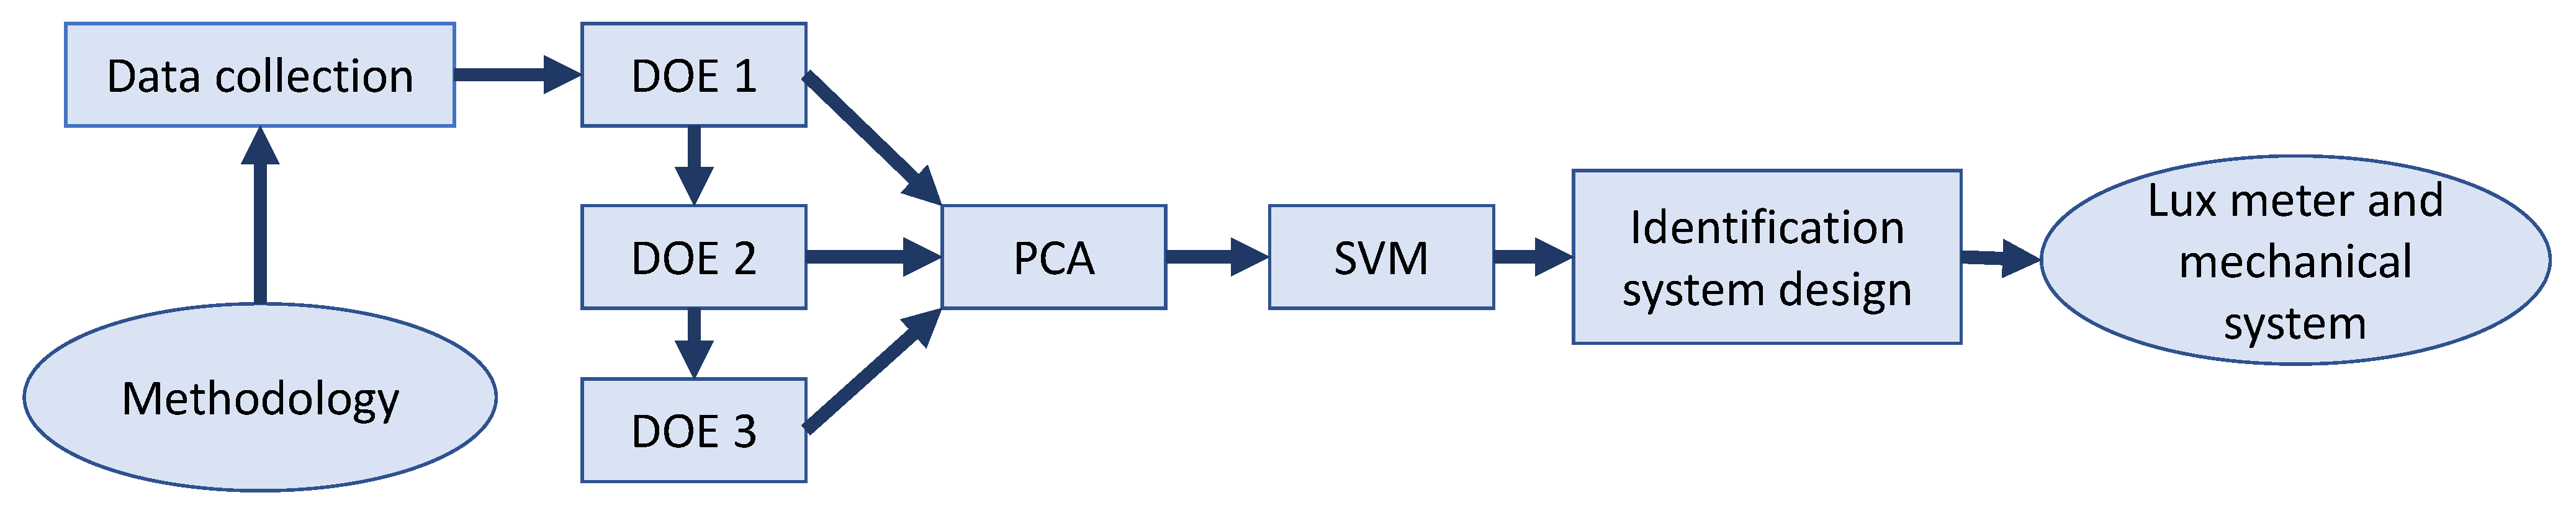
2. Methodology
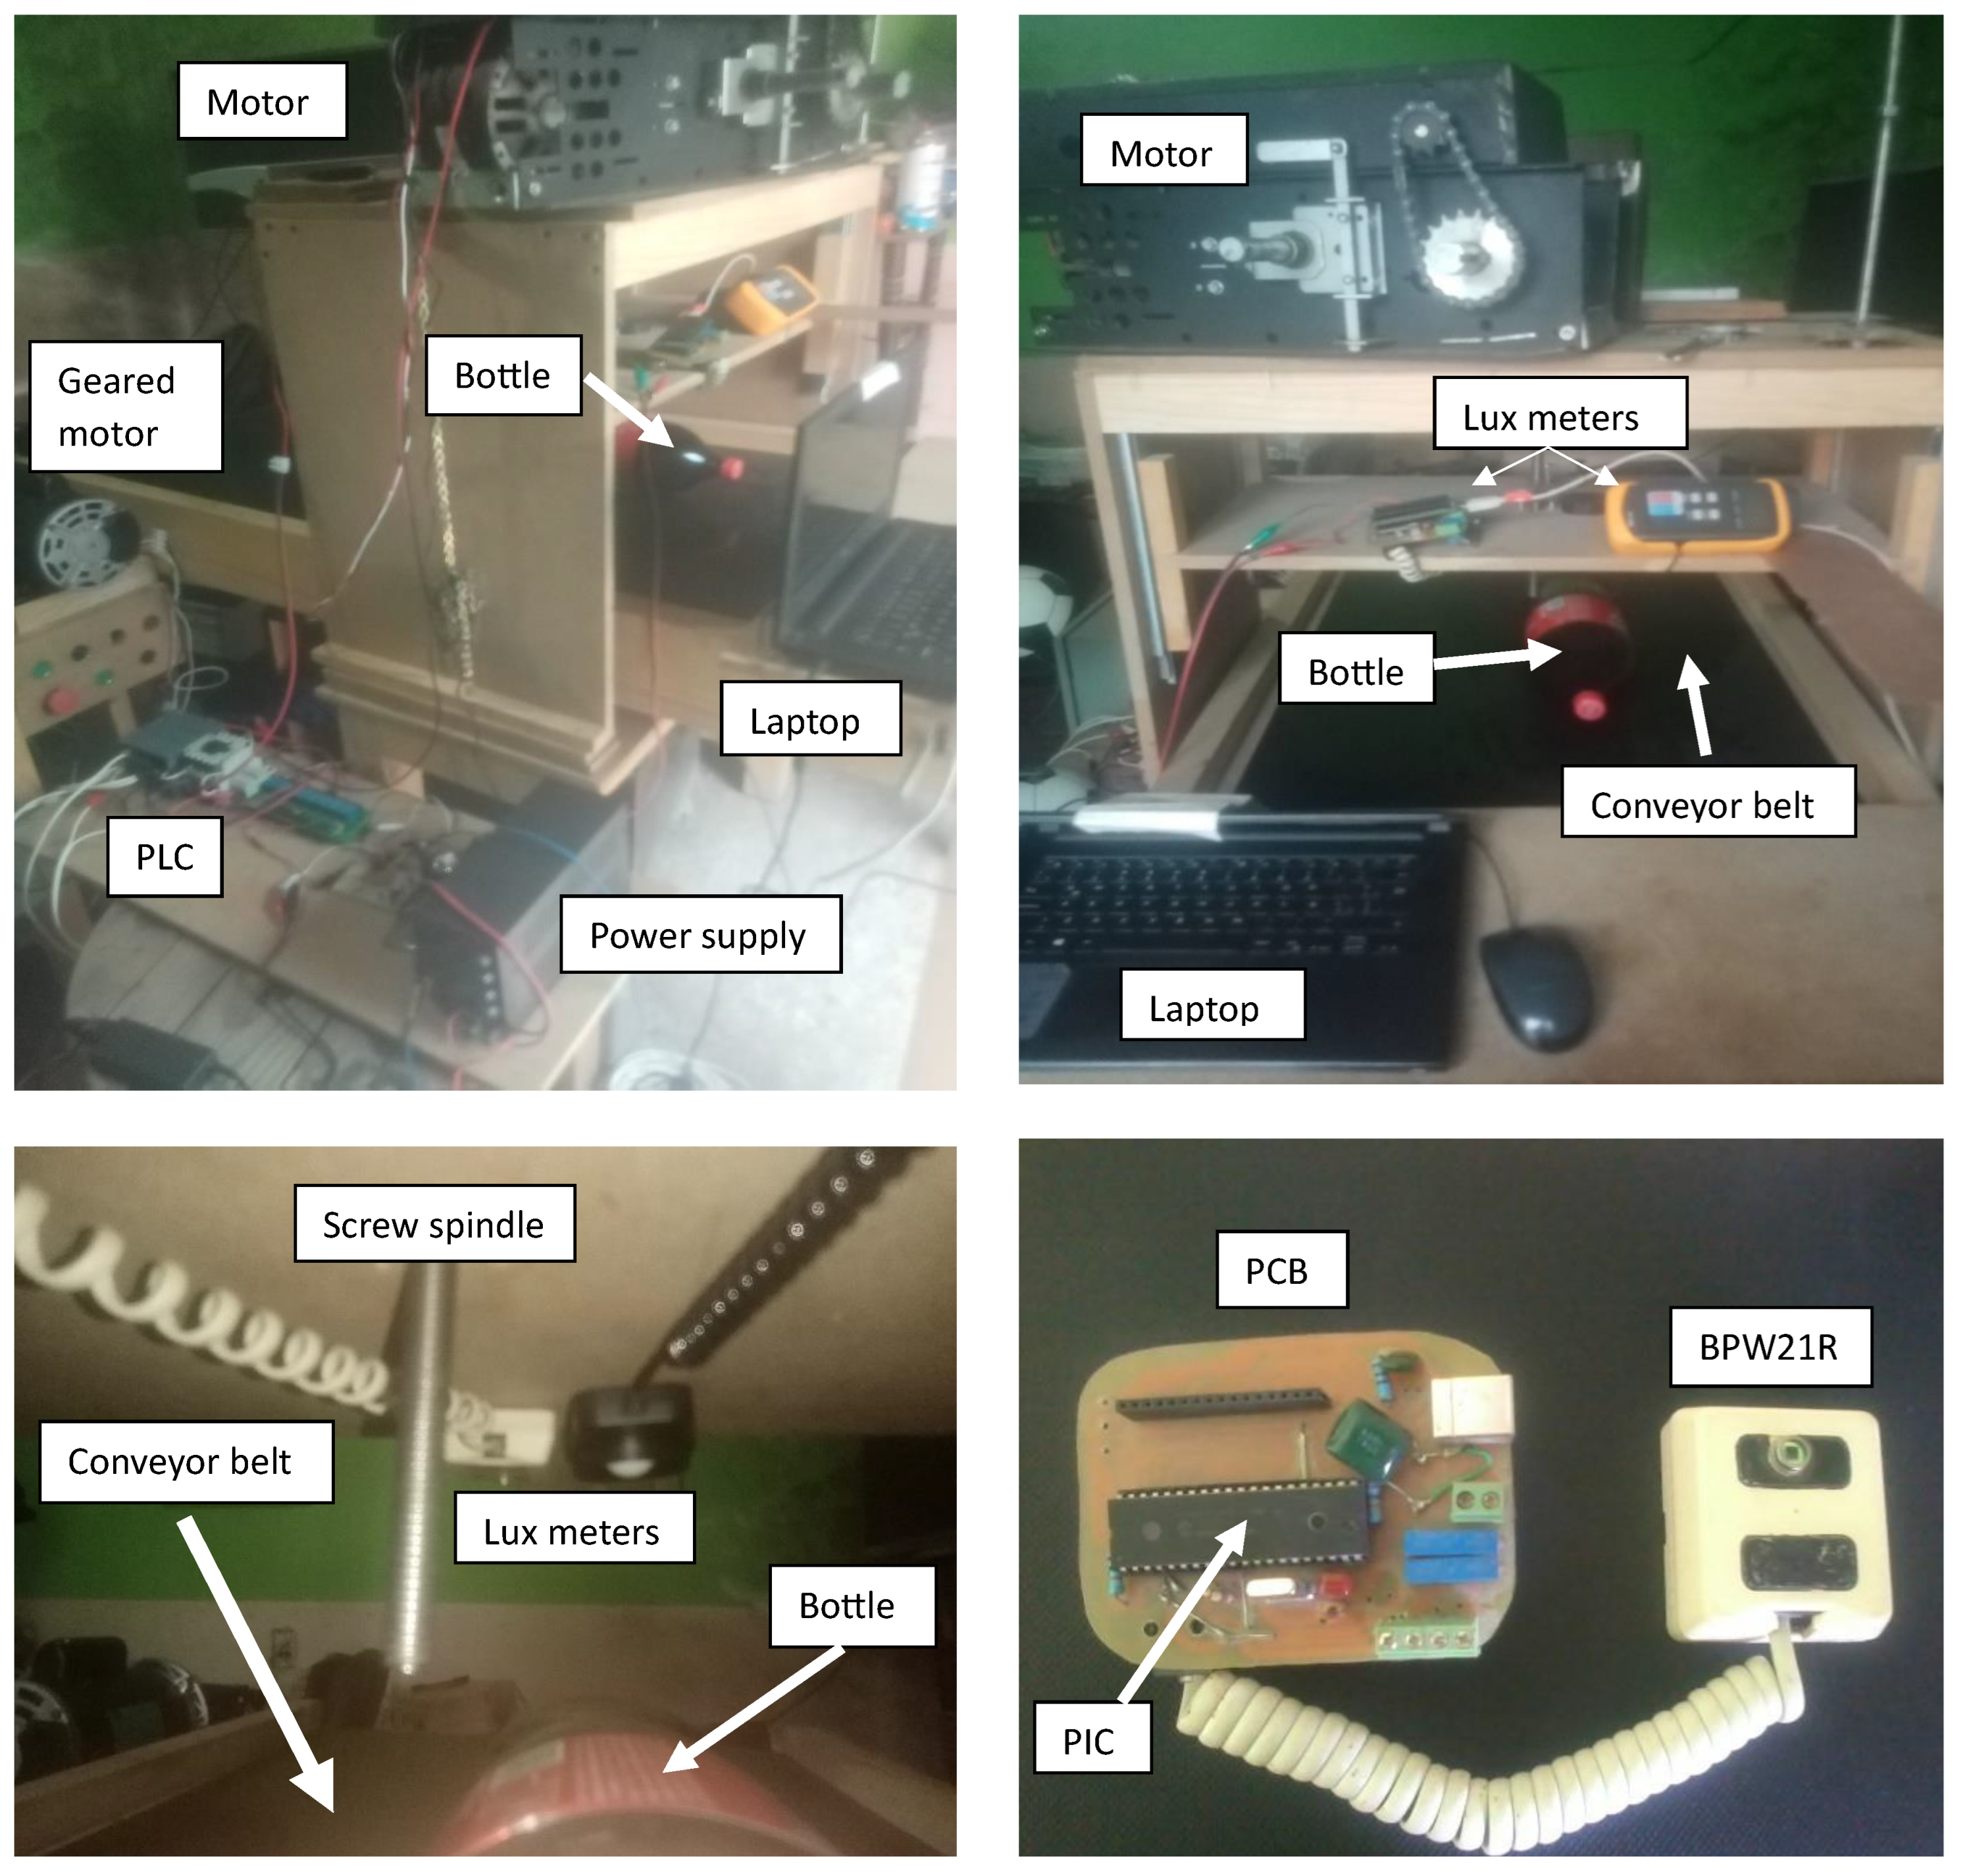
2.1. Materials
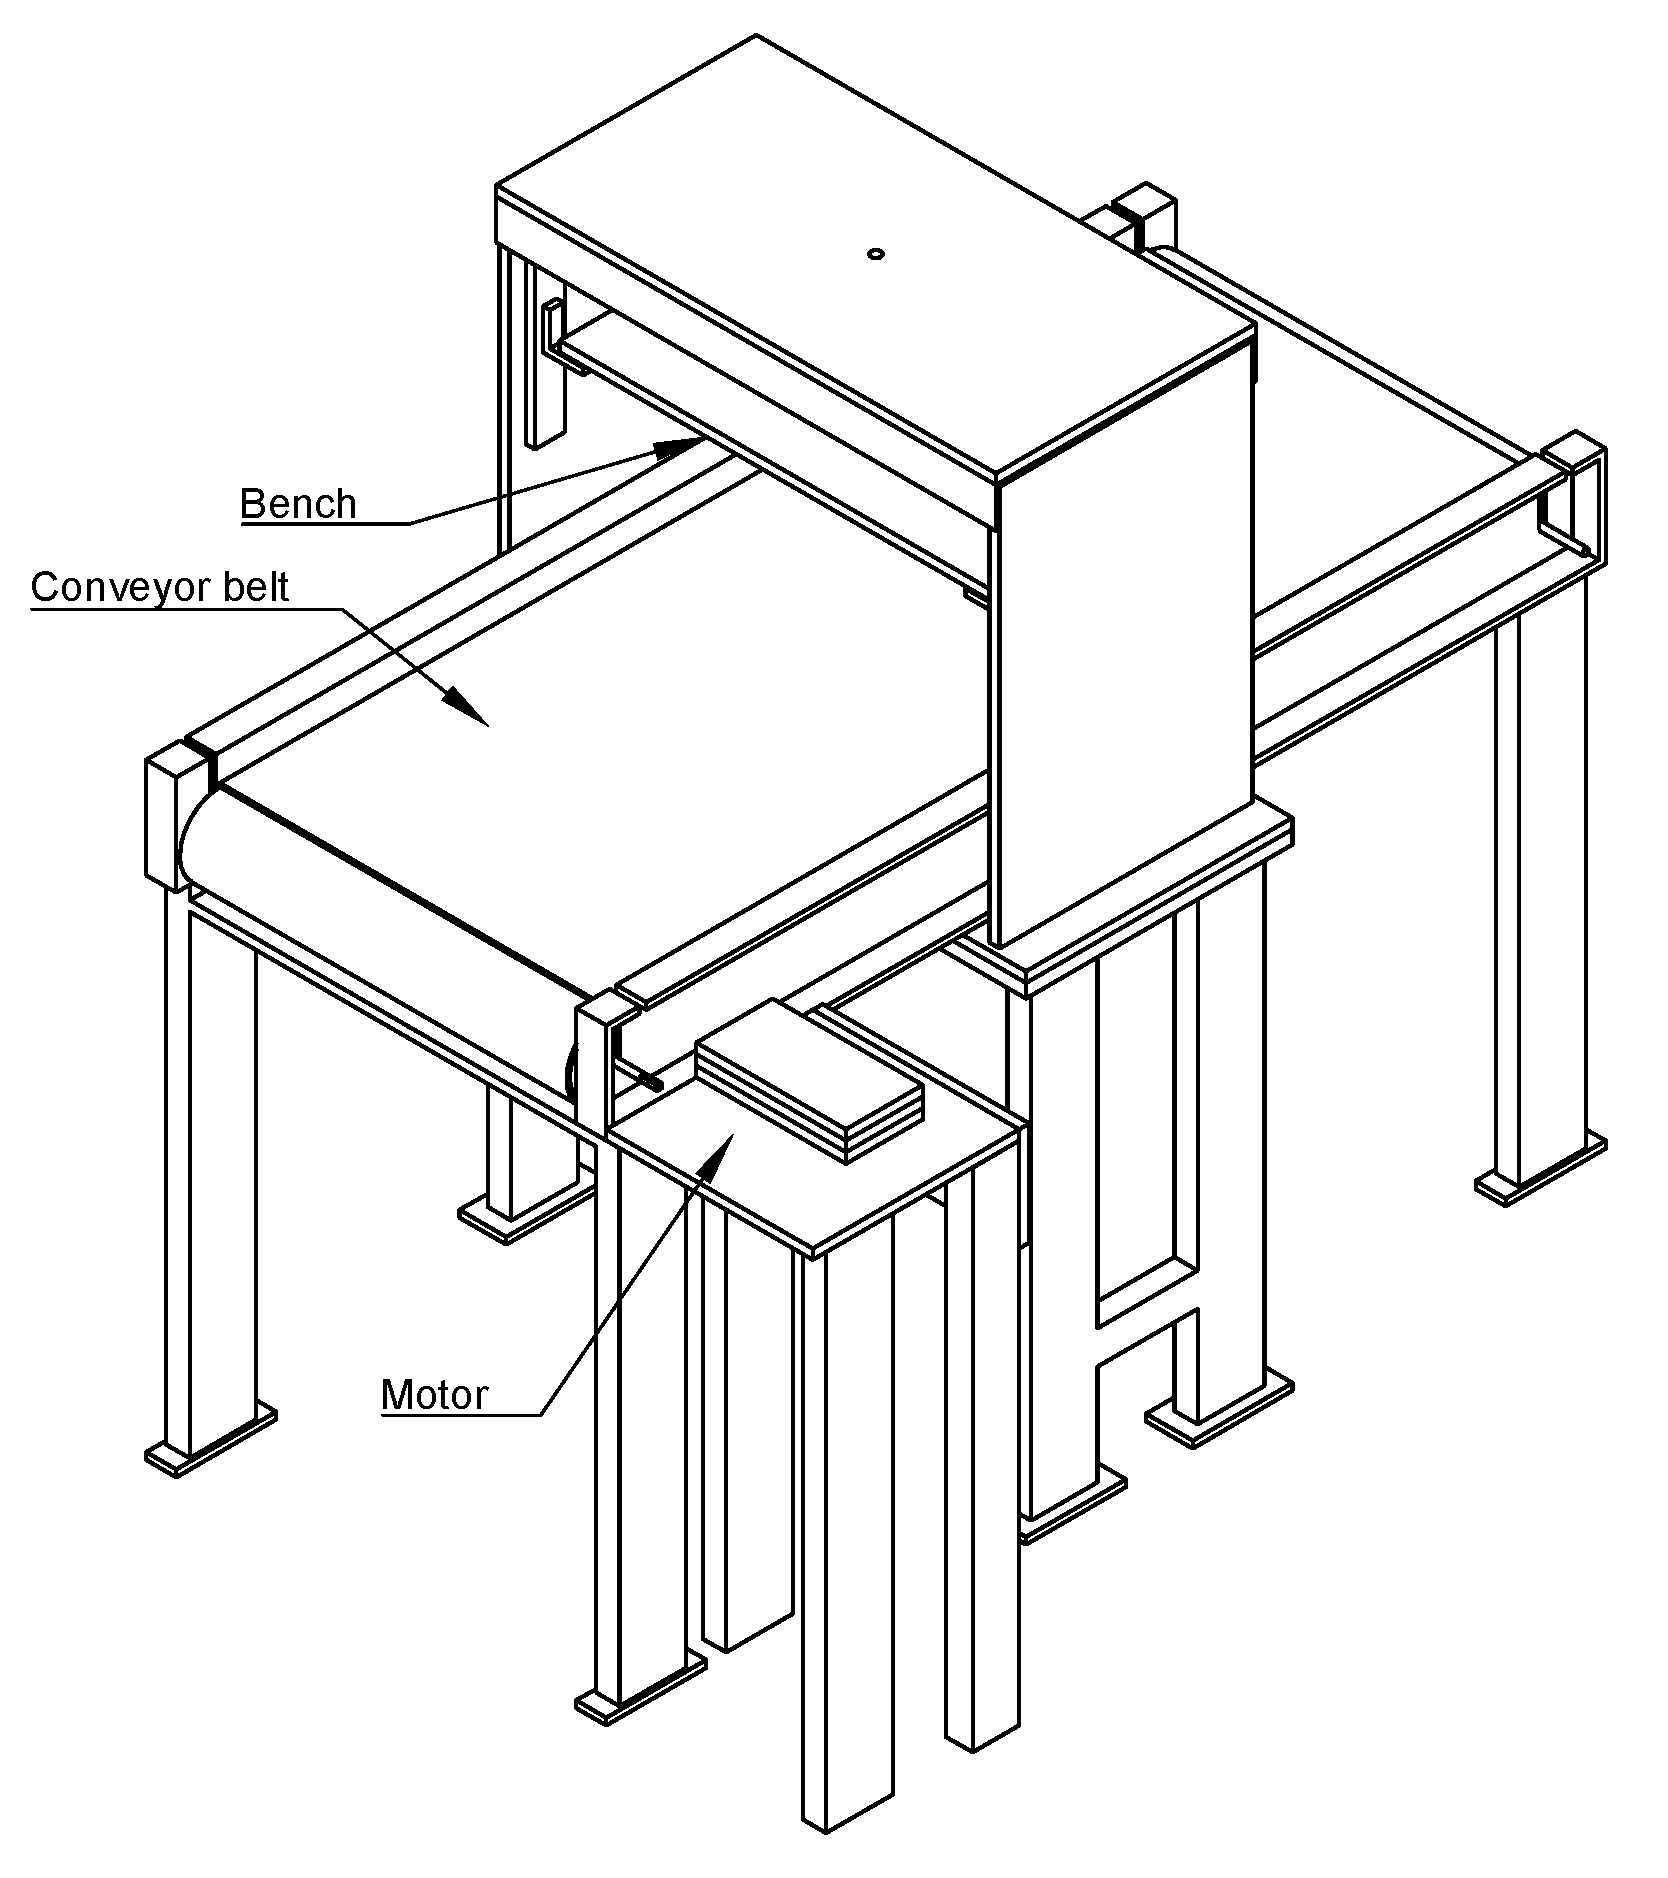
2.1.1. Mechanical Design Parameters
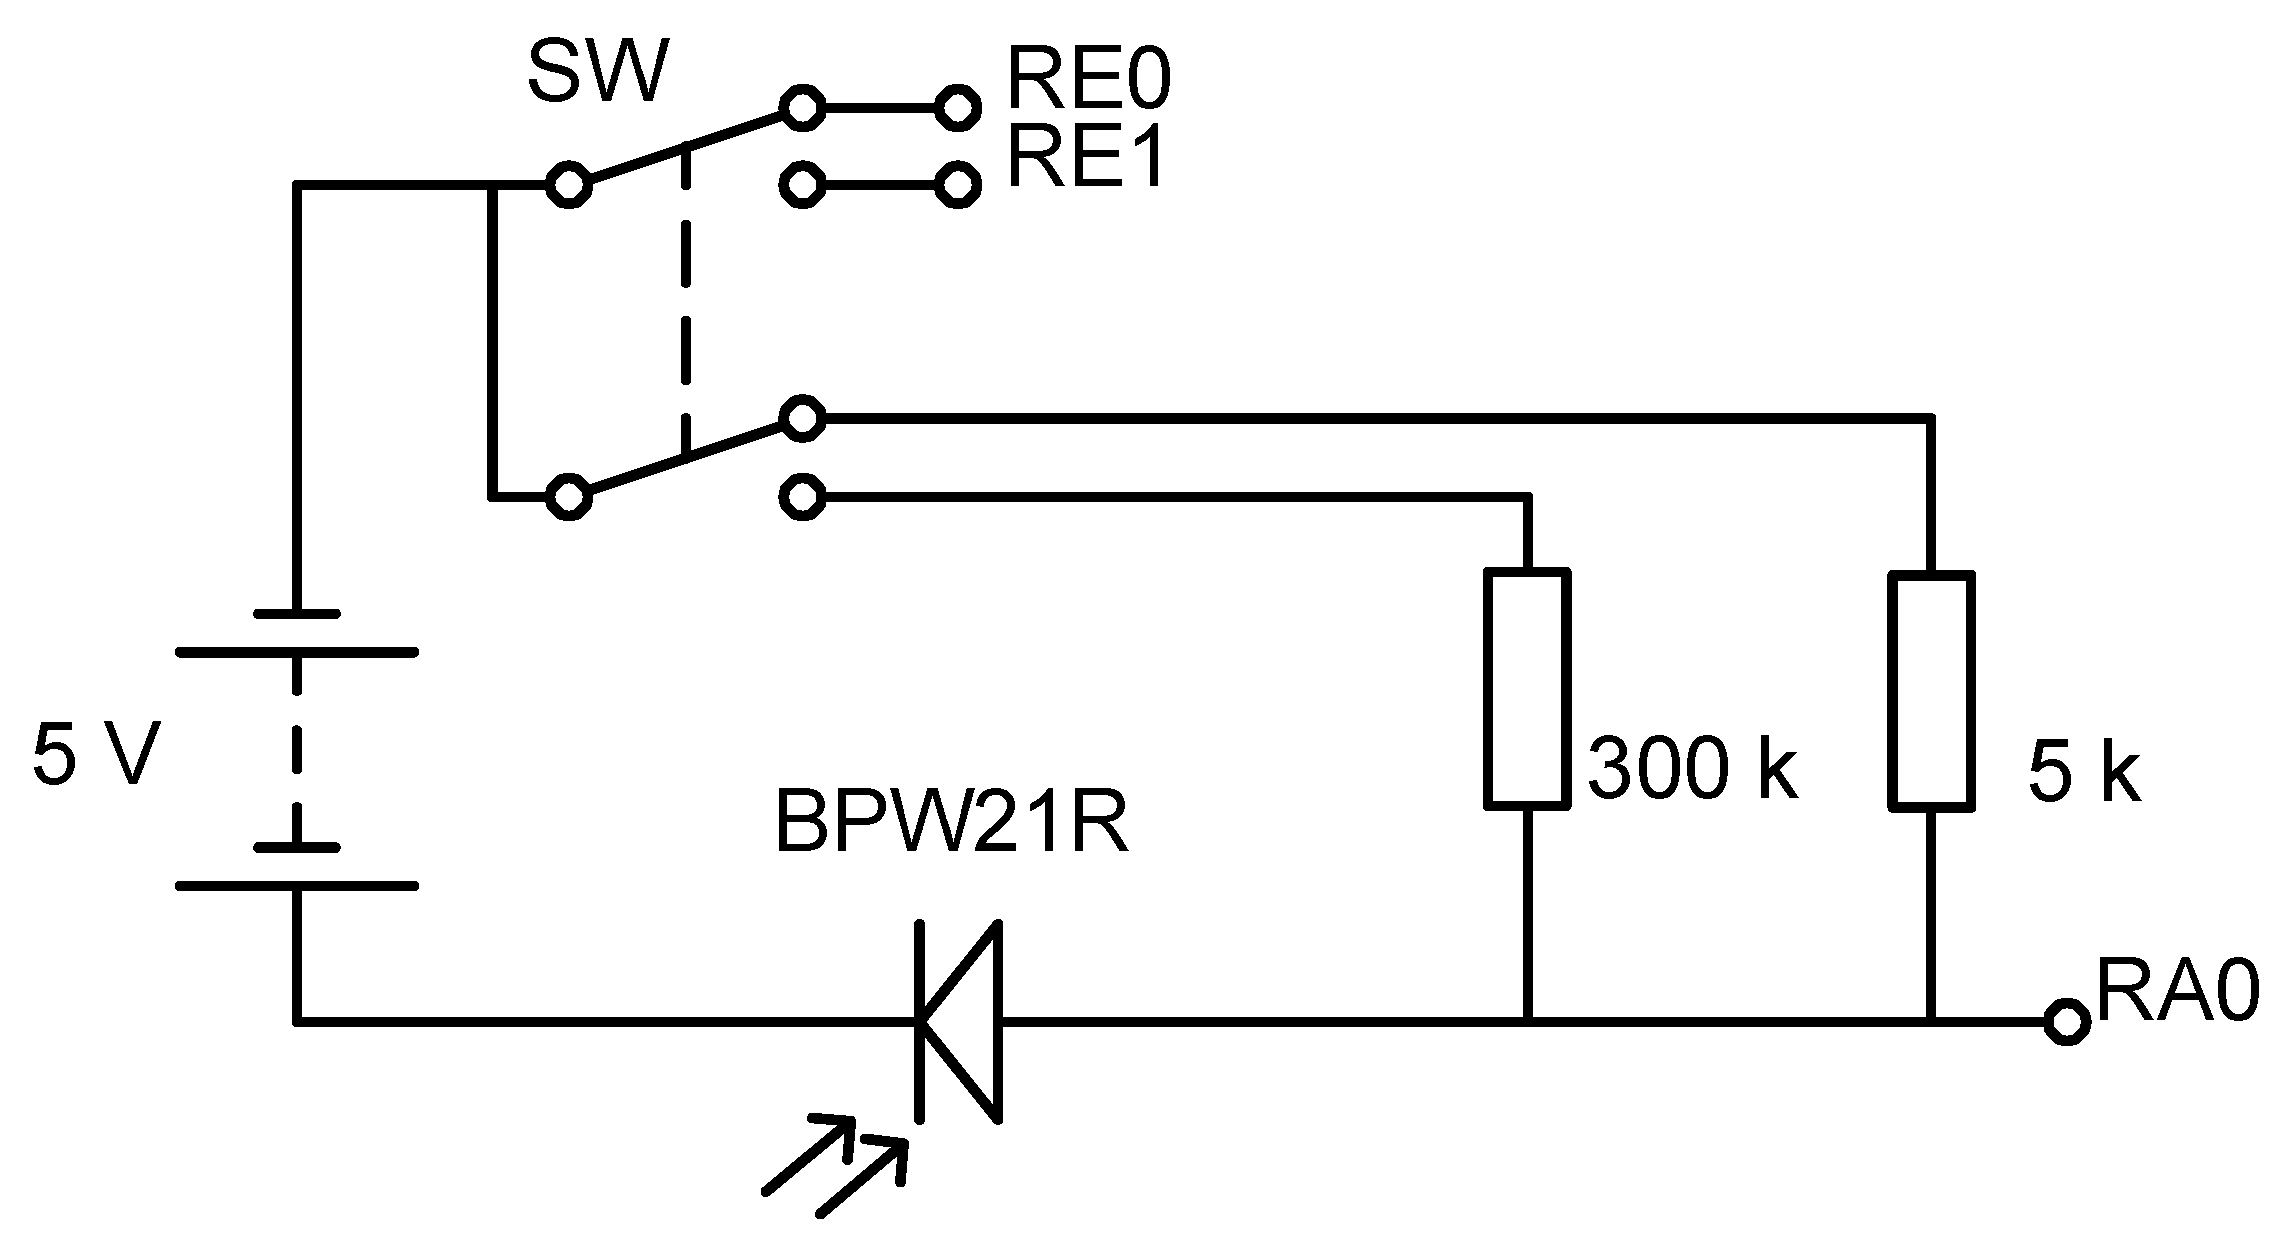
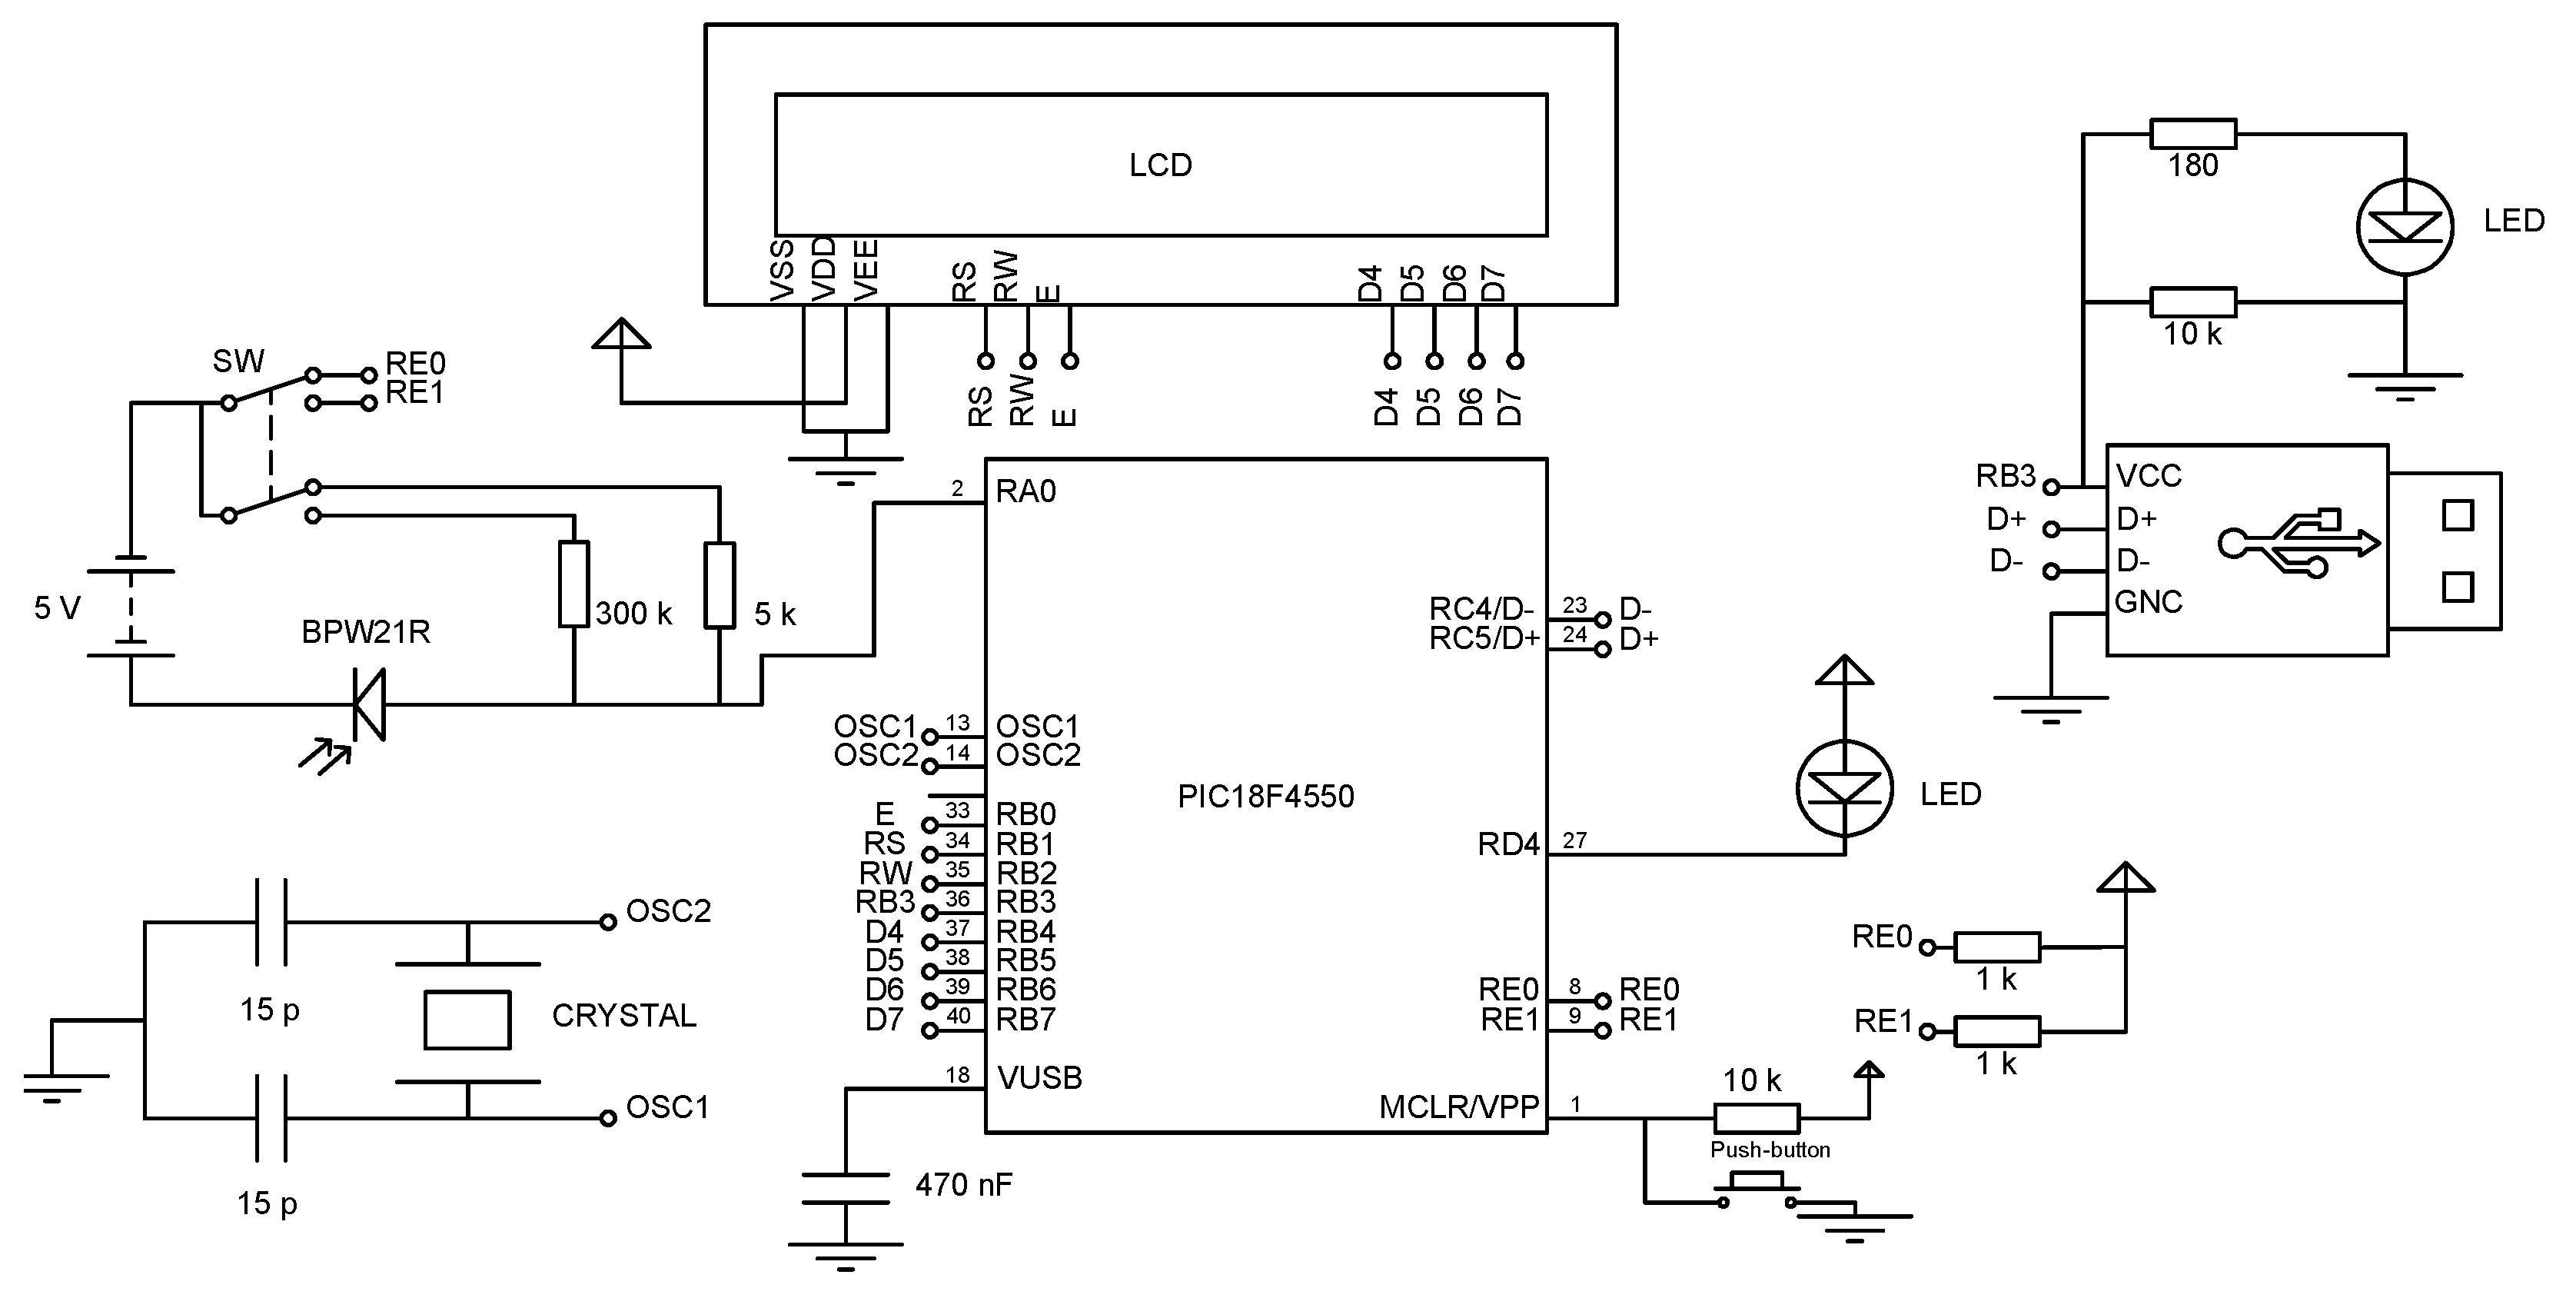
2.1.2. Electronic Card
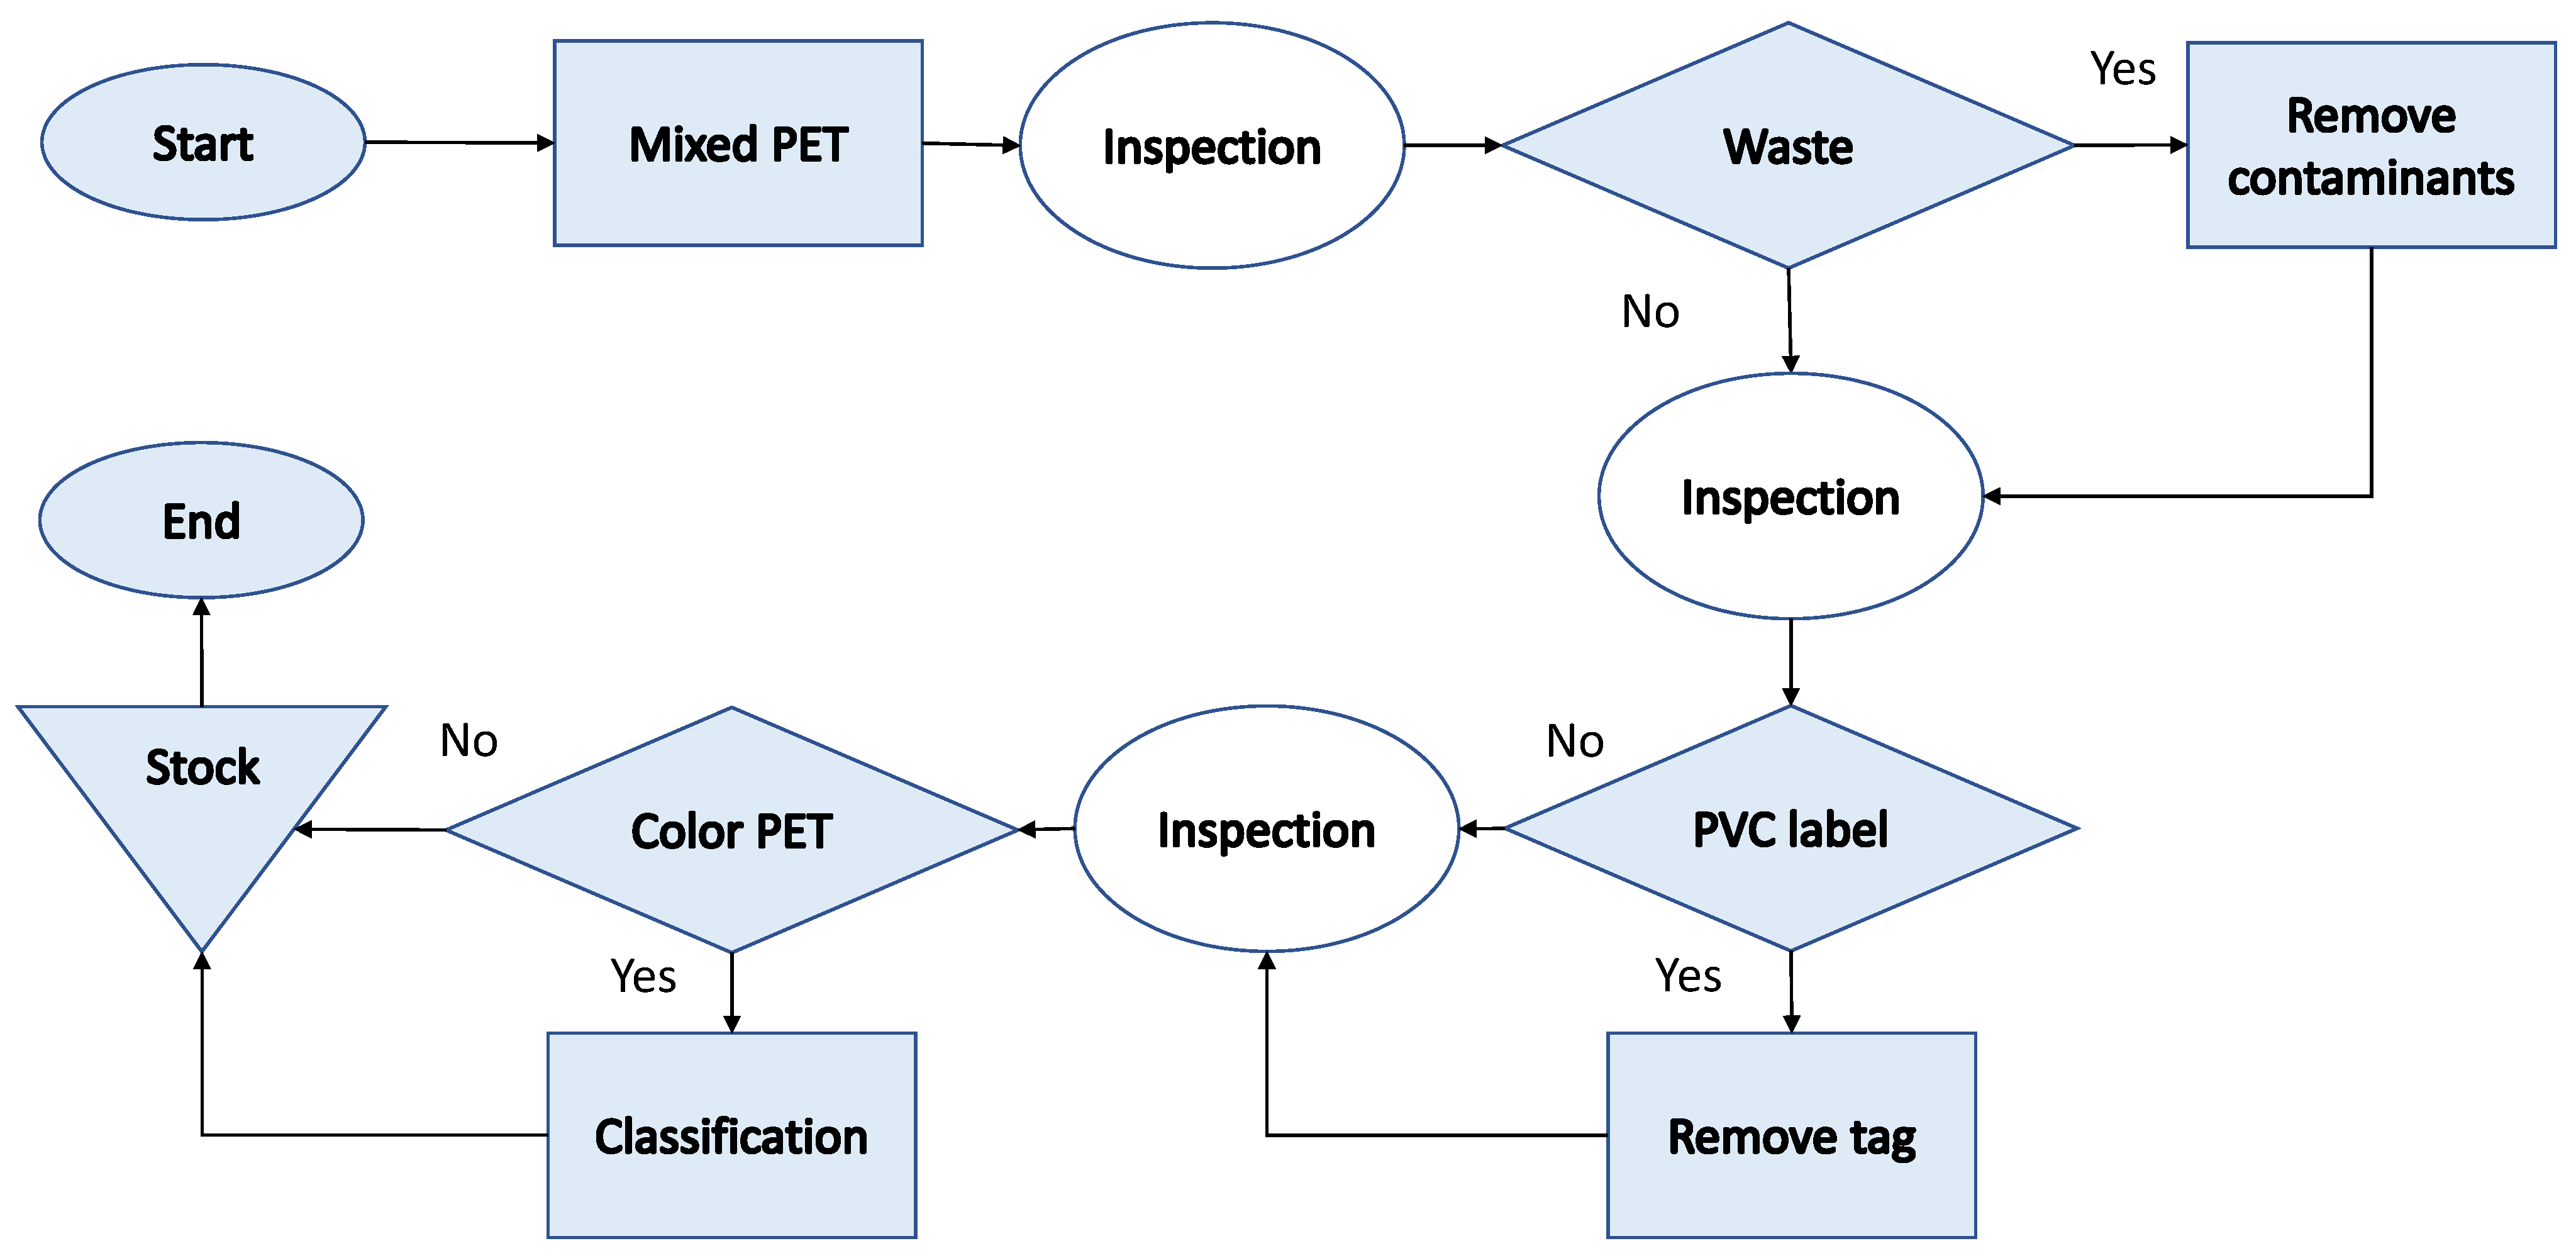
2.2. Description of the Manual Bottle Classification Process
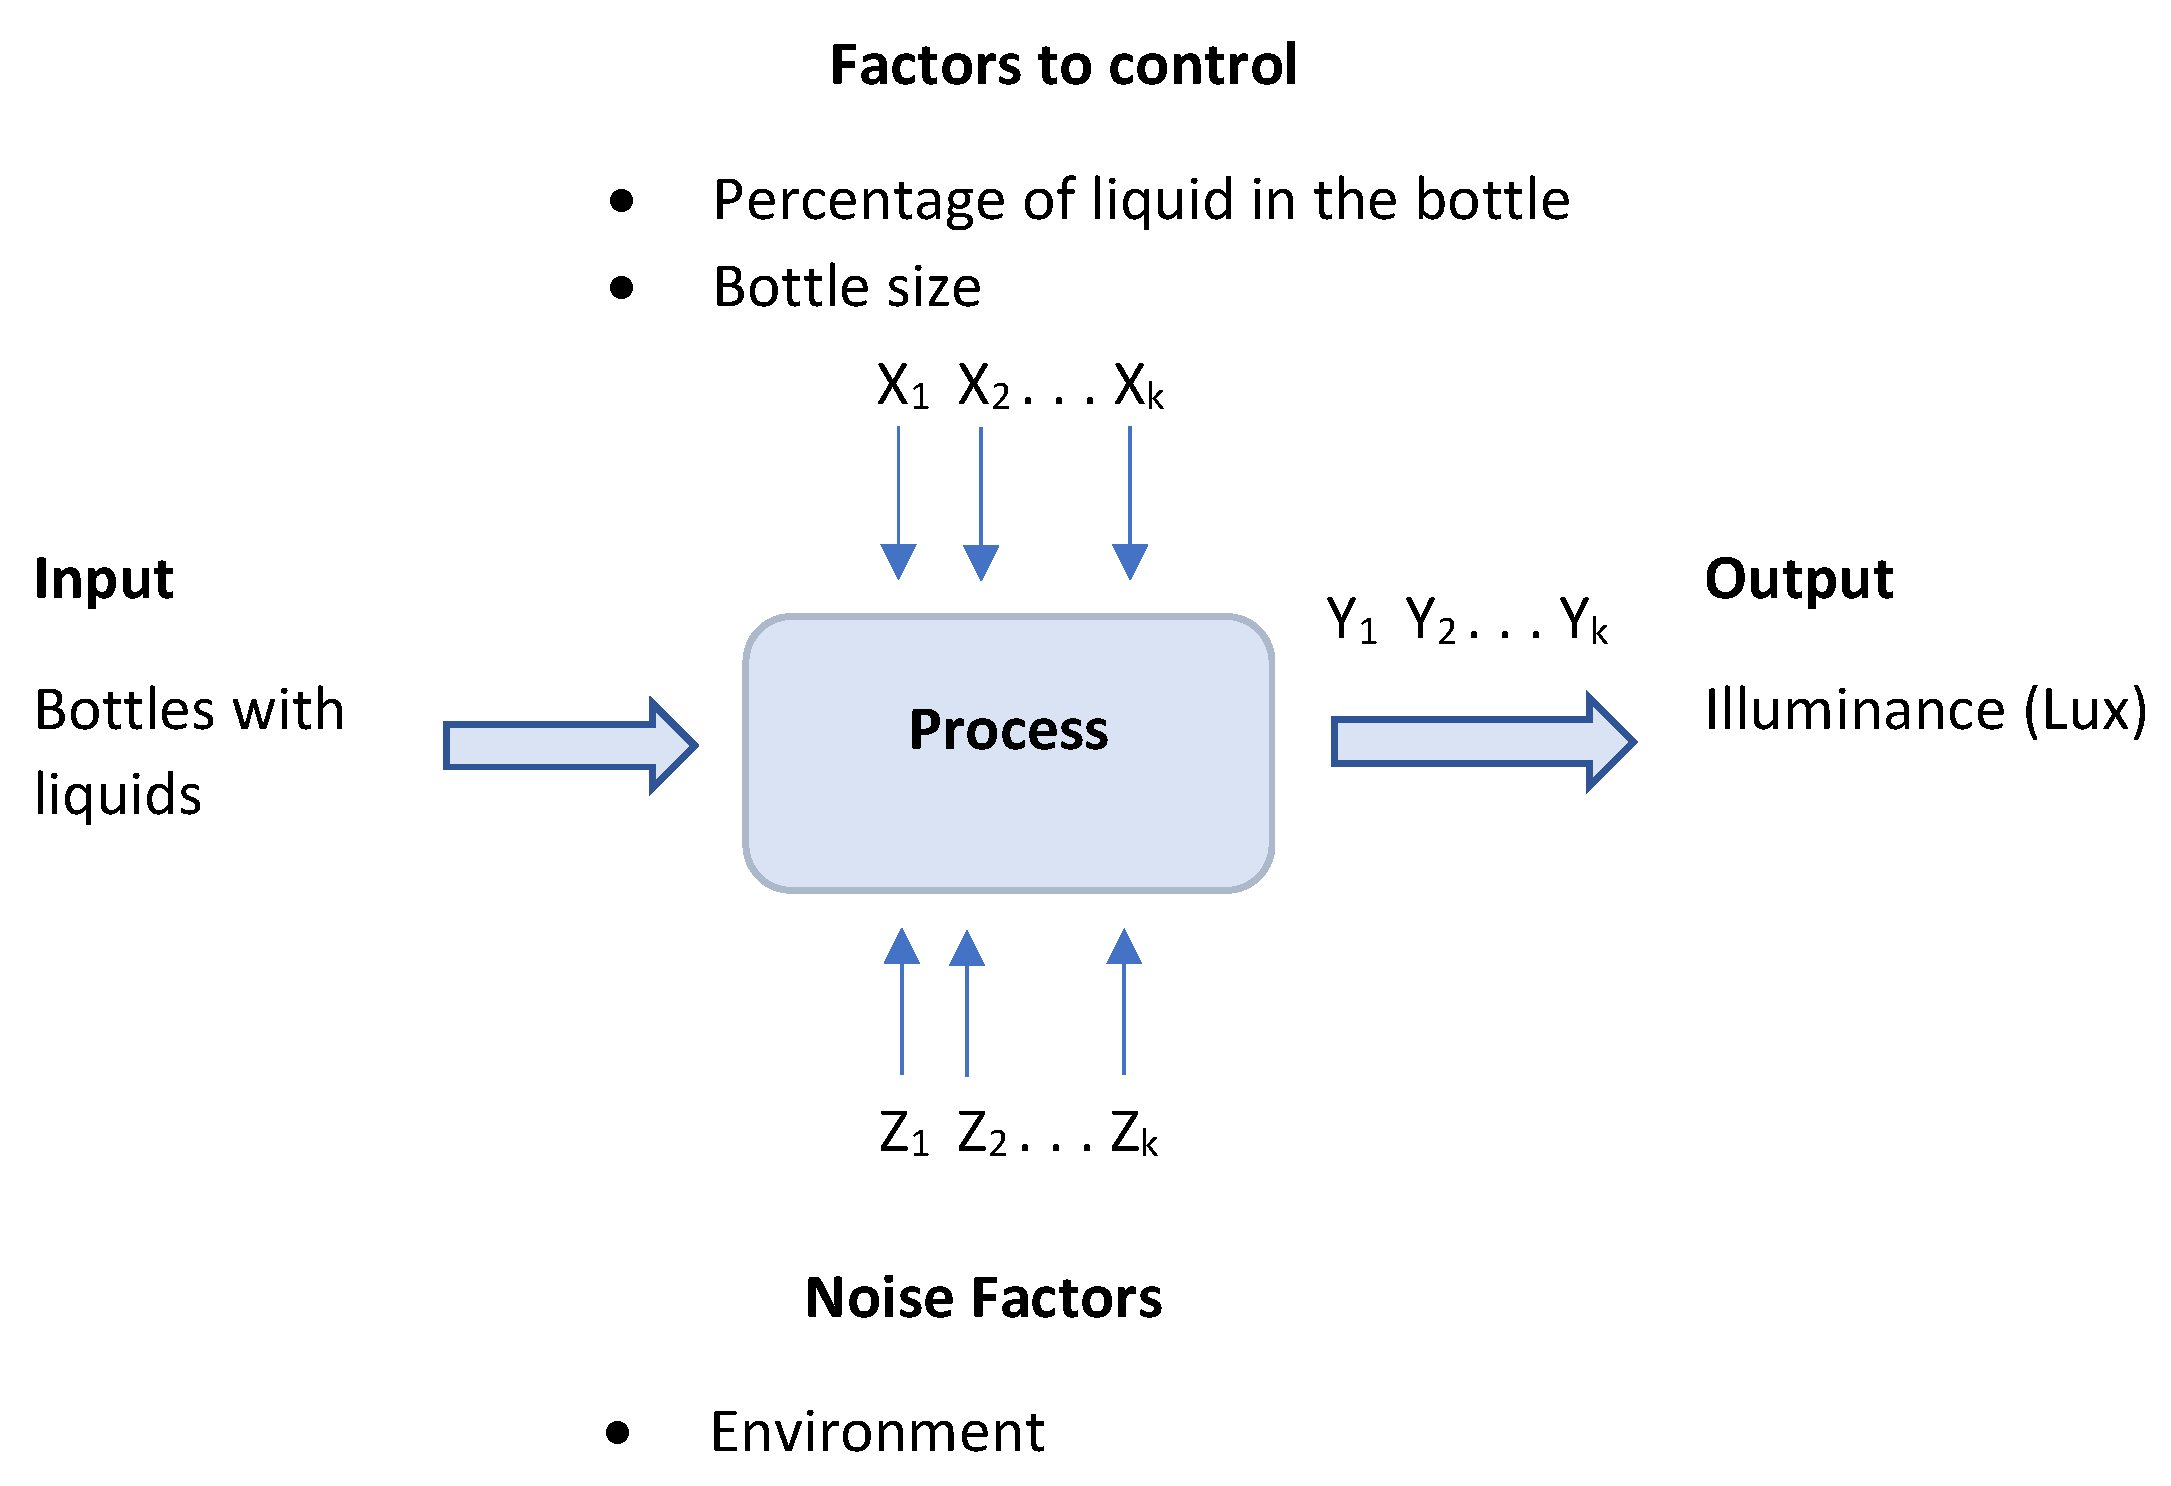
2.3. Design of Experiments for Variable Identification
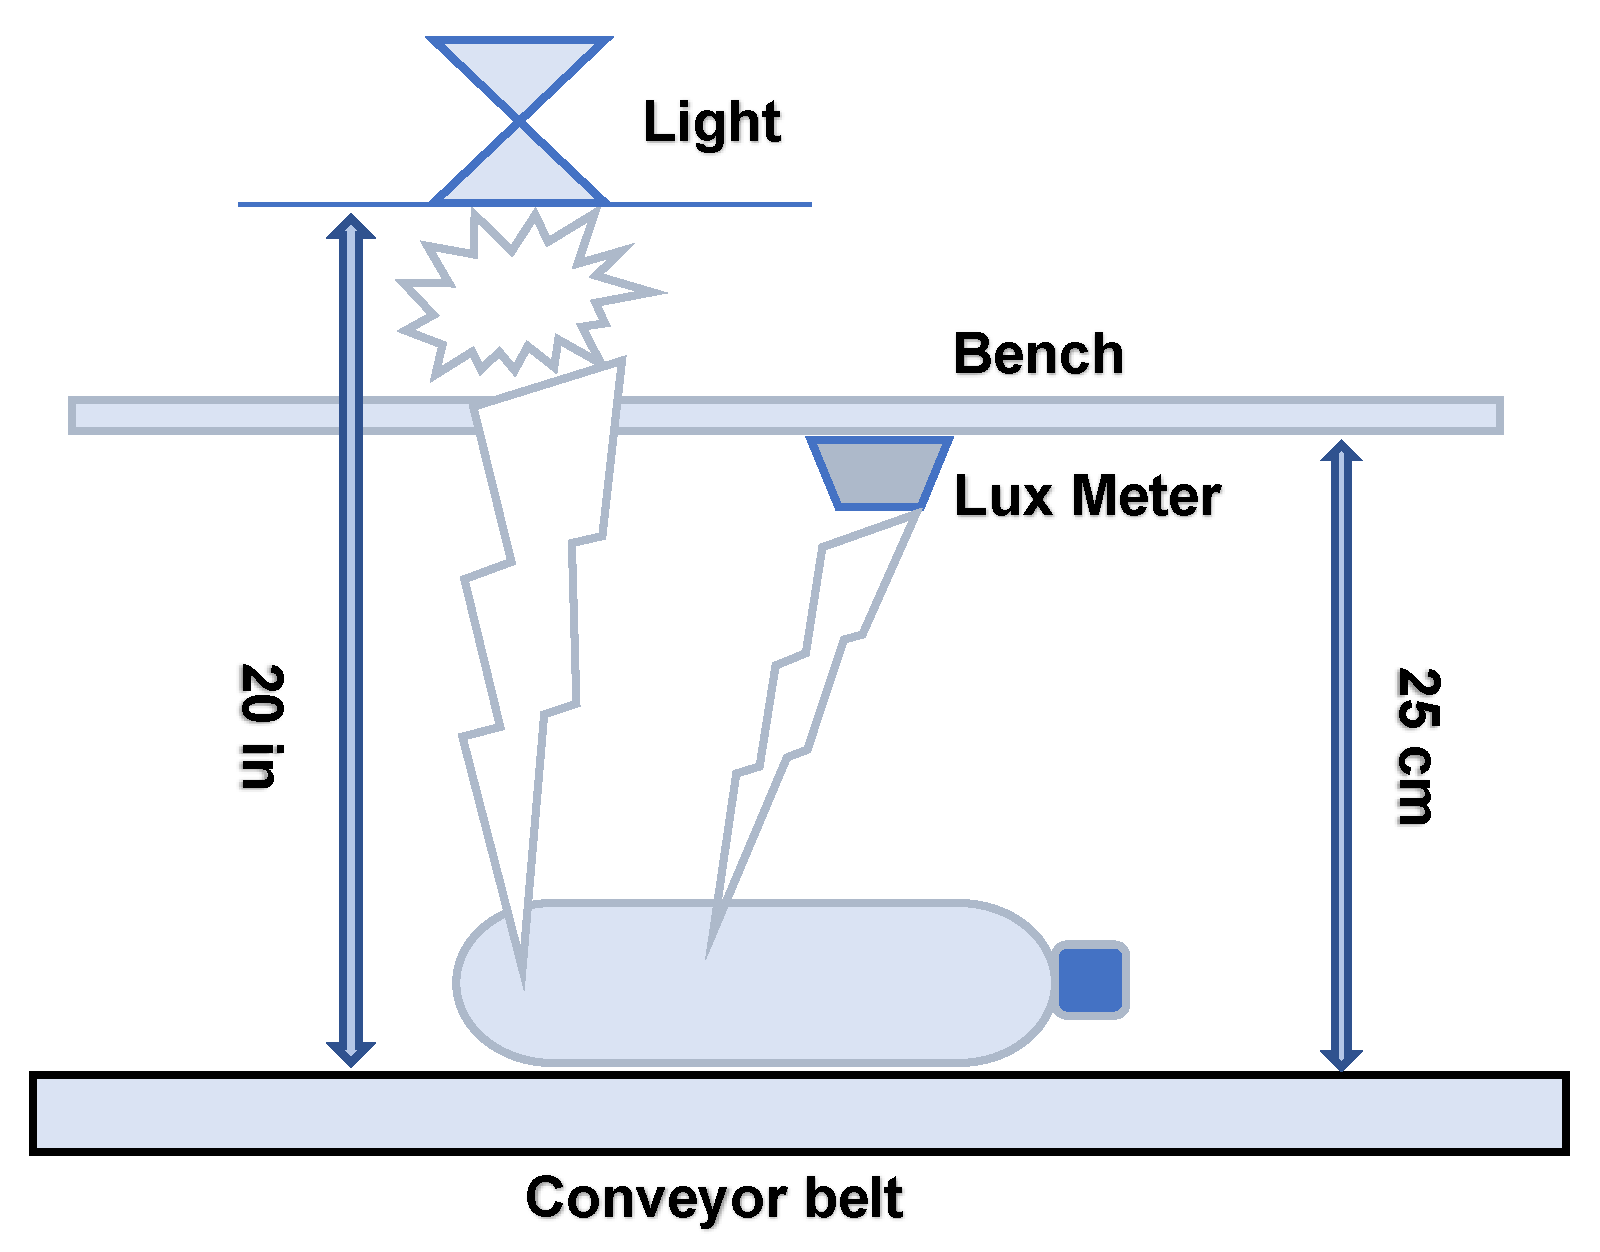
2.3.1. Design of Experiments to Determine the Distance and Working Range of the Lux Meter
2.3.2. Design of Experiments to Identify the Minimum Amount of Liquids inside the Bottle
2.3.3. Design of Experiments to Determine Label Illuminance
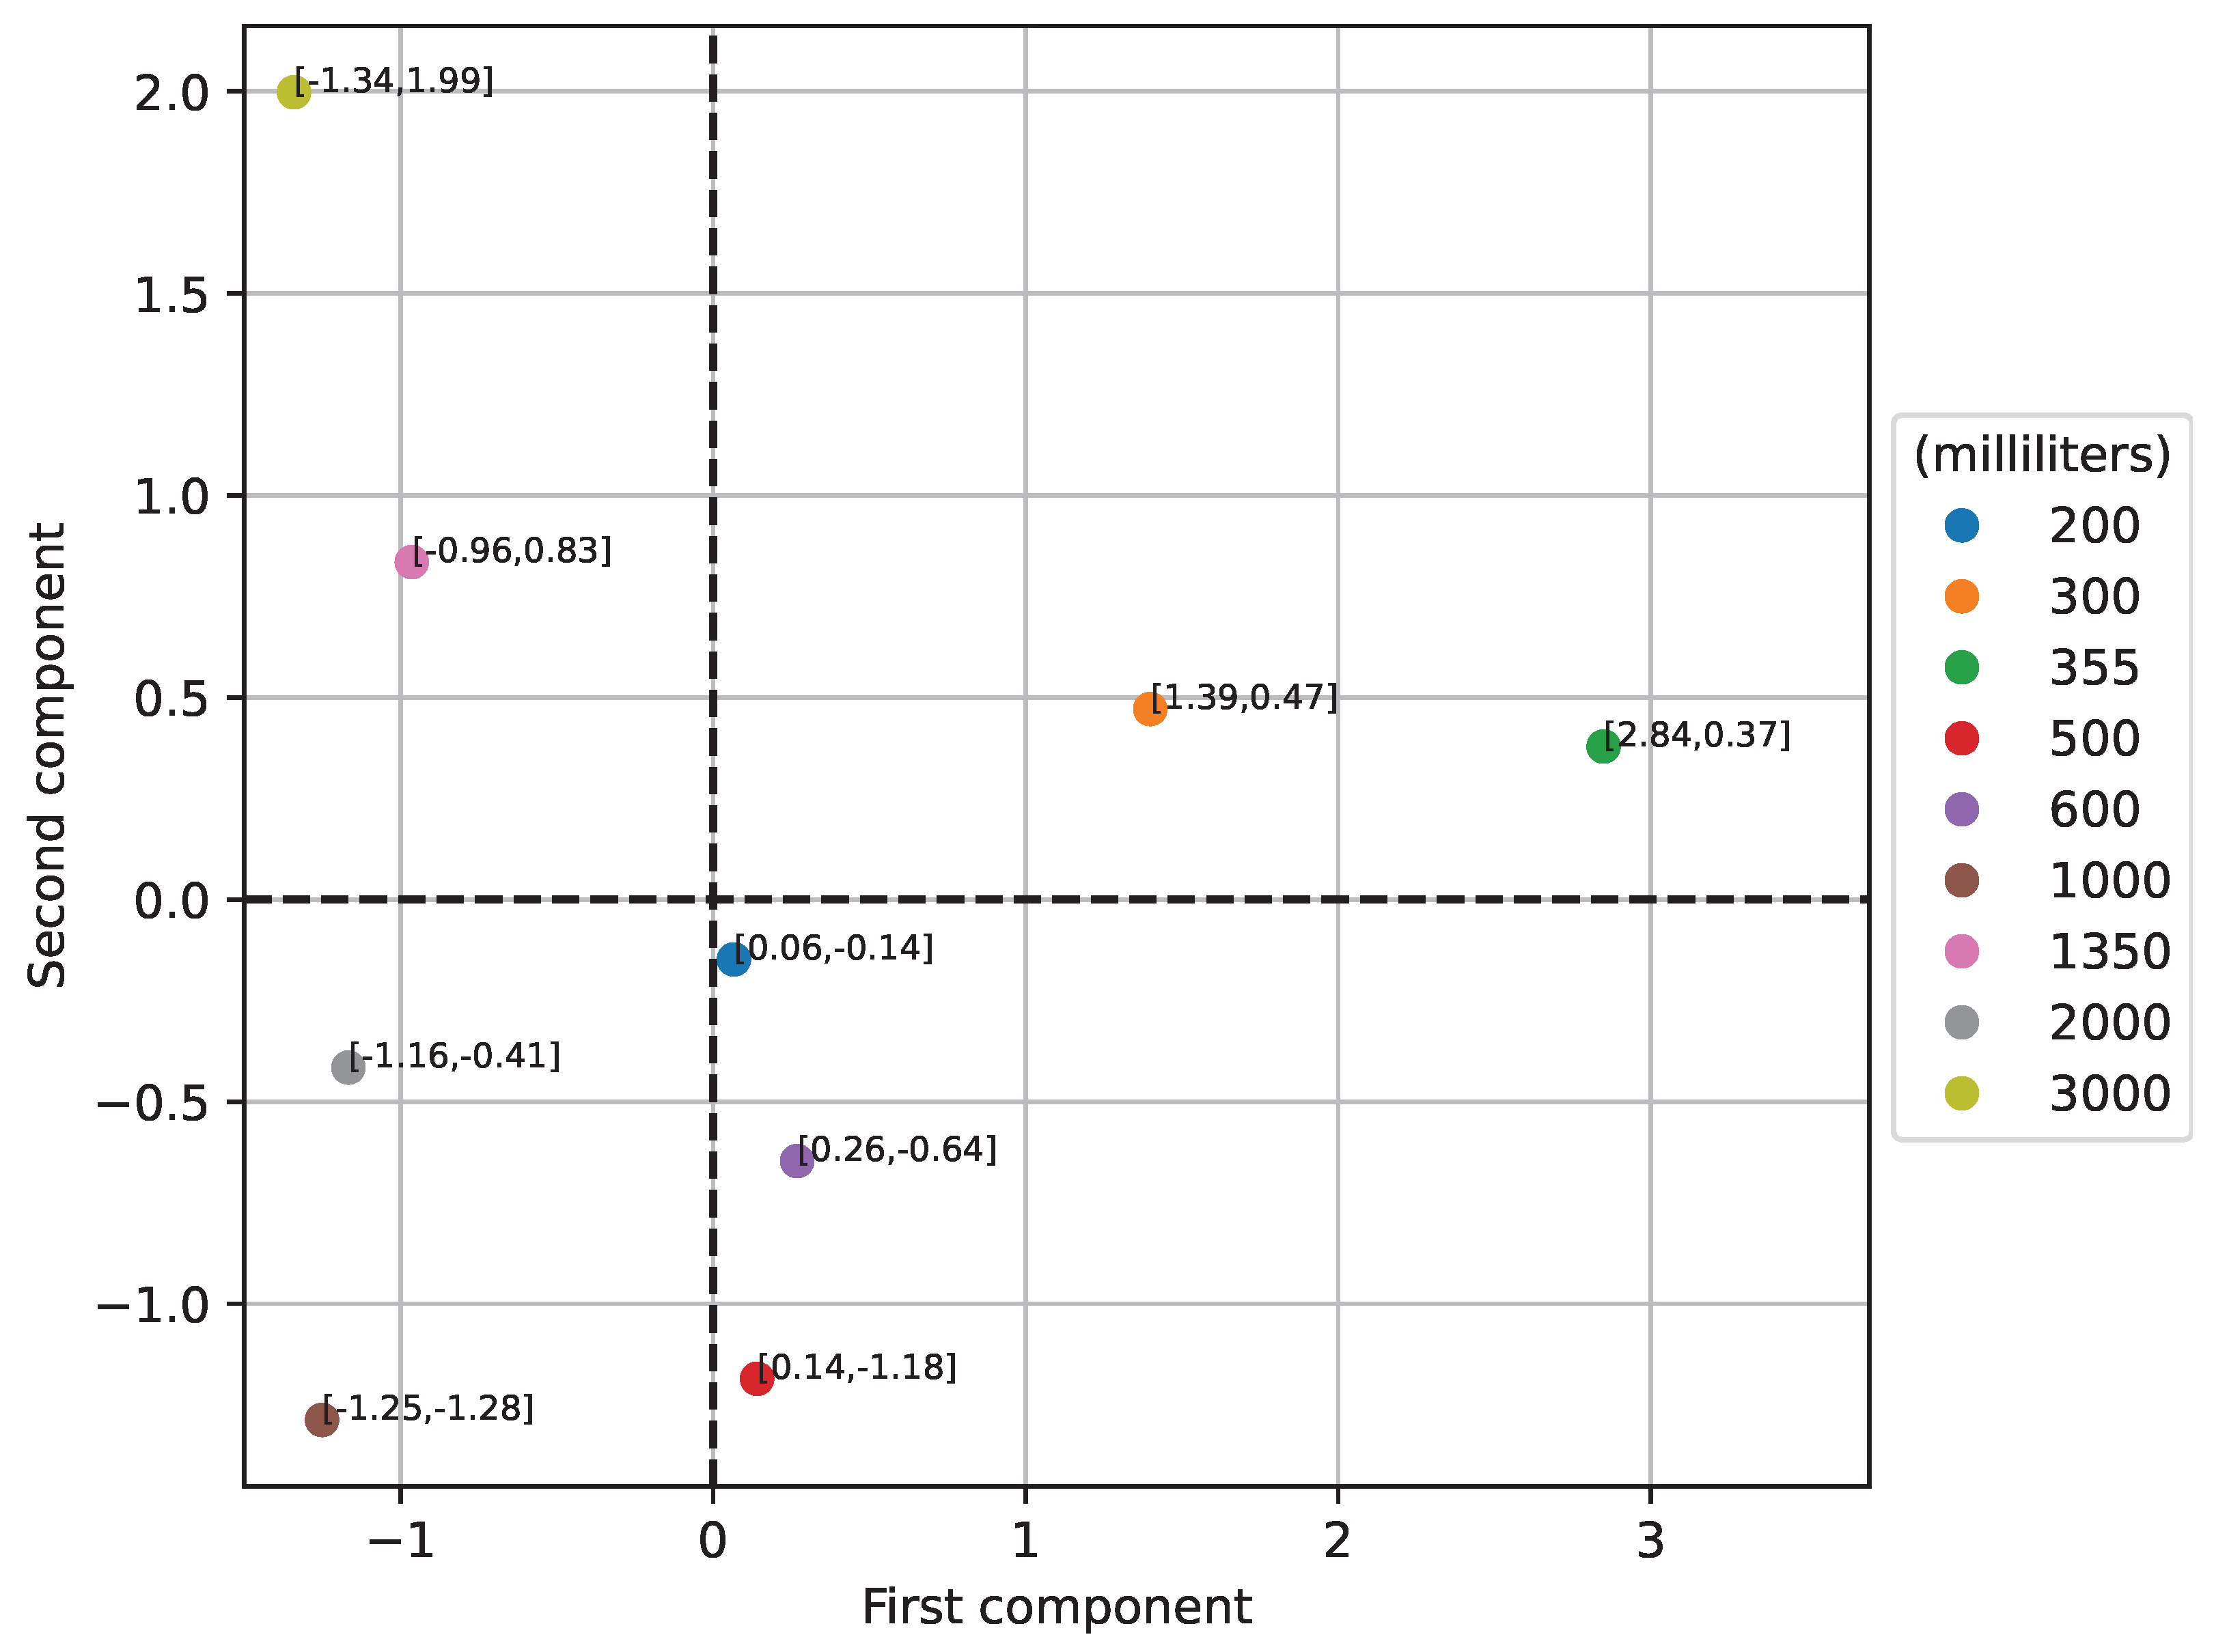
2.4. Principal Component Analysis
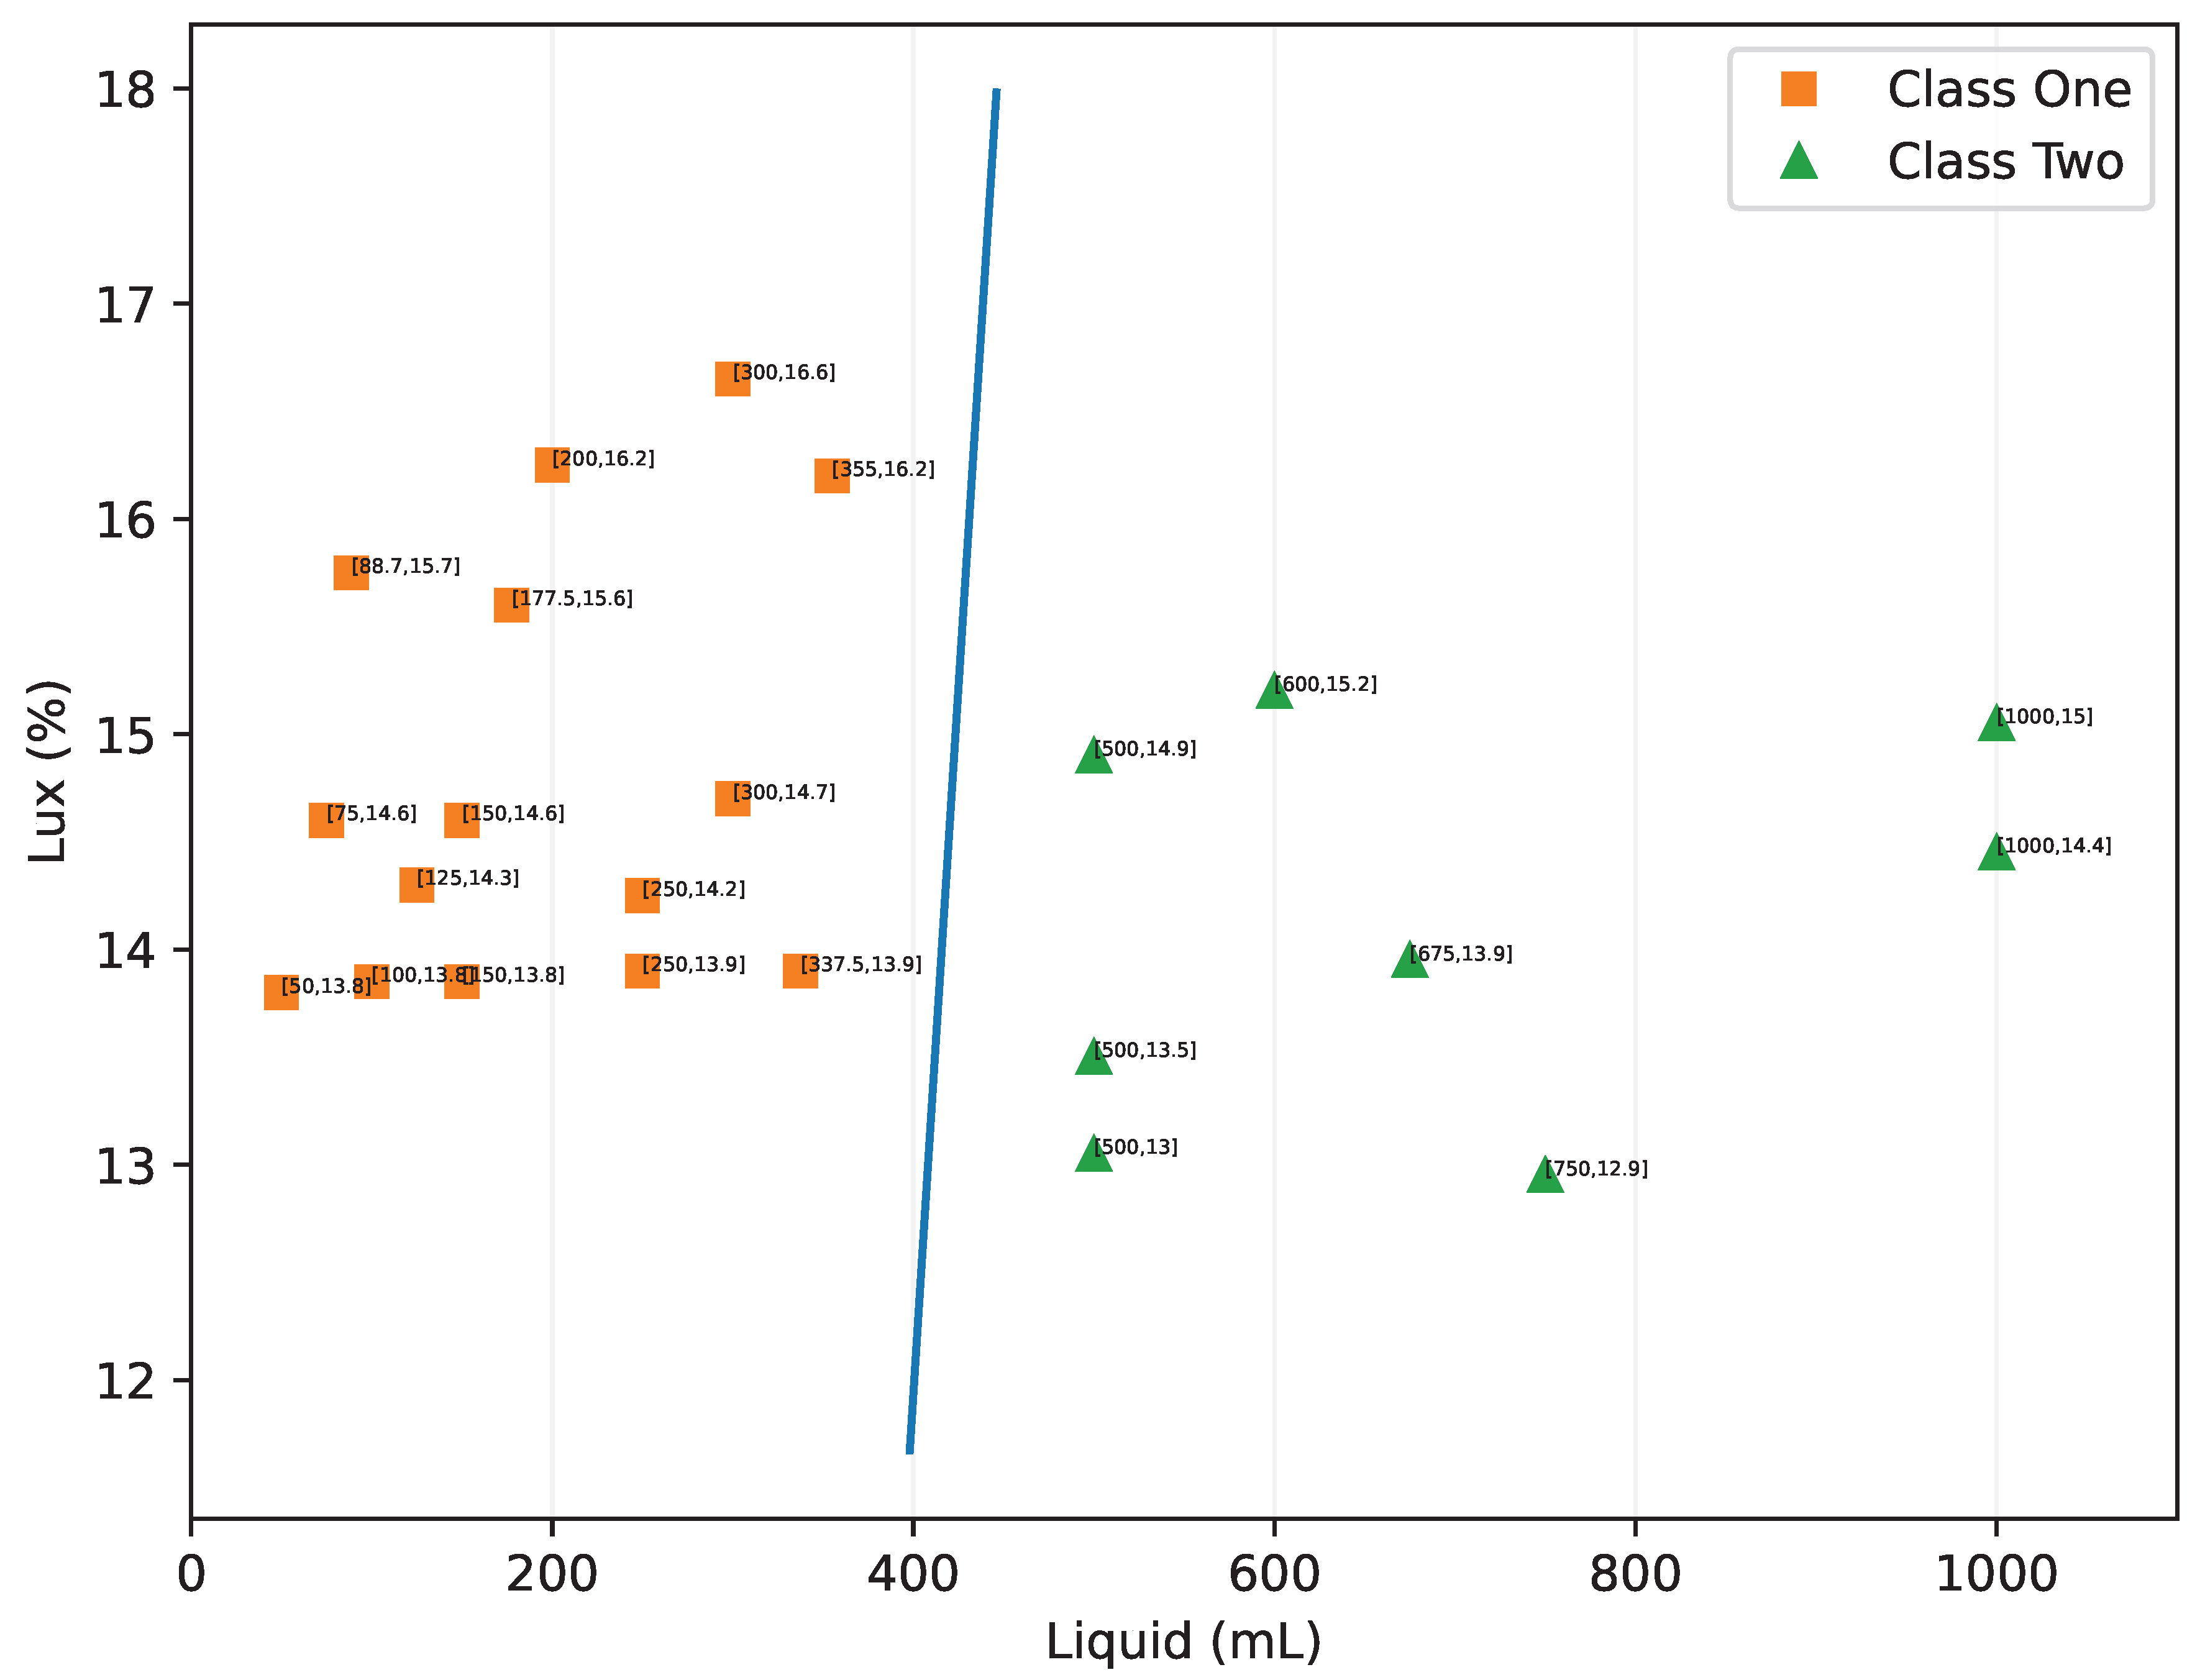
2.5. Support Vector Machine
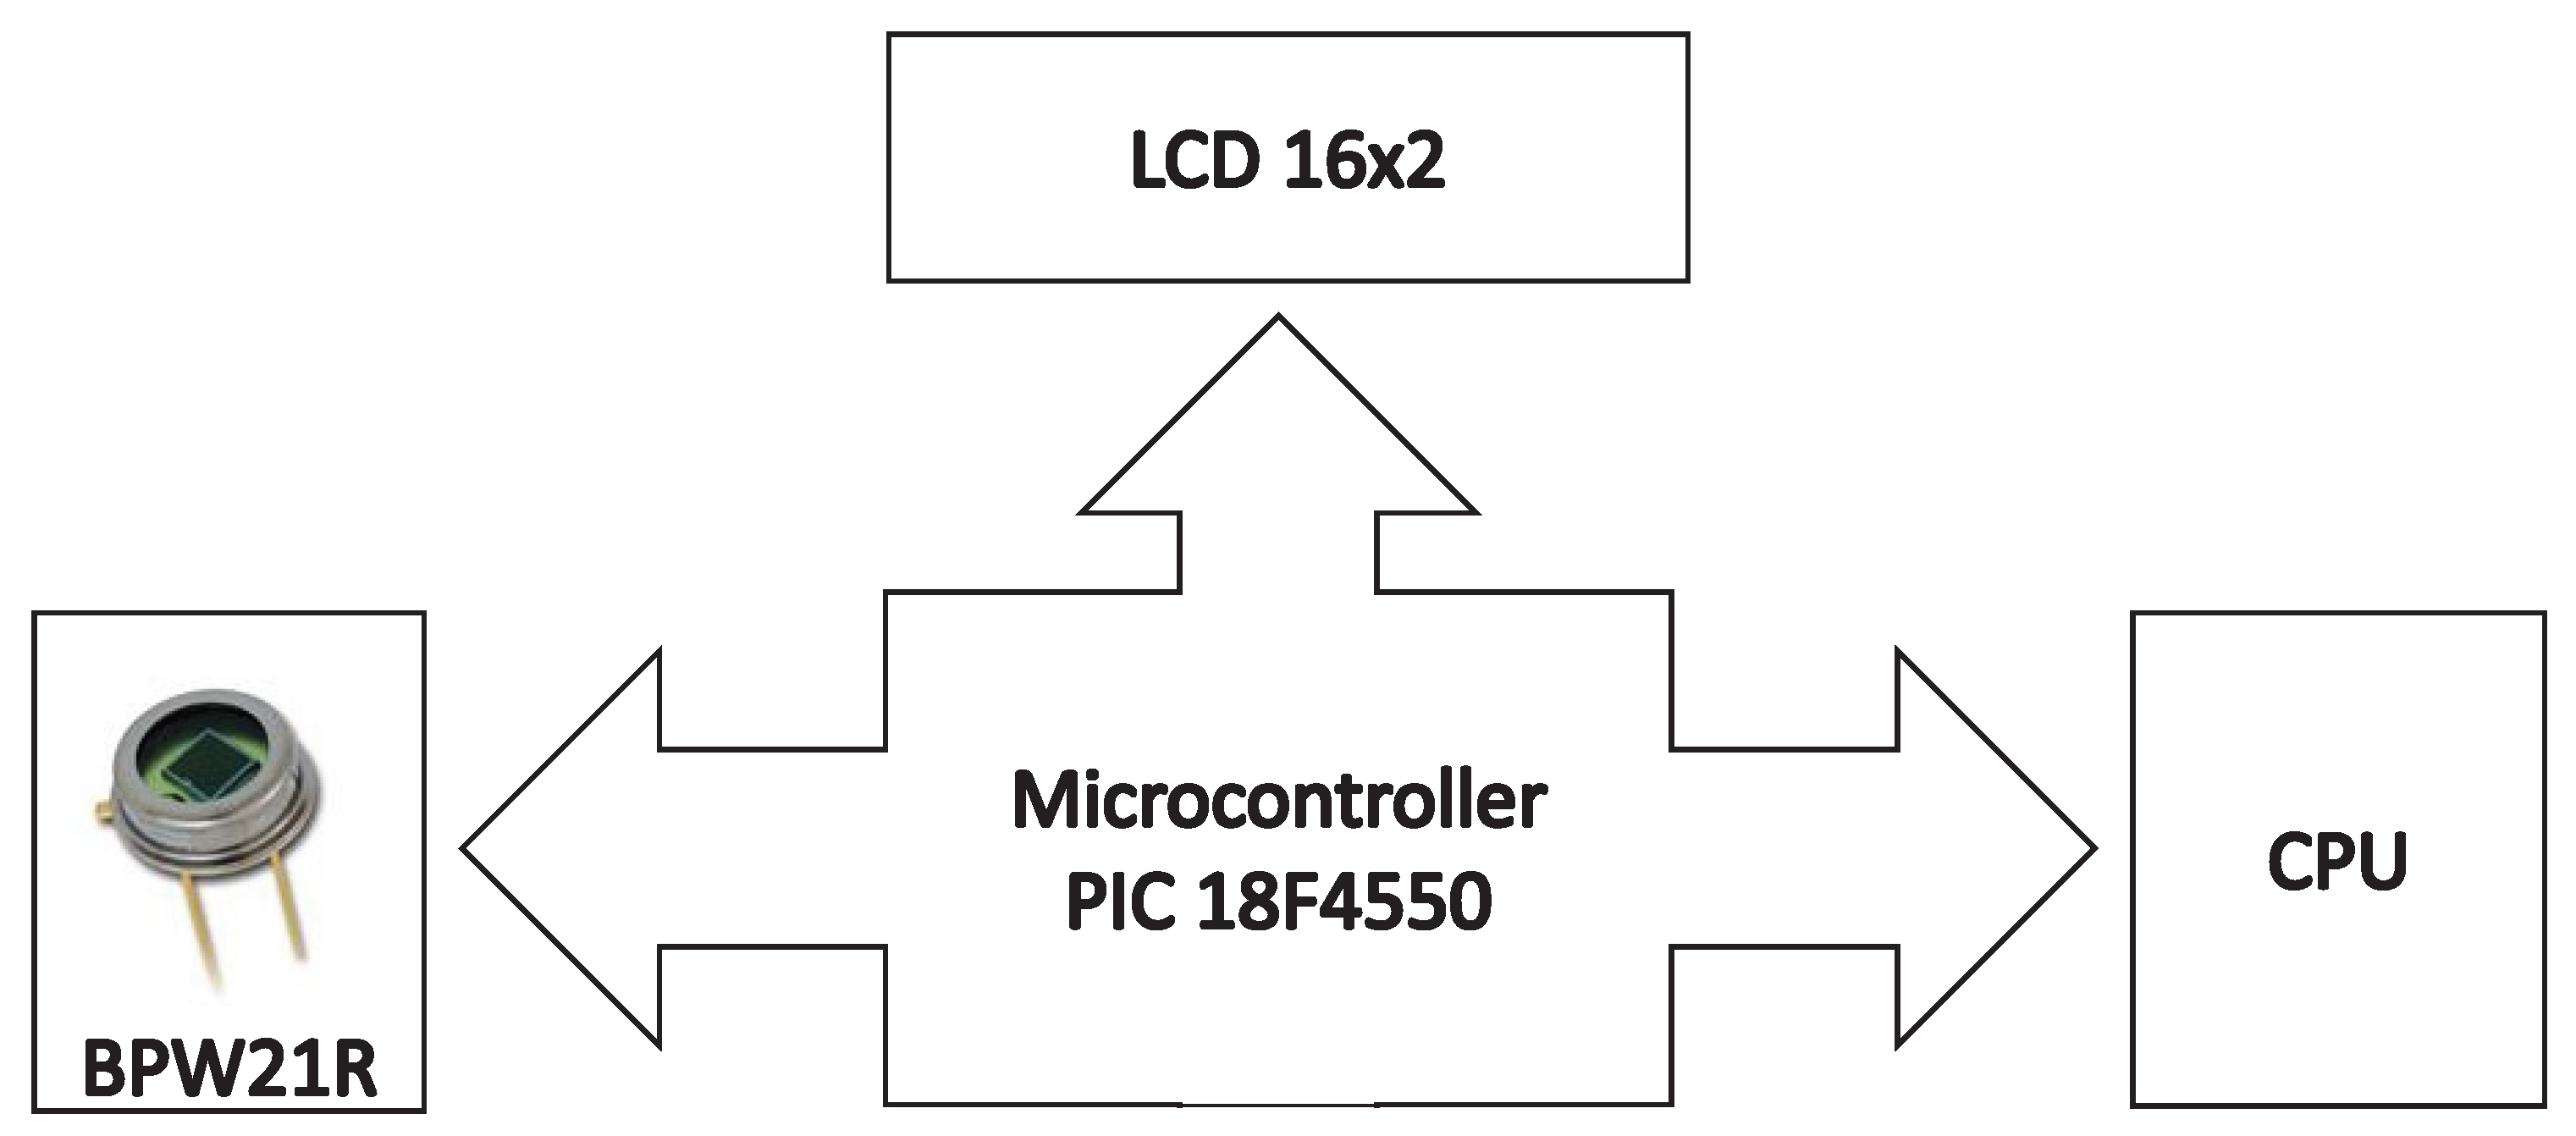
2.6. Development of the Lux Meter and Liquid Identification System
2.6.1. Definition of the Measurand for the Measurement of Illuminance
2.6.2. Ambient Light Sensor BPW21R
3. Results
3.1. Sample Results of the Classification Process Manually
3.2. Design of Experiments for Variable Identification
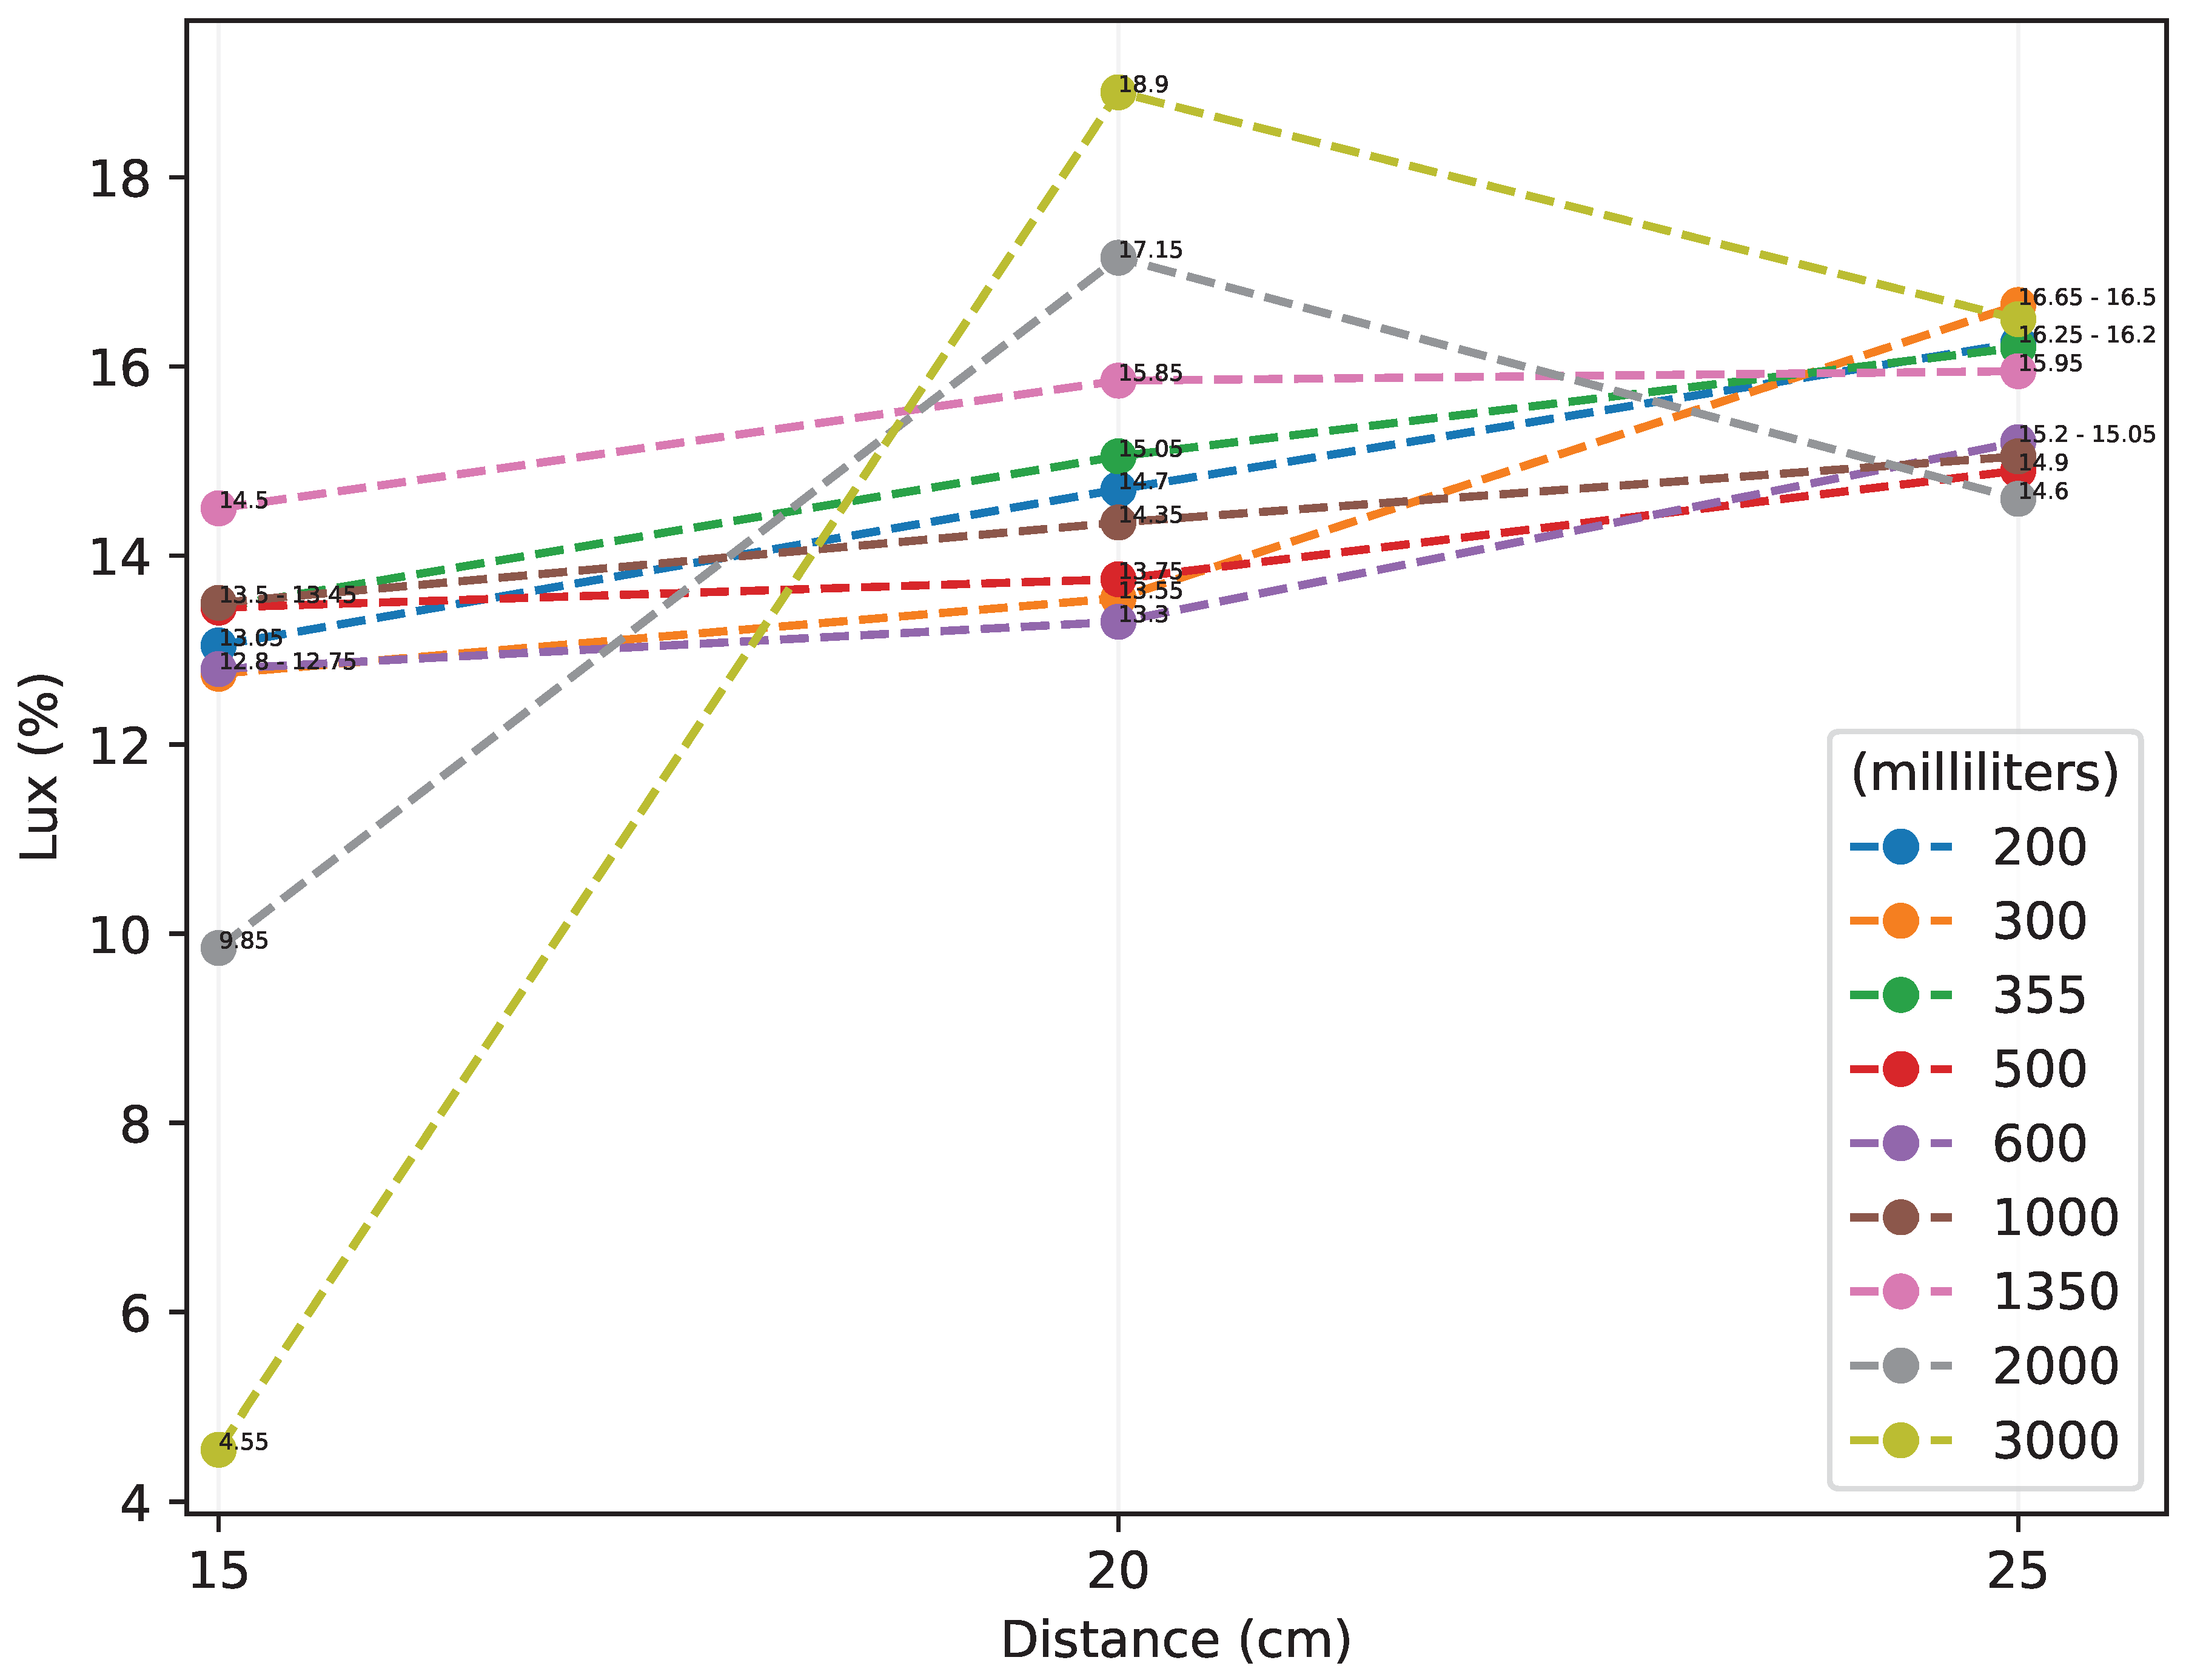
3.2.1. Design of Experiments to Determine the Distance and Working Range of the Lux Meter
- A: Distance from the lux meter to the conveyor belt (20, 25, 30 cm).
- B: Bottle Size (200, 300, 355, 500, 600, 1000, 1500, 2000, 3000 mL).
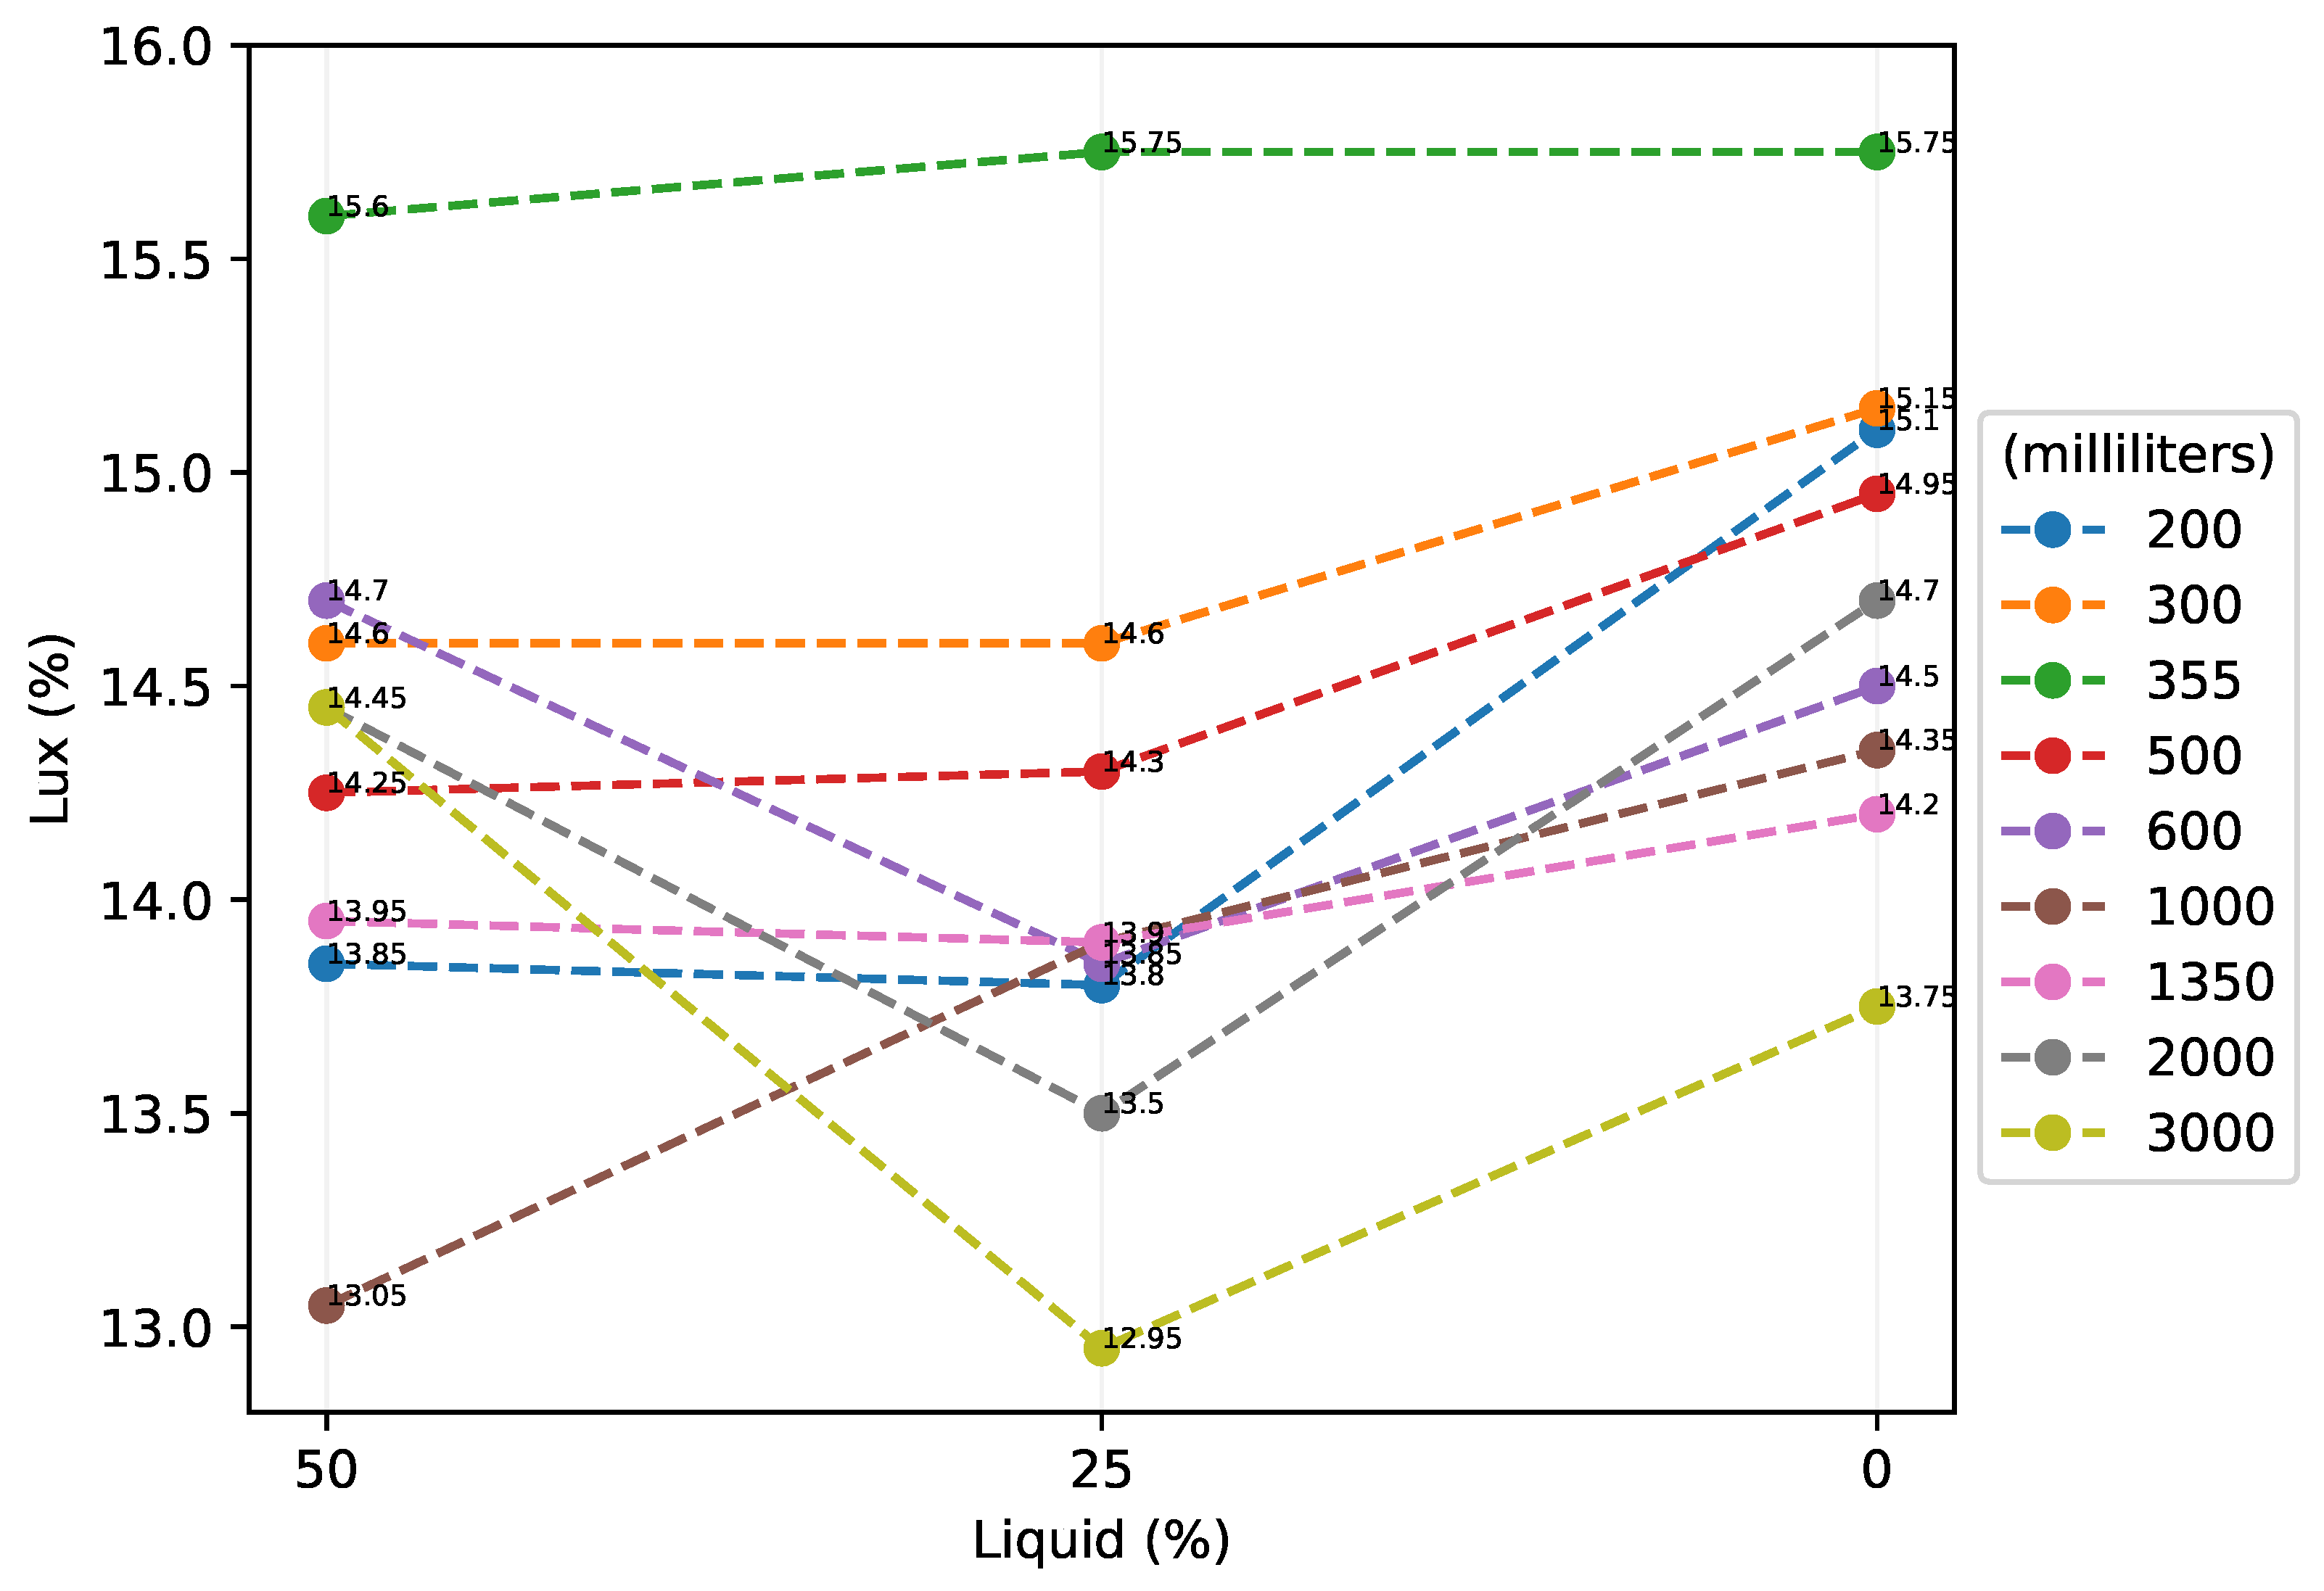
3.2.2. Design of Experiments to Identify the Minimum Amount of Liquid Inside the Bottle
- A: Percentage of liquids in the bottle (50, 25, 0%).
- B: Bottle Size (200, 300, 355, 500, 600, 1000, 1500, 2000, 3000 mL).
3.2.3. Design of Experiments to Determine the Illuminance of the Labels
3.3. Principal Component Analysis
3.4. Support Vector Machine
3.5. Development of the Lux Meter and the Liquid Identification System
3.5.1. Functions to Estimate the Illuminance on the Sensor
3.5.2. Lux Meter
4. Discussion
5. Conclusions
- It is possible to develop an automatic liquid identification system for recyclable polyethylene terephthalate bottles with an affordable design.
- It was possible to develop a new methodology to be implemented to identify dark liquids.
- It is possible to quantify the amount of dark liquid that post-consumer PET bottles contain by implementing an affordable design.
Author Contributions
Funding
Institutional Review Board Statement
Informed Consent Statement
Acknowledgments
Conflicts of Interest
Abbreviations
| ANOVA | Analysis of variance |
| CC | Collection centers |
| DIL40 | 40 PINS dual-in-line package |
| DOE | Design of experiments |
| F | F Ratio |
| gl | Degrees of freedom |
| LCD | Liquid-crystal display |
| LED | Light-emitting diode |
| MS | Mean squarese |
| ml | Milliliters |
| NC | Normally closed |
| No. | Number |
| PC1 | First principal component |
| PC2 | Second principal component |
| PCA | Principal component analysis |
| PCB | Printed circuit board |
| PET | Polyethylene terephthalate |
| PIC | Peripheral interface controller |
| PLC | Programmable logic controller |
| SVM | Support vector machine |
| SS | Sum of squares |
| USE | Universal serial bus |
Appendix A
| Listing A1. Code for the SVM algorithm in Matlab. | |
| 1 | format~long |
| 2 | |
| 3 | P1 = [337.5,13.90,1]; % -1 |
| 4 | P2 = [355,16.2,1]; % -1 |
| 5 | P3 = [500,14.9,1]; % +1 |
| 6 | |
| 7 | Figure~(1),plot(337.5,13.90,’o’); |
| 8 | hold on; |
| 9 | Figure~(1),plot(355,16.2,’o’); |
| 10 | hold on; |
| 11 | Figure~(1),plot(500,14.9,’x’); |
| 12 | xlim([0,800]) |
| 13 | ylim([12,17]) |
| 14 | |
| 15 | syms A1 A2 A3; |
| 16 | a1 = A1; |
| 17 | a2 = A2; |
| 18 | a3 = A3; |
| 19 | |
| 20 | eqs=[a1∗(sum(P1.∗P1))+a2∗(sum(P1.∗P2))+a3∗(sum(P1.∗P3))==-1,… |
| 21 | a1∗(sum(P1.∗P2))+a2∗(sum(P2.∗P2))+a3∗(sum(P2.∗P3))==-1,… |
| 22 | a1∗(sum(P1.∗P3))+a2∗(sum(P3.∗P2))+a3∗(sum(P3.∗P3))==1]; |
| 23 | |
| 24 | [a1,a2,a3]=solve(eqs); |
| 25 | |
| 26 | Wx=a1∗P1(1)+a2∗P2(1)+a3∗P3(1); |
| 27 | Wy=a1∗P1(2)+a2∗P2(2)+a3∗P3(2); |
| 28 | Wb=a1∗P1(3)+a2∗P2(3)+a3∗P3(3); |
| 29 | |
| 30 | t=[0:1:800]; |
| 31 | y=( -Wx∗t - Wb )/Wy; |
| 32 | hold on; |
| 33 | Figure~(1),plot(t,y); |
| 34 | |
| 35 | % Evaluate the results |
| 36 | Dx=[600,15.2]; |
| 37 | res=Dx(1)∗Wx+Dx(2)∗Wy+Wb; |
| 38 | |
| 39 | if(res > 0) |
| 40 | 1 |
| 41 | elseif res < 0 |
| 42 | -1 |
| 43 | end |
Appendix B
| Listing A2. Code for programming the lux meter in c. | |
| 1 | |
| 2 | #include <18F4550.h> |
| 3 | #device adc=10 |
| 4 | #fuses HS,NOWDT,NOPROTECT,NOLVP,NODEBUG,USBDIV,PLL5,CPUDIV2,VREGEN |
| 5 | #use delay(clock=20000000) |
| 6 | #define use_portb_lcd TRUE |
| 7 | #include <LCD.c> |
| 8 | #define USB_CON_SENSE_PIN PIN_B3 |
| 9 | #include "usb_cdc.h" |
| 10 | #include <math.h> |
| 11 | #Byte PortA = 0xF80 |
| 12 | #Byte PortB = 0xF81 |
| 13 | #Byte PortC = 0xF82 |
| 14 | #Byte PortD = 0xF83 |
| 15 | #Byte PortE = 0xF84 |
| 16 | void main(void){ |
| 17 | while(TRUE){ |
| 18 | int16 q; |
| 19 | float p,y,lux,t=0,Ts=0.5; |
| 20 | int k=0,aux=0; |
| 21 | char ch; |
| 22 | set_tris_a(0x01); |
| 23 | setup_adc_ports(AN0); |
| 24 | setup_adc(ADC_CLOCK_INTERNAL); |
| 25 | set_tris_e(0x03); |
| 26 | lcd_init(); |
| 27 | printf(lcd_putc,"\f"); |
| 28 | bit_clear(PortB,3); |
| 29 | while(TRUE){ |
| 30 | |
| 31 | output_d(0x00); |
| 32 | set_adc_channel(0); |
| 33 | delay_us(10); |
| 34 | q=read_adc(); |
| 35 | p=5.0∗q/1024.0; |
| 36 | |
| 37 | if(bit_test(portE,0)==0){ |
| 38 | y=p/300000.0; |
| 39 | aux=1; |
| 40 | } |
| 41 | if(bit_test(portE,1)==0){ |
| 42 | y=p/5000.0; |
| 43 | aux=2; |
| 44 | } |
| 45 | y=y∗1000000.0; |
| 46 | if(bit_test(PortB,3)==1 && k==0){ |
| 47 | usb_cdc_init(); |
| 48 | usb_init(); |
| 49 | while(!usb_cdc_connected()) |
| 50 | { |
| 51 | } |
| 52 | k++; |
| 53 | } |
| Listing A3. Code for programming the lux meter in c. | |
| 1 | if(k>0 && usb_enumerated() ){ |
| 2 | usb_task(); |
| 3 | printf(usb_cdc_putc,"%f\t%f\tTs=%f\t\n",t,lux,Ts); |
| 4 | t=Ts+t; |
| 5 | } |
| 6 | if(bit_test(PortB,3)==0 && k>0){ |
| 7 | k=0; |
| 8 | break; |
| 9 | } |
| 10 | if(y>=0.1 && y<=0.3){ |
| 11 | lux=45.0-5.0∗sqrt(69.0-200.0∗y); |
| 12 | p=1.0; |
| 13 | } |
| 14 | if(y>0.3 && y<=0.52){ |
| 15 | lux=(10.0/11.0)∗(100.0∗y+3.0); |
| 16 | p=2.0; |
| 17 | } |
| 18 | if(y>0.52 && y<=0.75){ |
| 19 | lux=175.0-5.0∗sqrt(1041.0-800.0∗y); |
| 20 | p=3.0; |
| 21 | } |
| 22 | if(y>0.75 && y<=0.95){ |
| 23 | lux=0.151515∗(100000495.0-sqrt(10000105600001089.0-132000000000.0∗y)); |
| 24 | p=4.0; |
| 25 | } |
| 26 | if(y>0.95 && y<=2.2){ |
| 27 | lux=(5.0∗(21909103.0-sqrt(374223401867769.0-145454800000000.0∗y)))/363637.0; |
| 28 | p=5.0; |
| 29 | } |
| 30 | if(y>2.2 && y<=4.1){ |
| 31 | lux=(50.0∗(sqrt(240.0∗y-359.0)-1.0))/3.0; |
| 32 | p=6.0; |
| 33 | } |
| 34 | if(y>4.1 && y<=6.4){ |
| 35 | lux= 50.0∗sqrt(80.0∗y+113.0)-650.0; |
| 36 | p=7.0; |
| 37 | } |
| 38 | if(y>6.4 && y<=8.5){ |
| 39 | lux=1750.0-50.0∗sqrt(1041.0-80.0∗y); |
| 40 | p=8.0; |
| 41 | } |
| 42 | if(y>8.5 && y<=11){ |
| 43 | lux=50.0∗sqrt(16.0∗y-127.0)+650.0; |
| 44 | p=9.0; |
| 45 | } |
| 46 | if(y>11 && y<=30){ |
| 47 | lux=(500.0∗(31.0-sqrt(889.0-24.0∗y)))/3.0; |
| 48 | p=10.0; |
| 49 | } |
| Listing A4. Code for programming the lux meter in c. | |
| 1 | if(y>30 && y<=52){ |
| 2 | lux=(1000.0∗(y+3.0))/11.0; |
| 3 | p=11.0; |
| 4 | } |
| 5 | if(y>52 && y<=75){ |
| 6 | lux=17500.0-500.0∗sqrt(1041.0-8.0∗y); |
| 7 | p=12.0; |
| 8 | } |
| 9 | if(y>75 && y<=95){ |
| 10 | lux=100.0∗(y-5.0); |
| 11 | p=13.0; |
| 12 | } |
| 13 | if(y>95 && y<=220){ |
| 14 | lux=(500.0∗(1825757.0-sqrt(2598770771809.0-10101000000.0∗y)))/30303.0; |
| 15 | p=14.0; |
| 16 | } |
| 17 | if(y>220 && y<=410){ |
| 18 | lux=(1000.0∗sqrt(5.0)∗(sqrt(12.0∗y-1795.0)-sqrt(5.0)))/3.0; |
| 19 | p=15.0; |
| 20 | } |
| 21 | if(y>410 && y<=640){ |
| 22 | lux=1000.0∗sqrt(5.0)∗sqrt(4.0∗y+565.0)-65000.0; |
| 23 | p=16.0; |
| 24 | } |
| 25 | if(y>640 && y<=850){ |
| 26 | lux=175000.0-1000.0∗sqrt(5.0)∗sqrt(5205.0-4.0∗y); |
| 27 | p=17.0; |
| 28 | } |
| 29 | if(y>850 && y<=1100){ |
| 30 | lux=1000.0∗sqrt(4.0∗y-3175.0)+65000.0; |
| 31 | p=18.0; |
| 32 | } |
| 33 | if(aux==1 && y<0.1) |
| 34 | printf(lcd_putc,"\fMenor a 10 lux"); |
| 35 | else |
| 36 | printf(lcd_putc, "\fLux %1.1f(%1.0f)",lux,p); // |
| 37 | if(aux==1 && y>1.1){ |
| 38 | printf(lcd_putc,"\fCambie Escala(2)\n"); |
| 39 | printf(lcd_putc," 100 lux a 100k"); |
| 40 | } |
| 41 | |
| 42 | if(aux==2 && y<=1.1){ |
| 43 | printf(lcd_putc,"\fCambie Escala(1)\n"); |
| 44 | printf(lcd_putc," 0 lux a 100 "); |
| 45 | } |
| 46 | delay_ms(250); |
| 47 | aux=0; |
| 48 | } |
| 49 | } |
| 50 | } |
Appendix C
References
- OECD. Plastic Pollution is Growing Relentlessly as Waste Management and Recycling Fall Short. 2022. Available online: https://www.oecd.org/environment/plastic-pollution-is-growing-relentlessly-as-waste-management-and-recycling-fall-short.htm (accessed on 11 June 2023).
- La Mantia, F.P.; Scaffaro, R.; Baiamonte, M.; Ceraulo, M.; Mistretta, M.C. Comparison of the Recycling Behavior of a Polypropylene Sample Aged in Air and in Marine Water. Polymers 2023, 15, 2173. [Google Scholar] [CrossRef] [PubMed]
- Gadaleta, G.; De Gisi, S.; Todaro, F.; D’Alessandro, G.; Binetti, S.; Notarnicola, M. Assessing the Sorting Efficiency of Plastic Packaging Waste in an Italian Material Recovery Facility: Current and Upgraded Configuration. Recycling 2023, 8, 25. [Google Scholar] [CrossRef]
- Ángeles-Hurtado, L.A.; Rodríguez-Reséndiz, J.; Salazar-Colores, S.; Torres-Salinas, H.; Sevilla-Camacho, P.Y. Viable Disposal of Post-Consumer Polymers in Mexico: A Review. Front. Environ. Sci. 2021, 9, 427. [Google Scholar] [CrossRef]
- Cuentame.inegi.org.mx. Medio Ambiente—Basura; Fecha de la Consulta 06/05/2020. 2020. Available online: http://cuentame.inegi.org.mx/territorio/ambiente/basura.aspx?tema=T (accessed on 11 June 2023).
- Hernández Huerta, A. Caja de Herramientas Para la Formación Ambiental; Instituto de Ecología, A.C: Xalapa, Mexico, 2018; Volume 1. [Google Scholar]
- Hejna, A. Renewable, Degradable, and Recyclable Polymer Composites. Polymers 2023, 15, 1769. [Google Scholar] [CrossRef] [PubMed]
- (IMCC), I.M.D.C.C. Entérate Qué es la Industria Mexicana de Coca-Cola y Quiénes Formamos Parte de Ella 27/05/2019. 2019. Available online: https://www.coca-colamexico.com.mx/historias/mapa-industria-mexicana-de-coca-cola (accessed on 11 June 2023).
- Christakopoulos, F.; van Heugten, P.M.H.; Tervoort, T.A. Additive Manufacturing of Polyolefins. Polymers 2022, 14, 5147. [Google Scholar] [CrossRef] [PubMed]
- Peláez Lenis, L.C.; Olmos Rodríguez, M.C. Plan de Empresa Para la Creación de Recoplast, Empresa Dedicada a la Recuperación de Plásticos Reciclables. Bachelor’s Thesis, Universidad Autónoma de Occidente, Cali, Colombia, 2018. [Google Scholar]
- Garraín, D.; Vidal, R.; Franco, V.; Martínez, P. Análisis del Ciclo de Vida del Reciclado del Polietileno de Alta Densidad. Residuos 2008, 104, 58–63. [Google Scholar]
- Ramli, S.; Mustafa, M.M.; Hussain, A.; Wahab, D.A. Histogram of Intensity Feature Extraction for Automatic Plastic Bottle Recycling System Using Machine Vision. Am. J. Environ. Sci. 2008, 4, 583. [Google Scholar] [CrossRef]
- Lundell, C.; Thomas, J. PET: Polyethylene Terephthalate—The Ubiquitous 500 ml Water Bottle. In Advances in Intelligent Systems and Computing; Elsevier Inc.: Amsterdam, The Netherlands, 2020; Volume 1202 AISC, pp. 248–254. [Google Scholar]
- Al-Salem, S.M.; Lettieri, P.; Baeyens, J. Recycling and Recovery Routes of Plastic Solid Waste (PSW): A Review. Waste Manag. 2009, 29, 2625–2643. [Google Scholar] [CrossRef] [PubMed]
- Sahin, O.; Kirim, Y. Material Recycling. In Comprehensive Energy Systems; Elsevier Inc.: Amsterdam, The Netherlands, 2018; Volumes 2–5, pp. 1018–1042. [Google Scholar]
- Chu, J.; Hu, X.; Kong, L.; Wang, N.; Zhang, S.; He, M.; Ouyang, W.; Liu, X.; Lin, C. Dynamic Flow and Pollution of Antimony from Polyethylene Terephthalate (PET) Fibers in China. Sci. Total Environ. 2021, 771, 144643. [Google Scholar] [CrossRef] [PubMed]
- Ardusso, M.; Forero-López, A.D.; Buzzi, N.S.; Spetter, C.V.; Fernández-Severini, M.D. COVID-19 Pandemic Repercussions on Plastic and Antiviral Polymeric Textile Causing Pollution on Beaches and Coasts of South America. Sci. Total Environ. 2021, 763, 144365. [Google Scholar] [CrossRef] [PubMed]
- Lee, B.; Mahtab, M.; Neo, T.; Farooqi, I.; Khursheed, A. A comprehensive review of Design of experiment (DOE) for water and wastewater treatment application-Key concepts, methodology and contextualized application. J. Water Process. Eng. 2022, 47, 102673. [Google Scholar] [CrossRef]
- Gutiérrez Pulido, H.; Vara Salazar, R.d.l. Análisis y Diseño de Experimentos; McGrawHill: New York, NY, USA, 2004. [Google Scholar]
- Escalante Vázquez, E.J. Seis-Sigma Metodología y Técnicas; Editorial Limusa: Mexico City, México, 2007. [Google Scholar]
- Kumar, P.A. Classification of Power Quality Events Using Support Vectir Machine and S-Transform. In Proceedings of the 2016 2nd International Conference on Contemporary Computing and Informatic, Greater Noida, India, 14–17 December 2016; Volume 7, pp. 279–284. [Google Scholar]
- Rizanti, N.A.; Setyaningrum, A.H. Colon Detection Using Principal Component Analysis (PCA) and Support Vector Machine (SVM). In Proceedings of the 2016 4th International Conference on Cyber and IT Service Management, Bandung, Indonesia, 26–27 April 2016; pp. 1–6. [Google Scholar]
- Ashwini, S.; Shinde, S.S.J.; Puranik, V. Identification and Sorting of Power Quality Disturbances Using Signal Processing with GUI. In Proceedings of the 2016 IEEE International Conference on Advances in Electronics, Communication and Computer Technology (ICAECCT), Pune, India, 2–3 December 2016; pp. 60–63. [Google Scholar]
- Vapnik, V.N. An Overview of Statistical Learning Theory. IEEE Trans. Neural Netw. 1999, 10, 988–999. [Google Scholar] [CrossRef] [PubMed] [Green Version]
- Kumar, P.; Krishna, P.R.; Raju, S.B. Pattern Discovery Using Sequence Data Mining; Information Science Reference: Hershey, PA, USA, 2011. [Google Scholar]
- Rani, M.; Marchesi, C.; Federici, S.; Rovelli, G.; Alessandri, I.; Vassalini, I.; Ducoli, S.; Borgese, L.; Zacco, A.; Bilo, F.; et al. Miniaturized Near-infrared (MicroNIR) Spectrometer in Plastic Waste Sorting. Materials 2019, 12, 2740. [Google Scholar] [CrossRef] [PubMed] [Green Version]
- Semiconductors, V. Silicon PN Photodiode; Technical Report; Vishay Semiconductor GmbH: Heilbronn, Germany, 2006. [Google Scholar]
- Semiconductors, V. Measurement Techniques: Document Number: 80085; Technical Report; Vishay Semiconductor GmbH: Heilbronn, Germany, 2008. [Google Scholar]
- Huth-Fehre, T.; Feldhoff, R.; Kantimm, T.; Quick, L.; Winter, F.; Cammann, K.; Van den Broek, W.H.A.M.; Wienke, D.; Melssen, W.; Buydens, L. NIR—Remote Sensing and Artificial Neural Networks for Rapid Identification of Post Consumer Plastics. J. Mol. Struct. 1995, 348, 143–146. [Google Scholar] [CrossRef] [Green Version]
- Safavi, S.M.; Masoumi, H.; Mirian, S.S.; Tabrizchi, M. Tabrizchi, M. Sorting of Polypropylene Resins by Color in MSW Using Visible Reflectance Spectroscopy. Waste Manag. 2010, 30, 2216–2222. [Google Scholar] [CrossRef] [PubMed]


| No. | Name | Parameter | Expression | Value |
|---|---|---|---|---|
| 1 | Band base width | bandBaseWidth | 90 cm | 90.0 |
| 2 | Long band base | LongBandBase | 200 cm | 200.0 |
| 3 | Band leg base | BandLegBase | 10 cm | 10.0 |
| 4 | Table base width | TableBaseWidth | bandBaseWidth + (BandLegBase*4) | 130.0 |
| 5 | Long table base | LongTableBase | 70 cm | 70.0 |
| 6 | High table base | HighTableBase | 2 cm | 2.0 |
| 7 | Wide leg base | WideLegBase | 70 mm | 70.0 |
| 8 | Long leg base | LongLegBase | 150 mm | 150.0 |
| 9 | High leg base | HighLegBase | 10 mm | 10.0 |
| 10 | Wide leg | WideLeg | 35 mm | 35.0 |
| 11 | Long leg | LongLeg | 100 mm | 100.0 |
| 12 | High leg | HighLeg | 70 cm | 70.0 |
| 13 | Table plan | TablePlan | HighLeg + HighLegBase | 101.0 |
| 14 | Bottom box width | BottomBoxWidth | TableBaseWidth—10 cm | 120.0 |
| 15 | Long box base | LongBoxBase | LongTableBase—2 cm | 68.0 |
| 16 | Base box thickness | BaseBoxThickness | 2 cm | 2.0 |
| 17 | High box base | HighBoxBase | 60 cm | 60.0 |
| 18 | Height tab | HeightTab | HighBoxBase/1.5 | 40.0 |
| 19 | Base rail width | BaseRailWidth | 4.5 cm | 4.5 |
| 20 | Base long rail | BaseLongRail | 30 cm | 30.0 |
| 21 | Base rail thickness | BaseRailThickness | 1.3 cm | 1.3 |
| 22 | Base chamber width | BaseChamberWidth | TableBaseWidth—20 cm | 110.0 |
| 23 | Base chamber length | BaseChamberLength | LongTableBase—10 cm | 60.0 |
| No. | Material | Type | Volume |
|---|---|---|---|
| 1 | LIQUID-CRYSTAL DISPLAY (LCD) | 16X2 | 1 |
| 2 | MICROCONTROLLER | 18F4550 | 1 |
| 3 | SENSOR | bpw21r | 1 |
| 4 | CONNECTOR | MOLEX | 3 |
| 5 | POTENTIOMETER | 1M | 1 |
| 6 | POTENTIOMETER | 5k | 1 |
| 7 | RESISTOR | 1K | 6 |
| 8 | RESISTOR | 10K | 8 |
| 9 | RESISTOR | 220 | 4 |
| 10 | CAPACITOR | 470n | 3 |
| 11 | CAPACITOR | 15p | 4 |
| 12 | CAPACITOR | 0.1u | 2 |
| 13 | CAPACITOR | 1u | 2 |
| 14 | CAPACITOR | 0.33u | 2 |
| 15 | LIGHT-EMITTING DIODE (LED) | RED | 3 |
| 16 | CRYSTAL | 20M | 1 |
| 17 | DIL40 | 40 PINS | 1 |
| 18 | PINS | MALE | 1 |
| 19 | PINS | FEMALE | 1 |
| 20 | PHENOLIC BOARD | COPPER | 1 |
| 21 | ACID | FeCl3 | 1 |
| 22 | USB CONNECTOR | B | 1 |
| 23 | TEL CONNECTOR | 4 HILOS | 1 |
| 24 | SWICH 1 | POLO 2 | 2 |
| 25 | HOUSING | BLACK | 1 |
| 26 | BUTTON | NC | 1 |
| Objective DOE 1 | Identify Important Factors from Many Potential Factors |
|---|---|
| Response | Iluminance |
| Factor and Levels | Distance and three levels |
| Factor and Levels | Bottle size and nine levels |
| Objective DOE 2 | Identify important factors from many potential factors |
| Response | Illuminance |
| Factor and Levels | Percentage of liquids inside the bottle and three levels |
| Factor and Levels | Bottle size and nine levels |
| Objective DOE 3 | Identify important factor |
| Response | Illuminance |
| Factor and Levels | Types of labels on bottles |
| Lux Meter Distance (cm) (A) | ||||
|---|---|---|---|---|
| Bottle Size (mL) (B) | 15 | 20 | 25 | Sum |
| 200 | ||||
| Sum | ||||
| 300 | ||||
| Sum | ||||
| 355 | ||||
| Sum | ||||
| 500 | ||||
| Sum | ||||
| 600 | ||||
| Sum | ||||
| 1000 | ||||
| Sum | ||||
| 1350 | ||||
| Sum | ||||
| 2000 | ||||
| Sum | ||||
| 3000 | ||||
| Sum | ||||
| Sum Total | ||||
| Source | SS | gl | MS | F |
|---|---|---|---|---|
| Distance (A) | SSA | MSA = SSA/ | MSA/MSE | |
| Bottle (B) | SSB | MSB = SSB/ | MSB/MSE | |
| AB | SSAB | MSAB = SSAB/ | MSAB/MSE | |
| Error | SSE | MSE = SSE/ | ||
| Total | SST |
| Percentage of Liquid in the Bottle (A) | ||||
|---|---|---|---|---|
| Bottle Size (mL) (B) | 50% | 25% | 0% | Sum |
| 200 | ||||
| Sum | ||||
| 300 | ||||
| Sum | ||||
| 355 | ||||
| Sum | ||||
| 500 | ||||
| Sum | ||||
| 600 | ||||
| Sum | ||||
| 1000 | ||||
| Sum | ||||
| 1350 | ||||
| Sum | ||||
| 2000 | ||||
| Sum | ||||
| 3000 | ||||
| Sum | ||||
| Sum Total | ||||
| Replicas | |||||||||
|---|---|---|---|---|---|---|---|---|---|
| Bottle Size (mL) (A) | 1 | 2 | 3 | 4 | 5 | 6 | Sum | y | |
| 3000 | |||||||||
| 2000 | |||||||||
| 1350 | |||||||||
| 1000 | |||||||||
| 600 | |||||||||
| 500 | |||||||||
| 355 | |||||||||
| 300 | |||||||||
| 250 | |||||||||
| 200 | |||||||||
| Source of Variation | SS | gl | MS | F |
|---|---|---|---|---|
| Treatments (t) | SSt | MSt = SSt/ | MSt/MSE | |
| Error | SSE | MSE = SSE/ | ||
| Total | SST |
| Bottles That Were Repeated the Most. | ||||
|---|---|---|---|---|
| Number | Bottle (Liter) | Frequency | Frequency (%) | Accumulated (%) |
| 1 | 0.6 | 1307 | 26.356 | 26.356 |
| 2 | 1.0 | 837 | 16.878 | 43.234 |
| 3 | 1.5 | 653 | 13.167 | 56.402 |
| 4 | 2.0 | 642 | 12.946 | 69.348 |
| 5 | 3.0 | 382 | 7.703 | 77.051 |
| 6 | 0.5 | 346 | 6.977 | 84.029 |
| 7 | 0.35 | 294 | 5.928 | 89.957 |
| 8 | 0.25 | 205 | 4.133 | 94.091 |
| Lux Meter Distance (cm) (A) | ||||
|---|---|---|---|---|
| Bottle Size (mL) (B) | 15 | 20 | 25 | Sum |
| 200 | 13.4 | 14.9 | 16.5 | |
| 12.7 | 14.5 | 16 | 88 | |
| Sum | 26.1 | 29.4 | 32.5 | |
| 300 | 12.4 | 14.4 | 16.7 | |
| 13.1 | 12.7 | 16.6 | 85.9 | |
| Sum | 25.5 | 27.1 | 33.3 | |
| 355 | 13 | 15.2 | 16.2 | |
| 13.9 | 14.9 | 16.2 | 89.4 | |
| Sum | 26.9 | 30.1 | 32.4 | |
| 500 | 13.6 | 13.9 | 14.8 | |
| 13.3 | 13.6 | 15 | 84.2 | |
| Sum | 26.9 | 27.5 | 29.8 | |
| 600 | 12.5 | 13.9 | 15 | |
| 13.1 | 12.7 | 15.4 | 82.6 | |
| Sum | 25.6 | 26.6 | 30.4 | |
| 1000 | 13.9 | 14 | 15.1 | |
| 13.1 | 14.7 | 15 | 85.8 | |
| Sum | 27 | 28.7 | 30.1 | |
| 1350 | 15.6 | 15.2 | 16.4 | |
| 13.4 | 16.5 | 15.5 | 92.6 | |
| Sum | 29 | 31.7 | 31.9 | |
| 2000 | 10.7 | 16.8 | 14.3 | |
| 9 | 17.5 | 14.9 | 83.2 | |
| Sum | 19.7 | 34.3 | 29.2 | |
| 3000 | 5.2 | 19.3 | 17 | |
| 3.9 | 18.5 | 16 | 79.9 | |
| Sum | 9.1 | 37.8 | 33 | |
| Sum Total | 215.8 | 273.2 | 282.6 | 771.6 |
| Source | SS | gl | MS | F |
|---|---|---|---|---|
| Distance (A) | 145.2844 | 2 | 72.6422 | 259.8892 * |
| Bottle (B) | 19.73 | 8 | 2.4662 | 8.8234 * |
| AB | 194.5788 | 2 | 97.2894 | 348.0686 * |
| Error | 11.46 | 41 | 0.2795 | |
| Total | 371.0533 | 53 |
| Liquid (%) in the Bottle (A) | ||||
|---|---|---|---|---|
| Bottle Size (mL) (B) | 50 | 25 | 0 | Sum |
| 200 | 13.3 | 14.3 | 15 | |
| 14.4 | 13.3 | 15.2 | 85.5 | |
| Sum | 27.7 | 27.6 | 30.2 | |
| 300 | 14.7 | 14.8 | 15 | |
| 14.5 | 14.4 | 15.3 | 88.7 | |
| Sum | 29.2 | 29.2 | 30.3 | |
| 355 | 16.5 | 16.3 | 15.5 | |
| 14.7 | 15.2 | 16 | 94.2 | |
| Sum | 31.2 | 31.5 | 31.5 | |
| 500 | 14.5 | 14.5 | 14.5 | |
| 14 | 14.1 | 15.4 | 87 | |
| Sum | 28.5 | 28.6 | 29.9 | |
| 600 | 15.1 | 14 | 14 | |
| 14.3 | 13.7 | 15 | 86.1 | |
| Sum | 29.4 | 27.7 | 29 | |
| 1000 | 12.2 | 14.2 | 13.5 | |
| 13.9 | 13.6 | 15.2 | 82.6 | |
| Sum | 26.1 | 27.8 | 28.7 | |
| 1350 | 14.5 | 14.4 | 13.4 | |
| 13.4 | 13.4 | 15 | 84.1 | |
| Sum | 27.9 | 27.8 | 28.4 | |
| 2000 | 15.1 | 13.7 | 13.4 | |
| 13.8 | 13.3 | 16 | 85.3 | |
| Sum | 28.9 | 27 | 29.4 | |
| 3000 | 15.2 | 13.2 | 12.2 | |
| 13.7 | 12.7 | 15.3 | 82.3 | |
| Sum | 28.9 | 25.9 | 27.5 | |
| Sum Total | 257.8 | 253.1 | 264.9 | 775.8 |
| Source | SS | gl | MS | F |
|---|---|---|---|---|
| % Liquid (A) | 3.921 | 2 | 1.9605 | 3.8442 * |
| Bottle (B) | 17.4633 | 8 | 2.1829 | 4.2802 * |
| AB | 5.7855 | 2 | 2.8927 | 5.6721 * |
| Error | 20.91 | 41 | 0.51 | |
| Total | 48.08 | 53 |
| Replicas | |||||||||
|---|---|---|---|---|---|---|---|---|---|
| Bottle Size (mL) (A) | 1 | 2 | 3 | 4 | 5 | 6 | Sum | y | |
| 3000 | 30.00 | 28.10 | 25.20 | 24.10 | 26.00 | 29.80 | 163.20 | 27.20 | 6.092 |
| 2000 | 26.5 | 26.4 | 24.5 | 23.4 | 22.1 | 21.6 | 144.5 | 24.08 | 4.38 |
| 1350 | 22 | 26.7 | 25.7 | 25.8 | 27 | 28.4 | 155.6 | 25.93 | 4.67 |
| 1000 | 20.8 | 21.1 | 21.3 | 20.3 | 19.8 | 19.4 | 122.7 | 20.45 | 0.563 |
| 600 | 18.2 | 18.4 | 18.2 | 18.5 | 18.3 | 18.3 | 109.9 | 18.32 | 0.013 |
| 500 | 18.2 | 18.5 | 18.9 | 19.1 | 19 | 18.8 | 112.5 | 18.75 | 0.115 |
| 355 | 18.4 | 18.5 | 18.5 | 19.1 | 18.3 | 18 | 110.8 | 18.47 | 0.13 |
| 300 | 18 | 17.5 | 17.8 | 17.5 | 18.2 | 17.9 | 106.9 | 17.82 | 0.07 |
| 250 | 17.9 | 18.1 | 17.9 | 18.4 | 18.5 | 17.9 | 108.7 | 18.12 | 0.073 |
| 200 | 16.6 | 17.8 | 17.3 | 17.8 | 17.9 | 18 | 105.4 | 17.57 | 0.282 |
| Source of Variation | SS | gl | MS | F |
|---|---|---|---|---|
| Treatments (t) | 722.48 | 9 | 80.27 | 48.92 * |
| Error | 82.04 | 50 | 1.64 | |
| Total | 804.52 | 59 |
| Bottle Size (mL) | Liquid (100%) | Liquid (50%) | Liquid (25%) | Label | PC1 | PC2 |
|---|---|---|---|---|---|---|
| 3000 | 16.50 | 14.45 | 12.95 | 27.20 | −1.34137 | 1.99768 |
| 2000 | 14.60 | 14.45 | 13.50 | 24.08 | −1.16713 | −0.41555 |
| 1350 | 15.95 | 13.95 | 13.90 | 25.93 | −0.96440 | 0.83528 |
| 1000 | 15.05 | 13.05 | 13.90 | 20.45 | −1.25152 | −1.28753 |
| 600 | 15.20 | 14.70 | 13.85 | 18.32 | 0.26894 | −0.64694 |
| 500 | 14.90 | 14.25 | 14.30 | 18.75 | 0.14066 | −1.18554 |
| 355 | 16.20 | 15.60 | 15.75 | 18.47 | 2.84955 | 0.37889 |
| 300 | 16.65 | 14.60 | 14.60 | 17.82 | 1.39885 | 0.47160 |
| 200 | 16.25 | 13.85 | 13.80 | 17.57 | 0.06642 | −0.14789 |
| Class | 1 | Class | 2 | ||
|---|---|---|---|---|---|
| Liquid (%) | Liquid | Illuminance | Liquid (%) | Liquid | Illuminance |
| 100 | 355 | 16.20 | 100 | 1000 | 15.05 |
| 100 | 300 | 16.65 | 100 | 600 | 15.2 |
| 100 | 200 | 16.25 | 100 | 500 | 14.9 |
| 50 | 177.5 | 15.60 | 50 | 500 | 13.05 |
| 50 | 150 | 14.60 | 100 | 3000 | 16.50 |
| 50 | 100 | 13.85 | 100 | 2000 | 14.60 |
| 25 | 88.75 | 15.75 | 100 | 1350 | 15.95 |
| 25 | 75 | 14.60 | 50 | 1500 | 14.45 |
| 25 | 50 | 13.80 | 50 | 1000 | 14.45 |
| 50 | 300 | 14.7 | 50 | 675 | 13.95 |
| 50 | 250 | 14.25 | 25 | 750 | 12.95 |
| 25 | 250 | 13.9 | 25 | 500 | 13.50 |
| 25 | 150 | 13.85 | |||
| 25 | 125 | 14.3 | |||
| 25 | 337.5 | 13.9 |
| No. | EA-Iluminancia (lx) | lK-Short-Circuit Current (mA) |
|---|---|---|
| 1 | 0.01 | 0.0001 |
| 2 | 0.1 | 0.00086 |
| 3 | 1 | 0.0092696 |
| 4 | 10 | 0.09172 |
| 5 | 100 | 0.967639 |
| 6 | 1000 | 9.712874 |
| 7 | 10,000 | 96.64246 |
| 8 | 100,000 | 972.178 |
| 9 | 912,669 | 1000 |
Disclaimer/Publisher’s Note: The statements, opinions and data contained in all publications are solely those of the individual author(s) and contributor(s) and not of MDPI and/or the editor(s). MDPI and/or the editor(s) disclaim responsibility for any injury to people or property resulting from any ideas, methods, instructions or products referred to in the content. |
© 2023 by the authors. Licensee MDPI, Basel, Switzerland. This article is an open access article distributed under the terms and conditions of the Creative Commons Attribution (CC BY) license (https://creativecommons.org/licenses/by/4.0/).
Share and Cite
Ángeles-Hurtado, L.A.; Rodríguez-Reséndiz, J.; Romero Zepeda, H.; Torres-Salinas, H.; García-Martínez, J.R.; Salas-Aguilar, S.P. Development of a Lux Meter for the Identification of Liquids in Post-Consumer Polyethylene Terephthalate Bottles for Collection Centers in Mexico. Processes 2023, 11, 1963. https://doi.org/10.3390/pr11071963
Ángeles-Hurtado LA, Rodríguez-Reséndiz J, Romero Zepeda H, Torres-Salinas H, García-Martínez JR, Salas-Aguilar SP. Development of a Lux Meter for the Identification of Liquids in Post-Consumer Polyethylene Terephthalate Bottles for Collection Centers in Mexico. Processes. 2023; 11(7):1963. https://doi.org/10.3390/pr11071963
Chicago/Turabian StyleÁngeles-Hurtado, L. A., Juvenal Rodríguez-Reséndiz, Hilda Romero Zepeda, Hugo Torres-Salinas, José R. García-Martínez, and Silvia Patricia Salas-Aguilar. 2023. "Development of a Lux Meter for the Identification of Liquids in Post-Consumer Polyethylene Terephthalate Bottles for Collection Centers in Mexico" Processes 11, no. 7: 1963. https://doi.org/10.3390/pr11071963
APA StyleÁngeles-Hurtado, L. A., Rodríguez-Reséndiz, J., Romero Zepeda, H., Torres-Salinas, H., García-Martínez, J. R., & Salas-Aguilar, S. P. (2023). Development of a Lux Meter for the Identification of Liquids in Post-Consumer Polyethylene Terephthalate Bottles for Collection Centers in Mexico. Processes, 11(7), 1963. https://doi.org/10.3390/pr11071963