Abstract
The new energy context since 2021 has led to dramatic increases in the energy bills of agribusinesses, affecting the price of foodstuffs. A considerable part of energy consumption is due to the heating of water at high temperatures. The present study analyzed the feasibility of using a Solar Water Heating System (SWHS) with an evacuated tube collector. In particular, the required sizing changes, potential savings and cost-effectiveness were analyzed. The results show that the new energy context makes the SWHS investment highly attractive: a payback of less than 4 years in most of the scenarios analyzed; energy savings of more than 60% in the scenarios with higher irradiation; a reduction in total energy expenditure of more than 50% in the favorable scenarios close to the current reality. The new context especially favors cold and temperate climates, with very sharp drops in payback compared to the previous situation. To achieve these values, it is necessary to design an optimized sizing of the SWHS, reducing the risk of future variations in the price of energy. The results of the study should serve as a reference for decision making in the agroindustrial sector to reduce the energy bill and strategic dependence on fossil fuels from third countries.
1. Introduction
The agri-food industry occupies a prominent role in global energy consumption. For example, in Spain, it was responsible for the highest industrial energy consumption, with 18.5% in 2019 [1]. A not inconsiderable part of this consumption is due to the heating of water for multiple applications (cleaning, cooking of products, etc.).
The dramatic increase in energy prices since 2021 has led to a significant rise in energy bills. In this new context, energy bills are up to three times higher than in 2020, which has a negative impact on the competitiveness of the sector and compromises its viability [2]. Faced with this new scenario, Solar Water Heating Systems (SWHSs) can contribute to reducing energy costs and the strategic dependence on fossil fuels from third countries.
Solar Water Heating Systems (SWHSs) are usually classified according to the type of collector and the fluid circulation system. The performance of the Evacuated Tube Collectors (ETCs) system is 41% better than the Flat Plate Collectors (FPCs) system, and the yearly useful energy gain of ETC is 30% more than that of FPC in cold climate [3]. Recent advances made to improve their performance through nanofluids [4,5,6], reflectors, phase-change materials [5], nanotechnologies [6], etc., ensure their growth in the coming years.
Active circulation offers greater flexibility for adaptation in case of high demand, such as in industrial processes [7]. Therefore, the present study focuses on SWHSs constituted by ETCs.
The demand for hot water in the industrial sector is highly variable, both in terms of the temperature and volume demanded [8]. In addition, the temperatures required are usually higher than those for domestic use, reaching over 90 °C for activities such as equipment cleaning [9]. An SWHS with an ETC can heat water at a high temperature as required in agro-industries, attaining an acceptable efficiency even in winter [8,9,10]. The efficiency of SWHS-ETCs in industrial processes can reach values exceeding 45% [11].
Previous studies analyzing the feasibility and profitability of SWHS-ETCs are numerous, although most of them focus on domestic use at lower temperatures than those required in industries. The payback values calculated by the different authors vary greatly depending on the location and the type of energy used for conventional supply. In locations with high radiation, paybacks between 6 and 11 years are common [12,13,14]. In regions with low solar irradiation, the potential of solar thermal systems is limited [15].
In the food processing industry, the most common heat applications are pre-heating, cleaning and pasteurization [16]. The profitability of SWHSs has been analyzed in some industries, such as soft drinks (paybacks close to 6 years in the optimized scenarios) [17]. In the meat sector, a previous study of the research group analyzed the profitability of SWHS-ETCs [18], obtaining minimum paybacks of 7 years in the existing energy context, with a large fluctuation in values depending on the location and the price of energy of each one. Locations of high irradiation could reach profitability values of EUR 1.1 per EUR invested, paybacks lower than 9 years, a supply of more than 50% of the energy needed and a reduction in the annual energy bill of over 40%.
The results of previous works were valid for the context existing a few years ago, since they analyzed energy price ranges at that time. However, the brutal increase in the price of energy and raw materials experienced in recent years has exceeded all forecasts. The sizing criteria adopted a few years ago might not be adequate in the new context, causing inefficiencies, loss profitability or less energy savings. In the face of price volatility, it is necessary to design the installation to minimize future risk. In addition, in the new scenario, the profitability and viability of SWHSs could vary greatly from the results obtained in the past, being able to overcome previously insurmountable barriers.
The variability and higher water temperature required in the agri-food industry could also lead to significant variations in the performance and profitability of SWHSs in the new context. There is a knowledge gap regarding the optimal sizing and resulting feasibility of SWHSs in the current context and in future variations that may occur.
For this reason, the present work analyzed the impact of the new energy context on the sizing and viability of SWHSs in agri-food industries. Given this background, the line of research has been continued in meat industries, analyzing a wide range of energy prices that includes extreme values recorded in the new energy context. The aim is to establish sizing criteria to optimize the system for future variations. It also analyzes scenarios of very different radiation, including locations with cold and temperate climates, in order to determine whether the new context entails changes in the viability of SWHSs in areas where, until now, SWHSs were not attractive.
2. Materials and Methods
2.1. SWHS Useful Energy
The performance of SWHSs with active circulation is strongly conditioned by the hot water demand pattern and the temperature demanded [3,8]. The SWHS performance will decrease as the tank temperature increases, which, in turn, will change with each hot water discharge.
The estimation of the energy stored by the SWHS was carried out using an experimental system. The SWHS has a conventional heat pipe ETC with 24 vacuum tubes and 2 m2 of net collection surface (model SP-S58/1800-24 of WesTech Solar Technology Wuxi Co., Ltd., Wuxi, China), active circulation (Wilo-Star-ST 15/6 ECO-3 submerged rotor model, Wilo SE., Dortmund, Germany) with closed distribution (pipes with inner diameter of 20 mm and coated with 13 mm thick insulation material), an 80 L tank with exchange system through coil (model IAV 80/100 of Thermor España, Castelldefels, Spain), a control subsystem with two regulatory subunits (Allegro 453 of Sonder Regulación, S.A, Rubí, Spain; PLC logo of Siemens AG., Berlin, Germany) and numerous sensors for monitoring the different variables. In addition, a Micro Weather Station HOBO (Onset Computer Corporation, Bourne, MA, USA) monitored the solar radiation, ambient temperature and other weather parameters (Figure 1). The system is the same as the one used in previous works [7,8,9,18,19], although its programming was adapted to cover a temperature range from 40 °C to 90 °C, changing the setpoint temperature every day, in cycles of 6 days. Monitoring was carried out over a period of one year.
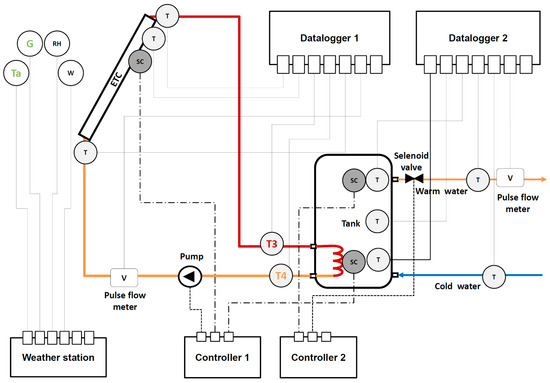
Figure 1.
Main components of the experimental SWHS.
The energy that the SWHS is able to store (QSWH) is a function of the irradiance (G), the ambient temperature (Ta) and the water temperature of the tank (Tt), calculated according to Equation (1) [18].
The constants of the equation were obtained through Microsoft Solver tool, comparing the values obtained with the model (Equation (1)) and the energy delivered in the experimental SWHS (Equation (2)) in order to obtain the same value of total energy supplied throughout the year.
From the data recorded by the sensors, the experimental energy was calculated according to Equation (2), where T3 is the temperature of the heat-transporting fluid upon entering the tank’s heat exchanger, T4 the temperature of the fluid upon leaving the tank, the flow rate of the heat-transporting fluid, Cp the specific heat capacity and Ac the useful area of the ETC.
With the constants calculated by Solver (, and ), the same value of total energy supplied throughout the year was obtained as in the real case, since overestimated moments are compensated with others in which they are underestimated. When comparing the values obtained with the model with the experimental ones by means of linear regression, an R2 = 0.994 and a typical error of 279 Wh m−2 d−1 were obtained (coefficient = 0.9997, standard deviation = 0.004, t = 246.35, p = 0).
2.2. Scenario Definition
In order to draw global conclusions on the feasibility of SWHSs in the new energy context, 7500 cases were analyzed. The starting point is 75 reference scenarios obtained as a combination of 1 water consumption pattern, 3 locations, 5 energy prices for conventional supply (EUR/kWh) and 5 prices for the necessary investment (EUR/m2 of collectors). In turn, for each of these scenarios, 100 different sub-scenarios were calculated, considering different SWHS sizes (from 0 to 99 collectors of 2 m2), in order to carry out an optimized design based on profitability criteria. The parameters analyzed and the ranges chosen are shown below.
2.2.1. Hot Water Demand Pattern
A medium-sized meat industry located in Spain was used as the reference, with a demand pattern that includes several temperatures depending on the product and/or process. The identification of the hot water demand was carried out using the work carried out by authors in the framework of the European project SCOOPE, which aims to transfer good practices and energy efficiency to agro-industries of several sectors. Industry consumption can be grouped into the following weekly simplified consumptions, shown in detail in Table 1: 18,900 L/week (cleaning water at 80 °C), 1200 L/week (cooking sausages at 97–100 °C), 600 L/week (washing casings at 45 °C) and 400 L/week (chorizo cleaning at 80 °C).

Table 1.
Hot water demand pattern analyzed.
2.2.2. Selected Locations
In order to have a more applicable study to serve as a global reference, 3 different locations were selected, with annual average Peak Sun Hours (PSHs) values of 3.0, 4.0 and 5.0 in the horizontal plane. The reference data were extracted from EnergyPlus climatological files, in particular:
- PSH 3.0: Stuttgart, Germany (DEU_Stuttgart.107380_IWEC.epw)
- PSH 4.0: Rome, Italy (ITA_Rome.162420_IWEC.epw)
- PSH 5.0: Los Angeles, USA (USA_CA_Los.Angeles.Intl.AP.722950_TMY.epw)
To maximize performance, the collectors were oriented to the south, using the approximate latitude of the site as the inclination. Using the EnergyPlus program and the aforementioned climatological files, the incident solar radiation on the inclined plane and the ambient temperature for each hour of the year were calculated. In addition, the water temperature in the supply network was estimated from the ground temperature data at 0.5 m depth (Figure 2).
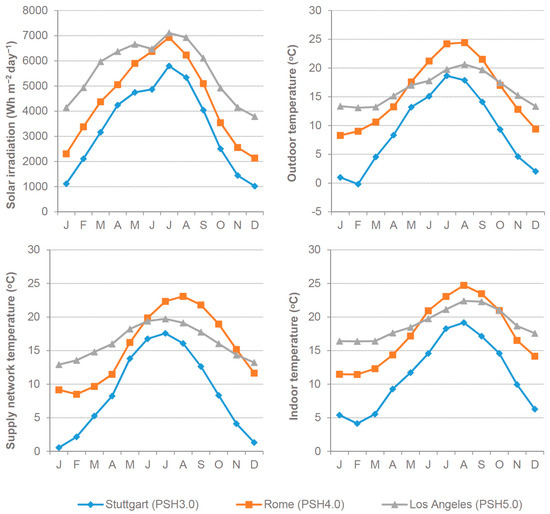
Figure 2.
Monthly average for irradiance on the inclined plane, outside air temperature, water supply network temperature and simulated air temperature inside the building for each location.
For the calculation of heat exchanges with the environment, it was assumed that the water tank is located inside the industry. The indoor temperature was estimated using a simulation model of an agro-industry developed and validated in a previous work [20] using the climatological files of each location (Figure 2).
2.2.3. Price of Energy from Conventional Supply
Since mid-2021, the price of energy has increased drastically, almost tripling the energy costs in one year. Thus, for the supply of electric water heaters for example, the price range offered in Spain for high voltage supply ranged from 0.092–0.069 EUR/kWh (most expensive period-cheapest period) in May 2021 to 0.302–0.216 EUR/kWh at the end of the year. Other costs (fixed term, taxes, etc.) would have to be added to this increase, resulting in a real final price per kWh consumed between EUR 0.3 and 0.5 depending on the periods of consumption and the contract renewal date. For gas or diesel supply, prices experienced a similar increase, with values offered at the end of 2022 between 0.14 and 0.20 EUR/kWh (RL4 tariff), to which fixed costs, taxes, etc., should be added.
Taking into account the great instability and variability of prices currently existing, the study analyzed a wide range, from 0.10 EUR/kWh (situation close to the price in 2020) to 0.50 EUR/kWh (price reached in some agroindustries in recent months), with an interval of 10 cents. In order to simplify the results, a single price was assumed regardless of the type of supply (electricity, gas, diesel, etc.).
2.2.4. Investment in SWHS
The cost of solar thermal systems varies greatly depending on the size and location. Thus, in Spain for example, prices can be around 400–600 EUR/m2. The cost of installation, which is highly variable, should be added to this value.
In order to enhance a broad application, to serve as a global reference, a wide price range of the required investment was analyzed, from 500 EUR/m2 to 900 EUR/m2, with a range of 100 EUR/m2.
2.2.5. Other Data
Useful life: 20 years.
Discount rate: 1.5%, close to the average 20-year government bond purchase rate in 2022 for countries such as Germany.
Annual maintenance cost: 2% of the investment.
Tank volume: 40 L per m2 of collector (same ratio as in the experimental SWHS).
Tank losses: 1.22 kW/24h according to DIN 4753/8 (at 65 °C and outside at 20 °C).
2.3. Calculation in the Proposed Scenarios
2.3.1. Energy Simulation of the SWHS in the Proposed Sub-Scenarios
The energy calculations were carried out using an improved version of a previously developed and validated simulation tool [18]. The energy balance was carried out for each sub-scenario, considering a specific number of collectors and a calculation interval of one hour.
The temperature at the end of each hourly interval was calculated from the temperature of the previous interval, taking into account the energy gains or losses produced during that interval (∆E), the volume of the tank (Vt), the density of the water () and the the specific heat capacity (Cp), according to Equation (3).
The energy variations calculated were: increase in energy transferred to the tank from the collector; energy loss each time hot water is discharged; energy exchange with the environment inside the industrial building through the surface of the tank.
The energy transferred to the tank from the collector was calculated using Equation (1), multiplying by the surface area of solar collectors.
The variation in energy produced when extracting hot water was calculated by Equation (4), taking into account the volume extracted (Ve) and the difference in temperature between the water in the tank (Tt) and the temperature of the supply network with which the tank is filled (). The volume extracted does not have to match the volume demanded. In cases where the temperature demanded is lower than the tank temperature, mixing with cold water was taken into account. For this purpose, the energy demanded and the energy extracted were equated, recalculating the volume required as a function of temperature.
The energy variations with the environment were calculated by multiplying the difference between the tank temperature and the indoor air temperature (Ti), the assumed thermal transmittance (Ut) and the external surface of the tank (St) (Equation (5)). It was assumed that the tank is located in an unheated boiler room within the industry, whose temperature was estimated using EnergyPlus, as previously described.
Considering that the maximum potential energy that can be supplied by the SWHS is a function of the tank temperature, but, in turn, that the tank temperature varies as the maximum potential energy data changes, the calculation was completed after a number of iterations in which the tank temperature remained virtually stable, with an annual average difference of less than 0.5 °C.
After completing the calculation, the annual energy indicators were obtained by the sum of each of the hourly intervals of the year:
- Annual irradiation: sum of the incident irradiation on the inclined plane multiplied by the collector area.
- Useful energy supplied by the SWHS given the industry pattern: from Equation (4), for each hour in which water is demanded.
- Actual performance of the SWHS: useful energy supplied divided by irradiation.
- Annual energy consumption: equivalent to Equation (4), but using the volume and temperature demanded given the industry pattern.
- Energy supplied by the conventional system: difference between the annual energy consumption and the useful energy supplied by the SWHS.
- Reduction in energy consumption compared to the scenario without SWHS: useful energy supplied divided by annual energy consumption.
2.3.2. Profitability for Each Sub-Scenario
Based on the energy calculations, the profitability indicators were obtained:
Indicators without SWHS:
- Annual payment without SWHS (EUR/year): annual energy consumption (kWh/year) multiplied by the price per kWh of energy.
- Total energy cost for 20 years without SWHS, discounted at the interest rate (EUR): NPV over 20 years, discounting annual payments according to the interest rate.
Indicators with SWHS:
- Initial investment required for the solar installation (EUR): number of collectors multiplied by the SWHS price (EUR/m2) and by 2 (m2 for each collector).
- Annual payment due to SWHS (EUR/year): sum of pump energy consumption multiplied by energy price plus maintenance cost.
- Annual payment for conventional supply with SWHS (EUR/year): product of the energy supplied by the conventional system and the price of energy.
- Total annual payment with SWHS (EUR/year): sum of the annual payment corresponding to the SWHS and the annual payment of the conventional supply when there is SWHS.
- Total energy cost discounted over the lifetime of the solar installation (EUR): NPV over 20 years, considering the required investment and discounting the annual payments (total annual payment with SWHS) according to the interest rate.
Savings indicators achieved:
- Annual savings achieved (EUR/year): difference between the annual payment without SWHS and the total annual payment with SWHS.
- Total energy cost savings over the lifetime of the SWHS (EUR): difference between the total energy cost discounted at the interest rate for 20 years without SWHS and the total energy cost discounted over the lifetime of the solar installation.
Based on the initial investment required and the annual savings achieved, NPV was calculated using Microsoft Excel functions. The discounted payback period was calculated from Equation (6), where “K” is the initial investment, “PB” the payback, “R” the annual cash flow (annual savings achieved) and “r” the discount rate.
2.3.3. Optimized Design for Each Scenario
When the 100 sub-scenarios with different SWHS sizes were calculated, it was necessary to determine the optimal size of the installation. For this purpose, two criteria were applied and analyzed: (1) to maximize the total energy cost savings during the SWHS lifetime; (2) to maximize the “savings/payback” ratio (total energy cost savings during the SWHS lifetime divided by the payback). The developed application determines the optimized sub-scenarios according to both criteria, storing all energy and payback data as representative values for comparison with the rest of the scenarios.
3. Results and Discussion
3.1. Sizing of SWHS
The sizing was carried out on the basis of two criteria: maximizing total energy cost savings (SWHS investment plus annual bills for 20 years) and maximizing the “savings/payback” ratio. The first criterion achieves maximum energy cost savings over the lifetime of the installation. However, it requires a larger installation size and, therefore, a higher investment. In addition, the profitability obtained is lower, with a higher payback (Figure 3).
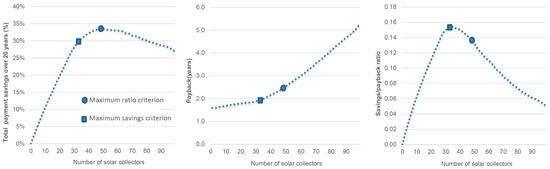
Figure 3.
Example of variation in total energy cost savings, payback and “savings/payback” ratio as a function of SWHS size.
By applying the criterion of maximizing the “saving/payback” ratio, the size of the SWHS and the necessary investment can be reduced (Figure 3). The average reduction in the set of scenarios analyzed is close to 25% (10 ± 5 collectors). A higher return on investment and a shorter payback period are obtained at the cost of giving up a small percentage of the energy cost savings achieved.
In addition, by applying the maximum ratio criterion, more stable sizes are achieved than with the maximum savings criterion (Figure 4). Thus, in most of the scenarios of the meat industry analyzed for example, the size of the SWHS would continue to be the optimum if the price of energy were to fall to 2020 levels (0.10 EUR/kWh). In order to simplify the results, a single price was assumed regardless of the type of supply (electricity, gas, diesel, etc.). Only in the lower radiation scenarios would the optimal number be slightly lower when the energy price drops below 0.20 EUR/kWh (Figure 4).
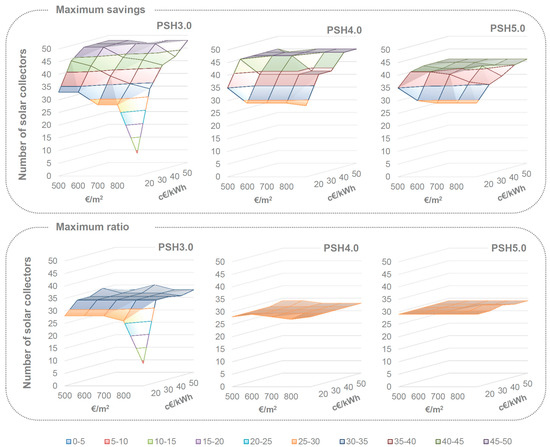
Figure 4.
Optimized sizing of the SWHS in the different scenarios analyzed (different radiation, energy price and investment price) according to the two sizing criteria used.
In contrast, the maximum savings criterion is more sensitive to variations in energy prices and investment. Changes in these variables lead to significant variations in the optimized size of the SWHS, especially at low irradiation. Thus, if 2020 prices were recovered, the SWHS would be oversized by 20% to 55% depending on the scenario.
3.2. Energy Savings
The energy savings achieved are strongly linked to the size of the SWHS. Assuming last year’s energy prices, values of up to 72% can be achieved with the maximum savings criterion and 62% with the maximum ratio in the scenarios with higher irradiance (Figure 5). When irradiation decreases, energy savings also decrease; the average of all scenarios analyzed is 57 ± 14% for the maximum savings criterion and 49 ± 13% for the maximum ratio.
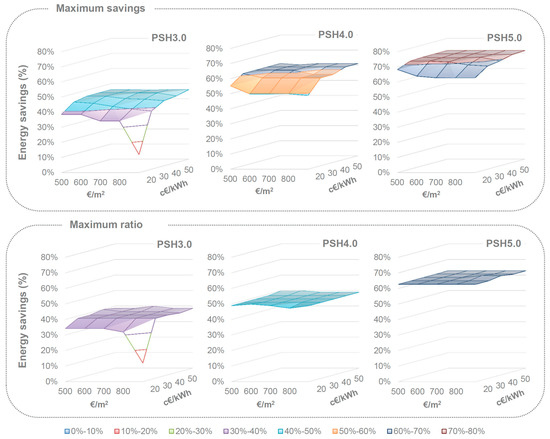
Figure 5.
Reduction in energy consumption of optimized SWHS (% kWh vs. scenario without solar system) in the analyzed scenarios.
However, the increase in the size of the installation does not directly translate into an equivalent percentage reduction in consumption. This is due to the loss of performance due to the increase in tank temperature. Thus, in the maximum savings scenarios for example, the reduction in overall performance (%G) when going from 0.10 to 0.50 EUR/kWh is 11 ± 3%.
3.3. Energy Costs Reduction
The energy savings achieved by the SWHS do not always translate into lower energy costs due to the initial investment required. Thus, the total cost savings over the lifetime of the installation is reduced, averaging 37 ± 15% for the maximum savings criterion and 34 ± 13% for the maximum ratio.
Total cost savings have significant variations not only with the price of energy but also with the cost of the installation, reaching values of over 50% in favorable scenarios, close to the current reality. If the energy price were to return to values of 0.10 EUR/kWh, the savings would be substantially reduced (Figure 6).
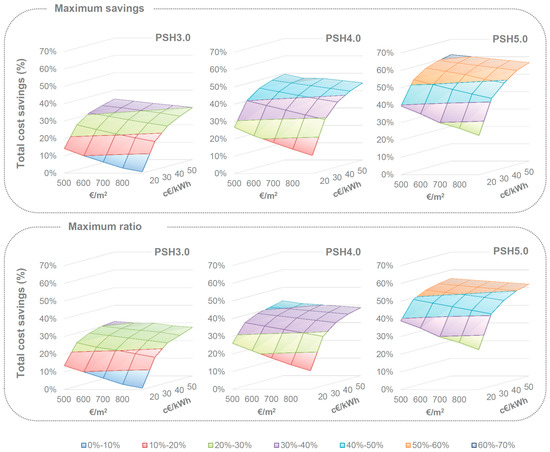
Figure 6.
Total energy cost savings (% vs. no SWHS scenario) over the lifetime of the installation (investment + annual bills) in the analyzed scenarios.
3.4. Profitability
The investment made in the SWHS is profitable in all the scenarios analyzed, considering the useful life of the installation (20 years). The maximum ratio criterion obtains an average payback reduction of 0.5 ± 0.3 years compared to the maximum savings criterion.
Profitability is very attractive in most of the scenarios analyzed, including the price ranges from 2021. Thus, the payback in most of them is less than 4 years (Figure 7). The average “NPV/investment” ratio is 5.6 ± 4.0 (euros of gain for each euro invested) for the maximum ratio criterion and 4.3 ± 3.1 for the maximum savings criterion.
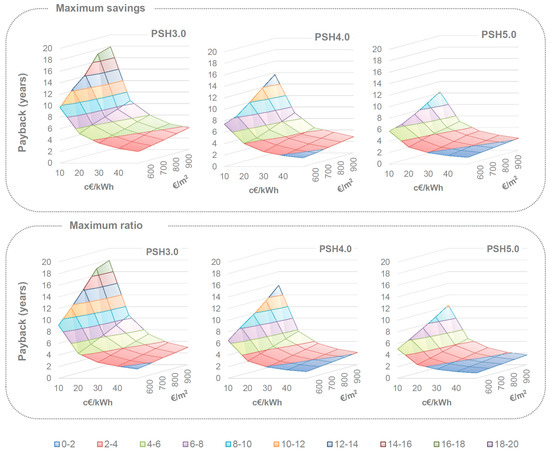
Figure 7.
Payback of the optimized SWHS in the analyzed scenarios.
Considering an energy price of 0.10 EUR/kWh, the payback values are similar to those obtained in agribusiness studies [17,18] carried out in a previous energy context. In favorable locations with high radiation, payback between 6 and 10 years can be achieved.
The new energy context favors especially cold climates with low radiation, where the payback decrease is more pronounced, making SWHS-ETC investment attractive. Assuming price ranges close to 0.10 EUR/kWh before the crisis, the payback would be reduced from the range 9–18 years (depending on the investment cost) to 2–6 years in the current context (Figure 7). Also noteworthy is the reduction in payback in temperate climates when the investment price is high. In locations with high radiation, the SWHS becomes highly profitable, although the change is minor, since it started from acceptable payback values.
If, before the payback period elapses, the price of energy were to fall back to 2020 values, the resulting payback would be between the starting value for the current price and the extreme value calculated for the lower price, approaching one or the other depending on the time elapsed until the price change.
4. Conclusions
The dramatic increase in the price of energy and raw materials experienced since 2021 has exceeded all forecasts. The current context of price instability and fluctuation makes it necessary to re-evaluate the optimal sizing of SWHSs and their potential savings and profitability.
The sizing of the SWHS by maximizing the “savings/payback” ratio reduces the size of the installation compared to the maximum savings criterion (average close to 25% in the industry analyzed) and, therefore, the initial investment required and the risk assumed. It also increases profitability by giving up a percentage of the energy savings achieved. On the other hand, more stable sizes are achieved than with the maximum savings criterion, reducing uncertainty in the face of future variations in the price of energy.
If the priority is to reduce emissions and the associated carbon footprint while maintaining high savings in energy expenditure, the criterion for sizing the SWHS should be to maximize total cost savings. By using this criterion, a greater reduction in energy consumed is achieved at a lower return on investment (payback increase of 0.5 ± 0.3 years) and a higher associated risk.
The new energy context makes the SWHS investment highly profitable, with a payback of less than 4 years in most of the scenarios analyzed, including price ranges from 2021. Energy savings values of up to 72% can be achieved with the maximum savings criterion and 62% with the maximum ratio in the highest irradiation scenarios (an average of all scenarios analyzed of 57 ± 14% for maximum savings and 49 ± 13% for the maximum ratio). This translates into a reduction in total energy expenditure (investment + annual bills for 20 years) of more than 50% in the favorable scenarios close to the current reality.
The new energy context especially favors cold climates with low radiation and temperate climates with high investment costs, with very sharp payback drops. Investment in SWHS-ETCs has gone from unattractive returns to paybacks of a few years, which should favor the development of these systems.
The new generations of improved ETCs (nanofluids, etc.) will increase the efficiency of SWHSs. Future works should analyze their profitability and optimal sizing in the new energy context of agro-industries.
The results of the study should serve as a reference for decision making in the agro-industrial sector, promoting the implementation of renewable energies for high-temperature water supply.
Author Contributions
Conceptualization, A.P. and F.B.; methodology, J.L.G. and F.R.M.; investigation, J.L.G.; software, R.M.B. and F.R.M.; validation, R.M.B. and F.R.M.; formal analysis, A.P. and F.B.; resources, J.L.G. and F.B.; writing—original draft preparation, A.P. and F.R.M.; writing—review and editing, R.M.B. and F.B.; visualization, A.P. and R.M.B.; project administration, J.L.G.; funding acquisition, J.L.G. All authors have read and agreed to the published version of the manuscript.
Funding
This research received no external funding.
Data Availability Statement
The data presented in this study are available on request from the corresponding author.
Acknowledgments
We thank Victoria de Los Mozos Hernando for her collaboration in the characterization of the hot water demand pattern of the meat industry.
Conflicts of Interest
The authors declare no conflict of interest.
References
- MAPA Informe Anual De La Industria Alimentaria Española. Período 2021–2022 (Annual Report of the Spanish Food Industry Period 2021–2022). Available online: https://www.mapa.gob.es/es/alimentacion/temas/industria-agroalimentaria/cifras-industria/ (accessed on 15 June 2022).
- García, J.L.; Perdigones, A.; Benavente, R.M.; Mazarrón, F.R. Influence of the new energy context on the Spanish agri-food industry. Agronomy 2022, 12, 977. [Google Scholar] [CrossRef]
- Sokhansefat, T.; Kasaeian, A.; Rahmani, K.; Heidari, A.H.; Aghakhani, F.; Mahian, O. Thermoeconomic and environmental analysis of solar flat plate and evacuated tube collectors in cold climatic conditions. Renew. Energy 2018, 115, 501–508. [Google Scholar] [CrossRef]
- Yurddas, A. Optimization and thermal performance of evacuated tube solar collector with various nanofluids. Int. J. Heat Mass Transf. 2020, 152, 119496. [Google Scholar] [CrossRef]
- Aggarwal, S.; Kumar, S.; Kumar, R.; Thakur, R. In Thermal augmentation in evacuated tube solar collectors using reflectors, nano fluids, phase change materials and tilt angle: A review. Mater. Today Proc. 2021, 45, 4931–4935. [Google Scholar] [CrossRef]
- Vasiliev, L.L. Heat pipes, nanofluids, and nanotechnologies. J. Eng. Phys. Thermophys. 2021, 94, 1217–1226. [Google Scholar] [CrossRef]
- Mazarrón, F.R.; Porras-Prieto, C.J.; Garcia, J.L.; Benavente, R.M. Feasibility of active solar water heating systems with evacuated tube collector at different operational water temperatures. Energy Convers. Manag. 2016, 113, 16–26. [Google Scholar] [CrossRef]
- Porras-Prieto, C.J.; Mazarron, F.R.; de los Mozos, V.; Garcia, J.L. Influence of required tank water temperature on the energy performance and water withdrawal potential of a solar water heating system equipped with a heat pipe evacuated tube collector. Sol. Energy 2014, 110, 365–377. [Google Scholar] [CrossRef]
- Porras-Prieto, C.J.; Lizcano, J.; Garcia, J.L.; Mazarron, F.R. Energy saving in an ETC solar system to produce high temperature water. Energies 2018, 11, 840. [Google Scholar] [CrossRef]
- Pei, G.; Li, G.Q.; Zhou, X.; Ji, J.; Su, Y.H. Comparative experimental analysis of the thermal performance of evacuated tube solar water heater systems with and without a mini-compound parabolic concentrating (CPC) reflector(C < 1). Energies 2012, 5, 911–924. [Google Scholar]
- Akbar, M.A.; Rashid, M.M.; Bin Embong, A.H.; Mohideen, A.J.B.H.; Akhter, M.N. Performance analysis of evacuated tube collector based solar heat for industrial process (SHIP) system in Malaysian climate. J. Eng. Sci. Technol. 2022, 17, 2299–2314. [Google Scholar]
- Hazami, M.; Naili, N.; Attar, I.; Farhat, A. Solar water heating systems feasibility for domestic requests in Tunisia: Thermal potential and economic analysis. Energy Convers. Manag. 2013, 76, 599–608. [Google Scholar] [CrossRef]
- Jing, O.L.; Bashir, M.J.K.; Kao, J.J. Solar radiation based benefit and cost evaluation for solar water heater expansion in Malaysia. Renew. Sustain. Energy Rev. 2015, 48, 328–335. [Google Scholar] [CrossRef]
- Singh, S.; Anand, A.; Shukla, A.; Sharma, A. Environmental, technical and financial feasibility study of domestic solar water heating system in India. Sustain. Energy Technol. Assess. 2021, 43, 100965. [Google Scholar] [CrossRef]
- Greening, B.; Azapagic, A. Domestic solar thermal water heating: A sustainable option for the UK? Renew. Energy 2014, 63, 23–36. [Google Scholar] [CrossRef]
- Ismail, M.I.; Yunus, N.A.; Hashim, H. Integration of solar heating systems for low-temperature heat demand in food processing industry—a review. Renew. Sustain. Energy Rev. 2021, 147, 111192. [Google Scholar] [CrossRef]
- Gudeta, M.S.; Mekbeb, S.; Shibeshi, M.; Gardie, E. Performance analysis of solar water heater system with heat pipe evacuated tube collector on Moha soft drink industries in Ethiopia. Case Stud. Therm. Eng. 2022, 36, 102211. [Google Scholar] [CrossRef]
- Garcia, J.L.; Porras-Prieto, C.J.; Benavente, R.M.; Gomez-Villarino, M.T.; Mazarron, F.R. Profitability of a solar water heating system with evacuated tube collector in the meat industry. Renew. Energy 2019, 131, 966–976. [Google Scholar] [CrossRef]
- Porras-Prieto, C.J.; Benedicto-Schonemann, S.; Mazarron, F.R.; Benavente, R.M. Profitability variations of a solar system with an evacuated tube collector according to schedules and frequency of hot water demand. Energies 2016, 9, 1053. [Google Scholar] [CrossRef]
- Mazarron, F.R.; Cid-Falceto, J.; Canas-Guerrero, I. Assessment of aboveground winery buildings for the aging and conservation of wine. Appl. Eng. Agric. 2012, 28, 903–910. [Google Scholar] [CrossRef]
Disclaimer/Publisher’s Note: The statements, opinions and data contained in all publications are solely those of the individual author(s) and contributor(s) and not of MDPI and/or the editor(s). MDPI and/or the editor(s) disclaim responsibility for any injury to people or property resulting from any ideas, methods, instructions or products referred to in the content. |
© 2023 by the authors. Licensee MDPI, Basel, Switzerland. This article is an open access article distributed under the terms and conditions of the Creative Commons Attribution (CC BY) license (https://creativecommons.org/licenses/by/4.0/).