Article

Ultrafast Energy Transfer Dynamics in a Cyanobacterial Light-Harvesting Phycobilisome

1
School of Physics, State Key Laboratory of Optoelectronic Materials and Technologies, Sun Yat-sen University, Guangzhou 510275, China
2
Yantai Institute of Coastal Zone Research, Chinese Academy of Sciences, Yantai 264003, China
3
Center for Ocean Mega-Science, Chinese Academy of Sciences, Qingdao 266071, China
*
Authors to whom correspondence should be addressed.
Processes 2023, 11(6), 1656; https://doi.org/10.3390/pr11061656
Submission received: 24 April 2023 / Revised: 22 May 2023 / Accepted: 26 May 2023 / Published: 29 May 2023
(This article belongs to the Special Issue Advances in Solar Thermal Energy Technology)

Abstract

:
The phycobilisomes (PBSs) of cyanobacteria and red algae are their primary light-harvesting antennas, which play key role in light harvesting and energy transportation to the photosynthetic reaction center with extraordinarily high efficiency. The mechanism of energy transfer in PBS should be investigated with a tight combination between biological structural information and an ultrafast time-resolved dynamic analysis. We recently demonstrated the study of energy transfer in PBSs from a thermophilic cyanobacterium, Thermosynechococcus vulcanus NIES 2134 (T. 2134), with the cryo-EM model resolved at a near-atomic resolution. The time-resolved fluorescence spectroscopy of the PBS with a sub-picosecond resolution was discovered at 77 K. Deconvolution of the fluorescence decay curve was then used to reveal the energy transfer channels and the associated transfer rates. Except for the fluorescence lifetimes of terminal emitters, four time components, i.e., 9 ps, 13 ps, 23 ps, and 55 ps, were recognized in the energy transfer in the PBSs. The energy transfer dynamics in the PBSs were further analyzed by combining the cryo-EM structure and the spectral properties in detail. The findings from this study aid in our understanding of the energy transfer mechanisms in PBSs.

1. Introduction

Cyanobacteria, or Cyanophyta, are aquatic Gram-negative bacteria [1]. It is well known that cyanobacteria were the first organisms to have created oxygen via photosynthesis. In addition, by creating and evolving molecular oxygen as a byproduct of photosynthesis, the living and multiplying of cyanobacteria changed the early oxygen insufficiency of the Earth’s atmosphere and allowed for the emergence of diverse life forms on Earth [2]. Unlike purple bacteria or other organisms that likely perform anoxygenic photosynthesis, cyanobacterial thylakoid membranes are not continuous with the plasma membrane but have separate compartments [3]. These thylakoid membranes have an important function in photosynthesis, as they host the PBSs, which function as the primary light-harvesting antennae for their photosystems [4]. These PBSs are composed of chromophorylated protein stacks, which are referred to as phycobiliproteins (PBPs) and linker proteins. PBSs present a classical structure, wherein allophycocyanin (APC) functions as the core of the model and is surrounded by several outwardly oriented rods made up of stacked disks of phycocyanin (PC) and phycoerythrin (PE). In an antenna-like assembly, the geometrical arrangement of PBPs is exquisite. This intricate arrangement facilitates a high efficacy in terms of the transmission of the excitation of PBSs [5].
To provide a precise understanding of the energy transfer process in PBSs, scientists have explored models of the protein’s energy distribution and energy transfer through steady-state and transient spectra concerning the unique spectral properties of different PBPs [6,7]. The spectral properties of PBPs are primarily determined by their prosthetic groups, which are linear tetrapyrroles known as phycobilin, including phycocyanobilin (PCB), phycoerythrobilin (PEB), and phycourobilin (PUB) [8]. Each PBP has a distinct absorption and fluorescence emission in the visible range of light. As a result of their presence and specific arrangement within the PBSs, light energy can be absorbed and transferred uni-directionally to the chlorophyll of photosystem II. In this way, PBPs take advantage of the available light wavelengths (in the 500–650 nm range) that chlorophyll cannot access and use their energy for photosynthesis [9,10]. This is especially beneficial deeper in the water column, where longer-wavelength light is less transmitted and thus less directly available to the chlorophyll. The light-trapping function of phycobilisome and phycobilin arises from variations in the protein arrangement and microenvironment of the prosthetic groups. The sole reliance on the spectral results of phycobilin falls short in explaining the intricate energy transfer process, which must be understood through a synergistic approach, combining spectral properties, protein structures, and compositions to derive functional insights from structural features. It is much to be regretted that only five detailed architectures of PBSs have been described by cryo-electron microscopy (cryo-EM) with great resolution at the near-atom level: two red alga species Griffithsia pacifica [11], Porphyridium purpureum [12], and three cyanobacterial species, Anabaena 7120, Synechococcus 7002 [13], and Thermosynechococcus vulcanus 2134 [14]. Therefore, it is challenging to interpret the complex energy transfer processes and mechanisms in phycobilisomes.
As mentioned above, the energy transfer dynamics of thermophilic cyanobacterium T. 2134 are controversial in the absence of a high-resolution protein structure. In 2003, Adir et al. discovered a minor fraction of PC that absorbed maximally at 612 nm during the isolation of APC from T. 2134 [15]. This unique PC612 trimer was thought to cover the space between the lower-base core cylinders and the higher cylinders in the APC core at the ends of two of the rods. Based on this structural model, they discovered a quick energy transfer pathway that took 888 fs to go from the rod to the core via linker proteins, and then 17 ps to get from the core to the terminal emitters (LCM) [16]. Then, using ps fluorescence and fs pump-probe spectroscopies, Kawakami et al. discovered an energy transfer of 7.3 ps between the PC trimers in the rods, 53 ps from the PC rod to the APC core, and 180 ps in the APC core complex [17]. They also confirmed that the APC trimer, not the PC612 trimer, is located between the lower-base core A cylinders and the higher B cylinder [18]. Although these works have provided the energy transfer pathways and relative time constants in the PBSs of T. 2134, the precise energy transfer pathways between chromophores are still uncertain due to the lack of more precise structural information. Until recently, the APC core and PC rod of 
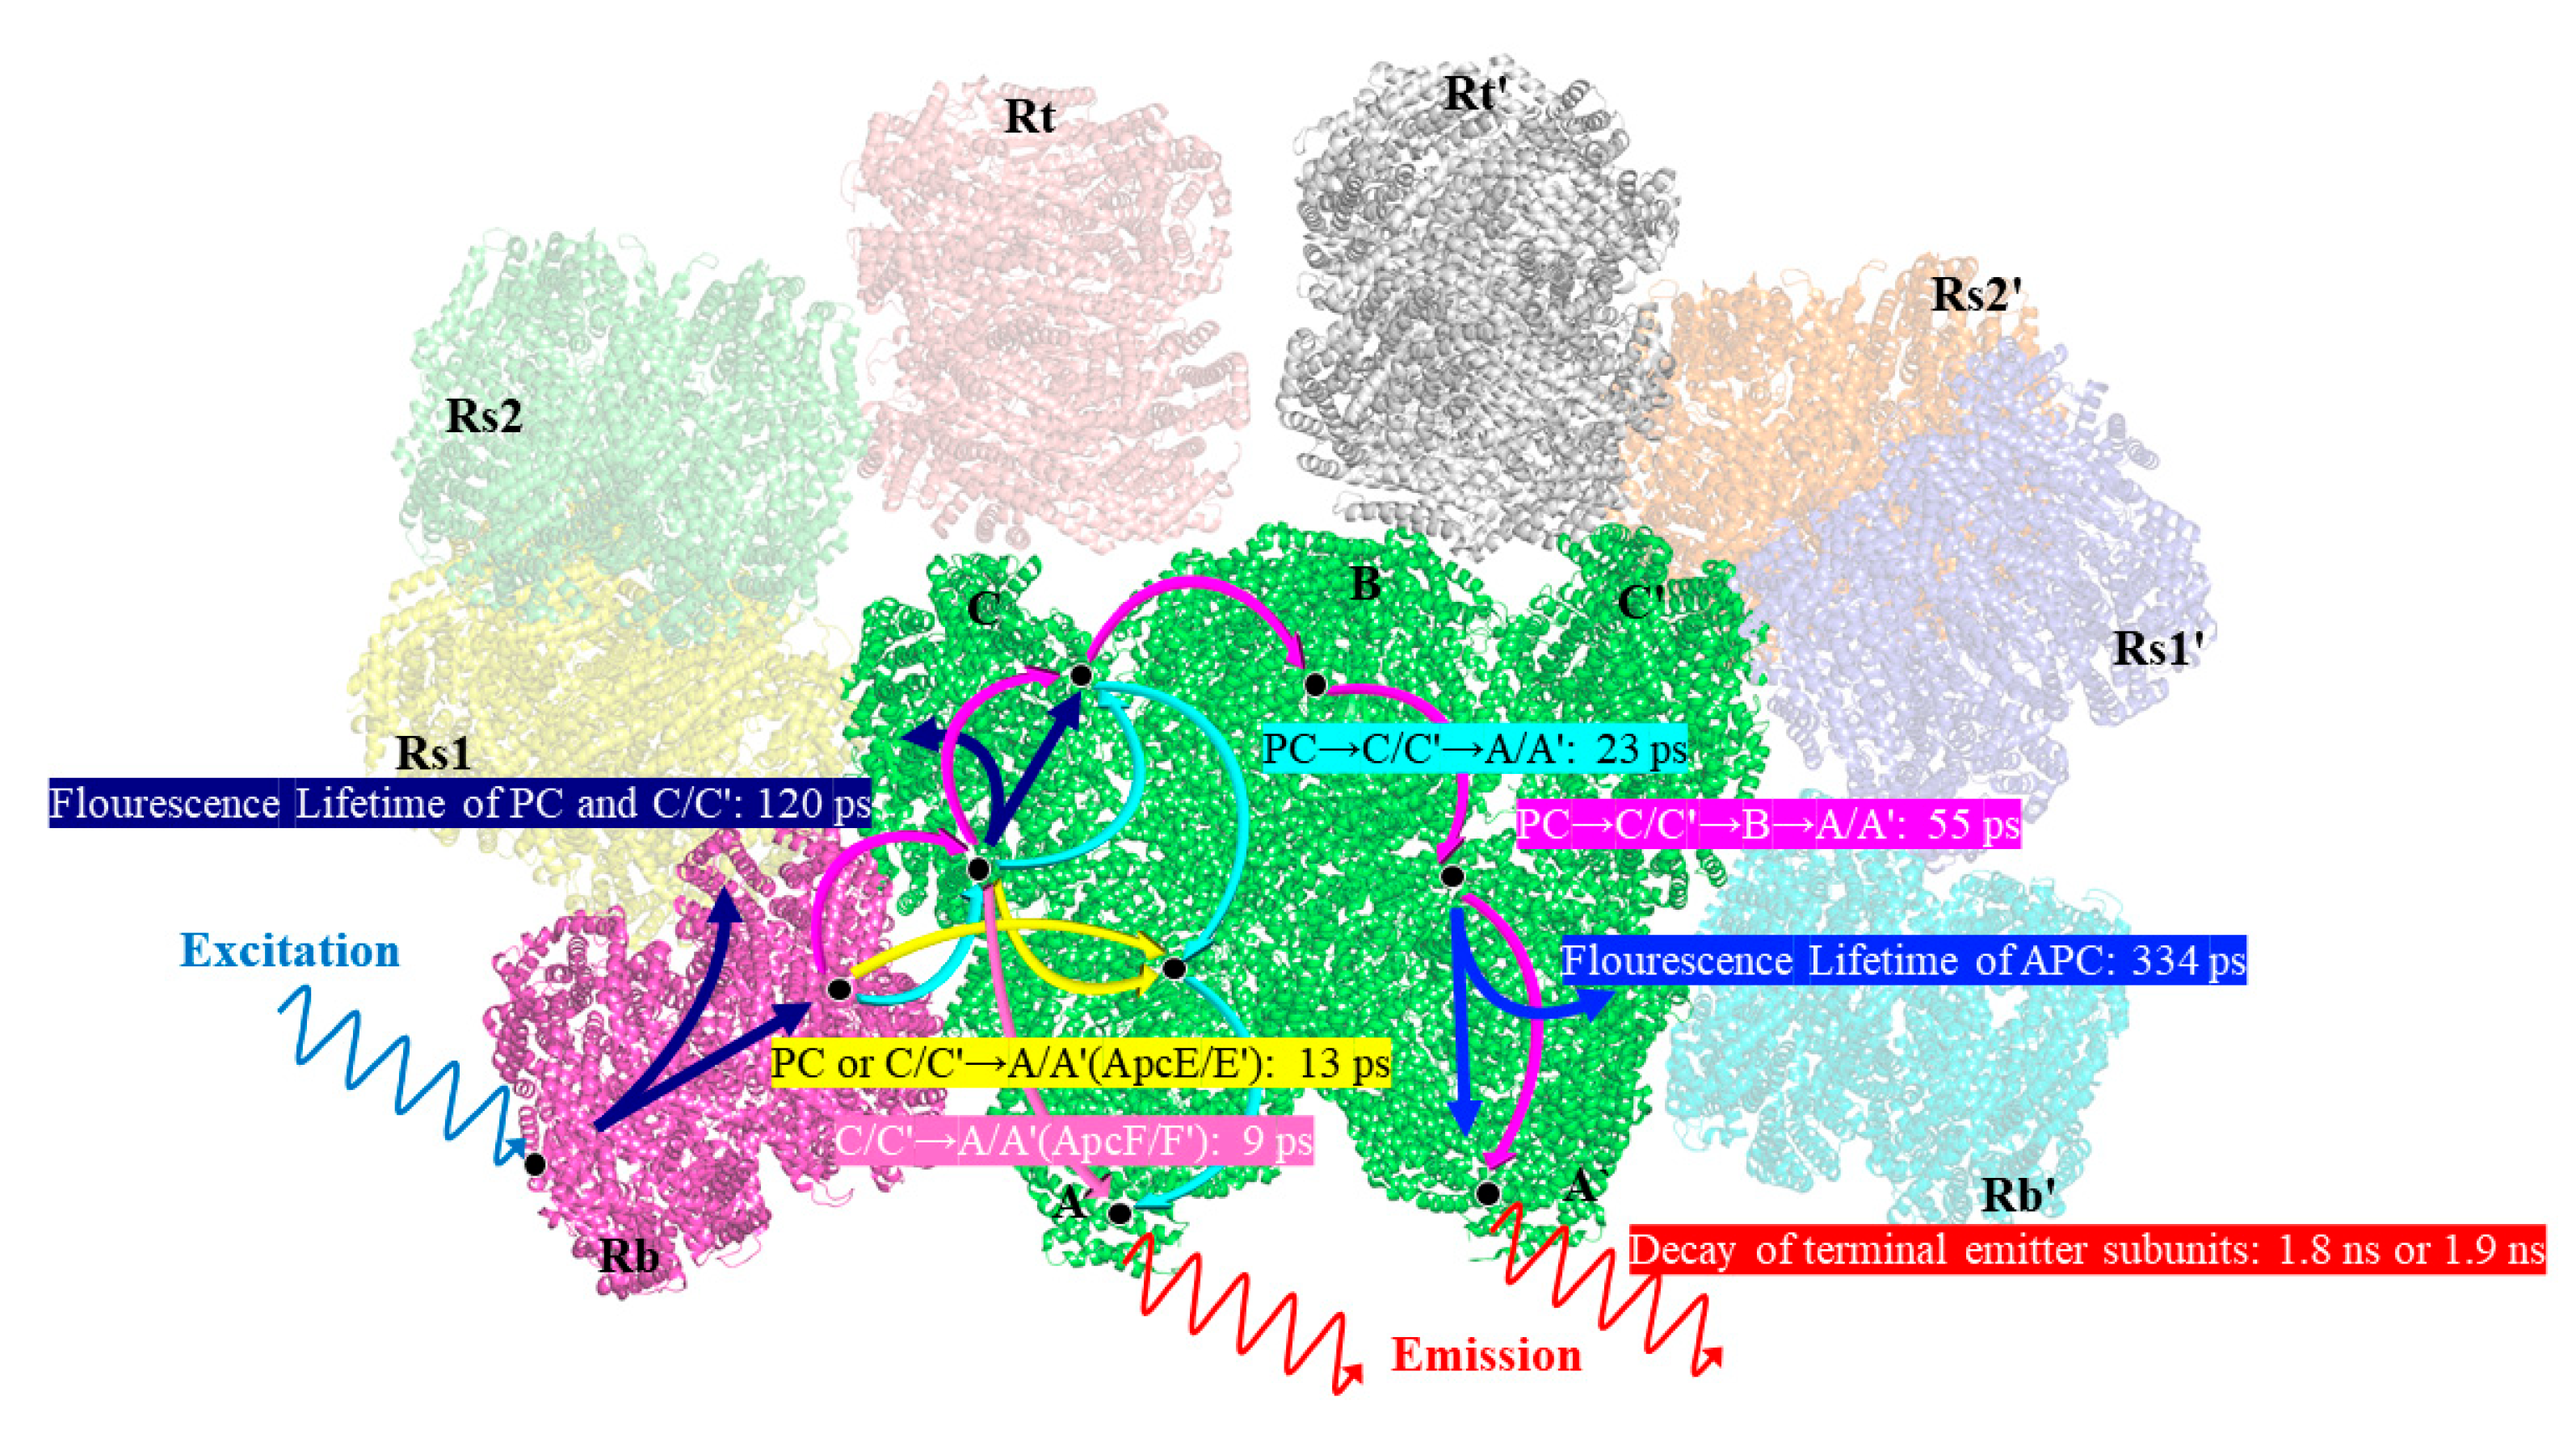
T. 2134 were resolved at 3.7 and 4.2 resolutions, respectively, yielding the results that the PBS molecule of 
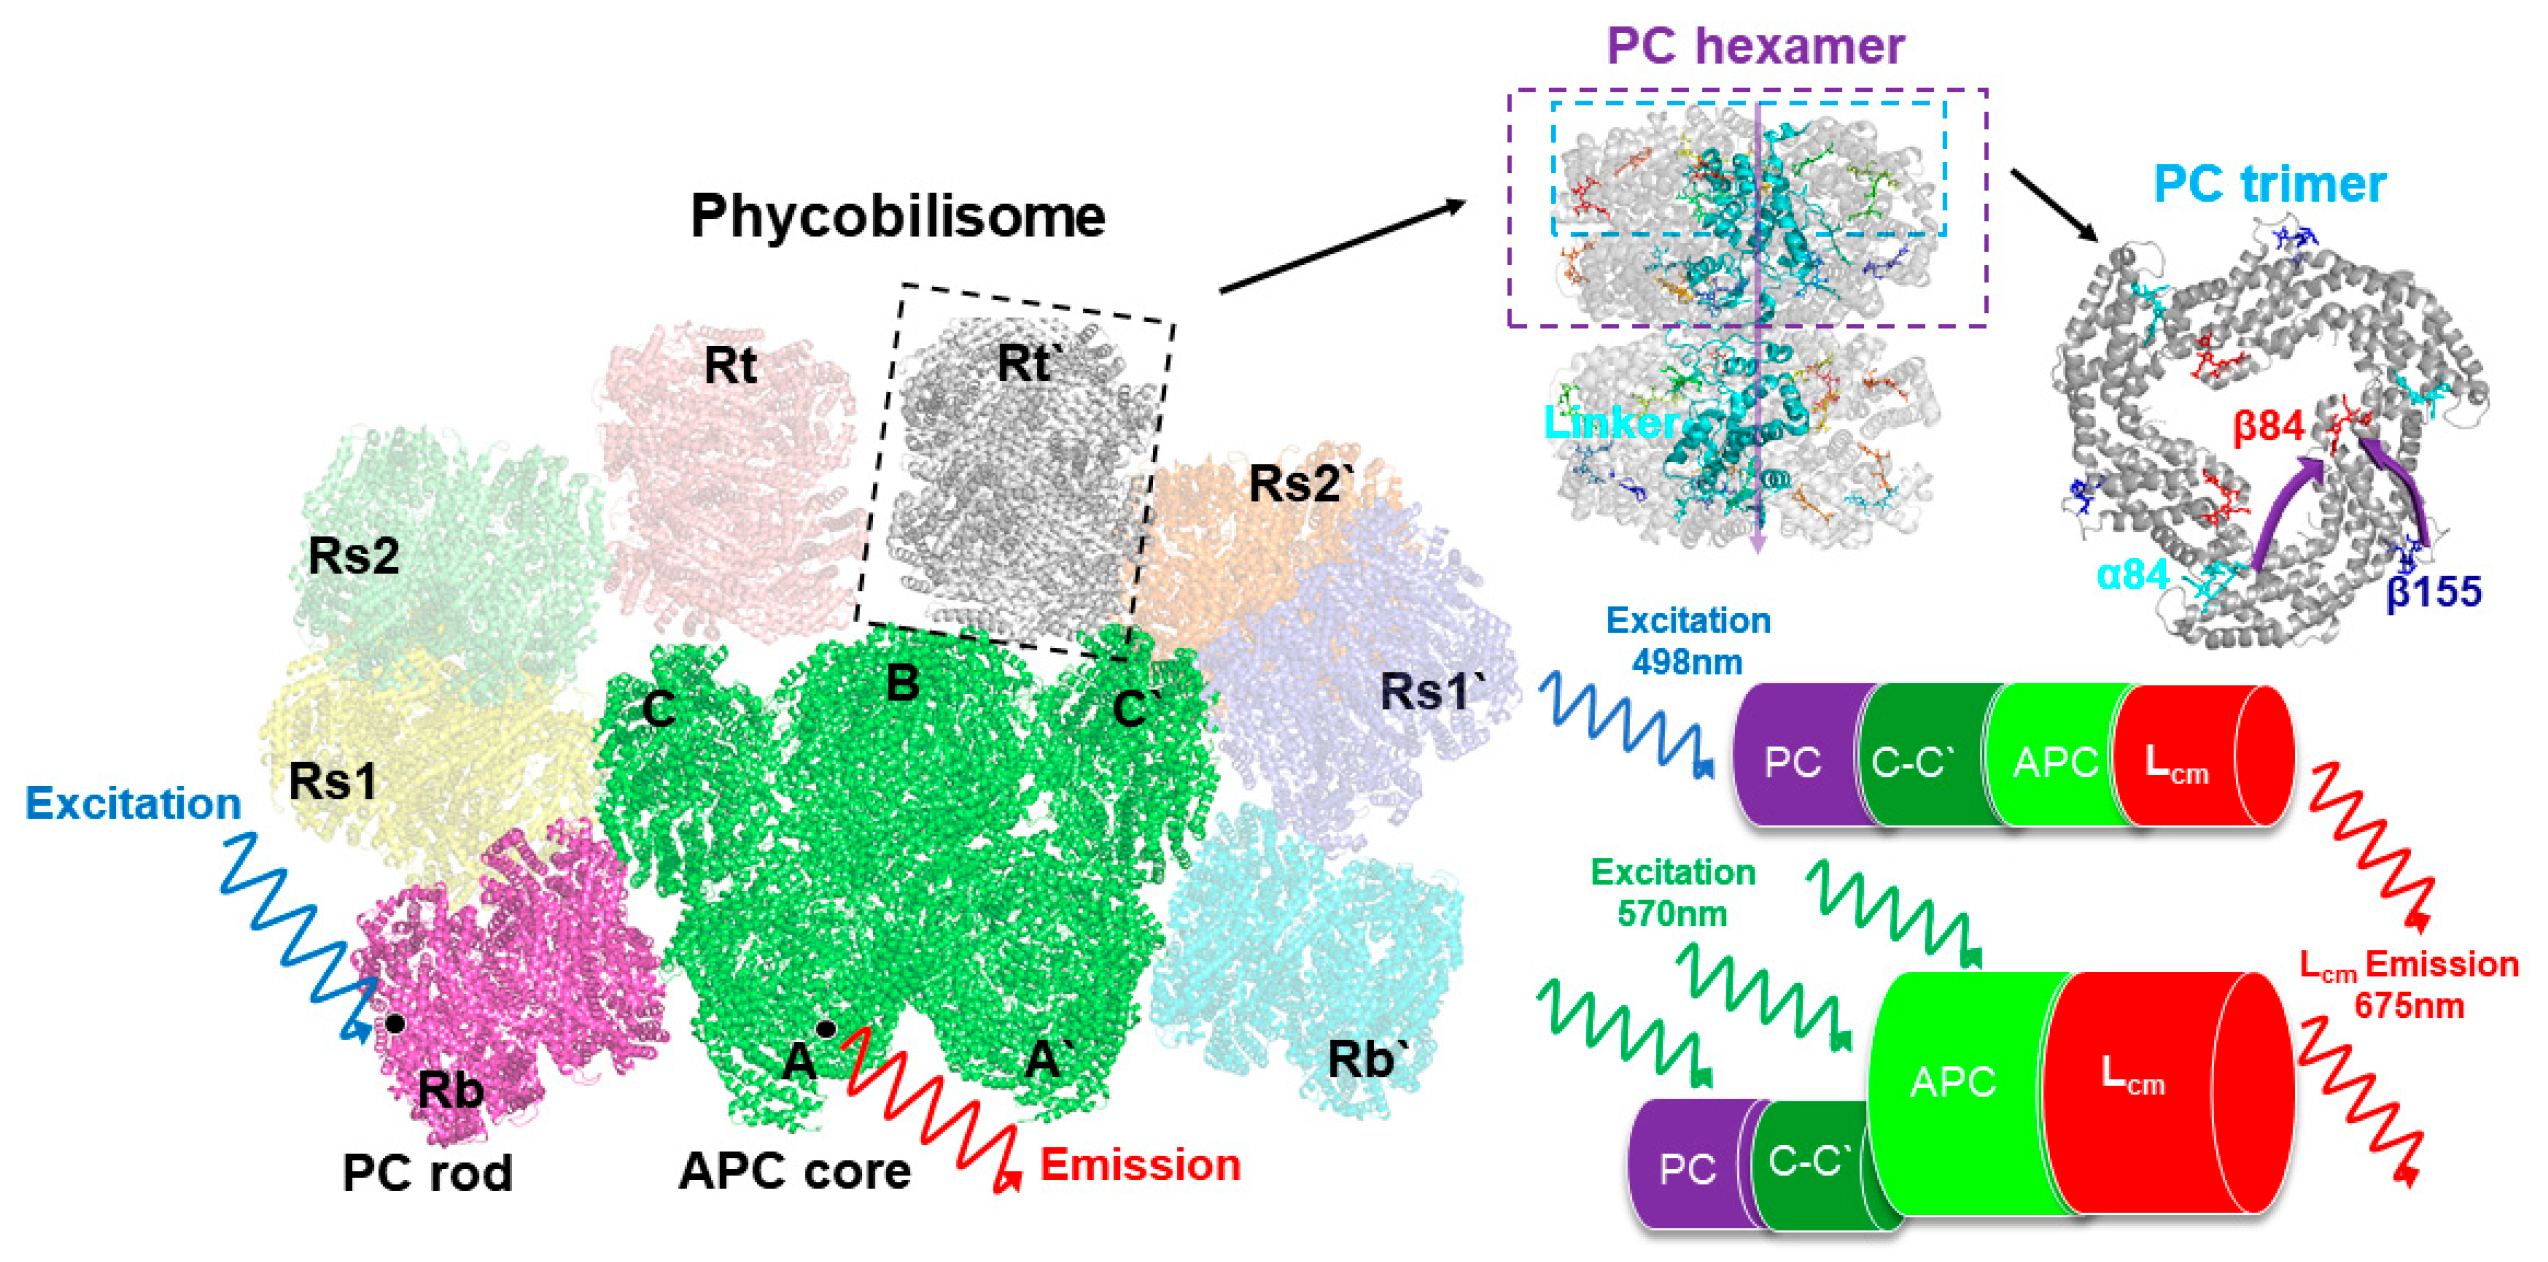
T. 2134 consists of five APC core cylinders (A, A′, B, C, and C′) surrounded by eight PC rods (Rb, Rb′, Rt, Rt′, Rs1, Rs1′, Rs2, and Rs2′), as shown in Figure 1, thus providing the precise structural basis for energy transfer research. In this paper, with a focus on the PBS rod–core assembly [19], we aim to re-identify the precise energy transfer dynamics between the chromophores of PBSs of T. 2134 via fs time-resolved fluorescence spectra on the basis of a near-atomic resolution structure.

2. Materials and Methods

2.1. Growth of Cyanobacteria and Isolation of PBS

T. 2134 was grown in BG11 medium at 39 °C under light illumination (light cycle of 16 h, dark cycle of 8 h) with air supply through 0.22 μm filters.
After 7 days of culturing, PBSs were isolated from T. 2134 based on Professor Gantt’s method of extraction with some minor changes [20]. Briefly, the PBSs were extracted at 18 °C with a pH of 7.0 and with a 0.75 mol/L Na2HPO4-KH2PO4 phosphate buffer containing 0.5 mol/L of sucrose and 10 mmol/L of EDTA as a buffer system. (1) The algal cells were harvested through centrifugation at 6000× g for 10 min and then rinsed twice in pH 7.0 phosphate buffer to collect the precipitate. (2) After 3 g of wet weight was collected to a total volume of 10 mL with phosphate buffer with a final concentration of 1 mmol/L PMSF (protease inhibitor), the cells were then disrupted by a French press (4000 psi, twice) [21]. (3) Triton X-100 was added to a final concentration of 2% to dissolve the thylakoid membrane, and PMSF was added again to a final concentration of 1 mmol/L. The samples were occasionally very gently shaken for 2 min for 30~40 min in the dark. (4) The above solution was treated by ultracentrifugation (centrifuge with a Beckman Coulter Optima XPN-100 ultracentrifuge, SW41Ti rotor, and a centrifugal force RCF av = 20,000 g (12,150× g rpm) at 18 °C for 45 min). (5) The resulting supernatant from the above ultracentrifugation was placed in a gradient sucrose solution (0.5, 0.75, 1.0, 1.5, and 2.0 mol/L sucrose in 0.75 mol/L phosphate buffer), and it was then ultracentrifuged using an SW41Ti rotor with a centrifugal force RCF av = 120,000 g (37,400× g rpm) at 18 °C for 4 h. The target PBSs were collected from the 1 mol/L sucrose layer.

2.2. Determination of Time-Resolved Spectral Properties

Figure 2 shows the experimental setup for measuring the time-resolved spectra. At a central wavelength of 800 nm, the experiment was carried out using a regenerative Ti: sapphire amplifier system (Astrella, Coherent Inc., Santa Clara, CA, USA). After this, the excitation laser was tuned to 498 nm and 570 nm using a femtosecond OPA (OPerA Solo, Coherent) with a pulse duration of 35 fs and a repetition rate of 1 kHz. The output femtosecond laser beam was focused into a silica sample-holding cuvette, which was frozen in the dark after being submerged in liquid nitrogen, after passing through an aperture and a continuous attenuator. The fluorescence signal of the sample was then collected by a synchroscan streak camera (C4742, time-resolution 700 fs, HAMAMATSU PHOTONICS K.K., Hamamatsu City, Japan) coupled with a polychromator, allowing for the detection of temporal characteristics. The time resolution of the time-resolved fluorescent spectrum measurement was primarily determined by the response time of the streak camera and the width of the stimulation pulse. The streak camera’s response time was less than 1 ps, and, accounting for the dispersion effect of the optical elements and the time jitter of the synchronous trigger signal, the overall system’s time resolution was under 2 ps. All the measurements were carried out at a temperature of 77 K.

2.3. Time-Resolved Fluorescence Spectra Analysis

The two-dimensional fluorescence image acquired by the streak camera encoded the lifetime and wavelength characteristics of the fluorescent molecule on the horizontal and vertical axes, respectively. In the wavelength direction, the fluorescence decay kinetic curve was obtained by cutting the image at the appropriate spacing and summing the number of photons accumulated in the cutting region. After assuming different exponential decay components, the dataset containing the fluorescence decay curve was further analyzed by using the multi-exponential fitting method. To avoid additional statistical errors caused by different measurement results in the fitted results and ensure the strict consistency of the laws obtained with different measurements, the global optimization method was applied [22]. In addition, the global optimization method assumes that the time and wavelength characteristics of fluorescence molecules are separable, which means that the contribution of the lifetime of an individual fluorescence decay component to the overall fluorescence decay is independent of the emission wavelength. Therefore, for the entire dataset, the fluorescence decay curves for different bands were fitted simultaneously with the same parameters, and only amplitude variations were allowed between the emission wavelengths. By using lifetime parameters as a global fitting parameter, multiple groups of experimental data were fitted, and we obtained the fluorescence-decay-associated spectra (FDASs) corresponding to the wavelength. The FDASs were provided by the amplitudes of the exponential components as a function of the emission wavelength [23]. During data processing, it was necessary to deconvolve the fluorescence images acquired by the streak camera [24,25]. Here, Fexp represents the detected fluorescence intensity, which is described as follows:
Fexp(t) = fpump ⊗ Ftheo = ∫fpump(t)Ftheo(t − t′)dt′
where fpump is the time response function of the test instrument to the pulse. In this case, we considered the theoretical fluorescence intensity Ftheo as a multi-exponential sum:
Ftheo(t) = ∑εiexp(−t/τi)
To fit the isotropic fluorescence, we used a deconvolution procedure based on a global optimization algorithm, as described below [23]. The amplitude of the fluorescence isotropic decay constant of τi is denoted by A.
I n ( λ , t ) = i = 1 n A i ( λ i ) exp ( t / τ i )

3. Results

The steady-state absorption spectra of the isolated PC trimer and APC core from T. 2134, as well as the entire PBSs, were resolved at room temperature [19]. The absorption band of the intact PBSs peaked at 620 nm. The absorption band of the isolated PC rod also peaked at 620 nm but exhibited narrower results than those of the intact PBSs, whereas the absorption band of the APC core performed as a broadening on the red side of the PC trimer, peaking at 650 nm with a shoulder at 600 nm. The PC rod then exhibited a fluorescence peak at 650 nm, while the peak of the APC fluorescence was around 675 nm. We further measured the spectral properties of the C-cylinder of the core, where the absorption band peaked at 612 nm and the emission band peaked at 645 nm [26]. At steady state, the emissions from the various fluorescence components combined to form the fluorescence spectra; therefore, to investigate the overall energy transfer dynamics in the PBSs, the time-resolved fluorescence spectra were analyzed, and the femtosecond laser at a wavelength of 498 nm and 570 nm was selected to excite the PBS samples, respectively. The steady-state absorption spectra measurements showed that only the PC trimer was excited under a wavelength of 500 nm, as the APC core has no absorption at a wavelength of 498 nm [19,27]; however, both the PC trimer and APC core could be excited under a wavelength of 570 nm.
The time-resolved fluorescence spectra of the PBSs of T. 2134 at 77 K were examined in detail. High signal-to-noise ratios were made possible by its ability to ignore solvent and molecule vibration effects at 77 K, which ensured that the results of the time-resolved fluorescence spectroscopy closely matched the energy transfer assumptions required in the theoretical models [28]. 
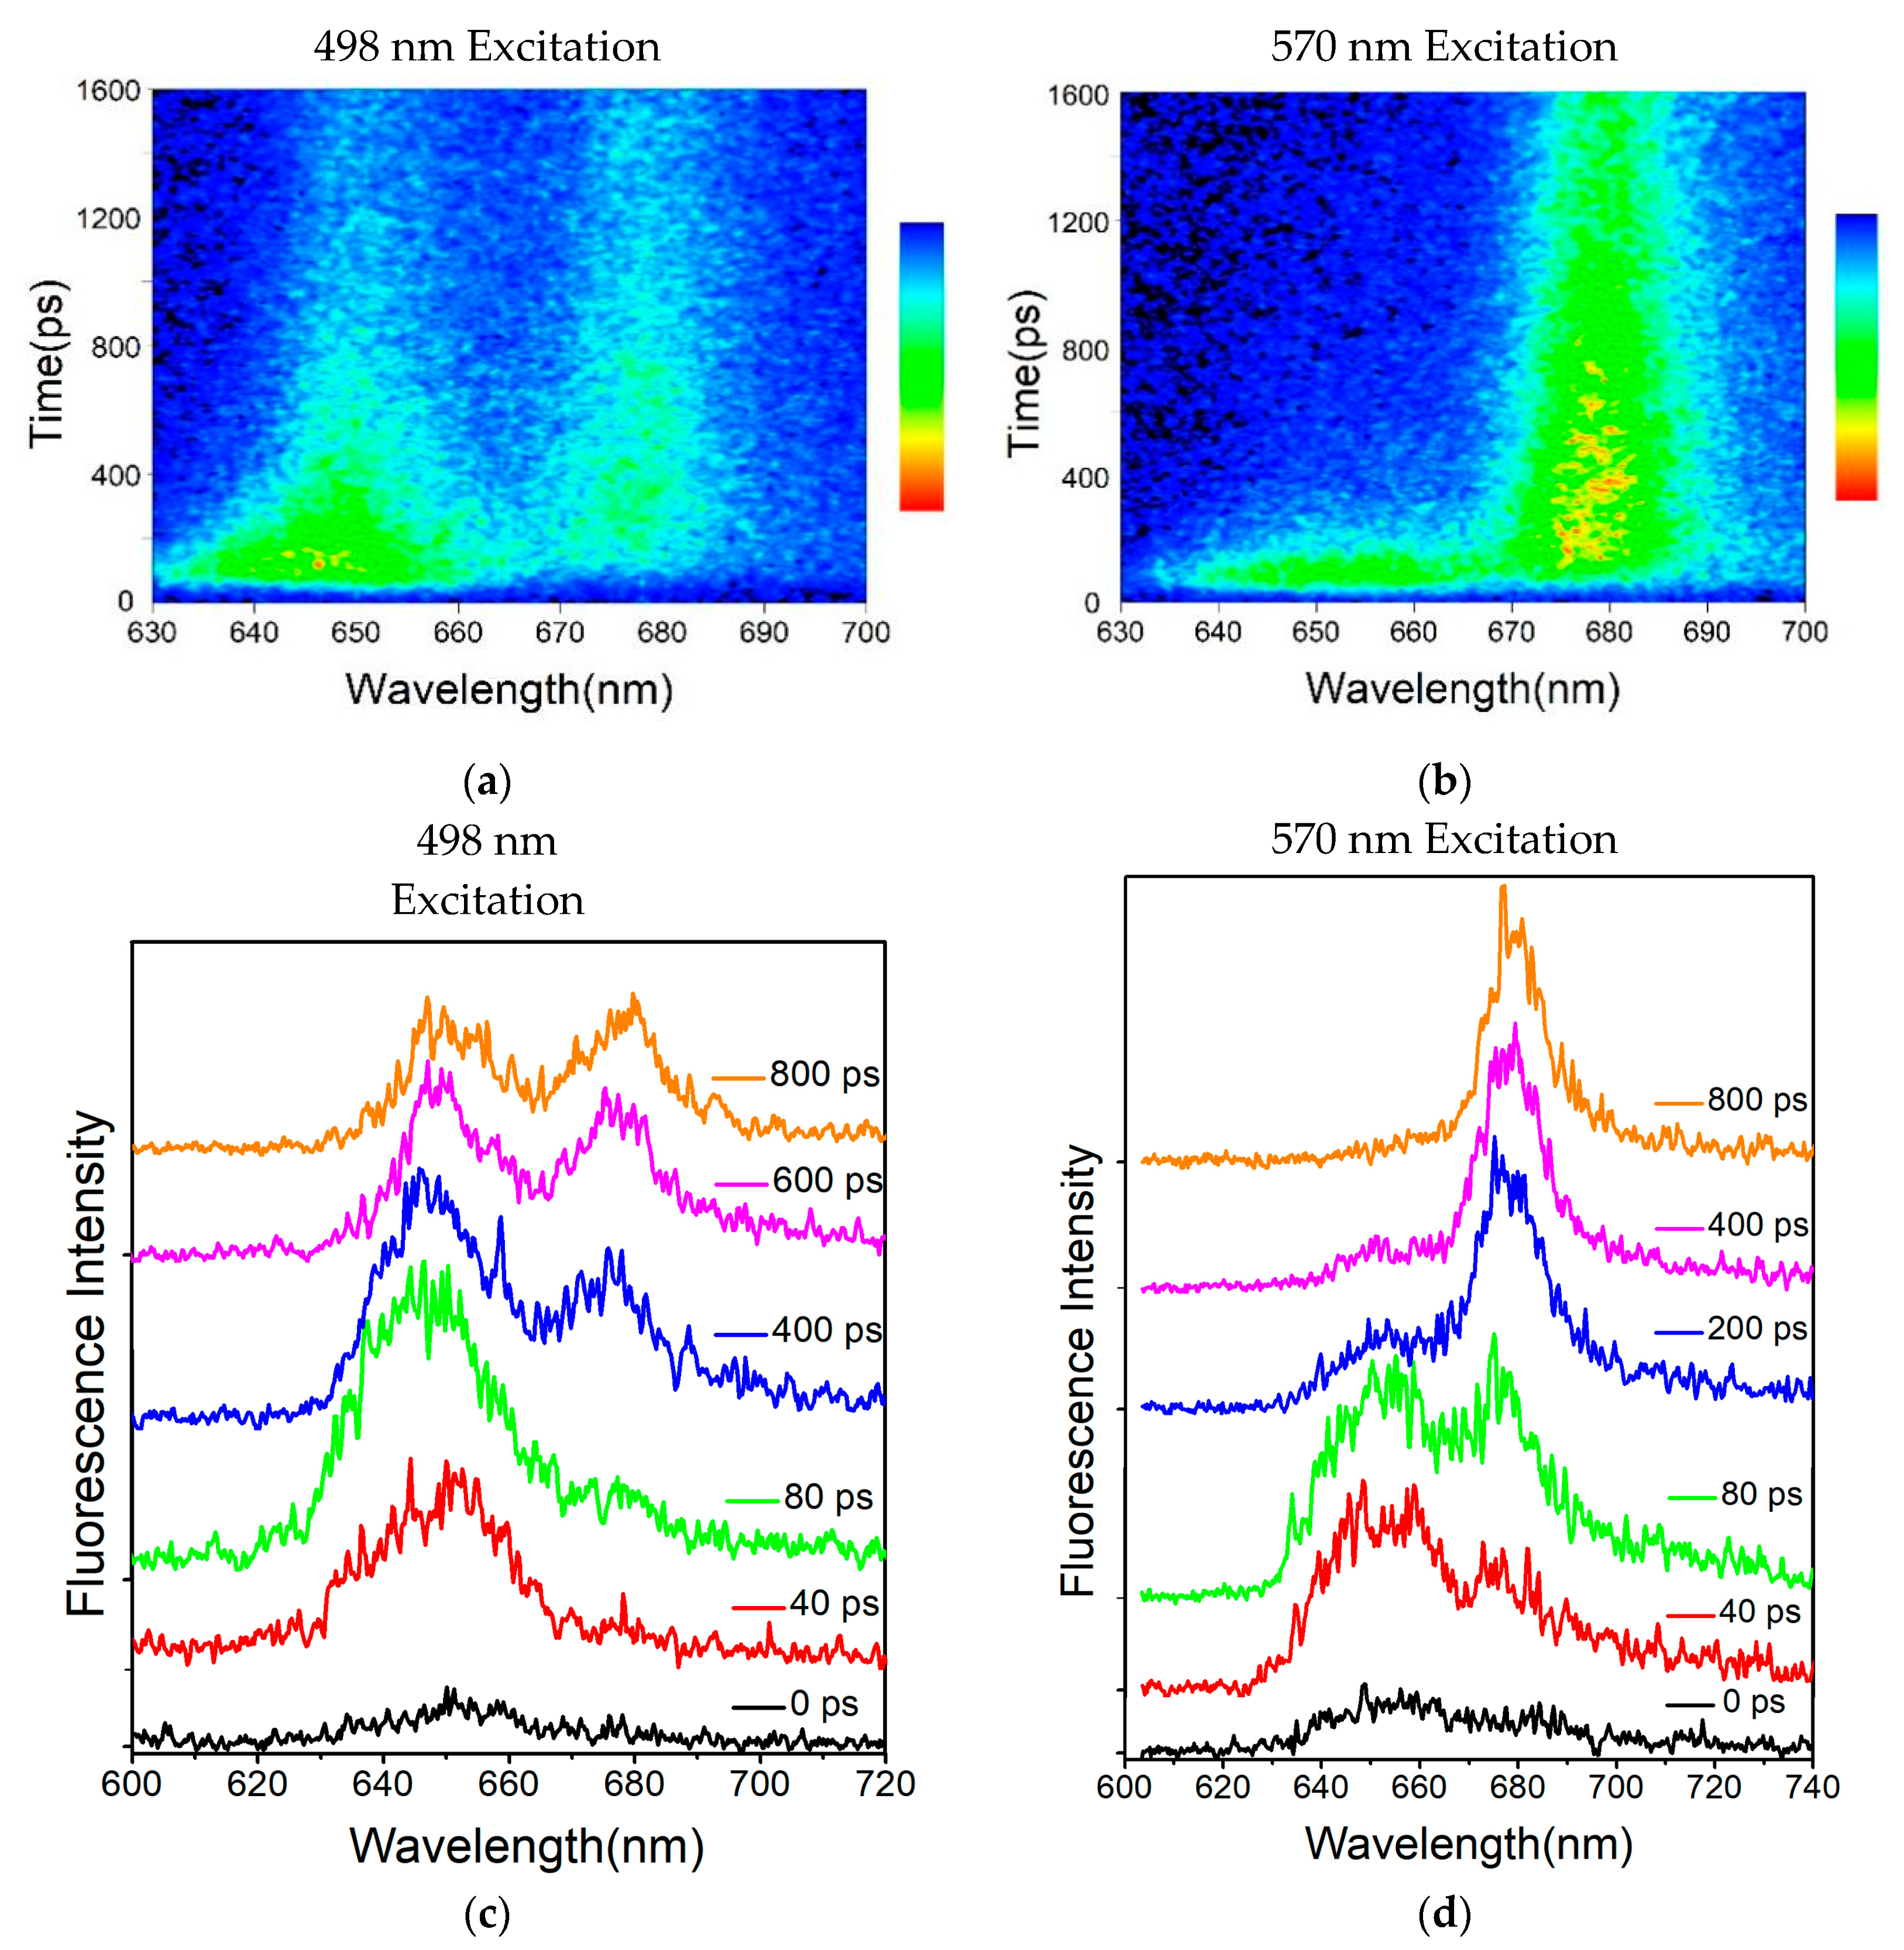
Figure 3a exhibits the reconstructed three-dimensional time-resolved fluorescence spectra of the PBSs from T. 2134 excited at 498 nm. The expression aided us in conceptualizing the energy flow. Following excitation at 498 nm, which preferentially excited the PCBs of β155 in the PC rods [27], the time-resolved fluorescence spectra of the PBSs revealed a PC fluorescence band with a central wavelength of around 655 nm, which was followed immediately by the fluorescence band of the C-cylinder at 645 nm, and the fluorescence band of the APC core at around 675 nm rose concurrently with the decay of the C-cylinder. The immediate evidence for the energy transfer from PC → C-cylinder → APC came from the changes in the relative intensities of the fluorescence components. Different from the results of the 498 nm excitation time-resolved fluorescence spectra, the PC rod and APC core were excited simultaneously under an excitation wavelength of 570 nm. The time-resolved fluorescence spectra results showed that the PC and APC emissions were both discovered at the same time, as shown in Figure 3b.
It is obvious from Figure 3c that there was a large difference among the fluorescence spectra obtained by the synchronscan technology. It is reasonable to assume that the 650 nm emission could be initially clearly identified. In addition, the APC emission appeared at 40 ps after excitation, indicating that the terminal emitter in the core accepted the energy transferred from the PC rod within 40 ps. However, the PC emission quickly decayed and nearly disappeared at 400 ps after the excitation (Figure 3d), indicating that the energy transfer process between PC and APC was completed within 400 ps.
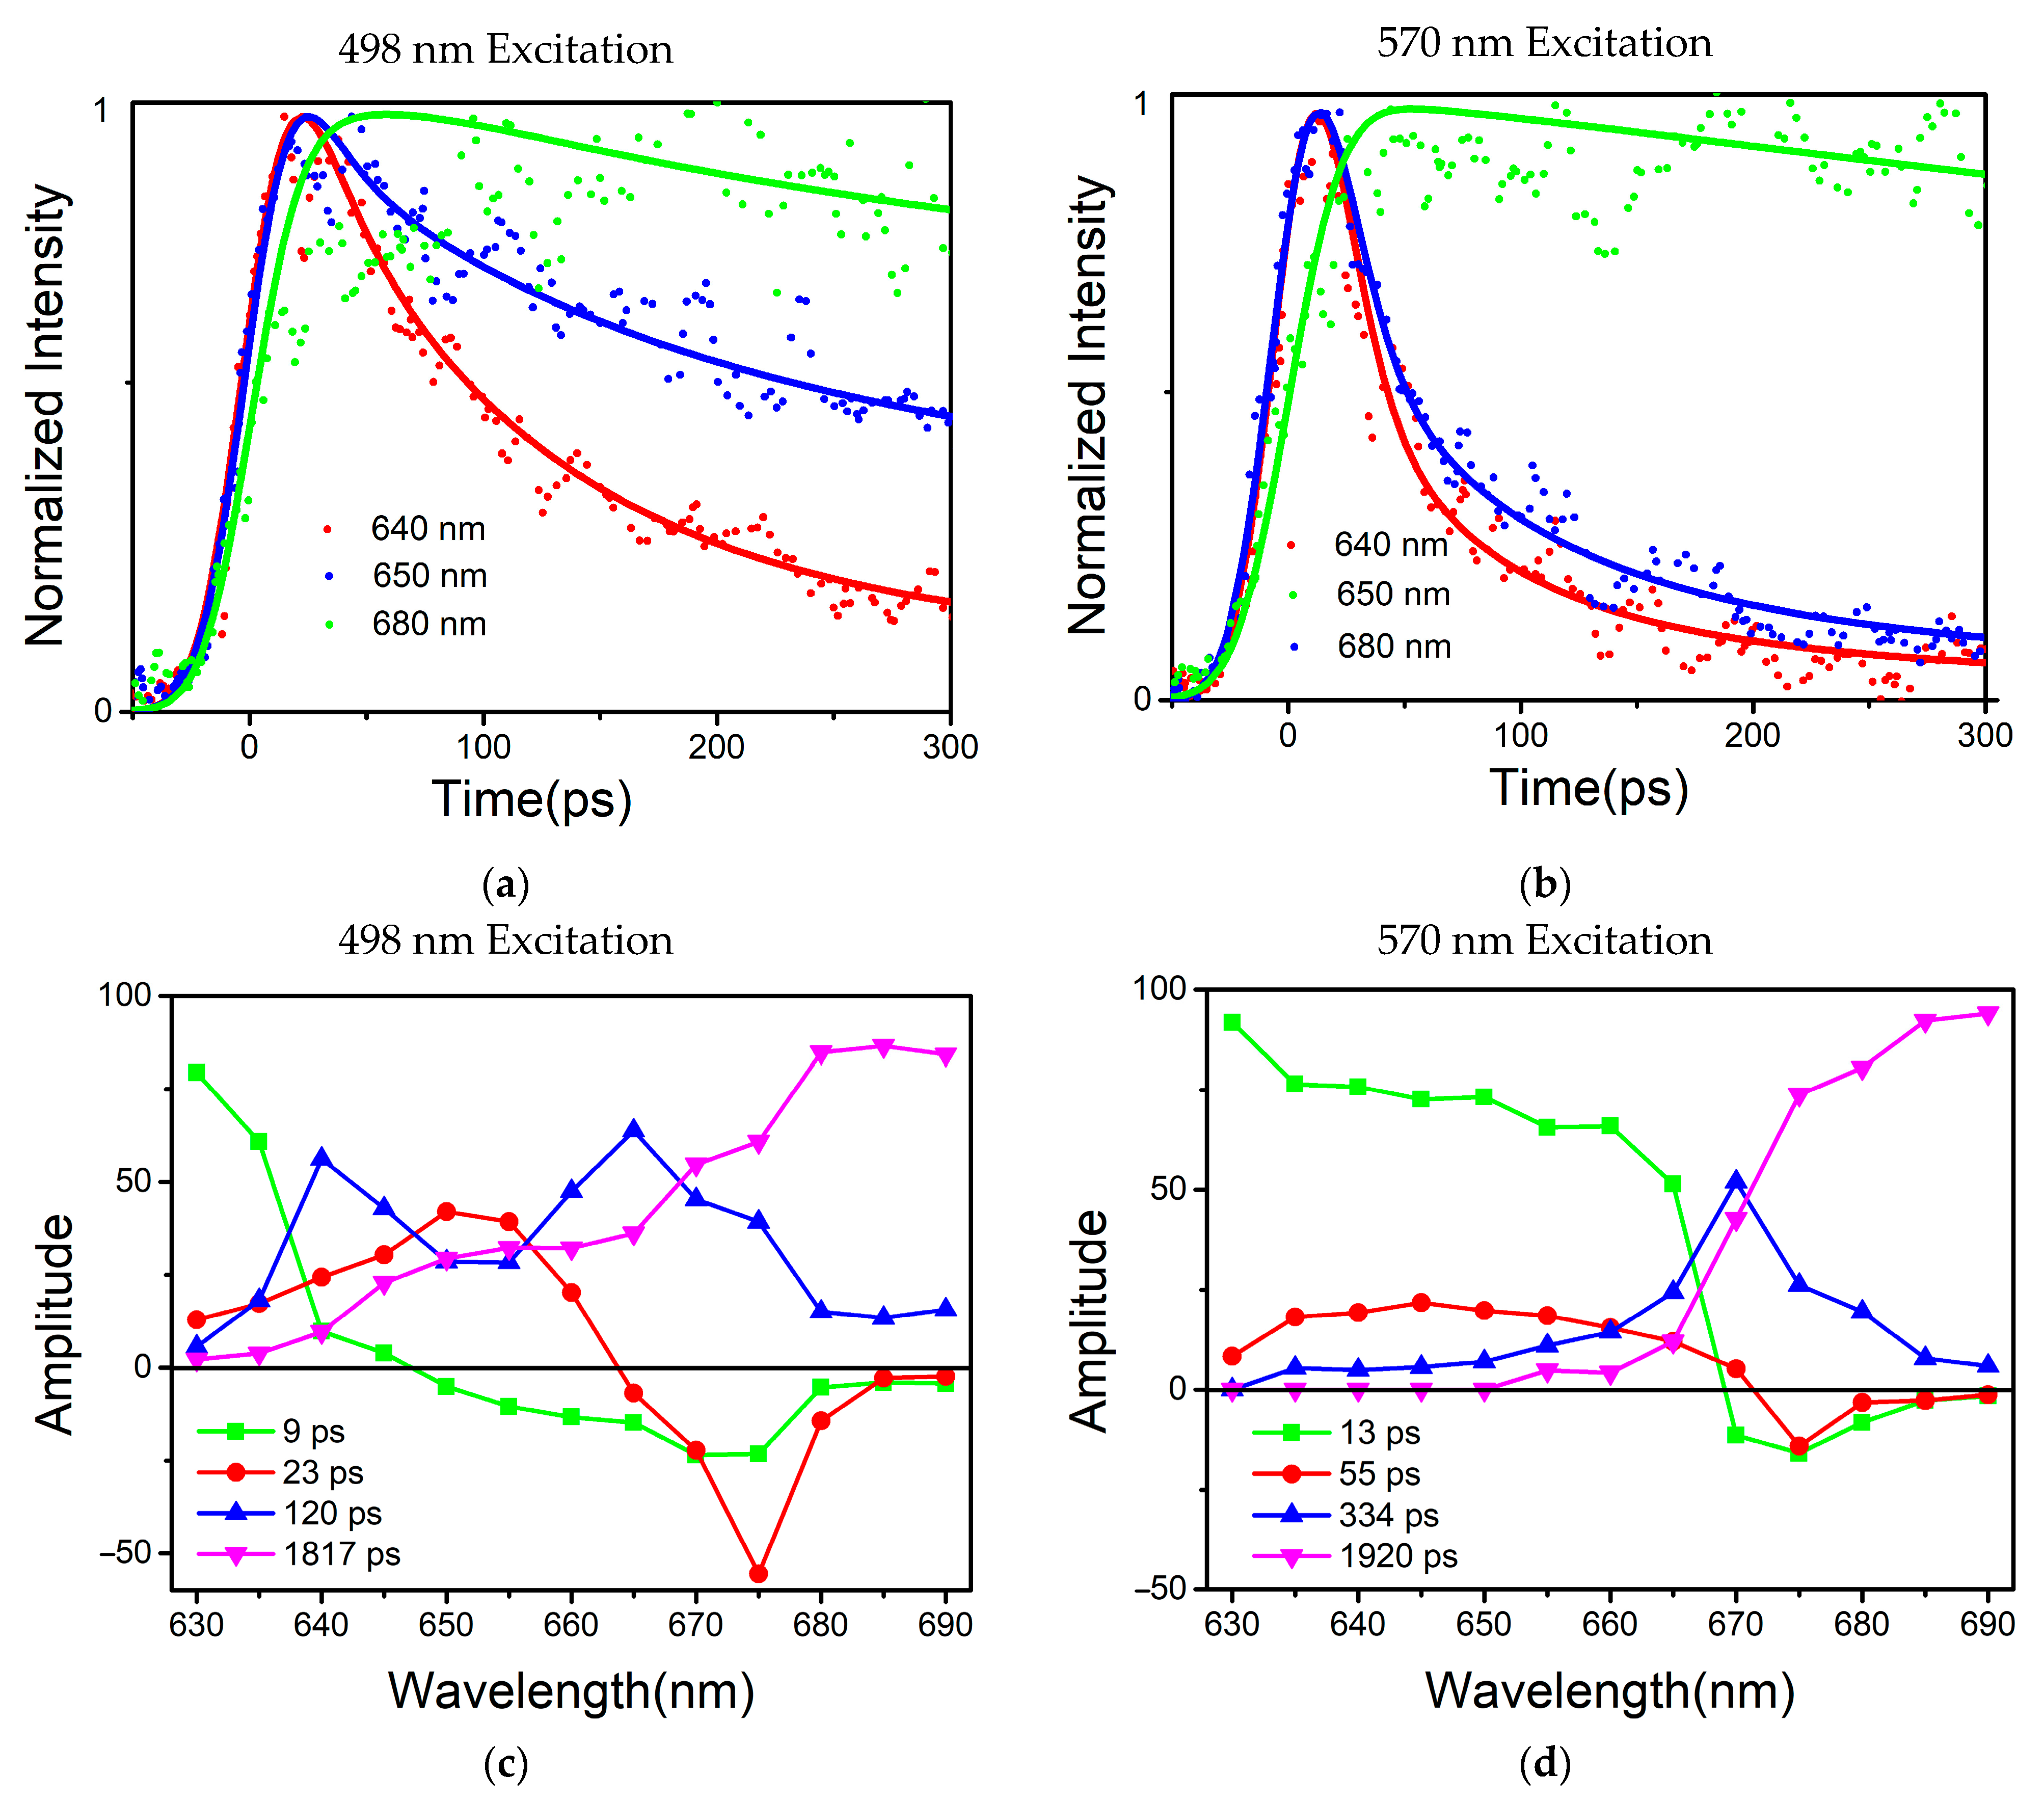
Global optimization deconvolution was used to find out the fluorescence decay constants in the PBSs during energy transferring. Multi-exponential deconvolution was used to resolve the fluorescence decay curves at various measured wavelengths, and the Monte-Carlo approach was used to analyze the experimental data. An energy acceptor is represented by the component (A%) with a negative amplitude of the fluorescence’s rising phase, while an energy donor is represented by the component (A%) with a positive pre-exponential of the fluorescence’s falling phase.
Based on the results of the global multiexponential analysis, Figure 4c,d show the fluorescence-decay-associated spectra (FDAS) obtained by the phycobilisome of T. 2134 under excitation at 498 nm and 570 nm, respectively. In combination with the high-resolution model, the FDAS could further help to reveal the energy transfer in the PBSs. Typically, to explore the decay kinetics of the same decay constant in different wavelength regions, it is necessary to consider the kinetic increase and reduction in the excited component, that is, the change in the amplitude of the kinetic phase. Moreover, if the sign of the FDAS factor with the same decay constant is inverted, this indicates that there was a coupling that occurred between the positive and negative bands, i.e., that there was energy transferred from the complex of the former band that gave energy to the latter band.
From the results, the two excitation wavelengths produced two different sets of decay constants, 10 ps, 20 ps, 120 ps, and 1817 ps for the 498 nm excitation, and 13 ps, 55 ps, 344 ps and 1920 ps for the 570 nm excitation. In the Supplementary Material, the fluorescence decay curves and the correspondent fitting results of the PBSs at different wavelengths are depicted in Figures S1 and S2, and Tables S1 and S2 show the amplitudes of each time component. Among these results, the four rapidly decaying DAS components, 9 ps, 13 ps, 23 ps, and 55 ps, exhibited sign changes from positive to negative, which are indicative of the decay of one fluorescence band in parallel with the rise of another, showing the characteristics of EET. The other four components had positive peaks without sign changes, indicating that their decay only occurred during the trapping or relaxation. In addition, considering the position of the sign shift and the peak in the horizontal direction, the four decay constants were clearly distinguished. The sign change in the 9 ps component appeared between 645 nm and 650 nm, while the sign change in the 13 ps component occurred between 665 nm and 670 nm; similarly, the sign change in# the 23 ps component occurred between 660 nm and 665 nm, and that of the 55 ps component occurred between 665 nm and 670 nm. The positive peaks occurred at decay constants of 120 ps and 334 ps, while the decay constants of 1817 ps and 1920 ps gradually increased with increasing the wavelength. Therefore, combined with the steady-state spectra and structural information, the FDAS results allowed us to assign the following decay constants:
The 9 ps and 13 ps components corresponded to the fastest decay constants, as shown in Figure 4c,d, respectively. The 9 ps component was constant in terms of fluorescence decay in the PBSs of T. 2134 and could be assigned to the time of the energy transfer from the C/C′ cylinders directly to the terminal emitter ApcF/F′ in the A/A′ cylinders of the APC core, owing to the fact that its amplitude began positively on the blue side before swiftly turning negative and having a minimum at 670 nm (as shown in Figure 4c). A negative amplitude corresponds to a fluorescence increase and energy transfer from a donor to an acceptor. Moreover, the latest APC cryo-EM structure showed that there were strongly coupled pigment pairs between the C/C′ cylinders and the A/A′ cylinders, i.e., Cα84Aα84. The transferring of energy from the C/C′ cylinders to the A/A′ cylinders occurring via Cα84Aα84 (35 Å) resulted in a fast energy transfer time of 9 ps [14]. Therefore, the quick transfer of energy between the C/C′-cylinders and the terminal emitter ApcF/F′ was assigned a decay time of 9 ps. The 13 ps constant of the fluorescence decay curve of the PBSs of T. 2134 could be attributed to the process of energy transfer from the rod Rb/Rb′ and the C/C′ cylinders to the terminal emitter ApcE/E′ in the A/A′ cylinders with the same transfer constant, as shown in Figure 4d, from 630 to 660 nm, and its amplitude was positive. It then started to decline at 665 nm, turned negative at 670 nm, and finally reached a minimum at 675 nm. The following is a description of this amplitude variation: An acceptor with an emission peak of 675 nm received energy from a donor with an emission peak between 630 and 660 nm. The light absorbed by the PCBs in the rod Rb/Rb′ was transferred directly to the ApcE/E′ in A/A′ cylinders via a rod–core linker, LRC. At the same time, the light absorbed by the PCBs in the C/C′ cylinders was transferred to the terminal emitter ApcE/E′ in the A/A′ cylinders via a core linker, LC. Thus, combining the fluorescence spectra and the cryo-EM structure of the APC core, it was reasonable to assign a decay time of 13 ps to the energy transfer time from the rod or the C/C′ cylinders or the B cylinder to the terminal emitter ApcE/E′ in the A/A′ cylinders with the same transfer constant.
For the decay constants of the 23 ps and 55 ps components, the experimental results at different excitation wavelengths clearly demonstrated that the terminal received an energy flow that was transferred from the PC rod or C/C′ cylinders after 40 ps. Therefore, the 23 ps constant of fluorescence decay in the PBSs of T. 2134 could be assigned to the energy transfer time from the PC rod Rs/Rs′ → C/C′ cylinders → terminal emitter ApcE/E′ in the A/A′ cylinders because at the blue side, the amplitude of the FDAS was positive with a maximum wavelength of around 650 nm, while at the red side, the amplitude shifted to negative with a minimum at about 675 nm (Figure 4c). Compared with the constants of the 9 ps component, the higher amplitude of the FDAS curve of the constant of the 23 ps component showed that the energy transfer pathway with an energy transfer time of 23 ps began to dominate in the energy transfer from the rods to the core. This agrees with the cryo-EM findings, which showed that the C/C′ cylinder served as a conduit for energy transfer from the PC rods to the terminal emitters. Therefore, combining the fluorescence spectra and the cryo-EM structure of the PC rods and APC core, it was appropriate to provide the energy transfer between the Rs/Rs′ rods and terminal emitter ApcE/E′ a decay time of 23 ps. The 55 ps constant of the fluorescence decay curve in the PBSs of T. 2134 could be attributed to the process of the energy transfer time from the PC rod Rs/Rs′ → the C/C′ cylinders → the B cylinder → the terminal emitter ApcD/D′ in the A/A′ cylinders, which is a long energy transfer pathway from the rod to the terminal emitter. This is because on the blue side, the amplitude of the FDAS was positive with a maximum of 645 nm, while on the red side, the amplitude shifted to negative with a minimum of about 670 nm. Moreover, the amplitude of the 55 ps component was low compared with that of the 13 ps component, indicating this energy transfer pathway was not the main pathway of the energy transfer from the rod to the core. Therefore, combining the fluorescence spectra and the cryo-EM structure of the PC rods and APC core, it was appropriate to give a decay time of 55 ps to the energy transfer from the PC rod Rs/Rs′ → the C/C′ cylinder → the B cylinder → the terminal emitter ApcD/D′ in the A/A′ cylinders.
For the four decay constants without EET, the possible energy transfer paths were assigned according to their peak and the trend of the FDAS factor. The fluorescence isotropic decay constants of 1920 ps and 1817 ps reflected the emission of the terminal emitter ApcE (ApcE′). The 120 ps constant of fluorescence decay possibly reflected the emission of the rods and the C/C′ cylinders because a positive band with two peaks at 640 nm and 665 nm was resolved in the FDAS. Due to the fact that only a positive band with a maximum at 670 nm was determined, the fluorescence decay constants of the 334 ps component may represent the emission of the APC core.

4. Discussion

The energy transfer dynamics of the intact PBSs obtained in this study are summarized in Figure 5. The excitation energy transfer process between the different components was assigned due to the rod-to-core transfer principle based on the results of the global multi-exponential analysis. In Figure 5, different colors correspond to different energy transfer pathways, and arrows indicate the direction of excitation energy transfer. In the absence of a high-resolution protein structure of the T. 2134 rod and core, earlier work has focused on assigning trimers and identifying the timescales of the excitation energy transfer processes in each component. The most definite decay constants are the vibration relaxation time of PCB in the PC monomer (based on the results of a transient absorption experiment, the decay time of the pigment in the PC monomer is less than 1 ps) and the lifetime of the transmitting terminal (greater than 1 ns). However, no clearer proposal has been given for the energy transfer process from the PC rod to the APC core, with timescales ranging from tens to hundreds of picoseconds. Therefore, we referred to the recent T. 2134 cryo-EM model to assign possible energy transfer pathways through the excitation of different components in an intact PBS. The two excitation wavelengths selectively excited different positions in the PBS, leading to significant differences in the time-resolved fluorescence spectra. As mentioned above, the four larger decay constants exhibited clear evidence for unsigned transitions in the FDAS, and their assignment was appropriate when combined with the information provided by the steady-state spectra and that reported in the literature. For the four shorter decay constants, in addition to the time-resolved spectroscopic means, the assignment of energy transfer pathways was combined with protein structure information. Despite the discrepancy with the actual results, the calculation results based on structural information still provided useful suggestions for the assignment of the decay constants. However, more complete structural information and higher time-resolved spectral means are needed for a more accurate excitation energy transfer processes (between the pigments of adjacent proteins and in the case of changes in the protein environment).

5. Conclusions

We investigated the dynamic process of energy transfer in PBSs from cyanobacteria by using femtosecond FRTS and the deconvolution method, which resulted in obtaining the energy transfer pathways and the energy transfer time constants. The energy transfer dynamics were analyzed via simultaneously or sequentially exciting the rod and core, respectively. The results showed that energy was transferred from the PC rods to the terminal emitter through the C-cylinder as an intermediary, with a fast energy transfer rate of less the 10 ps interacting with the A-cylinder. The results of the energy transfer dynamics from the time-resolved PBS spectroscopy combined with biological structural information at high resolution provided insight into the energy transfer mechanism in PBS. More in-depth investigations into the separation between chromophores and how they are arranged will illuminate the energy transfer dynamics more delicately.

Supplementary Materials

The following supporting information can be downloaded at: https://www.mdpi.com/article/10.3390/pr11061656/s1, Figure S1: Fluorescence intensity decay curves and fitting results of PBS from T. 2134 at 77 K on excitation at 498 nm; Figure S2: Fluorescence intensity decay curves and fitting results of PBS from T. 2134 at 77 K on excitation at 570 nm; Table S1: The deconvolution results of T. 2134 on excitation at 498 nm; Table S2: The deconvolution results of T. 2134 on excitation at 570 nm.

Author Contributions

Supervision of the project, M.X. and W.L.; preparation of the samples, W.L. and C.X., steady-state microscopy data collection and analysis, W.L.; time-resolved spectroscopy measurement, C.X. and N.G.; spectroscopy results analysis, Z.L. and Z.H.; writing—original draft preparation, M.X. and C.X.; writing—review and editing, F.Z. and W.L.; funding acquisition, M.X. All authors have read and agreed to the published version of the manuscript.

Funding

This research was funded by the Natural Science Foundation of Shandong Province, grant numbers ZR2021LLZ003, National Natural Science Foundation of China-Russian Science Foundation, grant numbers 42061134020, the Guangdong Provincial Scientific and Technological Program, grant number 2016B090918099, and the Open Fund of the State Key Laboratory of High Field Laser Physics (Shanghai Institute of Optics and Fine Mechanics).

Data Availability Statement

Experimental data are available upon reasonable request to the authors.

Acknowledgments

We thank the staff at the School of Physics, State Key Laboratory of Optoelectronic Materials and Technologies, and Sun Yat-sen University for technical support on the femtosecond laser system and streak camera performance.

Conflicts of Interest

The authors declare no conflict of interest.

References

  1. Sinha, R.P.; Häder, D.P. UV-protectants in cyanobacteria. Plant Sci. 2008, 174, 278–289. [Google Scholar] [CrossRef]
  2. Schopf, J.W. The fossil record of cyanobacteria. In Ecology of Cyanobacteria II: Their Diversity in Space and Time, 1st ed.; Whitton, B.A., Ed.; Springer Science & Business Media: Berlin/Heidelberg, Germany, 2012; Volume 63, pp. 15–36. [Google Scholar]
  3. Vothknecht, U.C.; Westhoff, P. Biogenesis and origin of thylakoid membranes. Biochim. Biophys. Acta Mol. Cell Res. 2001, 1541, 91–101. [Google Scholar] [CrossRef] [PubMed]
  4. Croce, R.; van Amerongen, H. Natural strategies for photosynthetic light harvesting. Nat. Chem. Biol. 2014, 10, 492–501. [Google Scholar] [CrossRef] [PubMed]
  5. Glazer, A.N. Light harvesting by phycobilisomes. Annu. Rev. Biophys. Biophys. Chem. 1985, 14, 47–77. [Google Scholar] [CrossRef]
  6. Duysens, L. Transfer of light energy within the pigment systems present in photosynthesizing cells. Nature 1951, 168, 548–550. [Google Scholar] [CrossRef]
  7. Xie, M.; Li, W.; Lin, H.; Wang, X.; Dong, J.; Qin, S.; Zhao, F. Diference in light use strategy in red alga between Grifthsia pacifca and Porphyridium purpureum. Sci. Rep. 2021, 11, 14367. [Google Scholar] [CrossRef]
  8. Watanabe, M.; Ikeuchi, M. Phycobilisome: Architecture of a light-harvesting supercomplex. Photosynth. Res. 2013, 116, 265–276. [Google Scholar] [CrossRef]
  9. Saer, R.G.; Blankenship, R.E. Light harvesting in phototrophic bacteria: Structure and function. Biochem. J. 2017, 474, 2107–2131. [Google Scholar] [CrossRef]
  10. Mullineaux, C.W. Phycobilisome-reaction centre interaction in cyanobacteria. Photosynth. Res. 2008, 95, 175–182. [Google Scholar] [CrossRef]
  11. Zhang, J.; Ma, J.; Liu, D.; Qin, S.; Sun, S.; Zhao, J.; Sui, S. Structure of phycobilisome from the red alga Grifthsia pacifca. Nature 2017, 551, 57–63. [Google Scholar] [CrossRef]
  12. Ma, J.; You, X.; Sun, S.; Wang, X.; Qin, S.; Sui, S. Structural basis of energy transfer in Porphyridium purpureum phycobilisome. Nature 2020, 579, 146–151. [Google Scholar] [CrossRef] [PubMed]
  13. Zheng, L.; Zheng, Z.; Li, X.; Wang, G.; Zhang, K.; Wei, P.; Zhao, J.; Gao, N. Structural insight into the mechanism of energy transfer in cyanobacterial phycobilisomes. Nat. Commun. 2021, 12, 5497. [Google Scholar] [CrossRef] [PubMed]
  14. Kawakami, K.; Hamaguchi, T.; Hirose, Y.; Kosumi, D.; Miyata, M.; Kamiya, N.; Yonekura, K. Core and rod structures of a thermophilic cyanobacterial light-harvesting phycobilisome. Nat. Commun. 2022, 13, 3389. [Google Scholar] [CrossRef] [PubMed]
  15. Adir, N.; Lerner, N. The crystal structure of a novel unmethylated form of c-phycocyanin, a possible connector between cores and rods in phycobilisomes. J. Biol. Chem. 2003, 278, 25926–25932. [Google Scholar] [CrossRef]
  16. Nganou, C.; David, L.; Adir, N.; Mkandawire, M. Linker Proteins Enable Ultrafast Excitation Energy Transfer in the Phycobilisome Antenna System of Thermosynechococcus vulcanus. Photochem. Photobiol. Sci. 2016, 15, 31–44. [Google Scholar] [CrossRef]
  17. Hirota, Y.; Serikawa, H.; Kawakami, K.; Ueno, M.; Kamiya, N.; Kosumi, D. Ultrafast energy transfer dynamics of phycobilisome from Thermosynechococcus vulcanus, as revealed by ps fluorescence and fs pump-probe spectroscopies. Photosynth. Res. 2021, 148, 181–190. [Google Scholar] [CrossRef]
  18. Kawakami, K.; Nagao, R.; Tahara, Y.O.; Hamaguchi, T.; Suzuki, T.; Dohmae, N.; Kosumi, D.; Shen, J.; Miyata, M.; Yonekura, K.; et al. Structural implications for a phycobilisome complex from the thermophilic cyanobacterium Thermosynechococcus vulcanus. Biochim. Biophys. Acta Bioenerg. 2021, 1862, 148458. [Google Scholar] [CrossRef]
  19. Adir, N.; Dines, M.; Klartag, M.; McGregor, A.; Melamed-Frank, M. Assembly and Disassembly of Phycobilisomes. In Complex Intracellular Structures in Prokaryotes—Microbiology Monographs, 1st ed.; Shively, J.M., Ed.; Springer Science & Business Media: Berlin/Heidelberg, Germany, 2006; Volume 2, pp. 47–77. [Google Scholar]
  20. Gantt, E.; Lipschul, C.A. Phycobilisomes of Porphyridium cruentum: I. Isolation. J. Cell Biol. 1972, 54, 313–324. [Google Scholar] [CrossRef]
  21. Ducret, A.; Sidler, W.; Wehrli, E.; Frank, G.; Zuber, H. Isolation, Characterization and Electron Microscopy Analysis of a Hemidiscoidal Phycobilisome Type from the Cyanobacterium Anabaena sp. PCC 7120. Eur. J. Biochem. 1996, 236, 1010–1024. [Google Scholar] [CrossRef]
  22. Wang, H.; Zhao, J.; Jiang, L. Energy transfer processes in phycobilisome model complex at 77 K. China Ser. B Chem. 2000, 43, 233–239. [Google Scholar] [CrossRef]
  23. Zhao, F.; Zheng, X.; Zhang, J.; Wang, H.; Yu, Z.; Zhao, J.; Jiang, L. Energy transfer in allophycocyanin hexamer from Anabaena variabilis by time-resolved spectroscopy. J. Photochem. Photobiol. B 1998, 45, 144–149. [Google Scholar] [CrossRef]
  24. Sandstrom, A.; Gillbro, T.; Sandstrom, U.; Fischer, R.; Scheer, H. Picosecond study of energy transfer within 18-S particles of AN112 (a mutant of Synechococcus 6301) phycobilisomes. Biochim. Biophys. Acta Bioenerg. 1988, 933, 54–64. [Google Scholar] [CrossRef]
  25. Zhang, J.; Zhao, F.; Zheng, X.; Wang, H. Direct measurement of excitation transfer dynamics between two trimers in C-phycocyanin hexamer from cyanobacterium Anabaena variabilis. Chem. Phys. Lett. 1999, 304, 357–364. [Google Scholar] [CrossRef]
  26. Xie, M.; Li, W.; Xiao, C.; Zhen, Z.; Ma, J.; Lin, H.; Qin, S.; Zhao, F. Time-Resolved Fluorescence Spectroscopy Study of Energy Transfer Dynamics in Phycobilisomes from Cyanobacteria Thermosynechococcus vulcanus NIES 2134 and Synechocystis sp. PCC 6803. Crystals 2021, 11, 1233. [Google Scholar] [CrossRef]
  27. Eisenberg, I.; Caycedo-Soler, F.; Harris, D.; Yochelis, S.; Huelga, S.F.; Plenio, M.B.; Adir, N.; Keren, N.; Paltiel, Y. Regulating the Energy Flow in a Cyanobacterial Light-Harvesting Antenna Complex. J. Phys. Chem. B 2017, 121, 1240–1247. [Google Scholar] [CrossRef]
  28. Zhao, F.; Zhang, J.; Zheng, X.; Wang, H. Energy transfer among proteins in the phycobilisome of red algae. II. Energy transfer in synthesized complex of R-PE/R-PC and R-PE/APC. Zhongshan Da Xue Xue Bao. Zi Ran Ke Xue Ban Acta Sci. Nat. Univ. Sunyatseni 1998, 37, 18–23. [Google Scholar]
Figure 1. Architecture diagram of the PBS from T. 2134. This overall PBS model was drawn referencing the PBS structures from Anabaena and Thermosynechococcus vulcanus [13,14].
Processes 11 01656 g001
Figure 2. Experimental setup for time-resolved spectra measurement. 1: Ti: sapphire amplifier; 2: beam splitter; 3, 4, 5, 7, 10, 13, 14, and 21: mirrors; 6: OPA; 8: aperture; 9: beam lifter; 11: neutral filter; 12: attenuator; 15, 17, and 18: lenses; 16: cryostat and cuvette; 19: high-pass filter; 20: streak camera; 22: synchronous trigger; 23: polychromator.
Processes 11 01656 g002
Figure 3. (a) Time-resolved fluorescence spectra of PBSs of T. 2134 at 77 K with the excitation wavelength set to 498 nm. (b) Time-resolved fluorescence spectra of PBSs of T. 2134 at 77 K, with the excitation wavelength set to 570 nm. The fluorescence intensity is depicted as a gradient, with blue denoting low intensity and red denoting high intensity. (c) Time-resolved fluorescence spectra of PBSs of T. 2134 detected at different times after stimulation, with the excitation wavelength set to 498 nm. (d) Time-resolved fluorescence spectra of PBSs of T. 2134 detected at different times after stimulation, with the excitation wavelength set to 570 nm. The picoseconds after stimulation are shown by the numbers.
Processes 11 01656 g003
Figure 4. (a) Normalized fluorescence intensity decay curves of PBSs of T. 2134, with the excitation wavelength set to 498 nm. (b) Normalized fluorescence intensity decay curves of PBSs of T. 2134, with the excitation wavelength set to 570 nm. Detection was carried out at 640 nm, 650 nm, and 680 nm, respectively. Dots represent the experimental data, and lines represent the fitting results. (c) FDAS of PBSs of T. 2134, with the excitation wavelength set to 498 nm. (d) FDAS of PBSs of P. purpureum, with the excitation wavelength set to 570 nm.
Processes 11 01656 g004
Figure 5. A schematic excitation energy transfer model of the PBS from T. 2134.
Processes 11 01656 g005
Disclaimer/Publisher’s Note: The statements, opinions and data contained in all publications are solely those of the individual author(s) and contributor(s) and not of MDPI and/or the editor(s). MDPI and/or the editor(s) disclaim responsibility for any injury to people or property resulting from any ideas, methods, instructions or products referred to in the content.

