Abstract
The objective of the study is to investigate the thermal, electrical, and exergetic performance of a hybrid photovoltaic–thermal (PVT) system under the influence of copper oxide (CuO) nanofluid and phase change material (Vaseline (petroleum jelly)) as a heat storage medium. A mathematical model was developed with the help of various energy-balance equations over the layers of the hybrid system. The performance evaluation of the PVT system was performed using pure water, CuO-water nanofluid (0.2 and 0.4% weight fractions), and CuO-water nanofluid 0.4% weight fraction with Vaseline as a phase change material. The results of the overall analysis show that the performance of the PVT system is better using CuO-water nanofluid (0.4% wt. fraction) with PCM as compared to the water-cooled PVT system and CuO-water nanofluid. The results obtained from the study show indicate that the cell temperature of PVT was reduced by 4.45% using nanofluid cooling with PCM compared to a water-cooled PVT system. Moreover, the thermal, electrical, and overall efficiencies improved by 6.9%, 4.85%, and 7.24%, respectively, using 0.4% wt. fraction of CuO-water nanofluid with PCM as compared to PVT water-cooled systems. The performance of the PVT system was also investigated by changing the mass flow rate (MFR). The increase in mass flow rate (MFR) from 0.05 kg/s to 0.2 kg/s tends to enhance the electrical and overall efficiencies from 12.89% to 16.32% and 67.67% to 76.34%, respectively, using 0.4% wt. fraction of CuO-PCM as fluid.
1. Introduction
In the present day, due to the growing population, industrialization, and climate change problems, the demand for clean energy is increasing at a very fast pace. The shortage of energy can be a major constraint in the development activities and economic growth of any country. All these concerns lead to the usage of renewable energy sources, mainly solar energy due to its abundant availability, easily accessible nature, and cost-effectiveness. Solar photovoltaic (PV) panels and solar thermal collectors are considered to convert incoming solar energy into high-grade electrical energy and low-grade thermal energy, respectively [1]. Solar PV arrays are used to extract electrical power from solar irradiance. Unfortunately, due to the low efficiency of the PV panels, only 9–18% of the incoming radiation is transformed into electric energy, and the remaining solar insolation is reflected into the surroundings in the form of thermal or heat energy. This causes the PV module temperature to increase because of excessive surrounding heat that leads to a decrease in the electrical efficiency (ɳel) [2]. Hence, to improve the ɳel of the PV module, this excessive heat energy is needed to be extricated.
The excess heating effect upon the PV modules can be removed by integrating thermal absorbers that effectively work as heat extraction component and prevent overheating. The resulting combined/integrated system is also known as a photovoltaic–thermal (PVT) system [3]. These PVT systems are hybrid systems where electrical energy is generated by the PV modules from the incoming solar irradiation, and heat/thermal energy is produced by the thermal collector by the circulation of some coolant around the PV panels. Therefore, the hybrid PVT system is capable of generating both electrical and thermal energy. Primarily, the PVT collectors are classified on the basis of fluid flow; for example, PVT systems are classified as PVT air collectors or PVT water collectors when air or water is used as a coolant.
In the existing literature, several types of research works have examined PVT collector performance using numerical–experimental studies. The theoretical analysis and thermal modeling of a dual-channel hybrid PVT (DCPVT) air collector can be investigated for cold climatic conditions. The performance of the DCPVT air collector is compared with that of the single-channel PVT (SCPVT) air collector [4]. In another study [5], an attempt has been made to develop the thermal modeling and optimization of the parameters of a PVT air collector to improve the efficiency of the PVT air collector. In order to improve the performance of the PVT system, several studies have been conducted by including air as cooling fluid (e.g, SCPVT and DCPVT air collectors) [6,7,8,9], applied in the form of fins [6,7], as well as striking jets [10]. The experiments performed in [11] suggest that in the DCPVT, the fluid flow mechanism reduces the PV array temperature more effectively than in the SCPVT system. Therefore, it can be said that the DCPVT system has better ɳel than the SCPVT air collector.
Thereafter, several kinds of research were carried out by applying water as the cooling fluid for the PVT systems, and it was found that the working of the integrated PVT–H2O (PVT-w) is highly improved when compared with the air-cooled type PVT systems [12,13,14]. Another benefit of the PVT-w system is that it can provide domestic hot water (DHW) that saves some energy along with enhanced ɳel. Reference [15] reports that these PVT-w systems are capable of fulfilling about 50% of the electricity needs of London (UK) as well as facilitating 35–40% of the DHW requirements according to the prevailing climate.
By using these traditional cooling fluids (air or water), even though the efficacy of the PVT system is enhanced, it is of not much significance as the percentage of improvement is still quite low due to the poor thermal conductivity and low heat extraction capabilities of these coolants. Now, cooling fluids including certain nanoparticles, known as nanofluids, can present enhanced thermophysical characteristics compared to the traditional fluid. These nanofluids are a special category of fluids that are obtained by dispersing metal oxide (MO) particles into a base fluid such as H2O or ethylene glycol. Hence, the heat extraction capabilities of the nanofluids are much greater than those of the base cooling fluids. Various parameters or thermophysical properties of nanofluids such as the thermal conductivity (λ), heat transfer coefficient, and density (ρ) depend upon or are a function of the nanoparticles’ physical characteristics such as temperature, dimensions, vol%, and sonication time [16]. Hence, nanofluids are considered highly essential for heat transfer applications where the efficiency of the overall system can be significantly increased by improving the heat extraction rate, especially in PVT systems.
In this regard, the effect of increasing the volume concentration of different nanoparticles in the base fluid (water) was investigated, and the outcomes show that only a 2% value of ϕ for Cu nanoparticles in base fluid results in a significant performance enhancement with respect to the electrical and thermal operation of a PVT system [17]. Thereafter, the impact of the MFR of the silica-water nanofluid as a coolant in the PVT collector was investigated experimentally [18]. The results show that a fractional increase in nanoparticle weight concentration (wt%) just by 1% to 3% can significantly improve the ɳel. It is observed that there is an improvement of 3.6% and 7.9% respectively for 1% and 3% (wt%) of nanofluids in the overall performance of a PVT system as compared to a water-cooled PVT system. The impact of MWCNT-water nanofluid on a PVT system was investigated numerically [19]. The performance of a PVT system is investigated using pure water, Ag-water nanofluid, and alumina-water nanofluid as coolants. The outcomes of the simulation were also compared with the experimental results for the validation of the developed mathematical model [20].
Reference [21] presents the application of several nanofluids, viz., Al2O3/water, ZnO/water, and TiO2/water, as both sheet- and tube-based PVT collectors by carrying out numerical–experimental analysis for finding the performance of the PVT system. The observations from these studies reveal that when the base fluid (water) is mixed with ZnO and TiO2 nanoparticles, the electrical efficiency ɳel of the hybrid PVT system is highly enhanced. Furthermore, this analysis also highlights that the use of nanofluid comprising Al2O3 and H2O shows better thermal efficiency (ɳT) when compared to the other two nanofluids.
On a similar note, [22] presents the results of testing carried out upon installed PVT systems at three different places, i.e., Lyon (France), Mashhad (Iran), and Monastir (Tunisia), for the sheet- and tube-based PVT systems. Here, the nanoparticles used were Al2O3 and Cu and were mixed with the base fluids such as water and ethylene glycol for evaluating the effectiveness of the PVT collector. The outcomes of the experimentations suggest that the PVT system incorporating nanofluid as coolant performs better as compared to conventional PVT systems. Thereafter, [23] presented the results of tests performed with a different set of nanoparticles, viz., TiO2, SiO2, and SiC, having water as the base fluid, on the performance of serpentine tube-based PVT systems. The observation from the investigation shows that the outcomes of SiO2-H2O-based nanofluids are more comprehensive than those of other nanofluids considered in the study.
The work in [24] presents the use of Al2O3-H2O nanofluid as a coolant for testing the single rectangular channel type PVT system. The outcome shows there is improvement in both electrical efficiency (ɳel) and the gross or the overall efficiency (ɳo) of the proposed PVT system; however, its thermal efficiency (ɳT) is not altered by any substantial value. As the concentration of nanofluid increases, the PV module temperature decreases, which leads to significant enhancement of ɳel [25]. A three-dimensional numerical-based study was conducted by using COMSOL Multi-physics software considering the impact of pure water and multi-walled carbon nanotube (MWCNTs) mixed with water as a coolant on a hybrid PVT collector. Then the numerical data obtained from the results were compared with the data found from experiments. The outcome shows that the ɳT is improved significantly using MWCNT-water nanofluid as compared to the water-cooling case [26]. The effectiveness of the PVT system is examined using a Ag-water nanofluid, and the outcomes obtained are compared with the water-cooled PVT system. The observations suggest that the hybrid PVT system with Ag-water nanofluid has a more powerful extraction capability and improved efficiency compared to water-cooling and conventional PV systems [27]. The mathematical modeling of a nanofluid-based PVT system, as well as the nano-phase change material(PCM)-based hybrid PVT systems, is proposed. The results from the studies of the mathematical models are compared to the results obtained from experimentation [28]. The ɳel values of the mathematical modeling and experiment results are 13.2% and 13.7%, respectively. Similarly, ɳT values under the two said analyses are 71.3% and 72%, respectively. This shows there exists a strong correlation between the simulation-based results and experimentation. In [29], the heat transfer performance of a heat sink was evaluated using a high-thermal-conductivity (λ) low-melting-point PCM with fins in the lower channel. The outcome of the study shows that the temperature of the heat sink decreases in presence of fins with PCM. The thermal characteristics of the heat sink were investigated with solid gallium as a PCM [30]. In another work [31], a numerical study was carried out on a heat sink based on a triply periodic minimal surface (TMPS) structure incorporated with PCM for cooling in power electronics circuits. The effective λ was calculated for TMPS-PCM using steady-state analysis [32]. The impact of Al2O3-water and pure water as coolant in a hybrid PVT collector was determined experimentally [33]. The outcome suggests that the Al2O3 water-based nanofluid enhances the overall performance of the PVT system by improving its thermal characteristics as compared to pure water. However, the PVT system with a cooling arrangement above the PV module causes a reduction in the ɳel due to the significant absorption of the incoming visible solar irradiance [34,35].
The above discussion on the application of nanofluid as a coolant indicates that it can produce high-quality material characteristics in comparison to water- and air-based fluids. This property of nanofluid assists in lowering the PV module temperature to a greater extent and thereby enhances the overall performance of the system.
To the best of the authors’ knowledge, only a few works in the literature have examined the effect of increasing the weight fraction concentration of nanofluid with PCM and MFR on the operation of hybrid PVT collectors. In the given study, the effectiveness of the PVT system is analyzed using pure water, CuO-H2O nanofluid (0.2 and 0.4% weight fractions), and CuO-H2O nanofluid 0.4% wt. fraction with Vaseline as a phase change material (PCM). The use of a PCM helps in improving the electrical performance of the PVT system by controlling the temperature. The thermal modeling of the PVT system with nanofluid as coolant is developed considering the heat transfer mechanism over each layer of the PVT system.
2. PVT System Description and Working Nanofluid
It is well known that a typical PVT system is proficient in effectively producing electrical as well as thermal energy together. In the PVT system, the thermal energy circulates through the various layers of the PVT system using radiation, convection, and conduction phenomena as shown in Figure 1. Heat is transferred through radiation without any physical contact. Electromagnetic waves are a type of radiation that is produced by all physical bodies. When these radiation waves strike a body, they are absorbed by the body, reflected by other surfaces, or transmitted. In the phenomenon incorporating the convection principle, energy moves from a higher temperature level to a lower temperature level within a fluid during the convection process. In contrast, external physical movement or motion is required for the nanofluid circulation in forced convection. A few examples of forced convection are pumps or the wind, in which natural convection may occur as a result of changes in densities. Due to molecular collision, heat transfer through conduction occurs inside solid materials or at the interface between two layers.
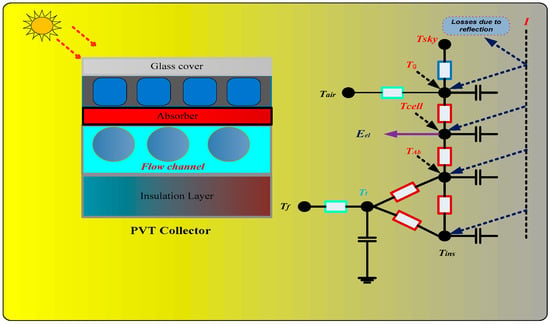
Figure 1.
Heat transfer mechanism across the layers of the PVT system [17].
As shown in Figure 1, the upper glass surface receives direct and indirect solar radiation. The incident solar radiation (I) is split into three parts: that which is reflected back, that which is absorbed, and that which is transferred to the solar cell. In Figure 1, the Tg. Tcell, Tair, TAb, and Tf denote the temperature of the glass, solar cell, air, absorber, and fluid, respectively. Throughout each layer of the PVT system, the processes of radiation, conduction, and convection take place. In line with the PVT system’s heat transfer mechanism, a numerical model was created. While formulating the mathematical model, the following assumptions have been considered:
- (1)
- Any influence of dirt particles or restricted sunlight on the PVT system is ignored during the investigation.
- (2)
- The variations in solar insolation, ambient temperatures, and wind speeds (i.e., less than 10 min) are ignored.
- (3)
- Any existence of thermal resistance between the PVT system layers is ignored.
- (4)
- The λ is assumed to be constant across the layers of the PVT system during the course of the investigation.
- (5)
- The losses associated with the light striking on the PVT surface (optical losses) from the PVT module surface are ignored. In the overall analysis, a unity transmittance absorbance coefficient (τα) is considered.
2.1. Mathematical Modeling
A portion of the solar radiation that strikes the glass layer above the photovoltaic module is reflected back into the atmosphere, while the remainder is absorbed by the module with the help of heat transfer [35].
where I denotes the intensity of sunlight, h denotes the heat transfer coefficients, and vw denotes the wind velocity. As depicted in Figure 1, the solar PV absorbs the portion of sunlight from the glass cover fixed above the PV module. The PV module converts the majority of the energy it receives into electricity, with the absorber and tube assembly absorbing the remaining energy [35].
Figure 1 shows a thermal circuit model of a typical PV module. This comprises the convective and radiated transfer coefficients of heat with respect to the PV layer and the other layers of the hybrid PVT system.
It has been shown that heat absorbed by the thermal absorber below the PV module is exchanged with tube assembly in the coolant channel and the insulation layer. The thermal balance equation for the absorber and tube assembly is represented as follows:
The heat exchange takes place between the heat energy from the absorber below the PV module and the fluid. The equation explaining the above phenomenon is represented in [35].
In the above equation, mf is the mass flow rate of fluid circulating through the channel; cp is the specific heat capacity of the fluid. The thermal performance of a PVT system is largely affected by the temperature attained by the fluid circulating in the coolant tubes. The equation for fluid at the channel outlet is shown as follows:
Equation (7) represents the average temperature attained by the nanofluid flowing in the coolant tubes. A and B are constants and are used to solve the above equation. Their values are calculated as per Equations (8) and (9).
As represented in the thermal circuit model in Figure 1, the heat exchange that takes place in the insulation layer associates the absorber, tube assembly, and ambiance via the convective heat transfer phenomenon [36].
2.2. Heat Transfer Coefficients (HTCs)
According to the thermal circuit model, the heat transfer coefficients (HTCs) are crucial parameters while formulating the energy-balance equation (EBE) over every layer of the PVT system. HTCs must exist across each layer of the PVT collector. An HTC is the proportionality constant between the driving force and the heat flux for heat flow. The HTCs signify the area over which the transfer of heat takes place. The overall heat transfer coefficient (U) represents the overall capacity of the series of conductive and convective barriers to transfer heat. Table 1 represents the expression for the heat transfer coefficient across each of the layers (e.g., the glass cover, PV module, absorber, tube assembly, and insulation layer) of the PVT system.


Table 1.
Expressions for heat transfer coefficients (HTCs) [35].
Table 1.
Expressions for heat transfer coefficients (HTCs) [35].
| PVT System Layer | Heat Transfer Coefficient (HTC) |
|---|---|
| PV module—upper glass cover | |
| PV module—thermal absorber | |
| PV module—tube assembly | |
| Thermal absorber—tube assembly | |
| Thermal absorber—insulation layer | |
| Tube assembly—insulation layer | |
| Tube assembly—coolant | |
| Insulation layer—air |
2.3. PVT System Efficiency
A PVT system is capable of generating electrical energy along with thermal energy (heat) simultaneously. Therefore, the operating performance of the PVT system is investigated in terms of electrical efficiency (ɳel), thermal efficiency (ɳT), and overall efficiency (ɳo). The ɳel certainly relies on the standard efficiency, temperature coefficient, and cell temperature (Tcell). The equation representing the ɳel is shown in Equation (20).
where ɳST is the efficiency at standard test conditions (I = 1000 W/m2, ambient temperature = 25 °C) and βo is the temperature coefficient of efficiency.
The thermal efficiency (ɳT) associated with the PVT system relies on the deviation in inlet–outlet temperature of the tube as mentioned in Equations (21) and (22).
where Qt is the useful thermal energy and cp denotes the specific heat capacity (SHC) of the fluid.
The thermal efficiency of the PCM is calculated as per the following relation [36]:
where Qpcm denotes the heat energy stored by phase change material. The energy stored by PCM is calculated as per Equation (24).
The overall efficiency (ηo) is the aggregate of ɳel and ɳT as per the first law of thermodynamics [17].
2.4. Nusselt Number (Nu)
The ratio of conductive to convective heat transfer across the boundary of a surface is the Nusselt number. It describes the percentage of heat transfer between the nanofluid and the inner side of the tube. Nu is calculated for laminar and turbulent flow in pure water using the following relations [34]:
- Laminar flow (Re < 2300)
- Turbulent flow (Re > 2300)
The Nu for different nanofluids can be calculated as per the relation given in [37].
where c1, c2, m1, m2, and m3 are the constants used to solve the equation.
2.5. Thermophysical Properties
The thermophysical properties of both the nanofluid and the base fluid are crucial parameters that impact the operation of the PVT system. These properties are necessary for evaluating the typical energy-balance equations (EBEs) of the PVT system.
Equations (29) and (30) demonstrate the density of nanofluid and base fluid, respectively.
The specific heat capacity of the nanofluid and base fluid is calculated as per Equation (31) and Equation (32), respectively.
Viscosity is a property of fluids that refers to their resistance to deformation or movement of neighboring portions of the fluid relative to one another. It is a measure of the fluid’s internal friction or the “stickiness” of the fluid. High-viscosity fluids have a thicker consistency and are more resistant to flow, while low-viscosity fluids are thinner and flow more easily. The viscosity of the nanofluid and base fluid is calculated as per Equation (33) and Equation (34), respectively.
Thermal conductivity (λ) is the rate at which heat energy is transmitted through a material by conduction, when there is a temperature difference across the material [36].
As stated in the literature, the use of nanofluids and PCM with base fluid improves the operation of the PVT system. Therefore, the impact of weight fraction concentration of nanoparticles in the base fluid as well as increasing the MFR of fluid on the PVT systems’ working was investigated.
3. Results and Discussion
This paper examines the effect of water cooling and nano-cooling with PCM at various weight percentages on the efficiency of PVT systems. Figure 2 and Figure 3 show the meteorological data, including solar radiation intensity and ambient temperature, respectively. It is evident from the input data that the solar radiation intensity increases with time and peaks at 890 W/m2 around 12:30 h before declining throughout the day. Figure 3 shows that the ambient temperature peaked at 37.5 °C around 12:30 h. It was noticed that the ambient temperature increased along with the solar radiation intensity. The input data are used to calculate the thermal (ɳT), electrical (ɳel), and overall efficiency (ɳo) of the proposed PVT system using thermal modeling. The design parameters used in mathematical modeling are presented in Table 2.
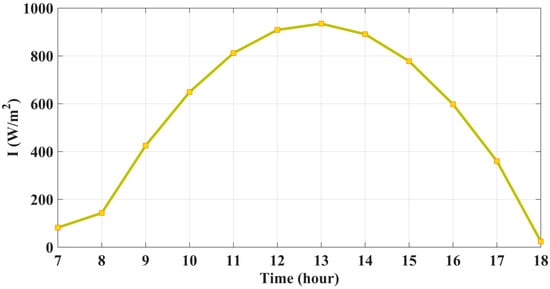
Figure 2.
Solar radiation intensity with time.
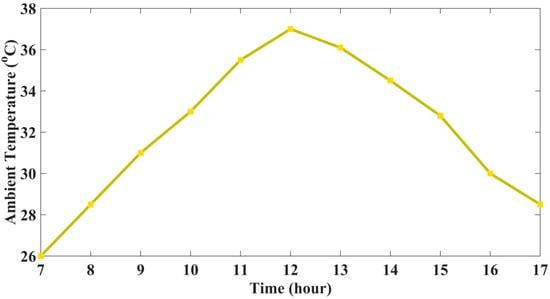
Figure 3.
Ambient temperature variation with time.

Table 2.
Design parameters of various layers of the PVT system [17].
Based on the data presented in Figure 3, it can be noted that the ambient temperature exhibits a pattern similar to that of the solar radiation intensity depicted in Figure 2.
Figure 4 displays the relationship between the cell temperature and time of day for a specific day at various weight percentages of CuO nanoparticles in water. The results indicate that as the concentration of nanoparticles in the base fluid (water) increases, the temperature of the PV cell decreases. Additionally, incorporating PCM with nanofluid enhances the cooling process and reduces cell temperature. When employing the PVT system for water cooling, the highest value of cell temperature is recorded as 38.39 °C, whereas using CuO-water nanofluid with a 0.4% wt. fraction, the peak cell temperature is 35.55 °C at 12:00 h. Moreover, a noticeable decrease in the average cell temperature is observed with nano-PCM cooling.
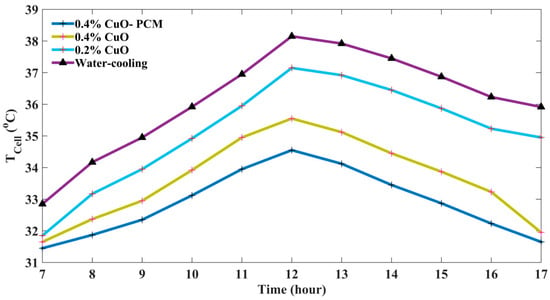
Figure 4.
Cell temperature variation at different weight fraction concentrations.
It is concluded from Table 3 that with the rise in the concentration of nanoparticles in the base fluid, the cell temperature decreases. Table 4 portrays the value of cell temperature at different weight concentrations of nanoparticles. Using CuO-water nanofluid (0.4% wt. fraction) with PCM, the cell temperature reduces by 4.45% as compared to a water-cooled PVT system.

Table 3.
Variation in cell temperature at different weight fractions of nanoparticles.

Table 4.
Performance parameters of PVT system with increasing MFR.
Figure 5 presents the daily variation in electrical efficiency (ɳel) at different weight fractions of nanoparticle concentration in the base fluid. As mentioned in Equation (20), the ɳel of the PVT system depends upon the PV module temperature. The ɳel of the PVT system is the measure of the cooling mechanism adopted. It is obtained from the analysis that the ɳel of the proposed system reduces as the cell temperature increases. This confirms that the ɳel shows the opposite trend to that of cell temperature. The average value of ɳel of the PVT system is 16.23% when CuO-PCM (0.4% wt. fraction) is used as a coolant. For a water-cooled PVT system, the average value of ɳel is 13.34%. Hence, a significant enhancement in the ɳel of the hybrid PVT system is achieved using nano-PCM fluid.
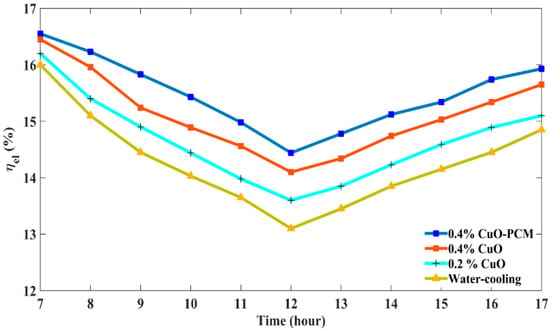
Figure 5.
Daily electrical efficiency variation at different weight fraction concentrations.
Figure 6 demonstrates the effect of increasing the weight percentage of nanoparticles in the base fluid on the thermal efficiency (ɳT) of the PVT system. As stated in the thermal modeling of the PVT system, the thermal efficiency is determined by the temperature difference between the inlet and outlet of the flow tube, the specific heat capacity of the fluid, and the solar radiation intensity.
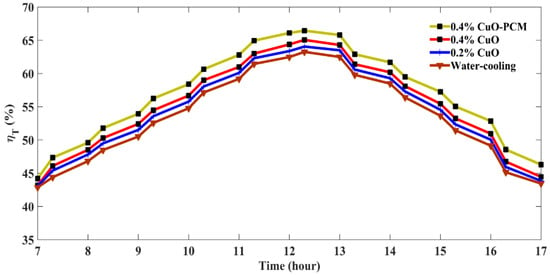
Figure 6.
Daily thermal efficiency variation at different weight fraction concentrations.
In Figure 6, it can be observed that the ɳT follows a similar trend to that of the solar radiation intensity. The highest value of ɳT is obtained for the CuO-PCM-cooled PVT system, while the lowest is recorded for the water-cooled PVT system. The maximum values of ɳT are 60.34%, 61.02%, 63.6%, and 65.10% for the water-cooled, 0.2% wt. fraction of CuO-water, 0.4% wt. fraction of CuO-water, and 0.4% CuO-PCM-cooled PVT systems, respectively. The results indicate that the efficiency of the PVT system increases significantly with an increase in the weight fraction of nanoparticles in the base fluid.
Furthermore, the overall efficiency (ɳo) of the PVT system is determined by the aggregate of thermal and electrical efficiencies obtained at the output. Figure 7 presents the daily variation in ɳo for both the water-cooled and nano-PCM-cooled PVT systems.
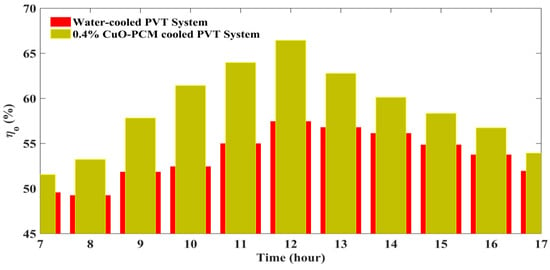
Figure 7.
Overall efficiency variation at different weight fraction concentrations.
It is found that the average value of ɳo is 62.34% and 55.10% for the CuO-PCM (0.4% wt. fraction)-cooled and water-cooled PVT systems. This shows a substantial improvement in total efficiency.
Figure 8 shows the changes in the electrical power output of the PVT system at various weight fractions of nanofluid over the course of a day. The results indicate that the amount of electrical power generated increases as the solar radiation level rises. The maximum electrical power output is achieved when the solar irradiance level is highest, typically around 12:00 h.
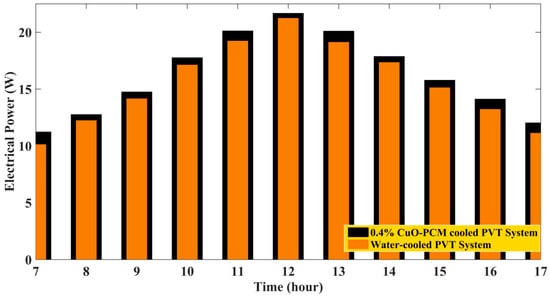
Figure 8.
Hourly electrical power variation of PVT system using different fluids.
The results indicate that the PVT system incorporating CuO-PCM (0.4% wt. fraction) exhibits better electrical power output than the water-cooled PVT system. This superior performance can be attributed to the higher heat conductivity of the nanofluid, which allows it to absorb more thermal energy compared to the water-cooled system.
Figure 9 illustrates the impact of increasing the MFR on the temperature of the PV cell in the PVT system. Various coolants, including water cooling, 0.2% wt. fraction of CuO-water nanofluid, 0.4% wt. fraction of CuO-water, and 0.4% CuO-PCM, were used to record the cell temperature of the PVT system. According to the graph, the largest reduction in cell temperature is observed when the PVT system is cooled with CuO-water nanofluid, with Vaseline serving as the PCM.
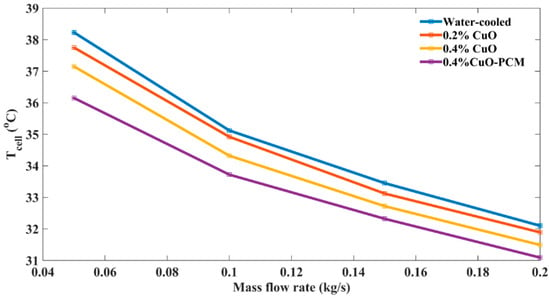
Figure 9.
Cell temperature at different MFRs.
In Figure 10, the ɳel of the considered PVT system is recorded with increasing MFR of the fluid circulating in the tube of the PVT system. It is observed that the ɳel rises with the rise in the MFR of the nanofluid.
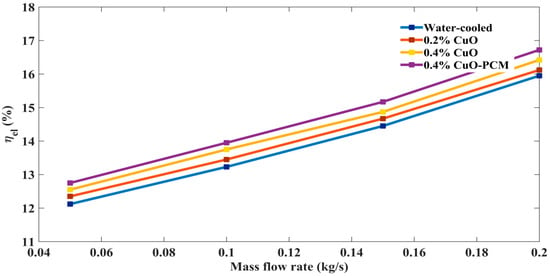
Figure 10.
Electrical efficiency at different MFRs.
The ɳel of the PVT system using 0.4% wt. fraction of CuO-PCM cooling increases from 12.89% to 16.32% when the MFR rises from 0.05 kg/s to 0.2 kg/s. Similar observations were also recorded for the water-cooled PVT system. As the MFR increases from 0.05 kg/s to 0.2 kg/s, the ɳel of the water-cooled PVT system increases from 12.02% to 15.34%.
The reason for the observed variation in performance parameters is that as the MFR increases, the temperature of the cell decreases, leading to an increase in the Reynolds number. Furthermore, the increase in heat transfer coefficients results in more heat being removed from the lower surface of the PVT module. Figure 11 depicts the overall efficiency (ɳo) of the PVT system with an increase in the mass flow rate from 0.05 kg/s to 0.2 kg/s using different nanofluid concentrations and a water-cooled PVT system.
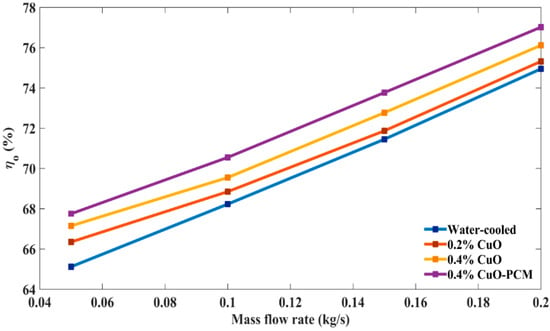
Figure 11.
Overall efficiency at different MFRs.
It is concluded from the figure that the ɳo of the proposed system is enhanced with an increase in MFR. As the MFR increases from 0.05 kg/s to 0.2 kg/s, the ɳo increases from 67.67% to 76.34% and 64.90% to 74.56% for the PVT systems with 0.4% wt. fraction of CuO-PCM cooling and water cooling, respectively. Further, the overall efficiency also improves with the rise in wt. fraction of nanoparticles in the base fluid.
The relationship between the performance parameters of the PVT system cooled with 0.4% wt. fraction of CuO-PCM nanofluid and the fluid flow rate (MFR) is presented in Table 4. The table illustrates how the performance parameters vary with an increase in the MFR of the fluid circulating in the tube assembly.
The evaluation of our proposed work is conducted by comparing it with existing literature. Table 5 presents a comparative analysis of our work with the related research mentioned in the literature.

Table 5.
Comparison of the proposed work with existing studies.
4. Conclusions
The objective of this study was to investigate the thermal and electrical performance of a PVT system using pure water, CuO-water nanofluid (0.2 and 0.4% weight fractions), and CuO-water nanofluid (0.4% weight fractions) with Vaseline as a PCM. The effect of increasing MFR on the performance of the PVT system was also examined. The following essential conclusions can be drawn from the research:
- (1)
- There is a direct correlation between the concentration of nanoparticles in the base fluid and the thermal and electrical efficiency of the PVT system.
- (2)
- Using the PVT system with CuO-water nanofluid (0.4% wt. fraction) with PCM reduced cell temperature by 4.45% and 1.13% compared to the water-cooled PVT system and nanofluid-cooled PVT system, respectively. The decrease in cell temperature improves the electrical efficiency of the system.
- (3)
- The thermal, electrical, and overall efficiencies improved by 6.9%, 4.85%, and 7.24%, respectively, using 0.4% wt. fraction of CuO-water nanofluid with PCM as compared to those of the PVT water-cooled system.
- (4)
- The increase in MFR from 0.05 kg/s to 0.2 kg/s resulted in an increase in electrical and overall efficiencies from 12.89% to 16.32% and 67.67% to 76.34%, respectively, using 0.4% wt. fraction of CuO-PCM as fluid.
- (5)
- As the MFR increases from 0.05 kg/s to 0.2 kg/s, the cell temperature decreases from 36.23 °C to 31.15 °C for the PVT system cooled with 0.4% wt. fraction of CuO-water nanofluid with PCM.
Author Contributions
A.K.T.; conceptualization, methodology, software analysis and K.C.; review and editing, supervision and investigation; and V.K.D.; editing and supervision and formal analysis. All authors have read and agreed to the published version of the manuscript.
Funding
This research received no external funding.
Data Availability Statement
Not applicable.
Conflicts of Interest
There is no conflict of interest among the authors.
Nomenclature
| Ac | Collector’s area (m2) | ins | Insulation layer |
| cp | Heat capacity of fluid (J/kg−1.K−1) | nf | Nanofluid |
| d | Diameter of nanoparticles under consideration (m) | pv | Photovoltaic module |
| Din | Inner diameter of the fluid tube (m) | t | Tube |
| Dout | Outer diameter of the fluid tube (m) | th | Thermal |
| I | Incident solar radiation (W/m−2) | Greek symbols | |
| h | Air heat transfer coefficient (W/m−2.K−1) | α | Absorptance |
| H | Conductive heat transfer coefficient (W/m−2.K−1) | ρ | Density (kg.m−3) |
| Lc | Tube length (m) | ɳST | Efficiency at STC (%) |
| m | Mass flow rate of the coolant (kgs−1) | ɳel | Electrical efficiency (%) |
| Nu | Nusselt number, dimensionless | ɳT | Thermal efficiency (%) |
| P | Packing factor | ɳo | Overall efficiency (%) |
| Pe | Peclet number | β0 | Temperature coefficient of efficiency |
| Pr | Prandtl number | λ | Thermal conductivity (Wm−1 K−1) |
| Re | Reynolds number | δ | Thickness (m) |
| T | Temperature (K) | υ | Viscosity of fluid (Pa.s) |
| Vf | Volume flow rate (m3 s−1) | ||
| vw | Wind speed (ms−1) | Abbreviations | |
| W | Distance from tube to tube (m) | HTC | Heat transfer coefficient |
| Subscript | MFR | Mass flow rate | |
| air | Layer of air | PVT | Photovoltaic–thermal |
| Ab | Absorber layer | DCPVT | Dual-channel PVT system |
| bf | Base fluid | PV | Photovoltaic |
| cell | Photovoltaic cell | SCPVT | Single-channel PVT system |
| g | Glass cover | TMPS | Triply periodic minimal surface |
References
- Diwania, S.; Agrawal, S.; Siddiqui, A.S.; Singh, S. A comprehensive review on application and its advancement. Int. J. Energy Environ. Eng. 2019, 11, 33–54. [Google Scholar] [CrossRef]
- Kasaeian, A.; Rahdan, P.; Vaziri Rad, M.A.; Yan, W.-M. Optimal design and technical analysis of a grid-connected hybrid photovoltaic/diesel/biogas under different economic conditions: A case study. Energy Convers. Manag. 2019, 198, 111810. [Google Scholar] [CrossRef]
- Diwania, S.S.; Agrawal, S.; Siddiqui Kumar, R. Performance assessment of PVT air-collector with V-groove absorber: A theoretical and experimental analysis. Heat Mass Transf. 2021, 57, 665–679. [Google Scholar] [CrossRef]
- Sonveer, S.; Agrawal, S.; Avasthi, D.V. Design, modeling and performance analysis of dual channel semitransparent photovoltaic thermal hybrid module in cold environment. Energy Convers. Manag. 2016, 114, 241–250. [Google Scholar]
- Sonveer, S.; Agrawal, S.; Tiwari, A.; Al-Helal, I.M.; Avasthi, D.V. Modeling and parameter optimization of hybrid single channel photovoltaic thermal module using genetic algorithm. Sol. Energy 2015, 113, 78–87. [Google Scholar]
- Mojumder, J.C.; Chong, W.T.; Ong, H.C.; Leong, K.Y.; Abdullah-Al-Mamoon. An experimental investigation on performance analysis of air type photovoltaic thermal collector system integrated with cooling fins design. Energy Build. 2016, 130, 272–285. [Google Scholar] [CrossRef]
- Kabeel, A.E.; Hamed, M.H.; Omara, Z.M.; Kandeal, A.W. Influence of fin height on the performance of a glazed and bladed entrance single-pass solar air heater. Sol. Energy 2018, 162, 410–419. [Google Scholar] [CrossRef]
- Kamthania, D.; Nayak, S.; Tiwari, G.N. Performance evaluation of a hybrid photovoltaic thermal double pass facade for space heating. Energy Build. 2011, 43, 2274–2281. [Google Scholar] [CrossRef]
- Ramani, B.M.; Gupta, A.; Kumar, R. Performance of a double pass solar air collector. Sol. Energy 2010, 84, 1929–1937. [Google Scholar] [CrossRef]
- Brideau, S.A.; Collins, M.R. Experimental Model Validation of a Hybrid PV/thermal Air-based Collector with Impinging Jets. Energy Procedia 2012, 30, 44–54. [Google Scholar] [CrossRef]
- Sopian, K.; Liu, H.; Kakac, S.; Veziroglu, T. Performance of a double pass photovoltaic thermal solar collector suitable for solar drying systems. Energy Convers. Manag. 2000, 41, 353–365. [Google Scholar] [CrossRef]
- Herrando, M.; Markides, C.N.; Hellgardt, K. A UK-based assessment of hybrid PV and solar-thermal systems for domestic heating and power: System performance. Appl. Energy 2014, 122, 288–309. [Google Scholar] [CrossRef]
- Prakash, J. Transient analysis of a photovoltaic–thermal solar collector for co-generation of electricity and hot air/water. Energy Convers. Manag. 1994, 35, 967–972. [Google Scholar] [CrossRef]
- Bergene, T.; Lovvik, O.M. Model calculations on a flat plate solar heat collector with integrated solar cells. Sol. Energy 1995, 55, 453–462. [Google Scholar] [CrossRef]
- Guarracino, I.; Mellor, A.; Ekins-Daukes, N.J.; Markides, C.N. Dynamic coupled thermal and electrical modelling of sheet-and-tube hybrid photovoltaic/thermal (PVT) collectors. Appl. Therm. Eng. 2016, 101, 778–795. [Google Scholar] [CrossRef]
- Akhavan-Behabadi, M.A.; Hekmatipour, F.; Mirhabibi, S.M.; Sajadi, B. Experimental investigation of thermal–rheological properties and heat transfer behavior of the heat transfer oil–copper oxide (HTO–CuO) nanofluid in smooth tubes. Exp. Therm. Fluid Sci. 2016, 68, 681–688. [Google Scholar] [CrossRef]
- Diwania, S.; Siddiqui, A.S.; Agrawal, S.; Kumar, R. Modeling and assessment of the thermo-electrical performance of a photovoltaic-thermal (PVT) system using different nanofluid. J. Braz. Soc. Mech. Sci. Eng. 2021, 43, 190. [Google Scholar] [CrossRef]
- Sardarabadi, M.; Passandideh-Fard, M.; Heris, S.Z. Experimental investigation of the effects of silica/water nanofluid on PV/T (photovoltaic thermal units). Energy 2014, 66, 264–272. [Google Scholar] [CrossRef]
- Kazemian, A.; Salari, A.; Ma, T.; Lu, H. Application of hybrid nanofluid in a novel combined photovoltaic/thermal and solar collector system. Sol. Energy 2022, 239, 102–116. [Google Scholar] [CrossRef]
- Khanjari, Y.; Pourfayaz, F.; Kasaeian, A. Numerical investigation on using of nanofluid in a water-cooled photovoltaic thermal system. Energy Convers. Manag. 2016, 122, 263–278. [Google Scholar] [CrossRef]
- Sardarabadi, M.; Passandideh-Fard, M. Experimental and numerical study of metal-oxides/ water nanofluids as coolant in photovoltaic thermal systems (PVT). Sol. Energy Mater. Sol. Cells 2016, 157, 533–542. [Google Scholar] [CrossRef]
- Rejeb, O.; Sardarabadi, M.; Ménézo, C.; Passandideh-Fard, M.; Dhaou, M.H.; Jemni, A. Numerical and model validation of uncovered nanofluid sheet and tube type photovoltaic thermal solar system. Energy Convers. Manag. 2016, 110, 367–377. [Google Scholar] [CrossRef]
- Al-Shamani, A.N.; Sopian, K.; Mat, S.; Hasan, H.A.; Abed, A.M.; Ruslan, M.H. Experimental studies of rectangular tube absorber photovoltaic thermal collector with various types of nanofluids under the tropical climate conditions. Energy Convers. Manag. 2016, 124, 528–542. [Google Scholar] [CrossRef]
- Xu, Z.; Kleinstreuer, C. Concentration photovoltaic–thermal energy co-generation system using nanofluids for cooling and heating. Energy Convers. Manag. 2014, 87, 504–512. [Google Scholar] [CrossRef]
- Xu, Z.; Kleinstreuer, C. Computational analysis of nanofluid cooling of high concentration photovoltaic cells. J. Therm. Sci. Eng. Appl. 2014, 6031009. [Google Scholar] [CrossRef]
- Fayaz, H.; Nasrin, R.; Rahim, N.A.; Hasanuzzaman, M. Energy and Exergy analysis of the PVT system:Effect of nanofluid flow rate. Sol. Energy 2018, 169, 217–230. [Google Scholar] [CrossRef]
- Aberoumand, S.; Ghamari, S.; Shabani, B. Energy and exergy analysis of a photovoltaic/thermal system using nanofluids: An experimental study. Sol. Energy 2018, 165, 167–177. [Google Scholar] [CrossRef]
- Al-Waeli, A.H.A.; Chaichan, M.T.; Sopian, K.; Kazem, A.H.; Mahood, H.B.; Khadoom, A.A. Modeling and experimental validation of a PVT system using nanofluid coolant and nano-PCM. Sol. Energy 2019, 177, 178–191. [Google Scholar] [CrossRef]
- Burhan Al-Omari, S.A.; Qureshi, Z.A.; Elnajjar, E.; Mahmoud, F. A heat sink integrated fins within high thermal conductivity phase change material to cool high heat-flux heat sources. Int. J. Therm. Sci. 2022, 172, 107190. [Google Scholar] [CrossRef]
- Burhan Al-Omari, S.A.; Qureshi, Z.A.; Mahmoud, F.; Elnajjar, E. Thermal management characteristics of a counter-intuitive finned heat sink incorporating detached fins impregnated with a high thermal conductivity-low melting point PCM. Int. J. Therm. Sci. 2022, 175, 107393. [Google Scholar]
- Qureshi, Z.A.; Burhan Al-Omari, S.A.; Elnajjar, E.; Al-Ketan, O.; Al-Rub, R.A. Architected lattices embedded with phase change materials for thermal management of high power electronics: A numerical study. Appl. Therm. Eng. 2023, 219, 119420. [Google Scholar] [CrossRef]
- Qureshi, Z.A.; Burhan Al-Omari, S.A.; Elnajjar, E.; Al-Ketan, O.; Al-Rub, R.A. Nature inspired triply periodic minimal surface-based structures in sheet and solid configurations for performance enhancement of a low-thermal-conductivity phase change material for latent heat thermal energy storage applications. Int. J. Therm. Sci. 2022, 173, 107361. [Google Scholar] [CrossRef]
- Tang, L.Q.; Zhu, Q.Z. Performance study of flowing-over PV/T system with different working fluid. Appl. Mech. Mater. 2014, 488–489, 1173–1176. [Google Scholar]
- Cui, Y.; Zhu, Q. Study of photovoltaic/thermal systems with MgO-water nanofluids flowing over silicon solar cells. In Proceedings of the 2012 Asia-Pacific Power and Energy Engineering Conference, Shanghai, China, 27–29 March 2012; IEEE: New York, NY, USA, 2012; pp. 1–4. [Google Scholar]
- Jia, Y.; Ran, F.; Zhu, C.; Fang, G. Numerical analysis of photovoltaic-thermal collector using nanofluid as a coolant. Sol. Energy 2020, 196, 625–636. [Google Scholar] [CrossRef]
- Diwania, S.; Kumar, M.; Kumar, R.; Kumar, A.; Gupta, V.; Khetrapal, P. Machine learning-based thermo-electrical performance improvement of nanofluid-cooled photovoltaic–thermal system. Energy Environ. 2022. [CrossRef]
- Xuan, Y.; Li, Q. Investigation on convective heat transfer and flow features of nanofluids. J. Heat Transf. 2003, 125, 151–155. [Google Scholar] [CrossRef]
Disclaimer/Publisher’s Note: The statements, opinions and data contained in all publications are solely those of the individual author(s) and contributor(s) and not of MDPI and/or the editor(s). MDPI and/or the editor(s) disclaim responsibility for any injury to people or property resulting from any ideas, methods, instructions or products referred to in the content. |
© 2023 by the authors. Licensee MDPI, Basel, Switzerland. This article is an open access article distributed under the terms and conditions of the Creative Commons Attribution (CC BY) license (https://creativecommons.org/licenses/by/4.0/).