Article

Optimization of the Performances of Palm Oil Mill Effluent (POME)-Based Biogas Plants Using Comparative Analysis and Response Surface Methodology

1
Department of Chemical and Environmental Engineering, University of Nottingham Malaysia, Broga Road, Semenyih 43500, Selangor Darul Ehsan, Malaysia
2
Department of Biotechnology, Saveetha School of Engineering, Saveetha Institute of Medical and Technical Sciences, Chennai 602105, India
3
Department of Chemistry, College of Science, King Saud University, P.O. Box 2455, Riyadh 11451, Saudi Arabia
4
Research Institute of Environment & Biosystem, Chungnam National University, Yuseonggu, Daejeon 34134, Republic of Korea
5
HICoE—Centre for Biofuel and Biochemical Research, Institute of Self-Sustainable Building, Department of Fundamental and Applied Sciences, Universiti Teknologi PETRONAS, Seri Iskandar 32610, Perak Darul Ridzuan, Malaysia
*
Authors to whom correspondence should be addressed.
Processes 2023, 11(6), 1603; https://doi.org/10.3390/pr11061603
Submission received: 23 March 2023 / Revised: 17 April 2023 / Accepted: 18 April 2023 / Published: 24 May 2023
(This article belongs to the Special Issue Modeling, Simulation, Control, and Optimization of Processes)

Abstract

:
The rapid increase in demand for renewable energy has led to a need for more efficient and effective ways to produce biogas from palm oil mill effluent (POME), which is rich in biological and chemical oxygen demand (BOD and COD). Despite its potential as a source of biogas, POME is not always effectively utilized in biogas production due to a lack of optimization of the treatment process. This study aims to address this issue by identifying the critical parameters affecting biogas production from POME and optimizing the process for maximum biogas yield and COD removal. This study employed comparative analysis and response surface methodology to optimize the performance of palm oil mill effluent (POME)-based biogas plants in Malaysia. Historical data from three commercial POME-based biogas plants in Malaysia were analyzed to identify the most critical parameters for biogas yield and COD removal. Response surface methodology, using Box–Behnken design and Design-Expert software, was then used to optimize these parameters. Sensitivity analysis was performed to interpret the impact of parameters on biogas production, with Organic Loading Rate (OLR) found to be the most critical factor for methane yield. The results showed that the optimum conditions for maximum methane production were OLR of 1.23 kg/m3·day, inlet Total Solids (TS) of 46,370 mg/L, pH of 4.5, and temperature of 45.4 °C, resulting in a 39.6% increase in methane yield (0.335 m3 CH4/kgCODremoved) and a 1.1% increase in COD removal (93.4%).

1. Introduction

One of the major commodities in Malaysia, the palm oil industry, has seen a rise in recent years due to growing demand from food industries, biofuel, and cosmetics. Accounting for up to 46% of global palm oil export, the industry contributes greatly to the country’s economic growth [1]. On average, crude palm oil yield is about 21% of the fresh fruit bunch (FFB), with the remaining 79% being waste [2]. For every 1 ton of processed FFB, 700 kg of palm oil mill effluent (POME) will be generated [1]. With this respect, approximately 50–75 million m3 of POME are generated in Malaysia annually [3].
POME contains high organic content, which contributes to high levels of Chemical Oxygen Demand (COD) and Biological Oxygen Demand (BOD). The discharge of POME must comply with the Malaysia Environmental Quality (Prescribed Premises) (Crude Palm Oil) (Amendment) Regulations 1982. The typical characteristics of POME in Malaysia [3] and the required standards for discharges are presented in Table 1 [4].
The COD and BOD values indicate high levels of organic content in POME, which makes it potentially a source for biogas production through anaerobic digestion. Biogas is a promising renewable and sustainable energy alternative to reduce dependence on fossil fuels. In fact, the Malaysian government has planned a few strategies to maximize methane production, including mandating that all palm oil mills capture emitted biogas and use it as an energy source in order to reduce environmental pollution. Nevertheless, about half of the mills in Malaysia still use the conventional ponding method without trapping methane gas due to a lack of land and funding [5].
In Malaysia, studies investigating the parameters to maximize biogas production from POME have emerged in recent years. In POME treatment plants, biogas is produced in the anaerobic digestion process. Anaerobic digestion is a multi-step biochemical process of digesting and converting organic material into biogas by two metabolic routes, at mesophilic (35 °C) and thermophilic (55 °C) conditions. A sequence of four stages occurs during the metabolic reactions, namely hydrolysis, acidogenesis, acetogenesis, and methanogenesis. It is found that in the methanogenesis stage of anaerobic digestion, 1 m3 of POME is capable of producing 28 m3 of biogas with a methane content of more than 50%, and 1 m3 of biogas generates approximately 1.8 kWh of electricity, equating to a 25% efficiency in power generation [6,7]. However, anaerobic digestion is dependent on various types of operating parameters such as the pH, the temperature of the system, hydraulic retention time (HRT), organic loading rate (OLR), and many more; therefore, it is a complex and unstable process.
A review of methane production in Malaysia by Amin et al. [1] suggests that more research is needed to optimize the performance of anaerobic digesters for locally produced waste. This is because anaerobic digestion technology is highly sensitive to feedstock characteristics, and digesters need to be customized accordingly. While OLR, HRT, temperature, and pH are crucial parameters for optimizing biogas production in POME anaerobic digesters, the optimization of total solids (TS) inlet alongside these parameters has not been extensively studied. This is concerning as TS is a crucial parameter that significantly affects the efficiency of biogas production due to the presence of organic material in the TS. Additionally, there is a lack of versatile data analysis methods to optimize biogas production that can be applied to most commercial plants, highlighting the need for further research in this area.
RSM is an effective statistics-based optimization tool that has been widely used in the bio-energy field. It is a time and cost-saving method of optimization as it reduces the number of experimental trials to achieve the objectives [8]. Through RSM, a statistical, mathematical model is generated to predict the optimal conditions for biogas production, making it a versatile tool for optimizing production in commercial plants. Previous studies have successfully optimized biogas production using RSM with continuous stirred-tank reactor (CSTR) based anaerobic digesters and fresh POME samples from commercial plants [9,10,11]. However, these studies have mainly focused on laboratory-scale experiments and fresh POME samples, which may not accurately represent the complexities of industrial-scale operations. Therefore, further research is needed to develop and apply effective optimization methods using RSM, which can be applied to industrial-scale anaerobic digesters.
Therefore, this study aims to fill this gap by analyzing historical data from different commercial biogas plants in Malaysia with the objective of improving methane production performance from palm oil mill effluent (POME). The study’s specific objectives are to compare the performances of three different anaerobic digester production plants, determine the most critical parameter affecting biogas production and COD removal efficiency, and determine the optimum value of OLR, inlet TS, pH, and temperature to optimize biogas production and COD removal efficiency. The novelty of this study lies in its comparative analysis of commercial biogas plants operating at an industrial scale, which may differ significantly from lab-scale or pilot-scale data. Design-Expert software will be used for data analysis, and response surface methodology (RSM) will be used to integrate mathematical and statistical techniques to analyze the input parameters involved in the responses. The Box–Behnken Design (BBD) will be used to determine the best values for biogas production inputs. The results of this study can help in the optimization of anaerobic digesters, thereby maximizing biogas production from POME and achieving long-term renewable energy supply and environmental sustainability.

2. Materials and Methods

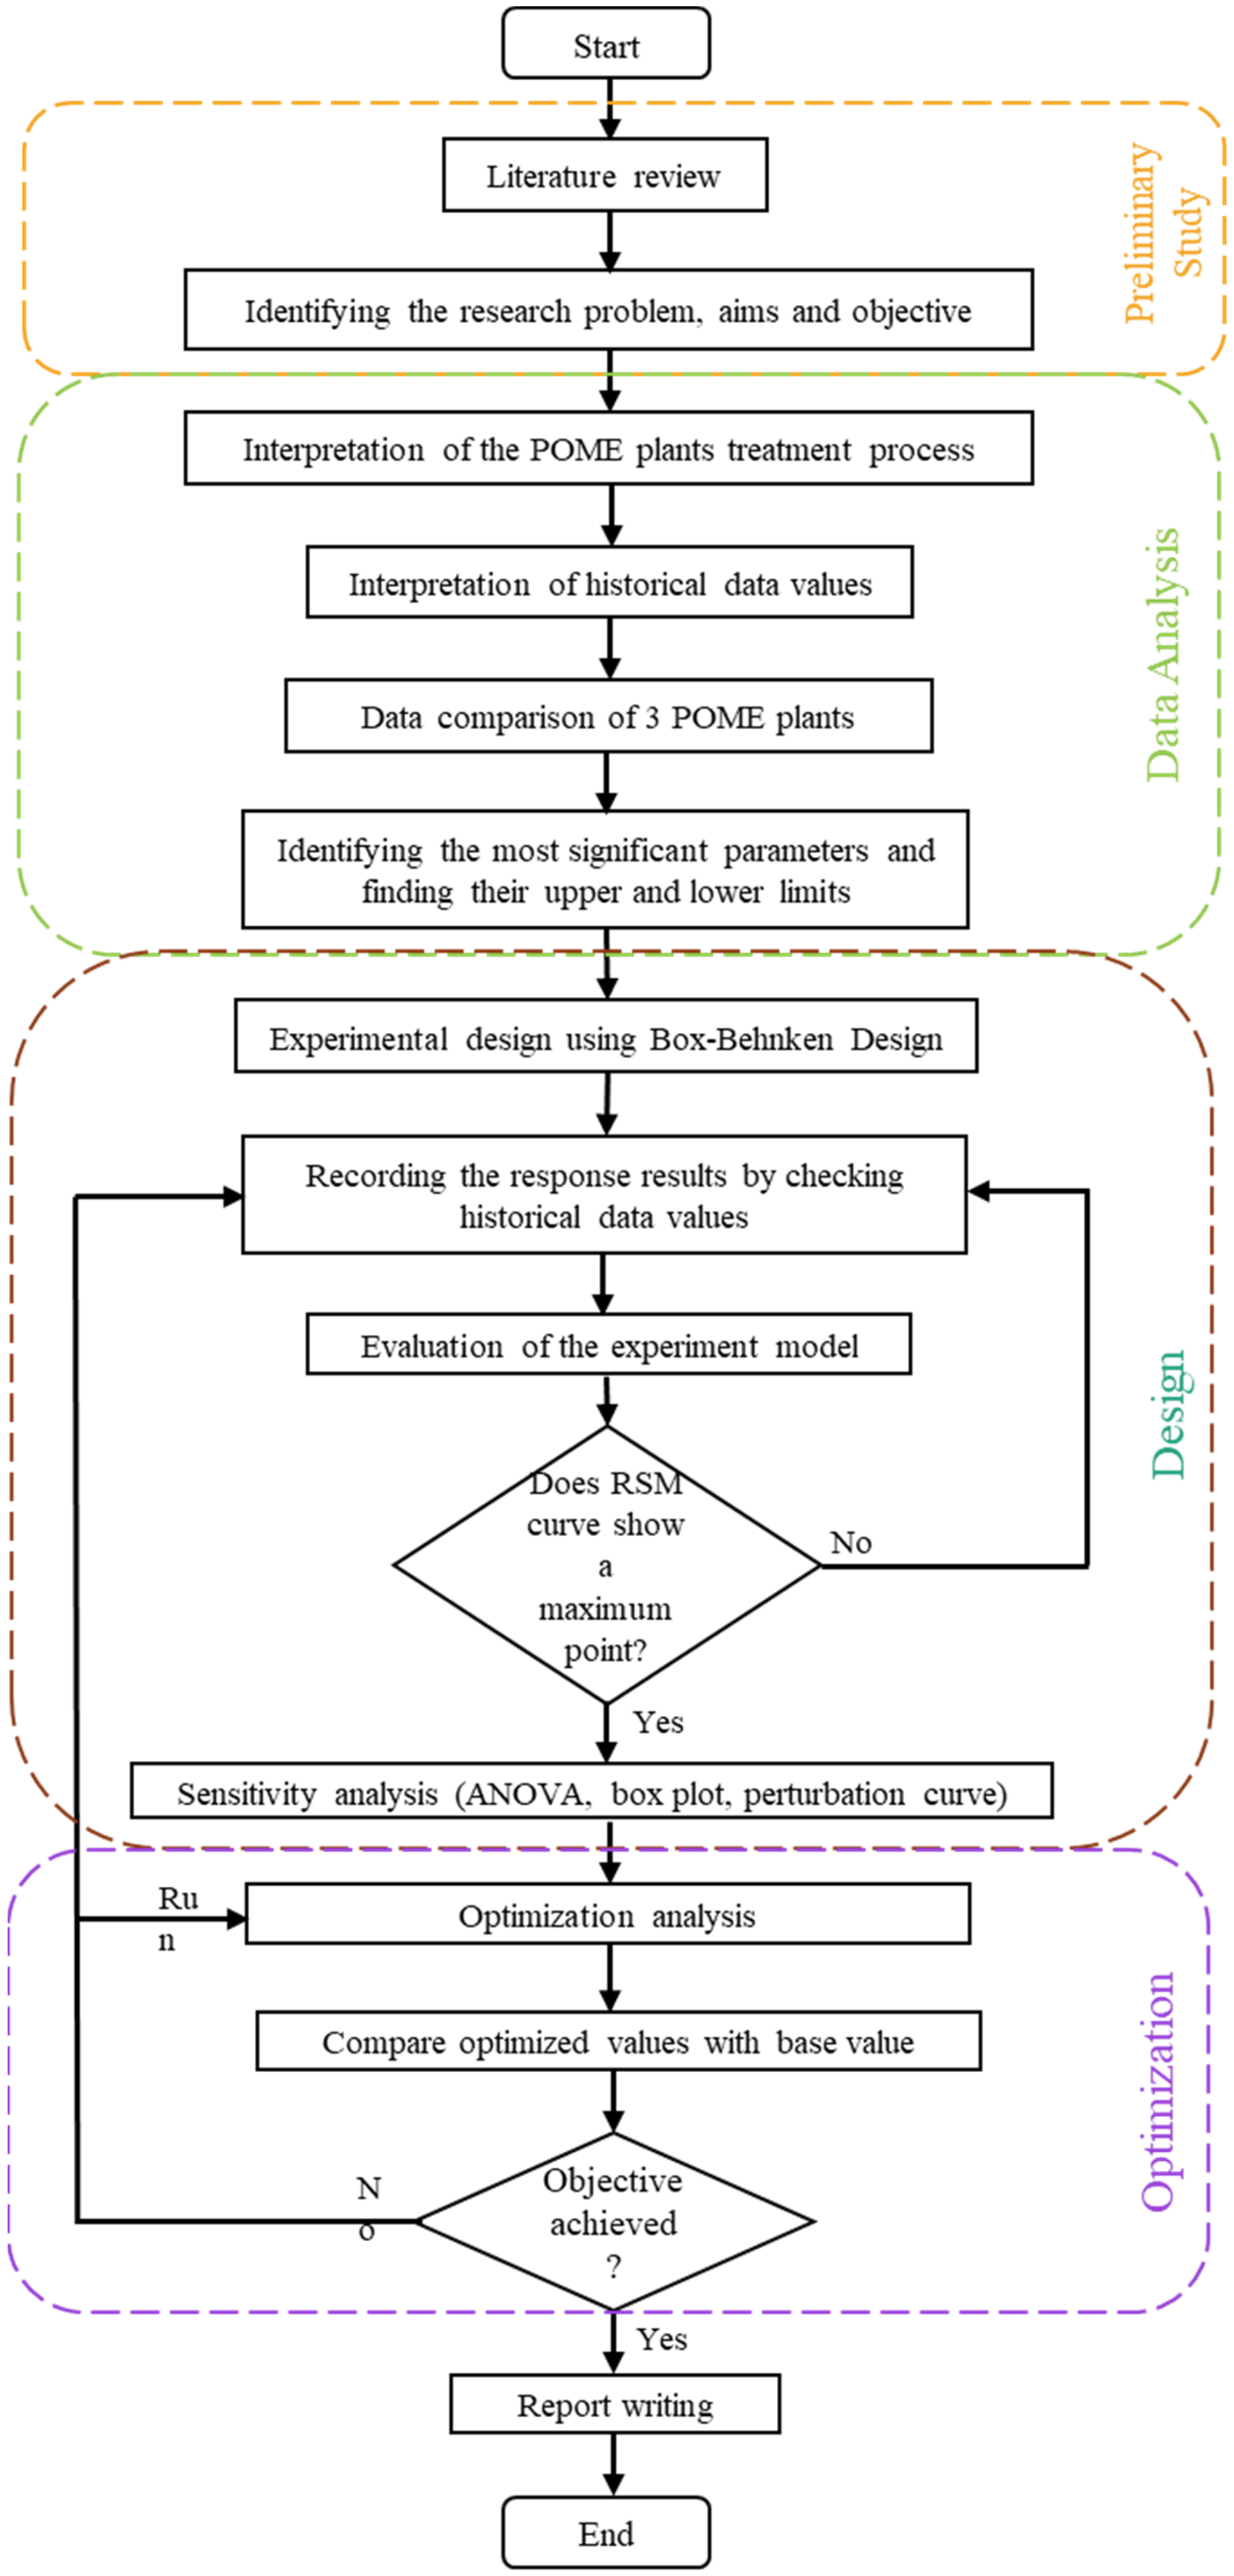
This section describes the methods used to achieve the research objectives, which include understanding the POME treatment process, conducting a comparative analysis, analyzing data, designing experiments, optimizing performance, and reporting results. The research methodology flow is illustrated in Figure 1.

2.1. POME Treatment Process

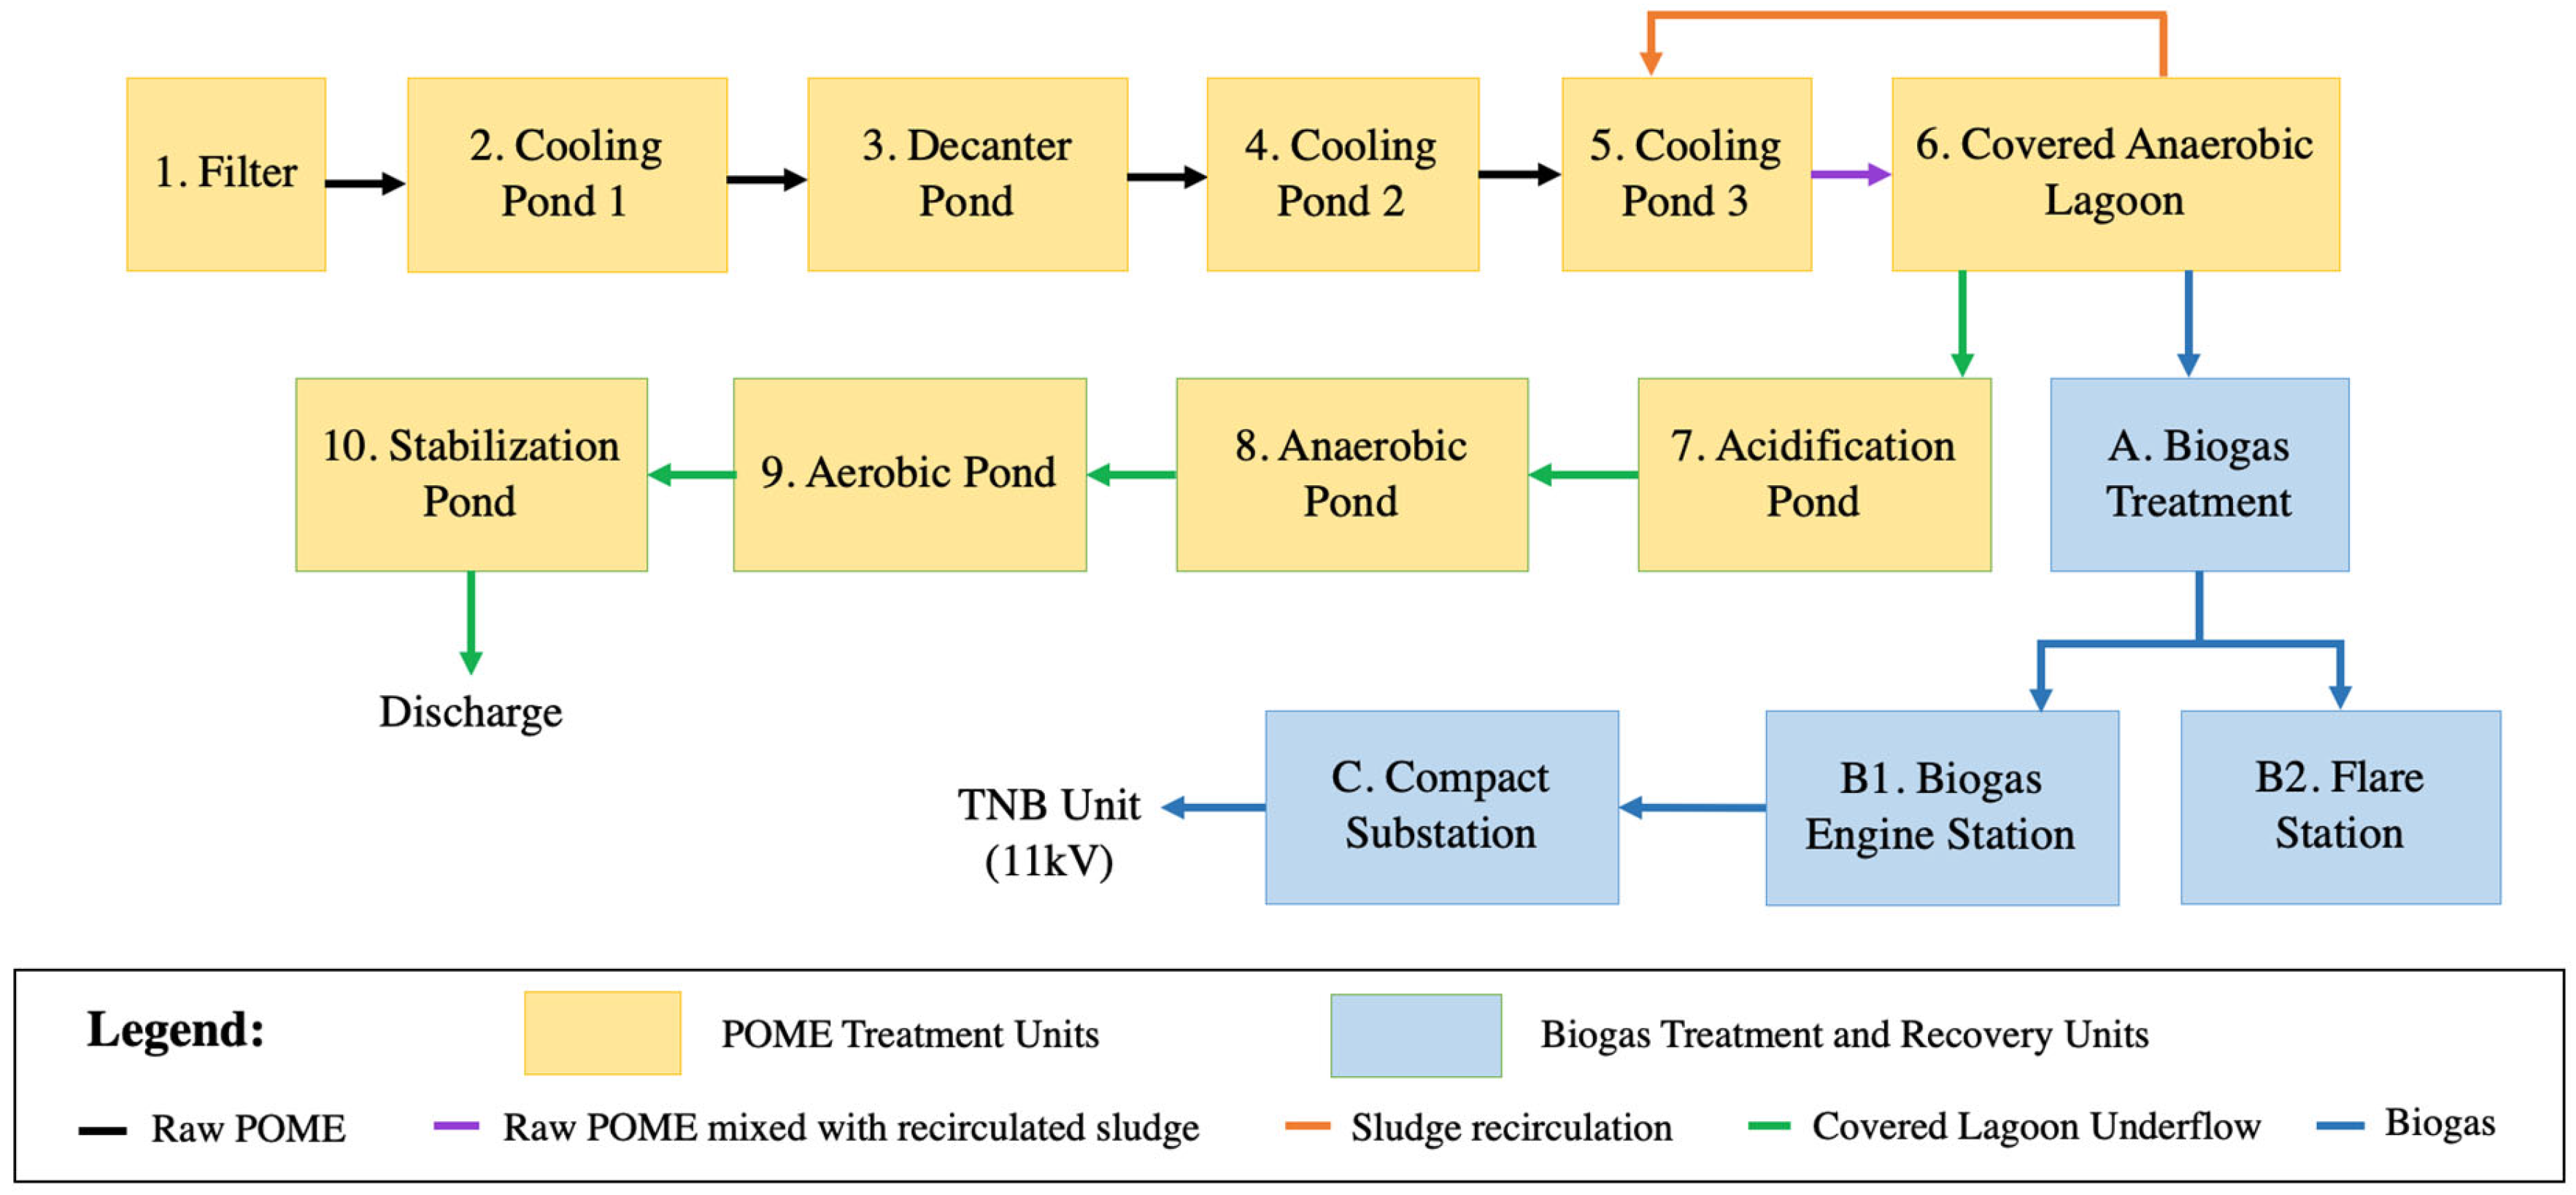
Three commercial biogas plants are involved in this study. The POME treatment method employed by the plants is the covered lagoon with a hydraulic recirculation system. The process flow of the POME treatment plants is shown in Figure 2. Firstly, POME flows through a filtration unit for solids removal in Stage 1, prior to reducing its temperature in a cooling pond. Then, oil is removed from the decanter pond before further temperature reduction at Stage 4. The covered lagoon has a hydraulic recirculation system installed, which allows constant mixing of anaerobically treated POME with raw POME to enhance the activity of the microbial population [12] and to avoid the formation of scum and foam [13].
At the covered lagoon, biogas produced is captured and fed to a series of biogas treatment units, including a blower, H2S scrubber, and chiller. H2S concentration is required to meet the permissible levels by biogas engines to prevent corrosion and optimize operation [14]. Treated biogas is combusted in engines to produce electricity, then stored in compact substations that connect with the 11 kV electricity grid.
POME exiting the covered lagoon flows into a ponding system that comprises acidification, anaerobic, and aerobic stabilization ponds for further treatment. At the stabilization pond, an aeration system supplies oxygen to the microbial cells to facilitate the breakdown of organic components prior to discharge.
The sampling points of this study are Stage 5 (cooling pond 3) for raw POME, Stage 6 (covered anaerobic lagoon) for operating parameters, and Stage A (biogas treatment) for biogas and methane yield.
Figure 2. Block Diagram of the POME Treatment Process (Adapted from Cheau Chin et al. [15]).
Processes 11 01603 g002

2.2. Comparative Analysis

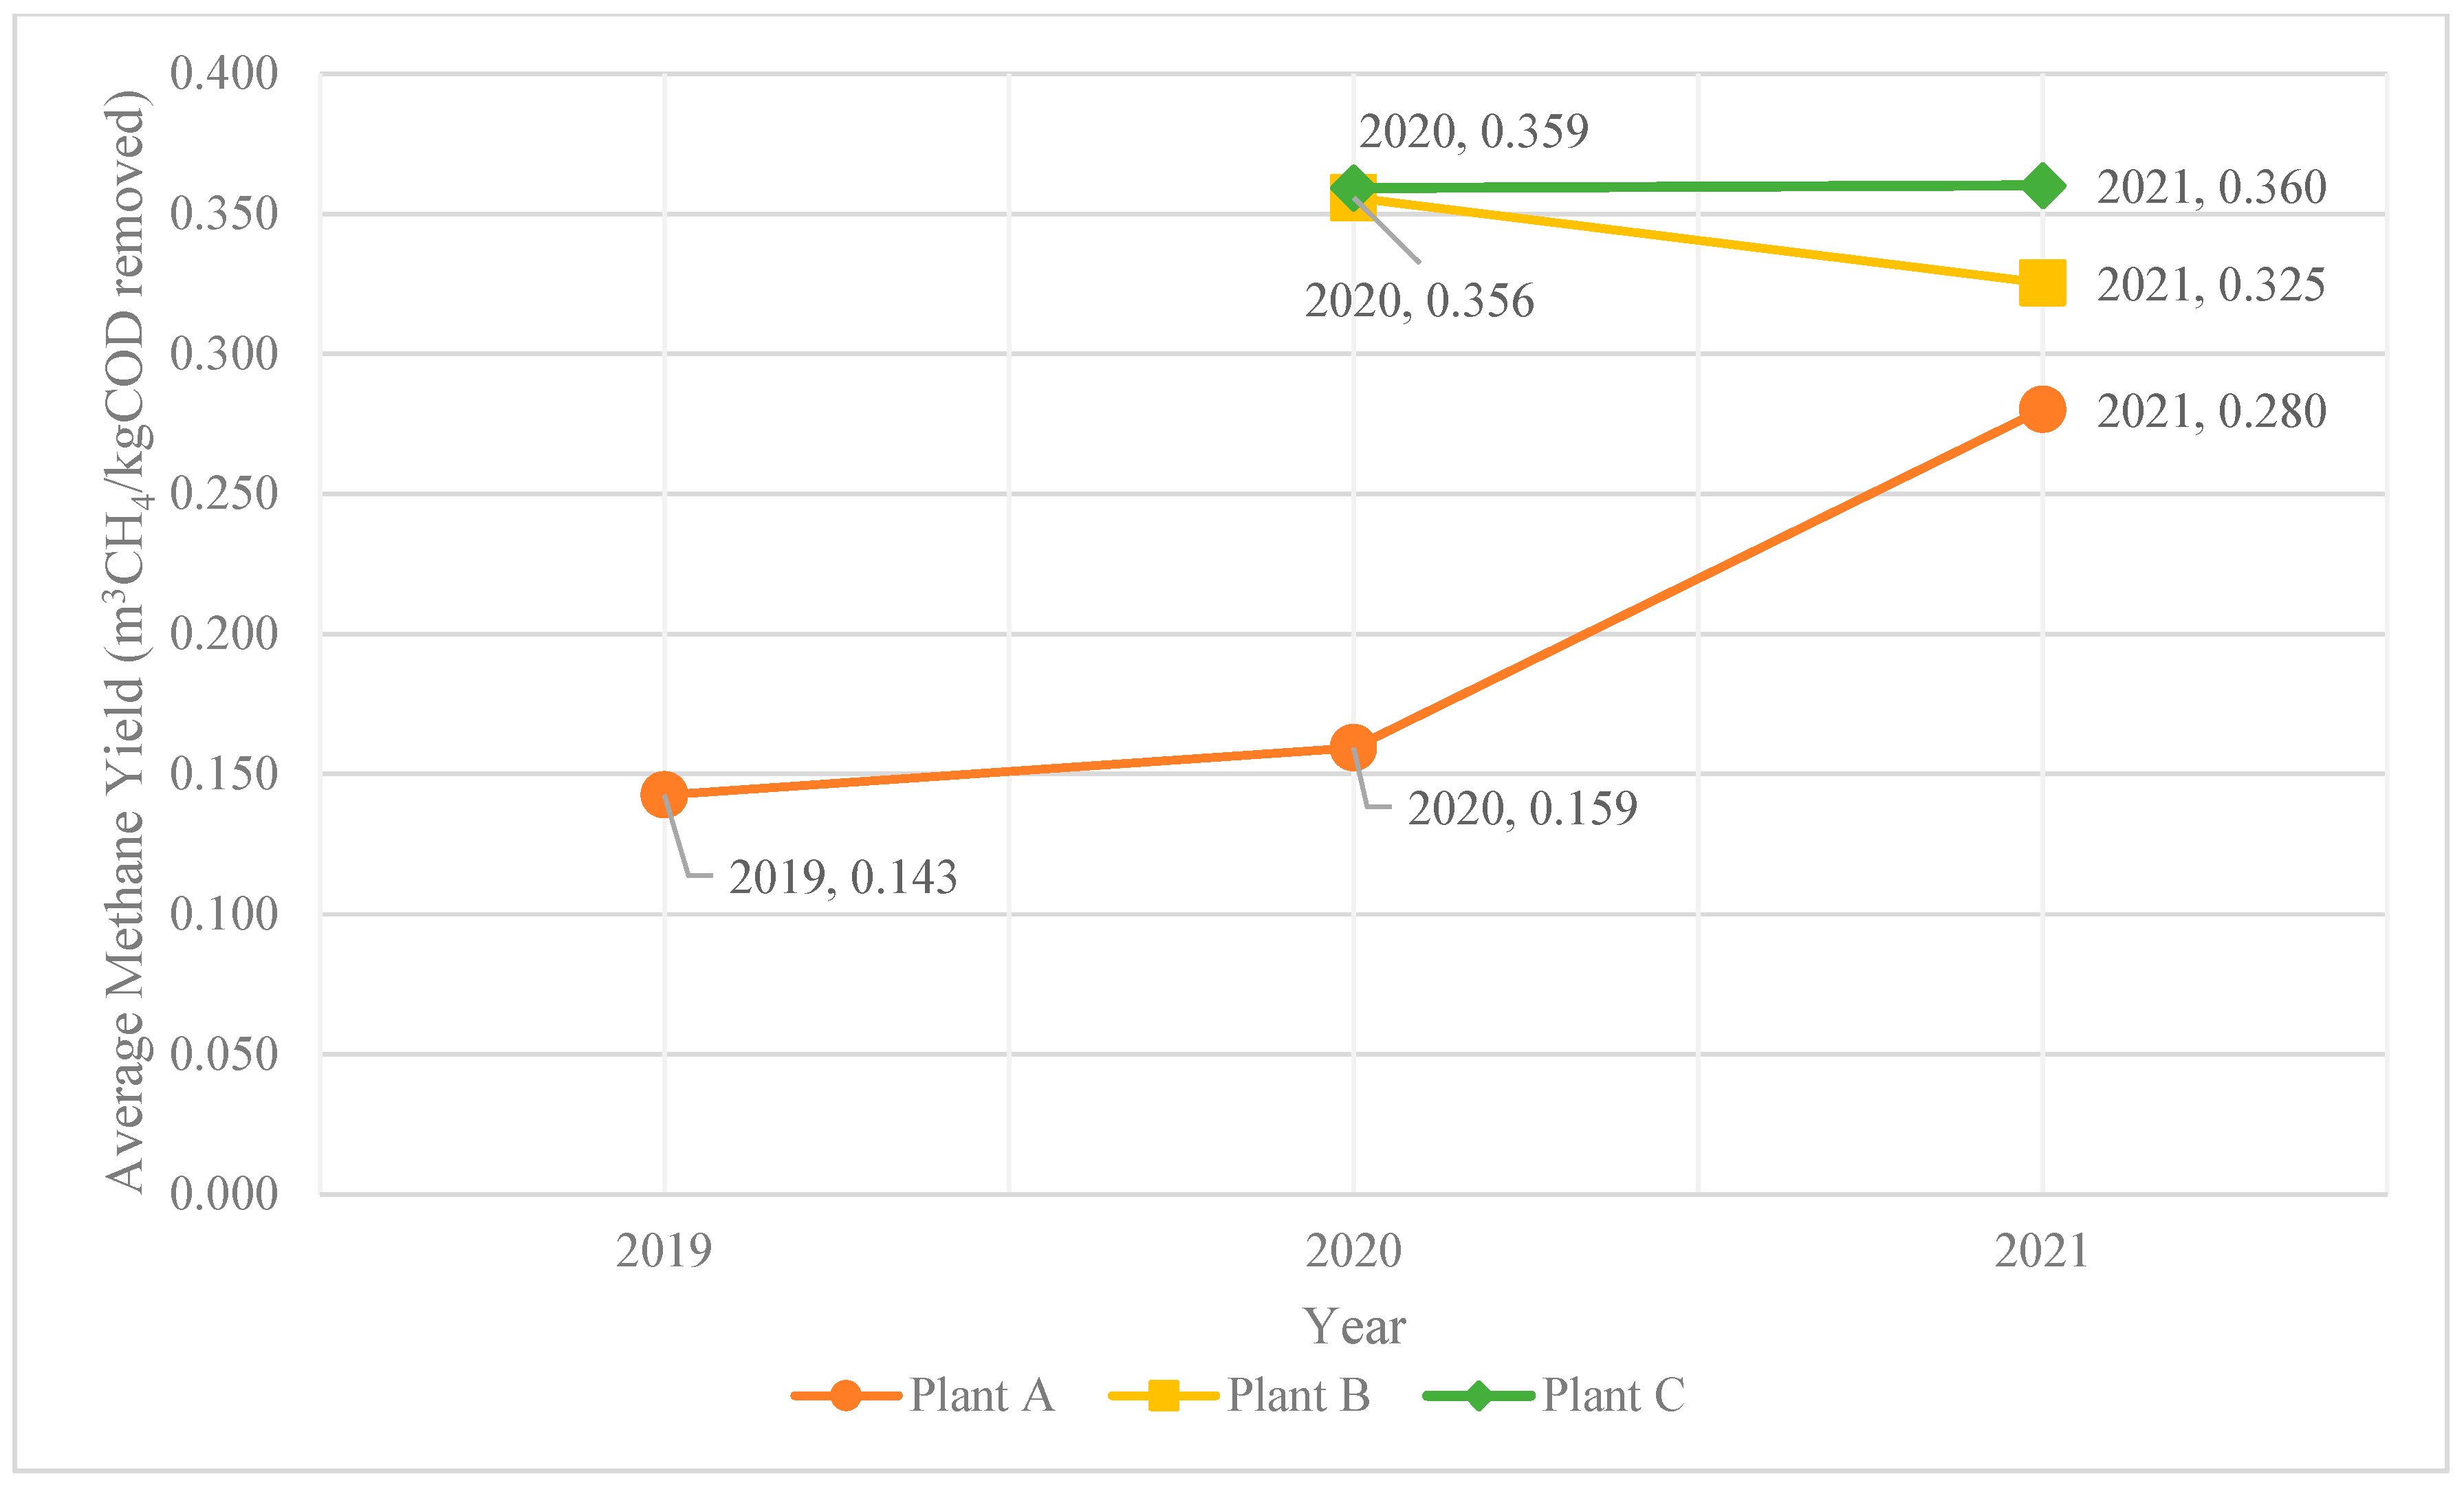
Three sets of two-year-historical data were provided from the three commercial biogas plants. Parameters recorded in the data include organic loading rate (OLR), hydraulic retention time (HRT), biogas and methane yield, inlet and outlet pH, temperature, TS, TSS, and COD.
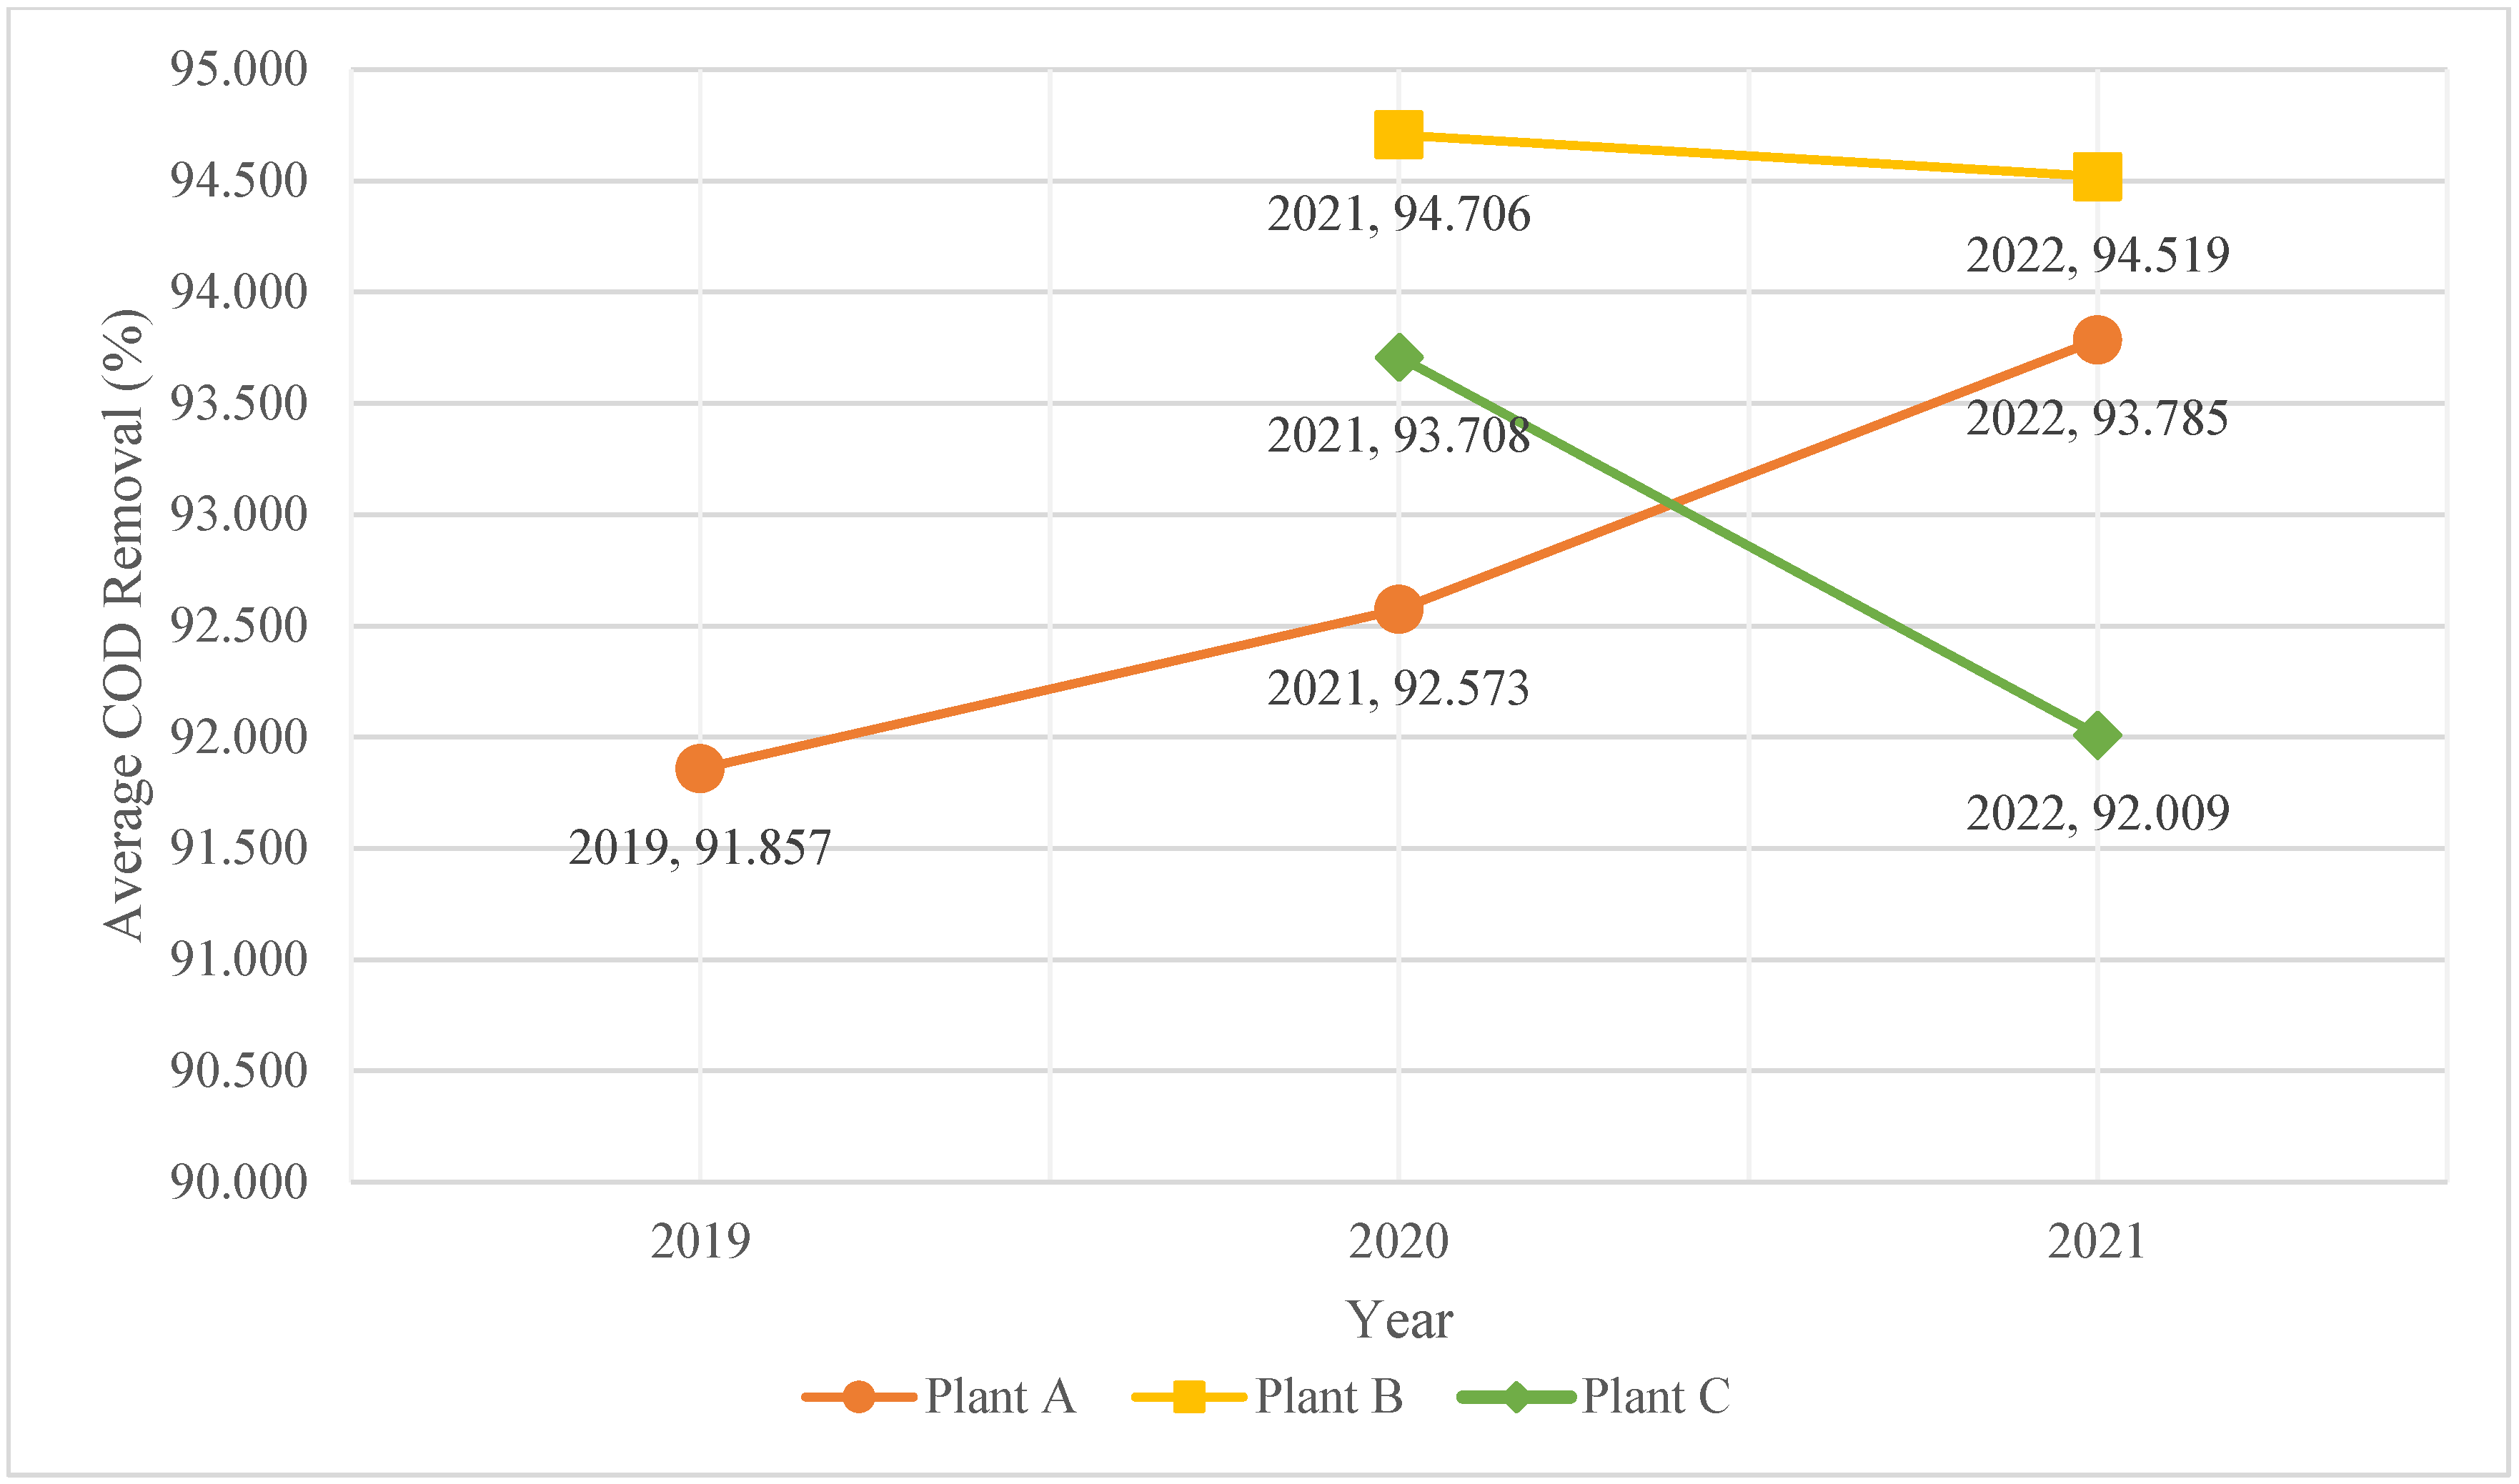
In this paper, the parameters studied are OLR, inlet TS, temperature, and pH. The performances evaluated are COD removal and methane yield. All analyses were performed in duplicate, and the average values were presented in tables and figures. Comparative analysis and evaluation are conducted and discussed in the following section.

2.3. Statistical Analysis and Optimization Using Design-Expert Software

The data provided by Plant A are selected to conduct analysis and optimization using Design-Expert software. Response surface methodology (RSM) was used to investigate the effects of four independent variables, namely OLR (kg/m3·day) (A), inlet TS (TS) (B), inlet pH (C) and inlet temperature (D) on two response variables, namely methane yield (%), and COD removal efficiency (%) of the digestion process. These four variables were selected because they are known to significantly affect the anaerobic digestion process. Additionally, the data obtained from the plant are comprehensive as they are measured daily, providing a reliable and complete data set for analysis.
The RSM is divided into four multi-level designs: Box–Behnken design (BBD), central composite design (CCD), full factorial design (FFD), and optimal design. CCD is the most commonly used model, but BBD was used in this case. The advantages of this over CCD and FFD are that the design matrix is less complex, with more time and cost efficiency for a large number of experiments [8,16].
With the setting of three center points per block, Design-Expert software generated an experiment design using different values of variables within the range. The response values of the experiment design were filled up by referring to the closest available historical data. The lower and upper bounds of the variables were determined by analyzing the daily historical data of the plant, and the corresponding values are presented in Table 2. Table A1 (Appendix A) shows the experimental design and results in Design-Expert.
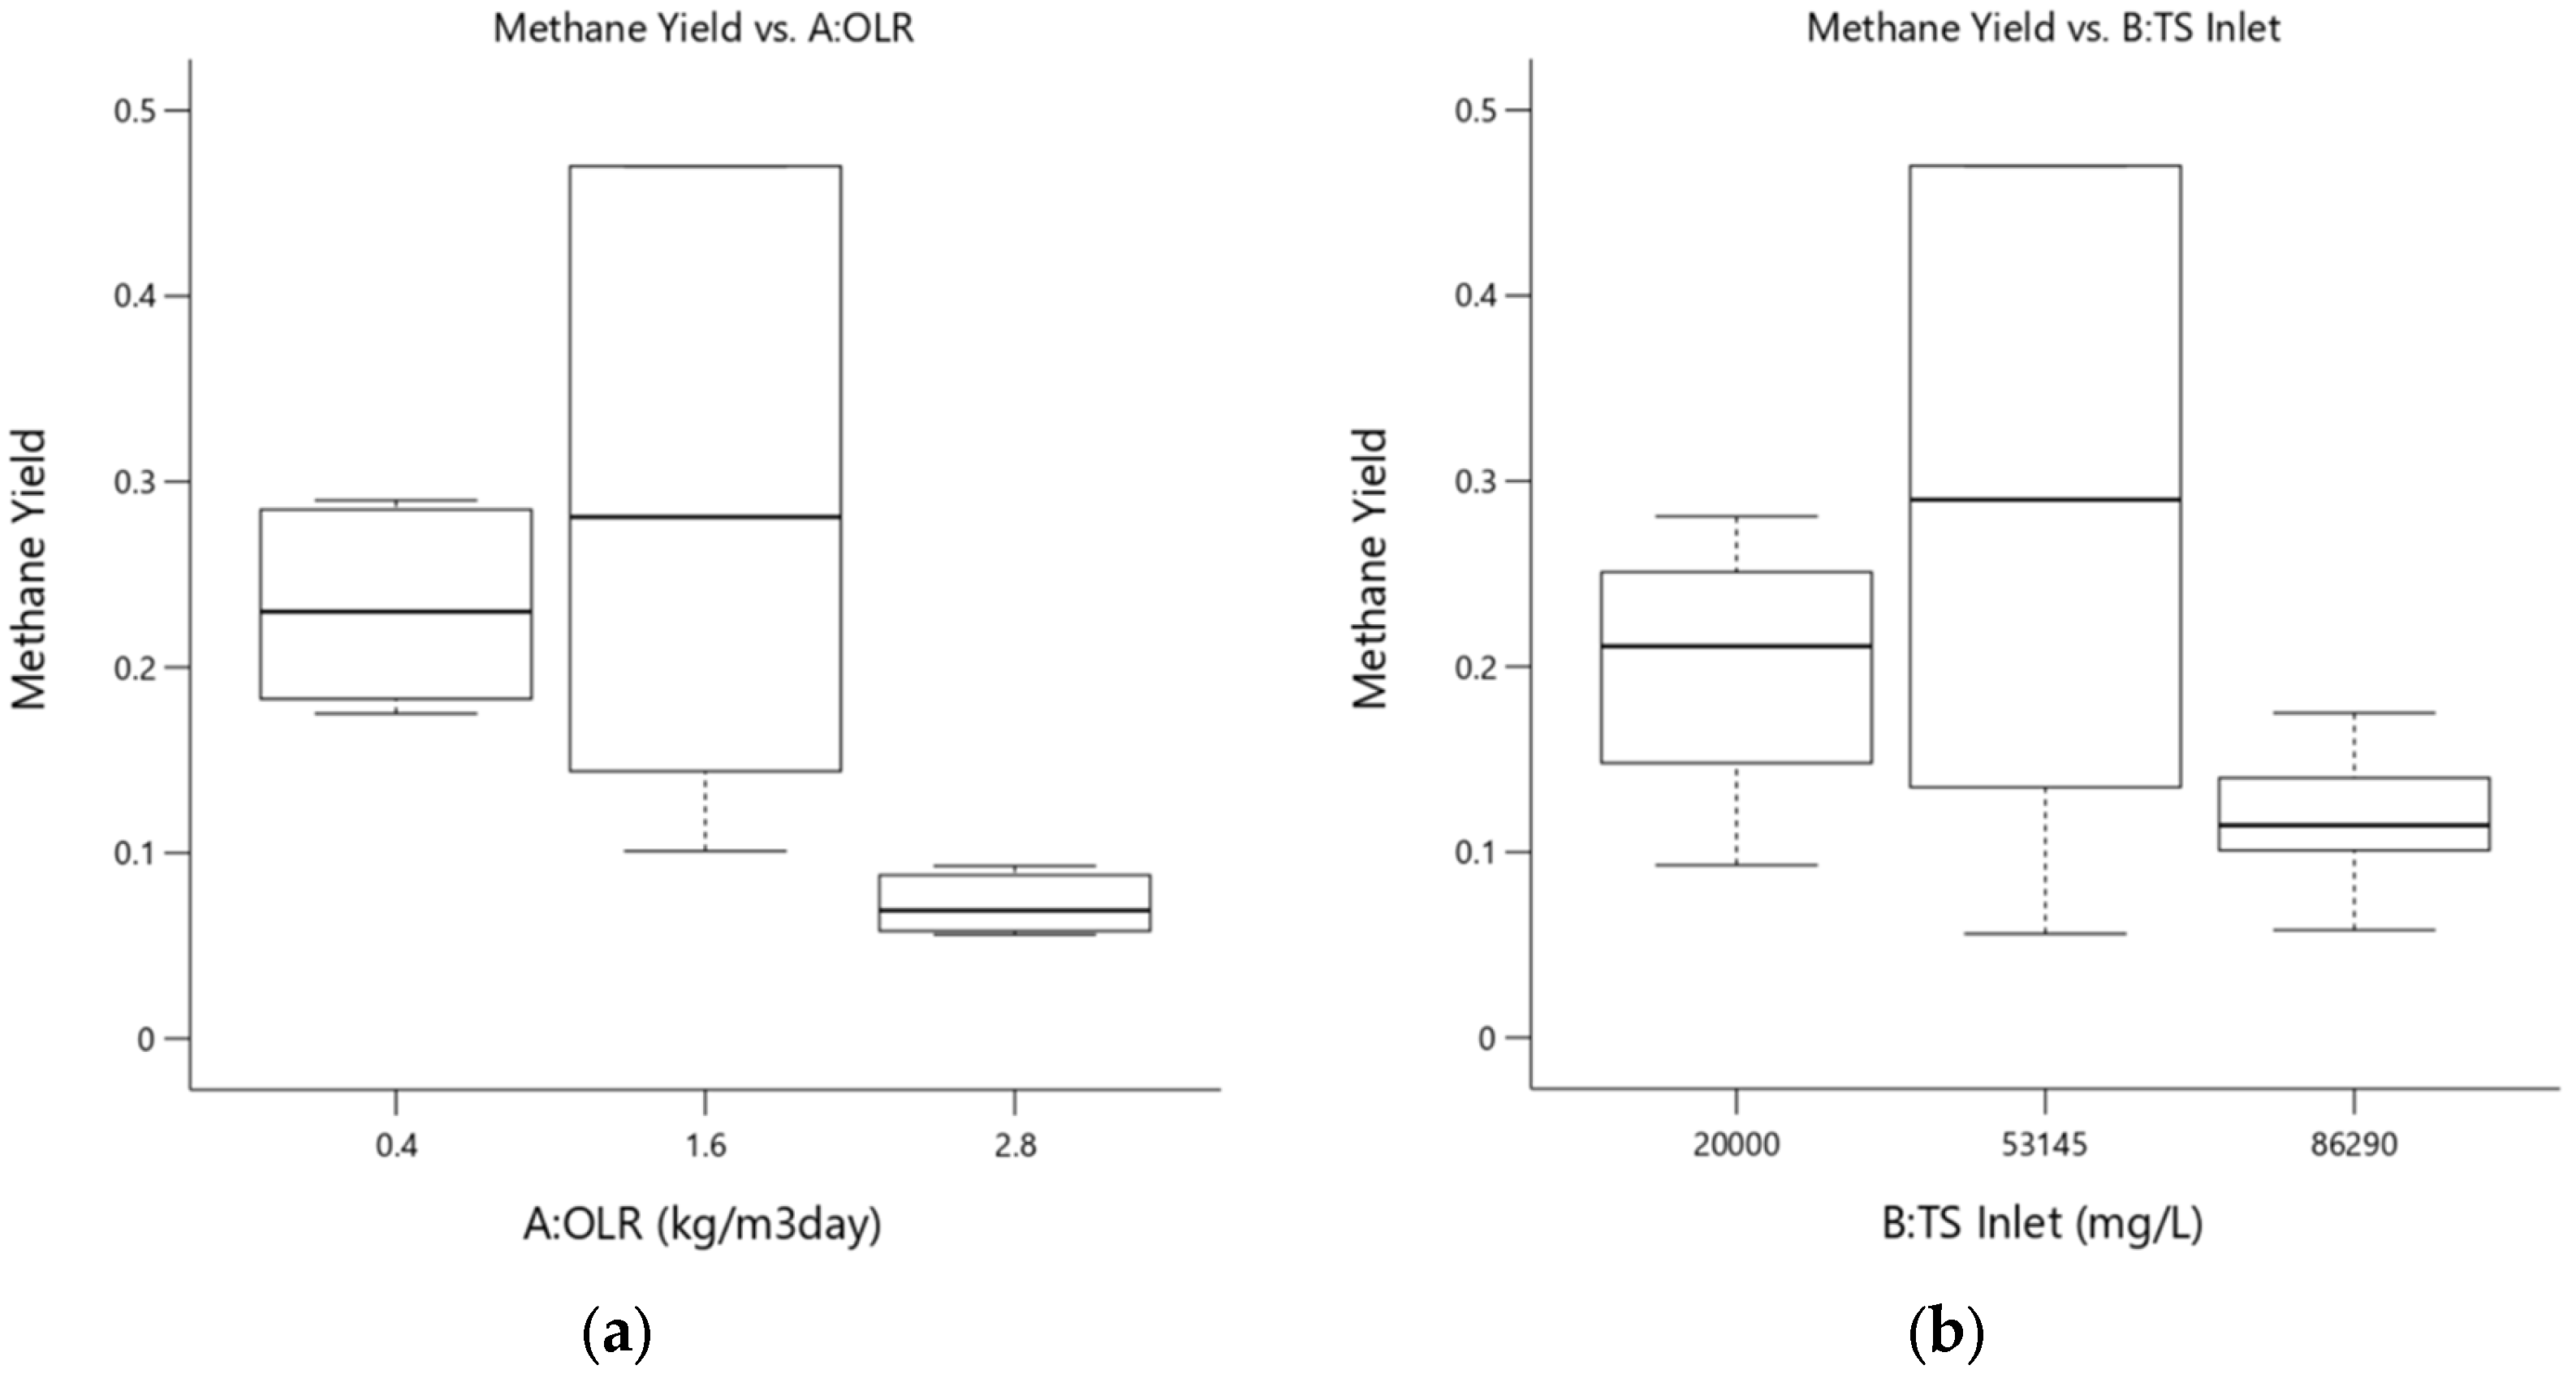
Analysis of variance (ANOVA) and box plots were employed to analyze and evaluate the data graphically. The suitability of the fitted polynomial model was also validated using the coefficient R2. The 3D response surface plots were created using regression analysis of the simulation data. The significance of model terms was also assessed using the probability value (p-value) at a 95% confidence interval.
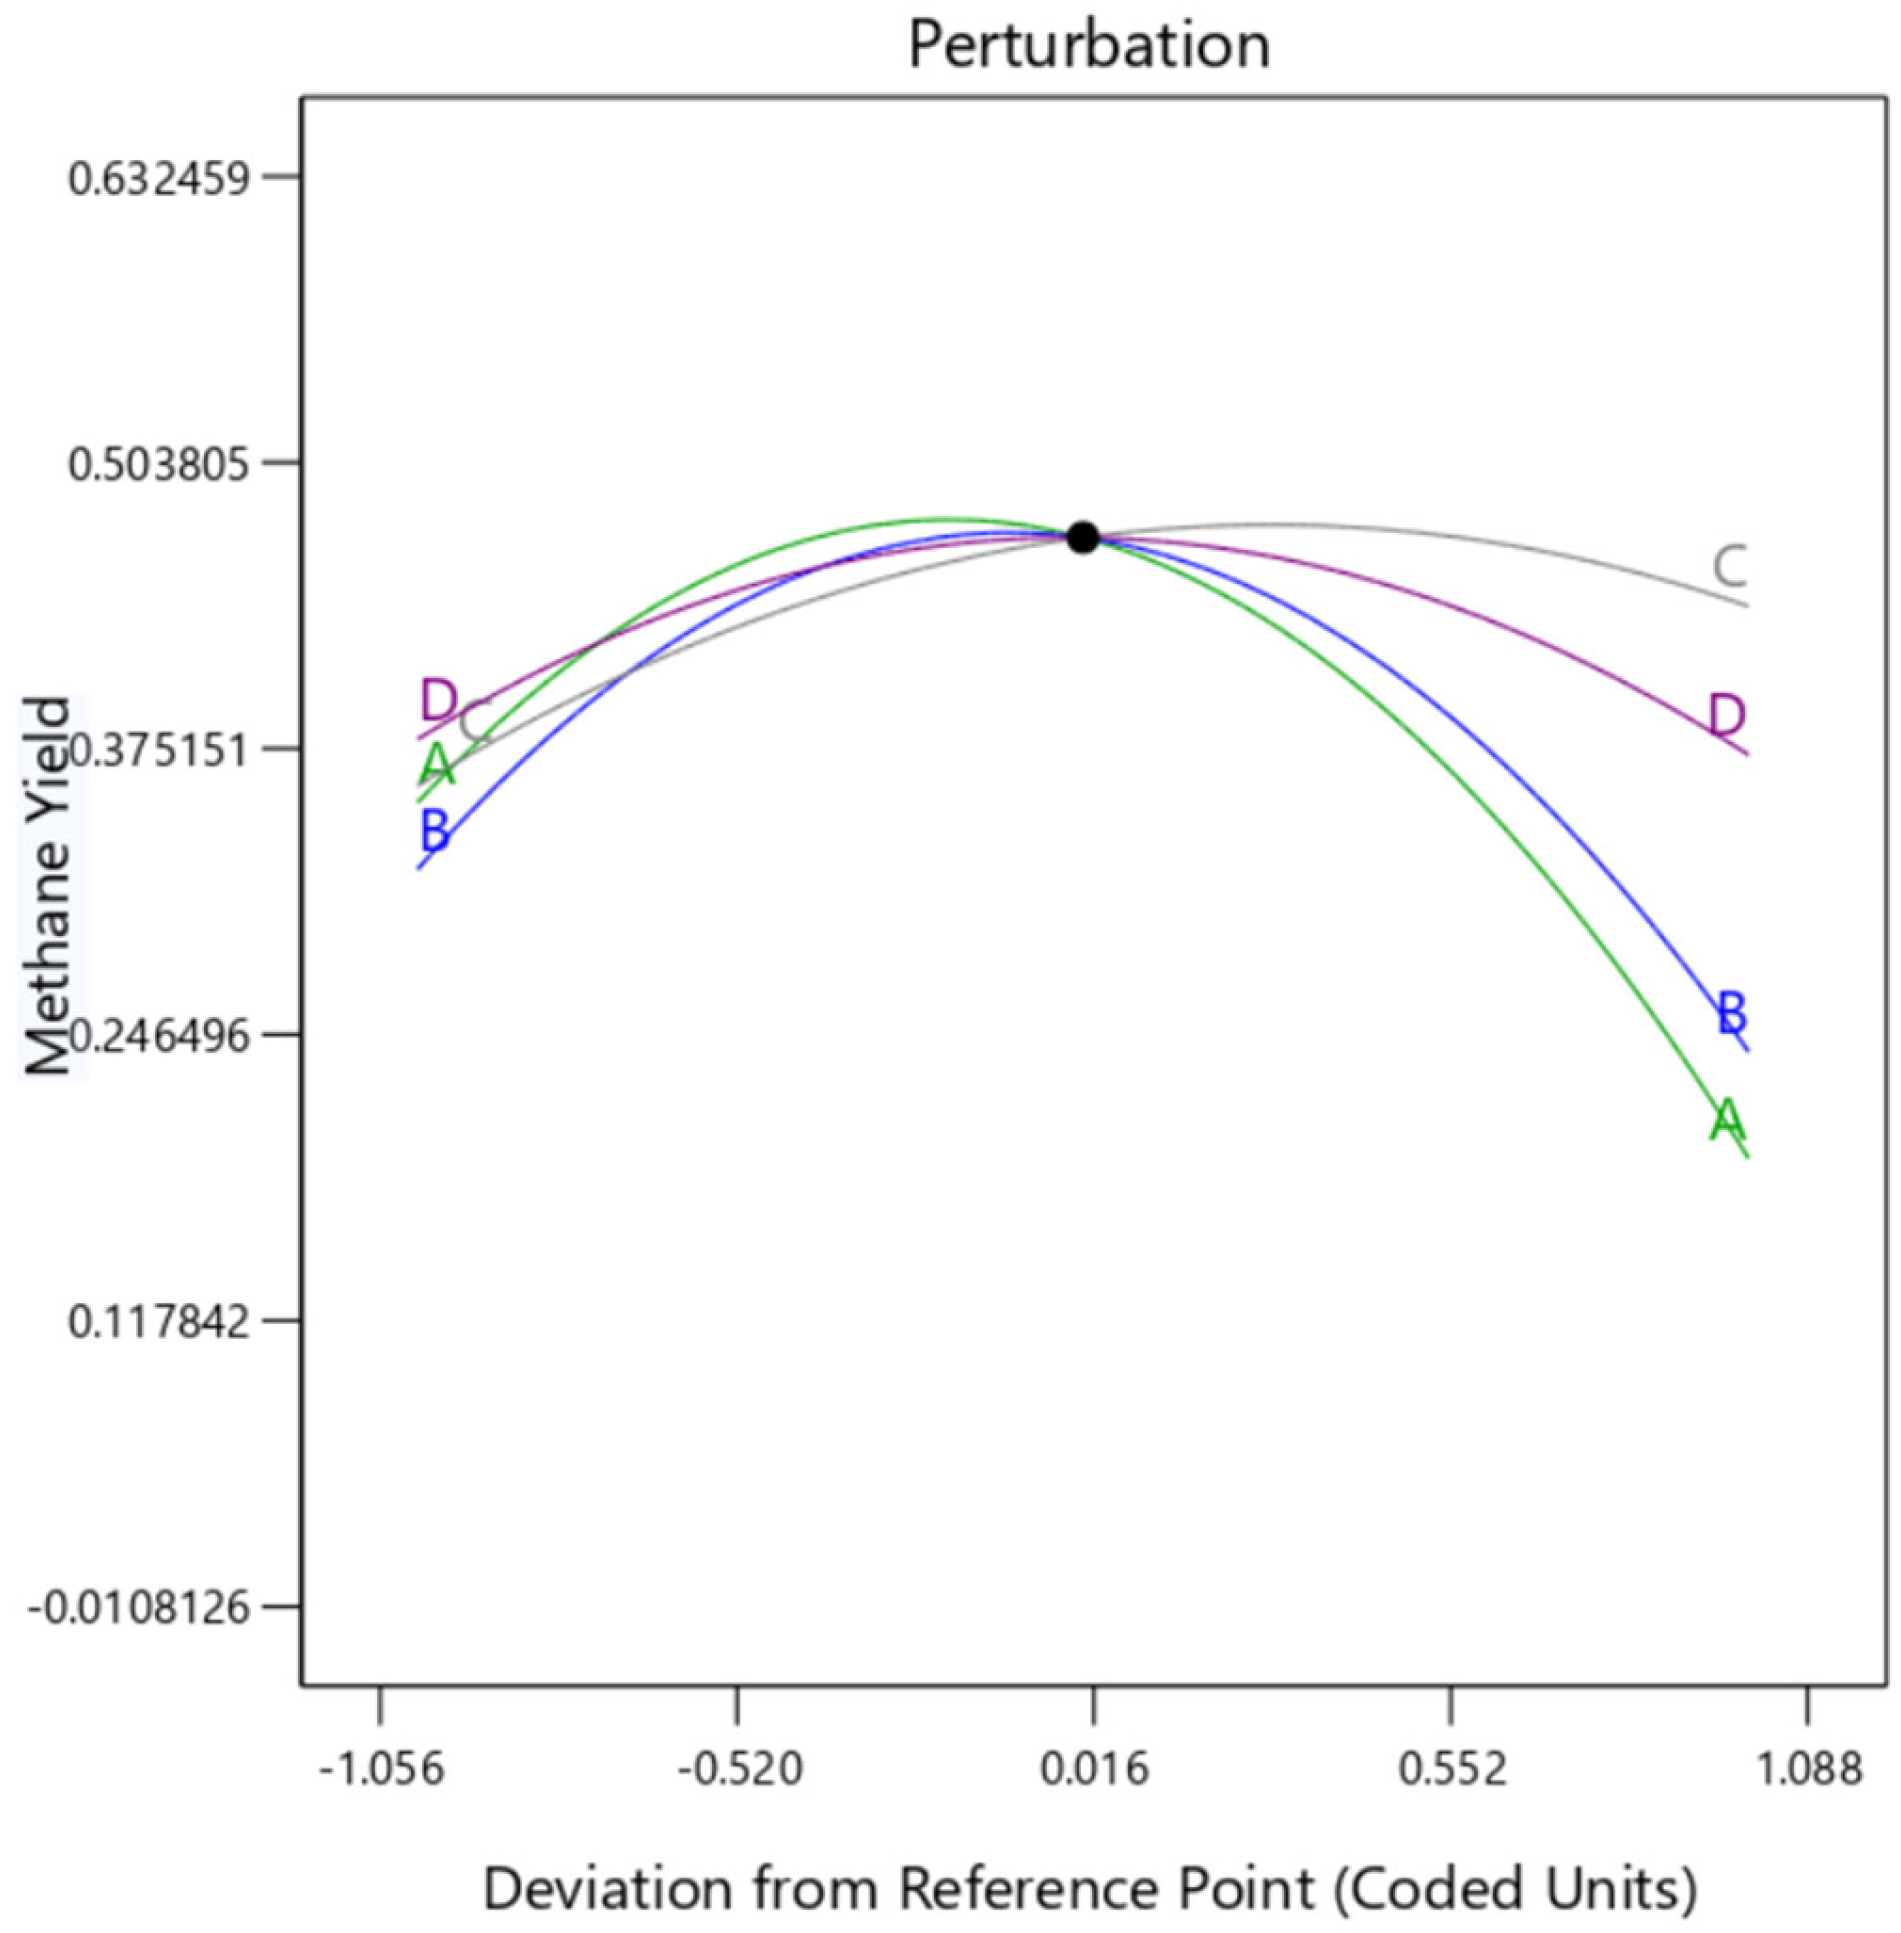
Sensitivity analysis is performed to determine the sensitive optimization parameter that has a significant impact on the responses. This is conducted by analyzing ANOVA results, box plots, and perturbation curves.
Lastly, optimization of the parameters for maximum methane yield is performed in the software. The optimized results were then compared with a similar set of historical data to ensure feasibility.

3. Results and Discussion

3.1. Comparative Analysis of Historical Data between Three Plants

3.1.1. Effect of OLR, Inlet TS, pH, and Temperature on Methane Yield of Three Plants

From Figure 3, it is shown that Plant C operates at the lowest OLR, around 0.3 to 0.6 kg/m3·day, Plant B operates at the OLR range between 0.6 to 1.7 kg/m3·day, whereas Plant A operates at the highest OLR ranging between 0.65 to 2. The three plants achieved their highest methane yield within the OLR range of 0.5 to 1 kg/m3·day, as indicated by the red circle with a dashed line in Figure 3.
In all three plants, an increase in OLR leads to a decrease in methane yield. This phenomenon is caused by the inhibition of biogas production at higher OLRs, which results in the accumulation of volatile fatty acids, lowering the pH and affecting methanogenic activity. Plant A exhibited the strongest correlation between OLR and methane yield, as evidenced by an R2 value of 0.6593.
According to Figure 4, Plant A has the lowest inlet pH of POME, followed by Plant B and then Plant C. Methane yield shows an increasing trend with the increase in inlet pH, indicating the value approaching neutral pH is favorable for methanogenic activity.
Figure 5 illustrates a consistent trend observed in all three plants, wherein there is a decline in methane yield with an increase in the total solids (TS) concentration in the raw POME. This can be explained by the poor performances of methanogenic bacteria due to high concentration of organic load [17]. Plant C was able to sustain a consistent methane yield within the range of 0.3–0.4 L/g CODremoved despite the variation in inlet TS concentrations, which were tested within the range of 25,000–40,000 mg/L. Both Plant A and Plant C achieved their highest methane yield at inlet TS concentrations ranging from 35,000 to 40,000 mg/L. Therefore, it can be inferred that the optimal inlet TS concentration for all three plants is approximately 35,000–40,000 mg/L.
Based on Figure 6, a negative correlation was observed between methane yield and inlet temperature in both Plant A and Plant B. The results showed that the methane yield was higher at lower temperatures, ranging from 30 °C to 40 °C, indicating that mesophilic methanogens are more efficient in the anaerobic digestion of POME than thermophilic methanogens. Although thermophilic methanogens have faster reaction rates, changes in environmental conditions, such as pH or total solids (TS) concentrations, may affect their performance.
It is worth noting that the temperature range between the mesophilic and thermophilic ranges, commonly referred to as the “thermophilic-mesophilic transition zone”, can have a detrimental effect on microbial activity and methane production. The temperature range of the transition zone varies, but it is typically between 40 °C and 50 °C [18]. Several studies have reported that microbial activity and methane production may decline in this temperature range due to reduced growth rates and metabolic activity of both mesophilic and thermophilic microorganisms.
Therefore, maintaining the appropriate temperature range is crucial to achieving optimal methane production in the anaerobic digestion of POME. However, it should be noted that the negative correlation observed between methane yield and inlet temperature in all plants had low R2 values, indicating that other factors besides temperature (i.e., inlet pH and OLR) may also influence the methane yield. Nevertheless, the trend of decreasing methane yield with increasing inlet temperature is consistent with the general understanding of mesophilic and thermophilic methanogens’ activity.

3.1.2. Effect of OLR, Inlet TS, pH, and Temperature on COD Removal of Three Mills

Several studies have demonstrated that higher OLRs reduce COD removal efficiency in wastewater treatment systems [19]. By increasing the OLR, the influent’s non-biodegradable organic load rises, which inhibits the growth and metabolic processes of native biomass. A similar trend is observed in Plant A and Plant C, as shown in Figure 7. In Plant A, it can be observed that the COD removal decreases from 94% to 91% with the increasing OLR from 0.655 kgCOD/m3·day to 2.162 kgCOD/m3·day. It is worth noting that the data provided for Plant C is limited to only 15 months, and hence, more data are required to draw a firm conclusion regarding the correlation between COD removal and OLR in this plant.
As depicted in Figure 8, no significant correlation can be observed between COD removal and inlet pH in all three plants. This implies that the impact of inlet pH on COD removal may not be substantial as long as the pH value falls within the acceptable range of 3.9–5.3. This finding could be beneficial for palm oil mills since no additional costs would be incurred to adjust the pH of the raw POME before anaerobic digestion. However, more data would be required to establish a more conclusive relationship between inlet pH and COD removal.
Similar to the biogas production (Figure 7), high total solids (TS) concentration in the POME can also have a negative impact on the COD removal performance of anaerobic digestion. As shown in Figure 9, this trend is observed in Plants A and C, where COD removal decreases with increasing inlet TS levels. However, the inlet TS concentration of raw POME cannot be controlled in the plant, so if the TS concentration is too high, it may be necessary to lower the organic loading rate (OLR) to ensure optimal COD removal performance. Additionally, it is interesting to note that Plant B shows a different trend compared to Plants A and C. In Plant B, COD removal increases with increasing inlet TS concentration, indicating that this plant can tolerate higher levels of TS ranging from 35,000 to 60,000 mg/L while still achieving high COD removal rates of 92–96%. This suggests that different anaerobic digestion systems may have varying tolerance levels to TS concentrations, and further research may be needed to investigate this relationship.
From Figure 10, it can be observed that the COD removal has a negative correlation with the inlet temperature, with this trend being more apparent in Plants A and C as compared to Plant B. This negative correlation could be attributed to the potential negative impact of high inlet temperature on the overall microbial activity and the effectiveness of the anaerobic digestion process. As discussed earlier in Section 3.1.1, the methanogen operating at the temperature in the transition zone (around 40–45 °C) can perform poorly, leading to lower COD removal. Additionally, the longer retention times in Plants A and C may also contribute to better COD removal performance at lower temperatures. Plant B was able to consistently achieve a high COD removal efficiency of 92–96%, despite receiving POME at an average inlet temperature of 45.8 °C and experiencing a wide range of inlet temperatures from 36 to 50 °C. This suggests that Plant B’s anaerobic digester is able to withstand temperature fluctuations and effectively remove COD from the POME, which may be attributed to the type of anaerobic microorganisms present in the digester, as well as proper mixing and hydraulic retention time.

3.1.3. Overall Comparison of the Performances of Three Plants

Figure 11 depicts the average methane yield of three plants over a period of three years. Plant A shows an increasing trend in methane yield over the years, while Plant B and Plant C have relatively higher methane yields than Plant A, which remain stable over two years of operation. According to the plant personnel, the high methane yield in Plant B and Plant C is attributed to the proper mixing in the digester, as evidenced by the higher number of influent distribution pipes to the digester. Mixing facilitates heat transfer and improves contact between the active biomass population and the feed, resulting in increased biogas production. Adequate mixing also minimizes the accumulation of surface scum layers and sludge at the bottom of the tank [20].
Figure 12 shows the average COD removal for three plants over the years. It is observed that the COD removal efficiencies are stable, ranging between 91.8% and 94.7% for all plants. Plant B achieved the highest COD removal of 94.7% in the year 2020. Similar to the methane yield, COD removal in Plant A shows an increasing trend over the three years of operation.
Additionally, Plants B and C demonstrate better methane yield and COD removal performance than Plant A due to the relatively lower organic loading rate (OLR) applied in their plants (0.3–1.7 kg/m3·day), as mentioned in Section 3.1.1. However, operating the anaerobic digester at low OLR is considered inefficient in terms of capacity and investment of the treatment facility, and high OLR can lead to poor anaerobic effluent quality due to the hydraulic overload imposed on the anaerobic microorganisms. Therefore, it is essential to establish an appropriate range of OLR to achieve high COD, TSS, and TS removals without causing digester instability.
Besides, the high performances achieved in Plants B and C are also closely associated with their operating temperature and pH in the anaerobic digester. The three plants were very similar in their outlet pH. In particular, the anaerobic digester in B is operating at the optimum temperature of 35 °C and pH of 7.2, which provides the optimum environmental conditions for the methanogen to convert the COD to methane. This is exceptionally important as failure to control pH and temperature in the optimal range can result in biomass washout with accumulation of volatile fatty acid due to inhibition of methanogenesis.

3.2. ANOVA Analysis

ANOVA analysis is conducted to determine the statistical significance of the independent variables and the overall significance of the model, as the R2 obtained previously was low (Section 3.1). R2 alone does not provide information about the significance of the model, so ANOVA is needed to further analyze the impact of the independent variables, including inlet pH, inlet temperature, and OLR, on methane yield and COD removal.
Plant A was selected for further analysis due to the availability of more comprehensive data covering a period of three years, which provides a better basis for conducting ANOVA and optimization compared to the relatively limited data available for Plants B and C.

3.2.1. Methane Yield

The ANOVA for the response surface quadratic model of methane flow is summarized in Table 3. With a 95% confidence level, the response model is highly statistically significant. The model is significant, as shown by the F-value of 7.64. Since the p-value is 0.0003, there is only a 0.03% possibility that noise might be the cause of such a huge F-value.
Moreover, it is observed that only OLR (A) is a significant model term with p = 0.0017. Inlet TS (B) and Inlet pH (C) are weakly significant models, with a p-value between 0.06 to 0.07. Among the interactive parameters, only A2, B2, C2, and D2 are significant. Models with p > 0.10 are not significant. Even though Inlet Temperature (D) was found to be not significant, its squared term D2 had a significant impact, which suggests that it might be worth including inlet temperature (D) in the optimization analysis, particularly in combination with other parameters. As a result of these findings, the optimization analysis will include OLR, inlet TS, inlet pH, and inlet temperature (D).
The standard deviation (SD) is calculated to be 0.0719. The coefficient of variation (CV) and coefficient of determination (R2) are used to assess the model’s fit and accuracy. The lower CV value obtained indicates higher reliability [16]. The CV obtained for the methane flow model is 29.91%. In addition, the obtained R2 is 0.8843. This demonstrates that the simulation results are close to the predicted response.
The adjusted R2 obtained is 0.7685. It gauges how much the model’s mean is deviated from. The model is adequate if R2 and adjusted R2 are close to each other [16].
The predicted R2 obtained is 0.3334. This showed how accurately the regression model predicted the outcome of the new observation [16]. However, the difference between the predicted R2 value and the adjusted R2 is greater than 0.2, indicating a possible block effect with the data. Furthermore, good precision assesses the signal-to-noise ratio. The model can be used to navigate the design space if the ratio is greater than 4, which is the desired value. In this case, the value obtained is 9.8018.
Equation (1) illustrates the regression equation for methane yield in terms of coded components.
Methane   Yield   =   0.47 0.08 A 0.041 B + 0.0403 C 0.0035 D + 0.0038 AB 0.0007 AC 0.005 AD 0.0285 BC 0.0117 BD + 0.0517 CD 0.1992 A 2 0.1902 B 2 0.0712 C 2 0.0943 D 2
Equation (2) represents the reduced regression equation, as the model terms D, AB, AC, AD, BC, BD, and CD were found to be statistically insignificant (Table 3).
Methane   Yield   = 0.47 0.08 A 0.041 B + 0.0403 C 0.1992 A 2 0.1902 B 2 0.0712 C 2 0.0943 D 2

3.2.2. COD Removal

ANOVA results showed that the response surface mean model is recommended for COD removal. Table 4 summarizes the ANOVA of the mean model for COD removal.
Lack of fit is the amount of the model predictions miss the observations. The F-value for the lack of fit is 1.14, which suggests that it is not significant in comparison to the pure error. The p-value is 0.5099, which means there is a 50.99% possibility that noise might be the cause of such a large lack of fit f-value. In other words, a non-significant lack of fit is favorable as we want the model to fit [21].
The mean model fits the response well, indicating that the trend between COD removal and the input parameters is not found; therefore, a mean value is used to perform the ANOVA test. The mean value of COD removal is found to be 93.43%.

3.3. Sensitivity Analysis

3.3.1. Methane Yield

Figure 13 shows the perturbation plot of the methane yield and the input parameters. It is useful for comparing the effects of all factors at a specific point in the design space. The response is plotted by varying only one factor over its range while holding all other variables constant. From Figure 13, it can be observed that the OLR (A) curve has the steepest curvature and covers the highest range across the y-axis, showing that it has the greatest impact on methane yield, followed by Inlet TS (B), Inlet pH (C) and Inlet temperature (D) both have similar amount of impact on methane yield. It is important to note that extrapolation is not recommended for the statistical models depicted in Figure 13, and these models should only be used within their domain of validity to ensure reliable and accurate results.
Figure 14 and Figure 15 are box plots of methane yield and different input parameters. In all 4 box plots, the central value (0) plot has the greatest interquartile range, indicating scattered data.
Figure 14a is a box plot of methane yield (%) at three different values of OLR. OLR (A) is a significant model term with a p-value of 0.0017, indicating that at least one of the groups has a significant difference. In this case, OLR of 2.4 (upper limit) is the group with a significant difference, as the box does not overlap with other groups. The central value OLR (1.6) has the highest mean methane yield, whereas the upper limit OLR (2.4) has the lowest mean methane yield among the other mean values. It also has the smallest interquartile range, indicating accurate data.
Figure 14b is a box plot of methane yield (%) at three different values of inlet TS. The p-value is 0.0682, indicating a weak significance between the groups. The upper limit inlet TS concentration (86,290) gives the lowest mean methane yield and smallest interquartile range, similar to Figure 14a. These findings provide strong evidence that the observed decrease in methane yield at high OLR and inlet TS concentrations is due to the inhibition of methanogenic activity. This result is consistent with the previous analysis conducted in Section 3.1.1.
The box plots presented in Figure 15 indicate insignificant differences between the groups. Nevertheless, it is important to note that the mean values in both box plots provide valuable insights. The mean methane yield exhibits an increasing trend with increasing pH values. Moreover, the highest mean methane yield is observed at an inlet temperature of 41.55 °C. These findings are consistent with the theoretical effects of pH and temperature on methane yield.
However, there are discrepancies between the results obtained from RSM and box plot analysis, which may arise due to inherent differences in the two methods and their ability to capture different aspects of the data or have different assumptions. RSM is a regression-based statistical approach that considers the relationship between input factors and response variables using a mathematical model, allowing for the consideration of non-linear effects and interactions among factors. On the other hand, box plot analysis is a graphical technique that provides a visual representation of data distribution and central tendency without explicitly modeling the relationships among variables.
This discrepancy between the results of RSM and box plot analysis may suggest that there could be other factors or mechanisms not accounted for in the linear model in Equation (1) that are influencing the observed relationship between inlet pH and inlet temperature with methane yield. For example, there may be interactions or higher-order effects involving inlet pH or inlet temperature that are not considered in the linear model but are evident in the box plot analysis. Further investigation may be needed to understand and reconcile the differences between the two methods to gain a comprehensive understanding of the relationship between inlet pH, inlet temperature, and methane yield.
Figure 16a shows a 3D surface plot that illustrates the quadratic effect of OLR and inlet TS on methane yield. The plot indicates that the highest methane yield can be achieved by utilizing an optimal combination of OLR and inlet TS, which are 1.6 kg/m3·day and 48,410 mg/L, respectively. On the other hand, the results in Figure 16b,d,f suggest that inlet pH has a positive quadratic effect on methane yield, with the highest yield obtained at an inlet pH of 5.3. This indicates that low pH conditions do not facilitate methane yield in anaerobic digestion.
Figure 16c,e,f suggests that inlet temperature has a relatively insignificant quadratic effect on methane yield compared to other input parameters, indicating that its impact is weaker than that of OLR and inlet TS.

3.3.2. COD Removal

Since the COD removal data fit a response surface mean model, the use of perturbation plots and response surface curves is not required. Instead, the sensitivity analysis of the input parameters and their effect on COD removal can be conducted by analyzing the box plots of the input parameters, as shown in Figure 17.
The box plots use the three values from the range of inputs as y-axis, which, from left to right, are the lower limit (−1), central value (0), and upper limit (1). In Figure 17a, the variance in OLR values is slightly significant to COD removal. The central OLR value (1.6) gives a lower COD removal than the other values. The plots in Figure 17b–d showed that inlet TS concentrations, inlet pH, and temperature are insignificant model terms for COD removal.

3.4. Optimization Analysis

Table 5 displays the optimized values obtained from the Design-Expert software, with a desirability of 0.875. This indicates that the software was able to find the best combination of variables that would produce the desired results with a high level of accuracy. The methane flow specification is set to “maximize”, as it is the primary source of revenue for the plant. Meanwhile, COD removal efficiency is set to “in range”, with a lower priority, given that further treatment stages (i.e., aerobic treatment) could remove additional COD. The optimized OLR is 1.23 kg/m3·day, which increases biogas production while ensuring complete organic matter degradation. The optimized inlet TS concentration is 46,014 mg/L, providing sufficient nutrients for methanogens while optimizing biogas production. Inlet pH and temperature of 4.5 °C and 45.4 °C, respectively, are suitable for mesophilic digestion. The optimized temperature is similar to other anaerobic digestion optimization results [8]. The optimized factors enable the anaerobic digester in Plant A to achieve a methane yield of 0.477 m3/kg COD removed and COD removal of 93.4%.
The optimization results are compared with a set of data recorded in Plant A, with similar inlet TS, pH, and temperature values. The data set has an OLR of 1.501 kg/m3·day. It is shown in Table 6 that by lowering the OLR to 1.23 kg/m3·day, methane yield can be improved by 39.6%. The plant can increase its revenue through the increase in methane produced. The COD removal efficiency is comparable before and after optimization.

3.5. Interpretations and Validation of the Results

It is shown in Figure 3 that the variations of OLR in Plant B are significant. This is mainly caused by the irregular daily feeding of the raw POME. Moreover, excessive sludge washout is observed quite frequently in Plant A and Plant B due to the irregular feeding of POME, which creates shock loading to the sensitive methanogenic bacteria. Sludge washout results in the production of foam and inversion of the digester profile.
Regular feeding of POME to the anaerobic digestor would give a more stable pH, biogas production, and methane content of the biogas [22]. Hence, it is recommended to perform uniform feeding to maintain stable biogas production and reduce shock loading. Moreover, an increase in the POME feed flow rate enables the rise the biogas production in anaerobic reactors [23].
The data analysis and optimization in this study is only conducted on Plant A. Therefore, the optimization results are exclusive to the plant only. This study used a set of raw data from commercial plants; thus, it is more realistic than other studies that use synthetic, simulation, or lab-based data. However, there may be uncertainties due to external factors that vary. To prove the feasibility of using the optimized variables for commercialization purposes, further evaluation was conducted on the optimization results.
To validate the optimal combination of variables, confirmatory experiments were performed using the optimized variables for a period of 2 months. The accuracy of the predicted performance at the optimal condition was assessed by calculating the error and standard deviation for each response. The results of the experiments conducted within the optimal conditions are presented in Table 7. The percentage error differences between the experimental and predicted values shown in Table 7 ranged from 0.03% to 6.52%, indicating that the experimental findings were in close agreement with the model prediction. Therefore, the developed model was found to be accurate and reliable. However, it should be noted that the predicted values are based on the full Equation (1), which includes all the terms, regardless of their statistical significance. Nevertheless, the minimal contribution of these insignificant terms to the overall prediction can be inferred from their small coefficients. Therefore, it is unlikely that the predicted values obtained from the full Equation (1) and the reduced Equation (2), which only includes significant factors, would exhibit significant differences, as the small coefficients of insignificant factors are unlikely to have a substantial impact on the overall prediction.

4. Conclusions

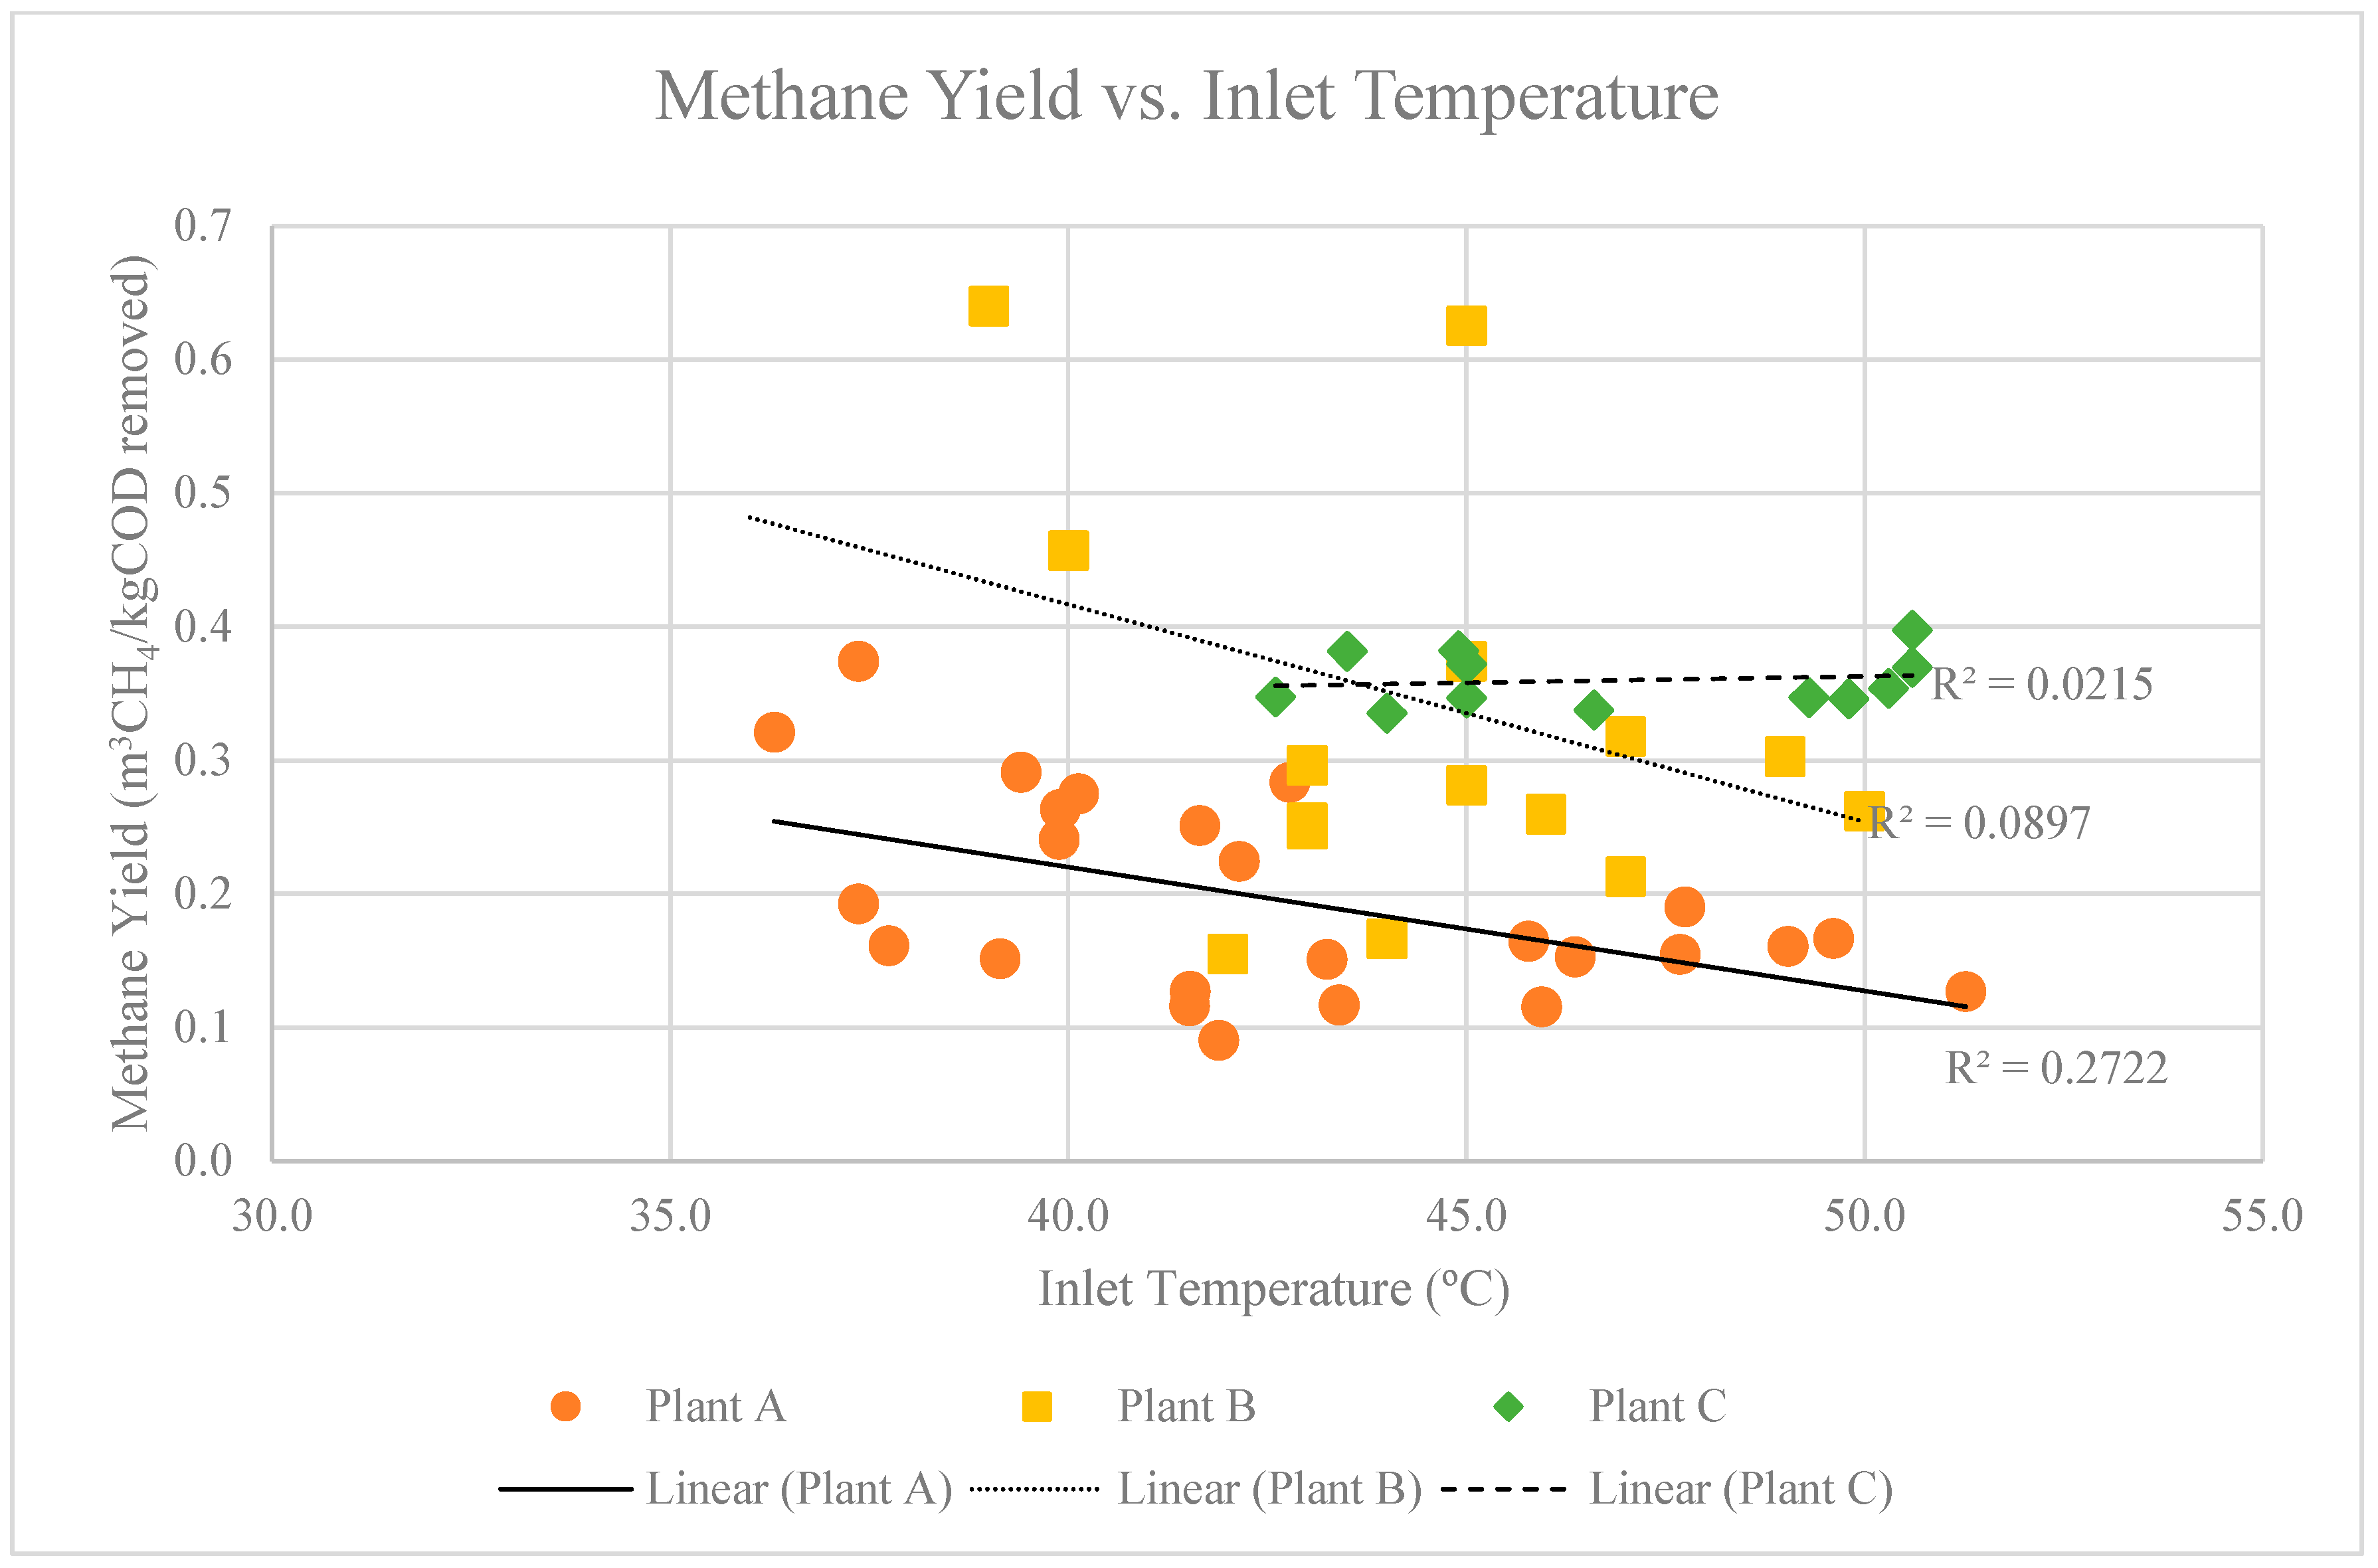
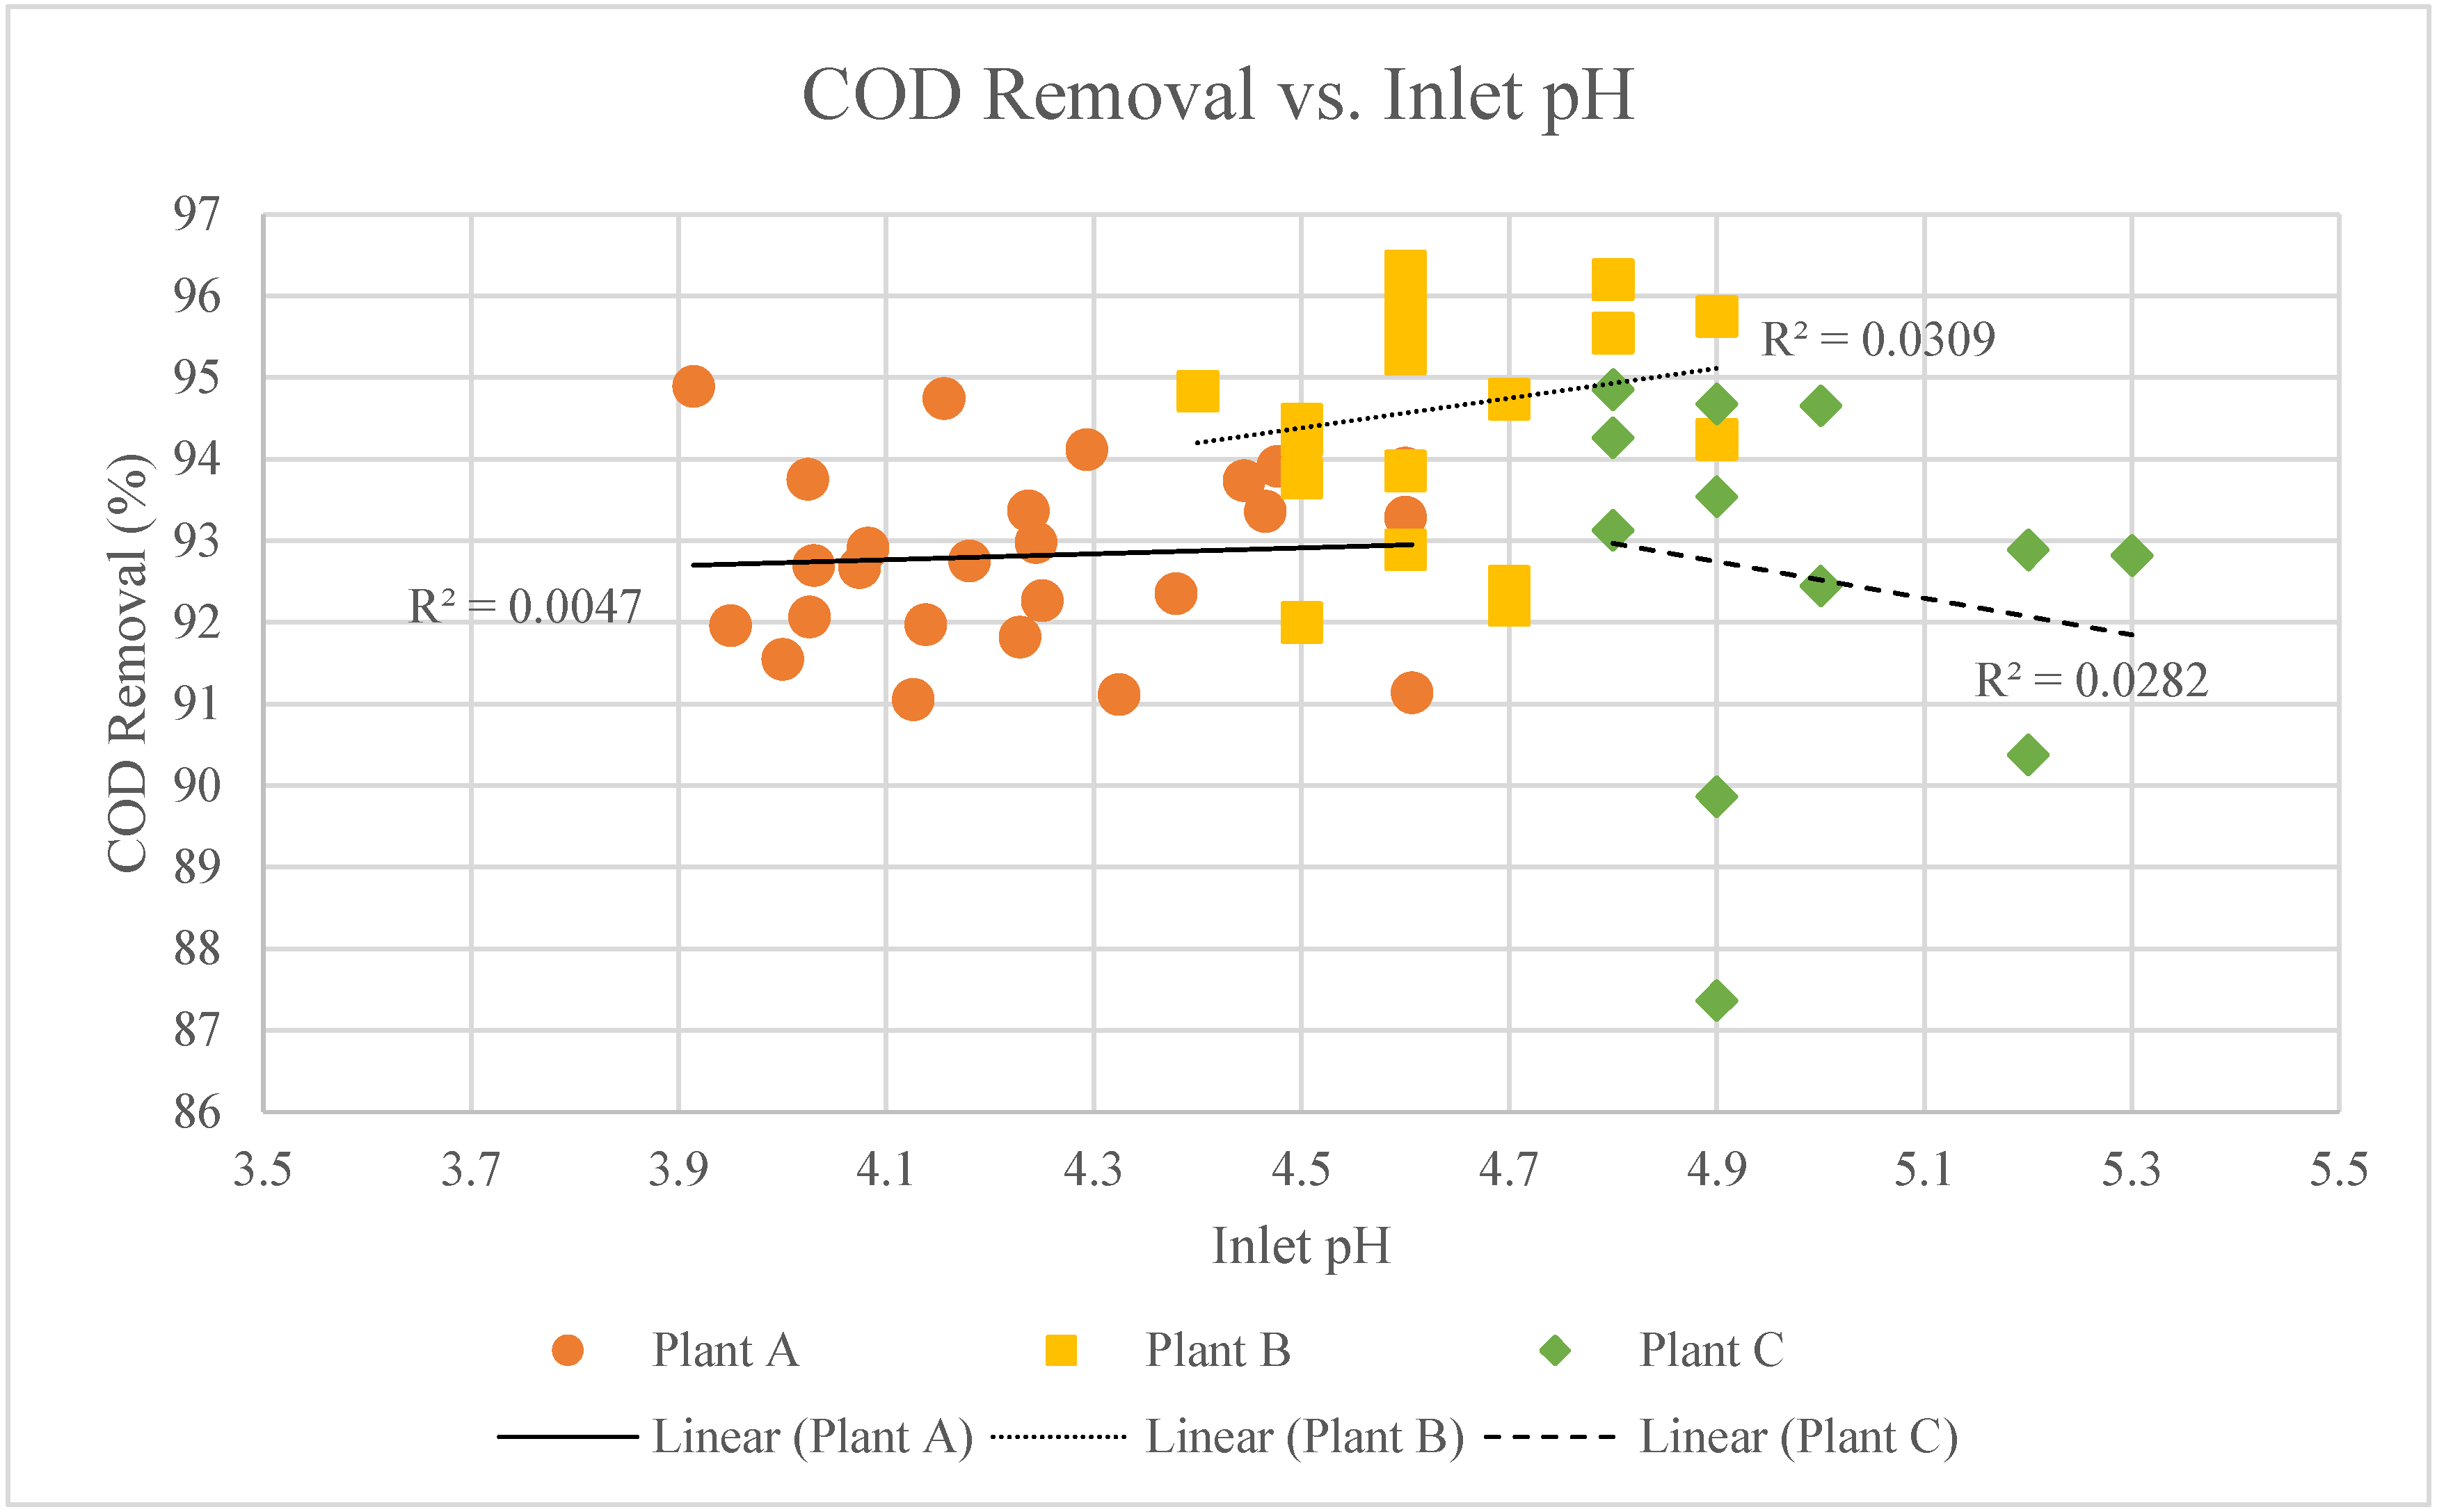
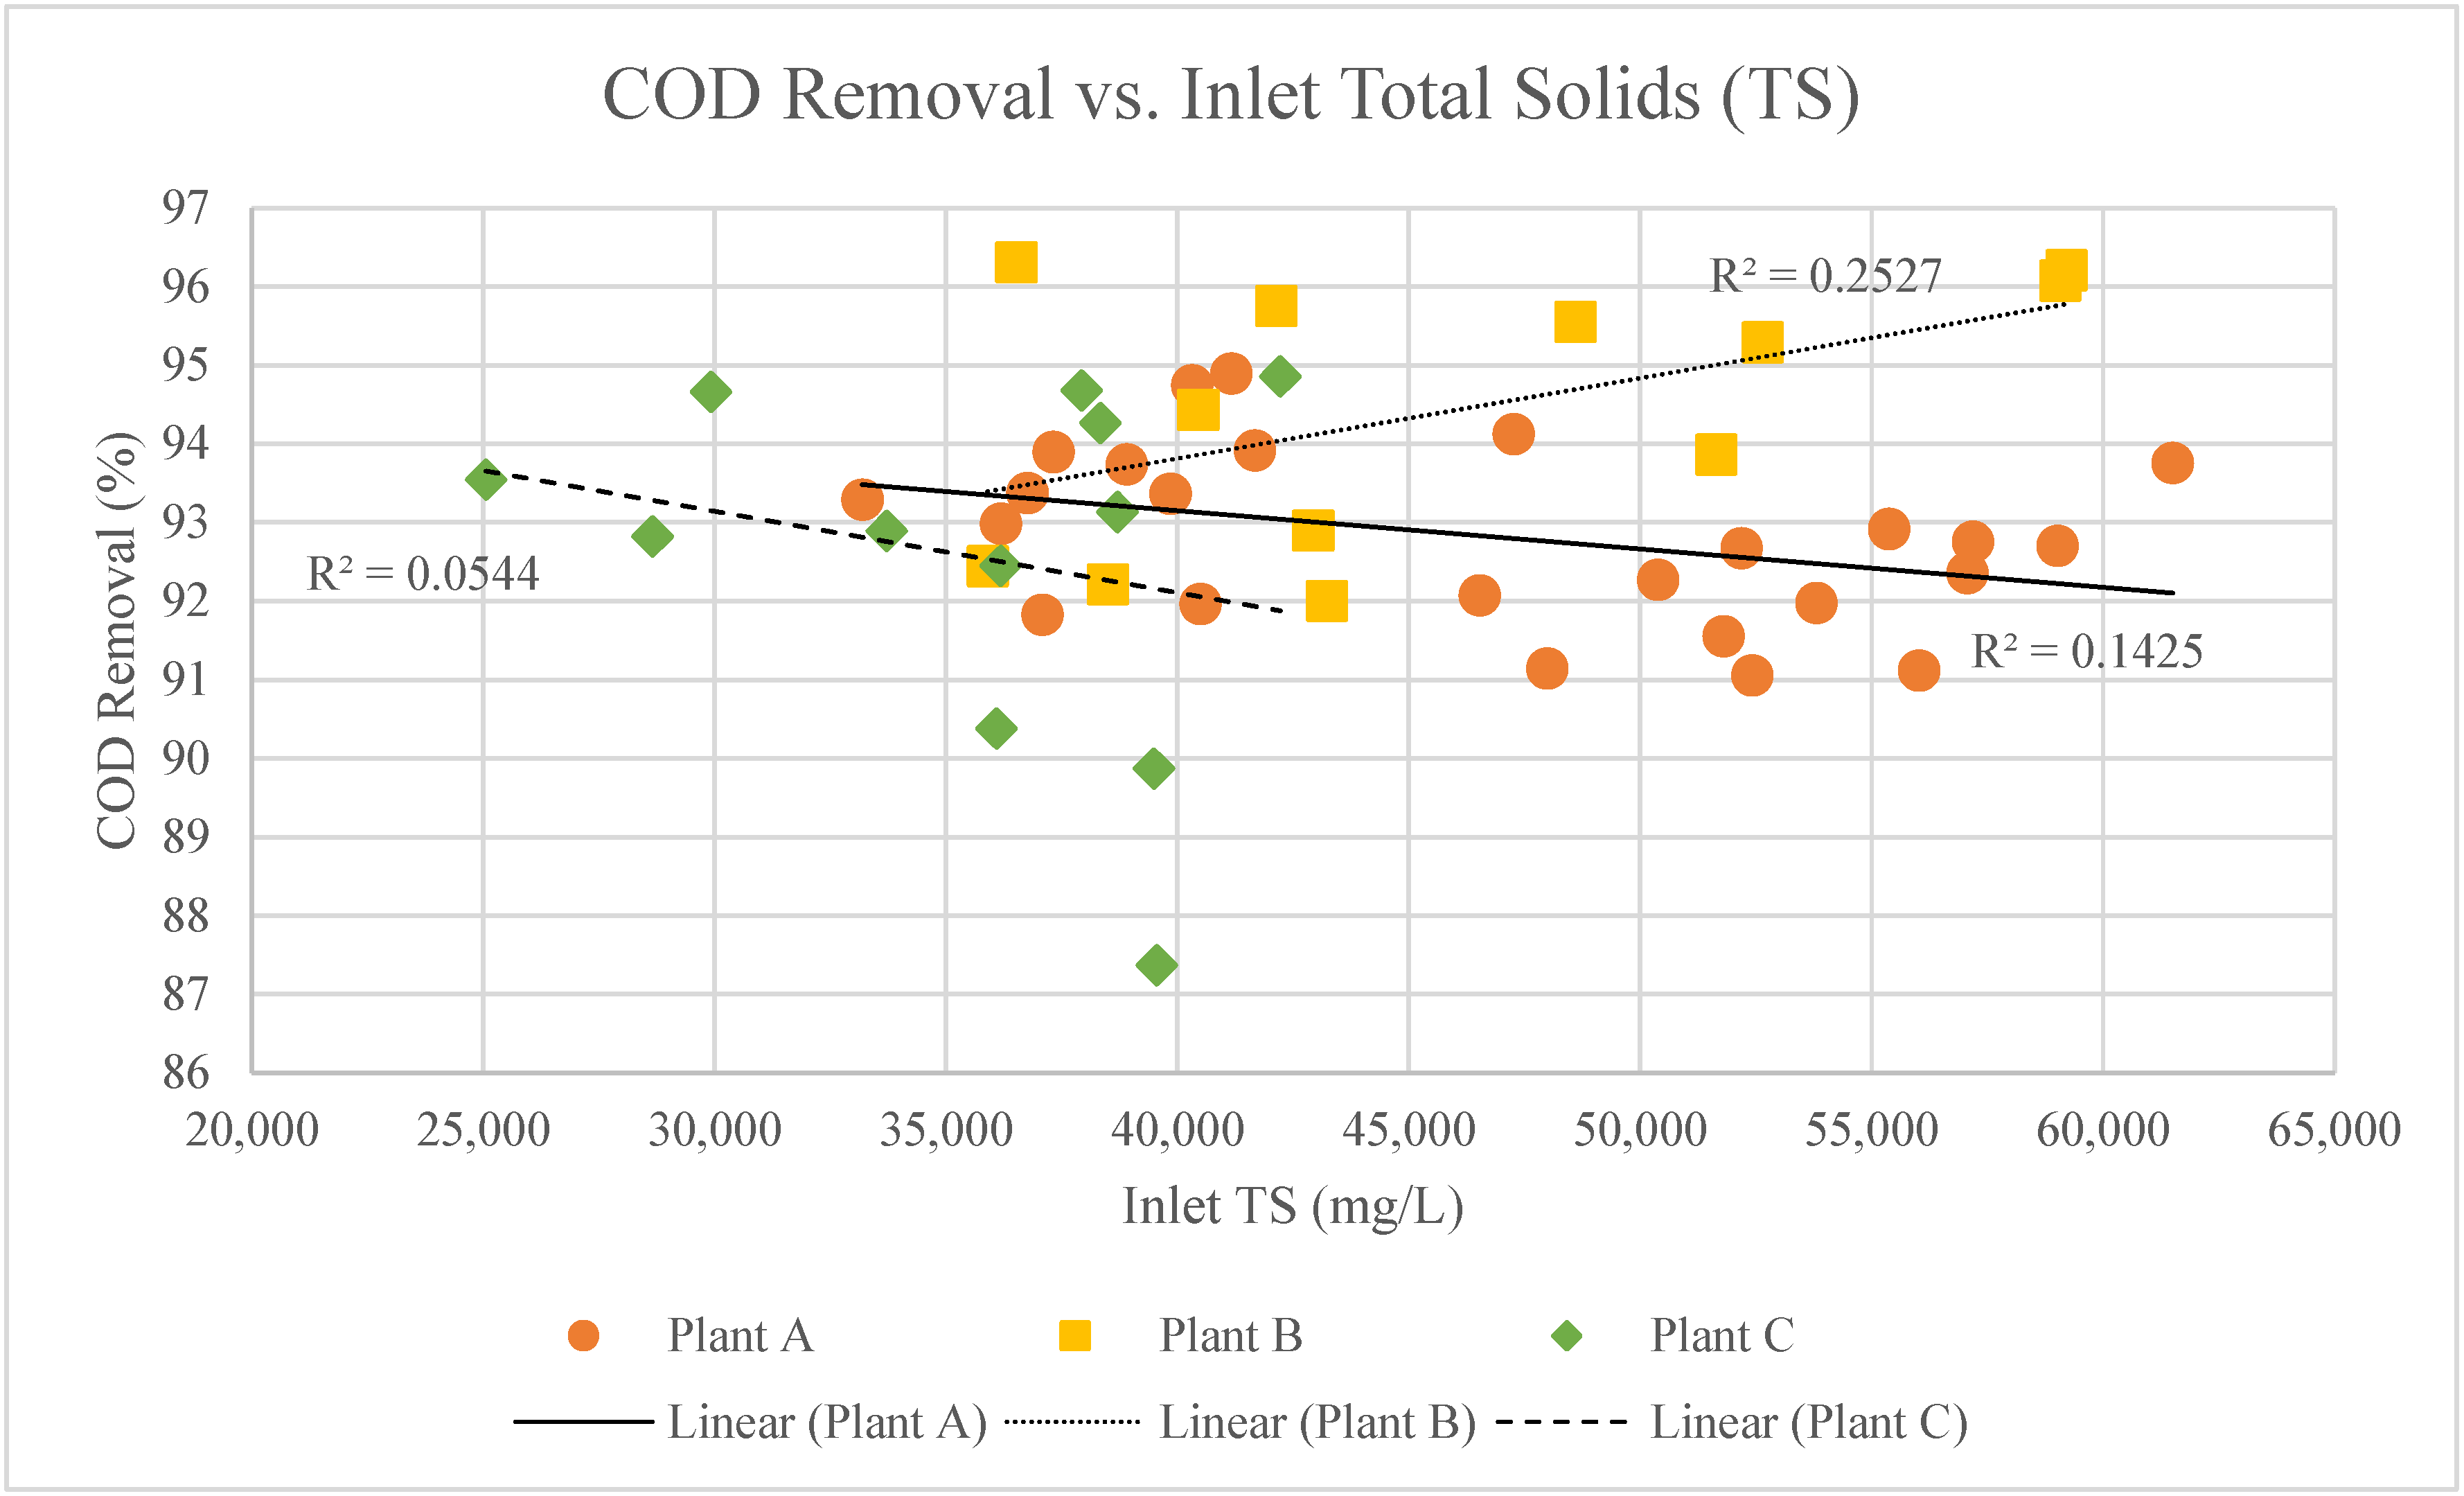
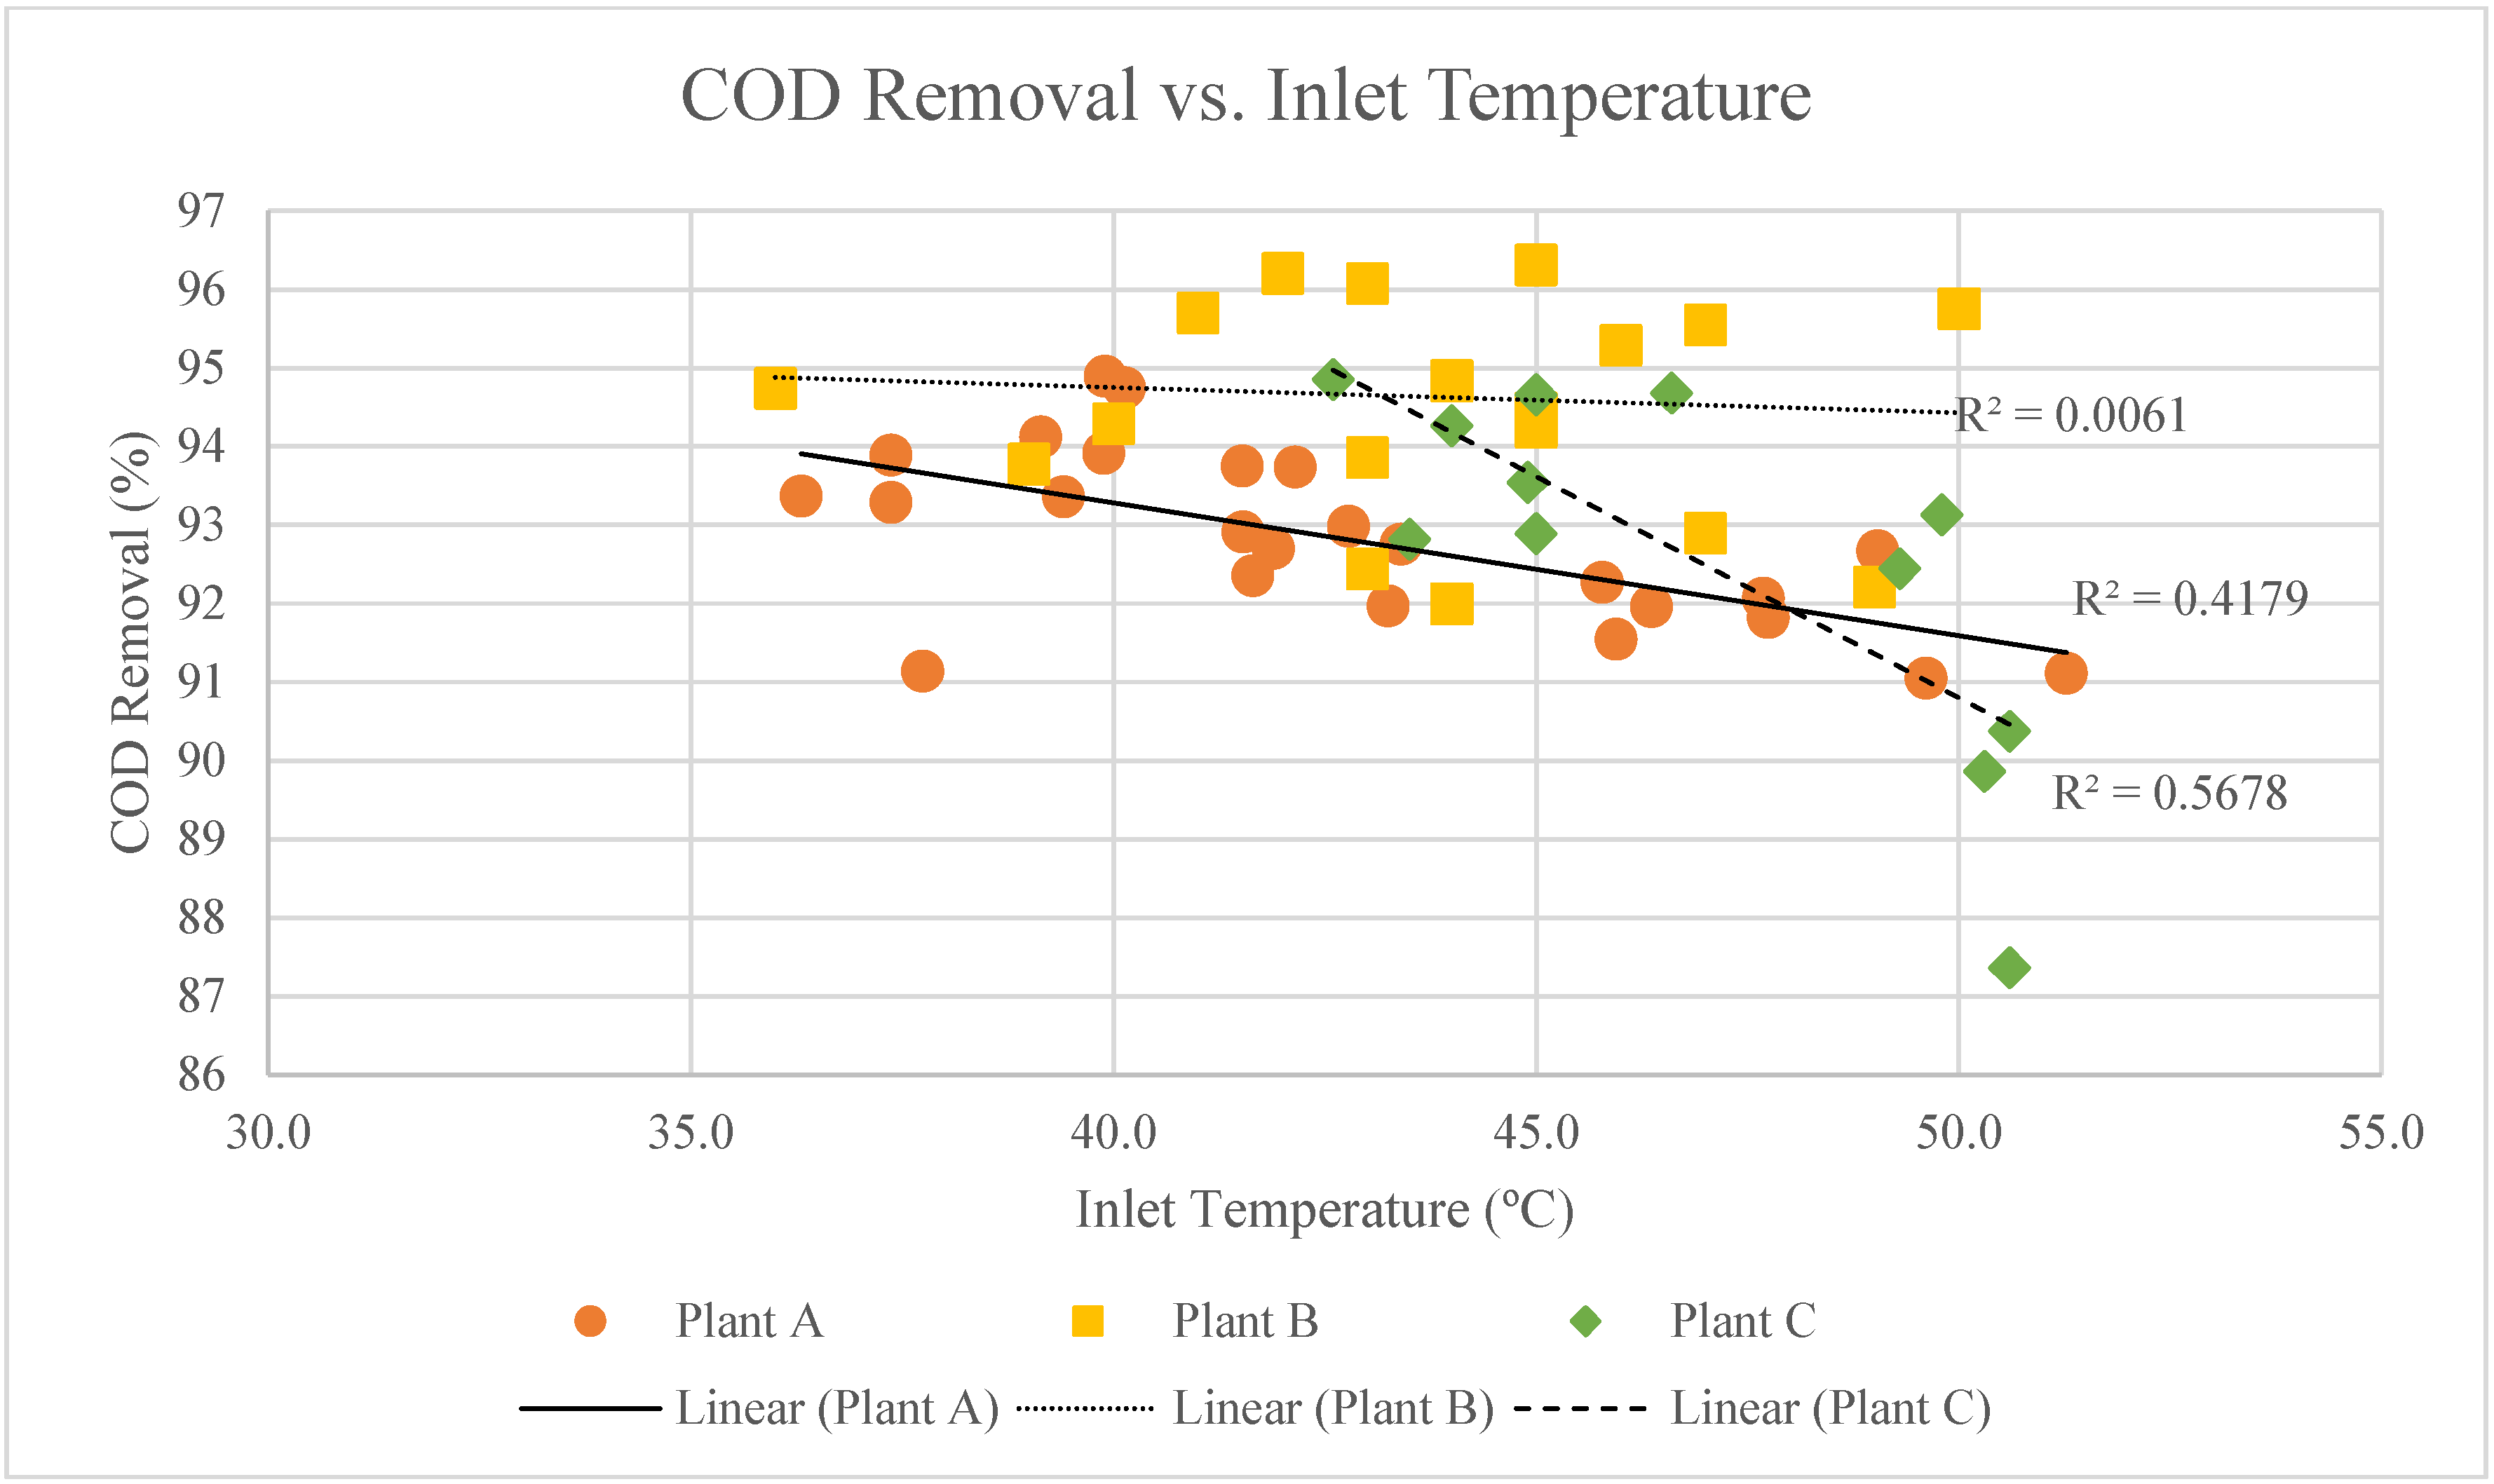
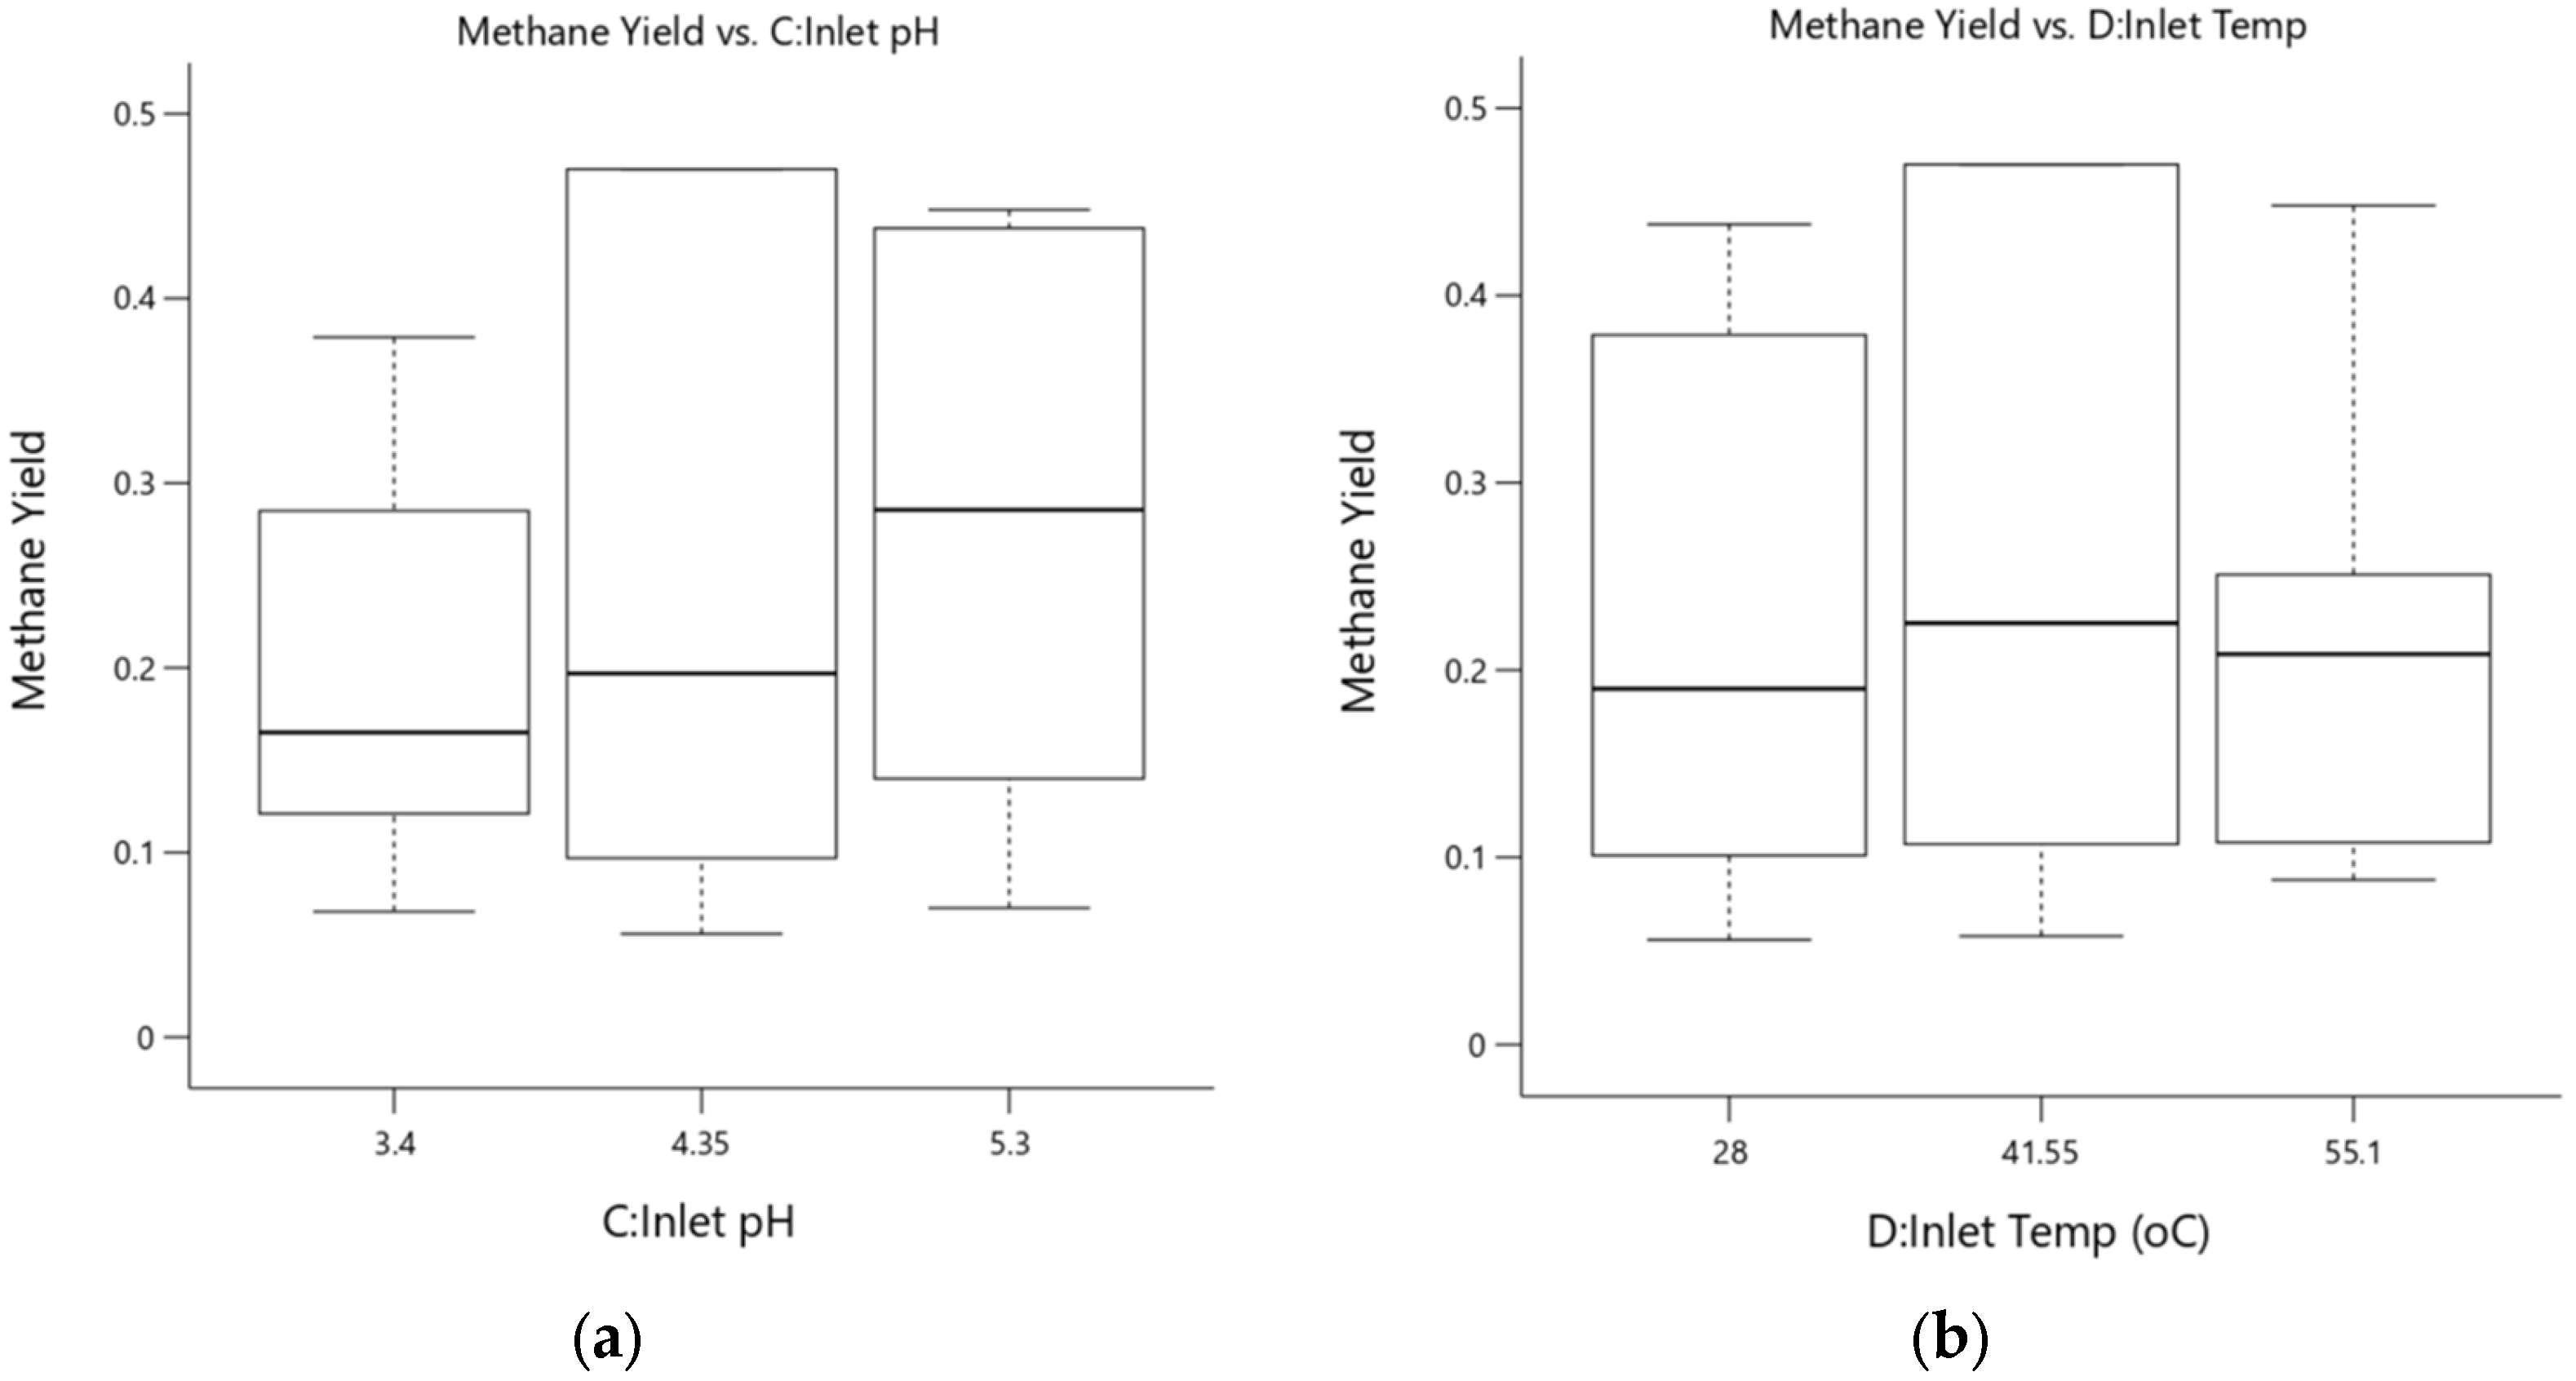
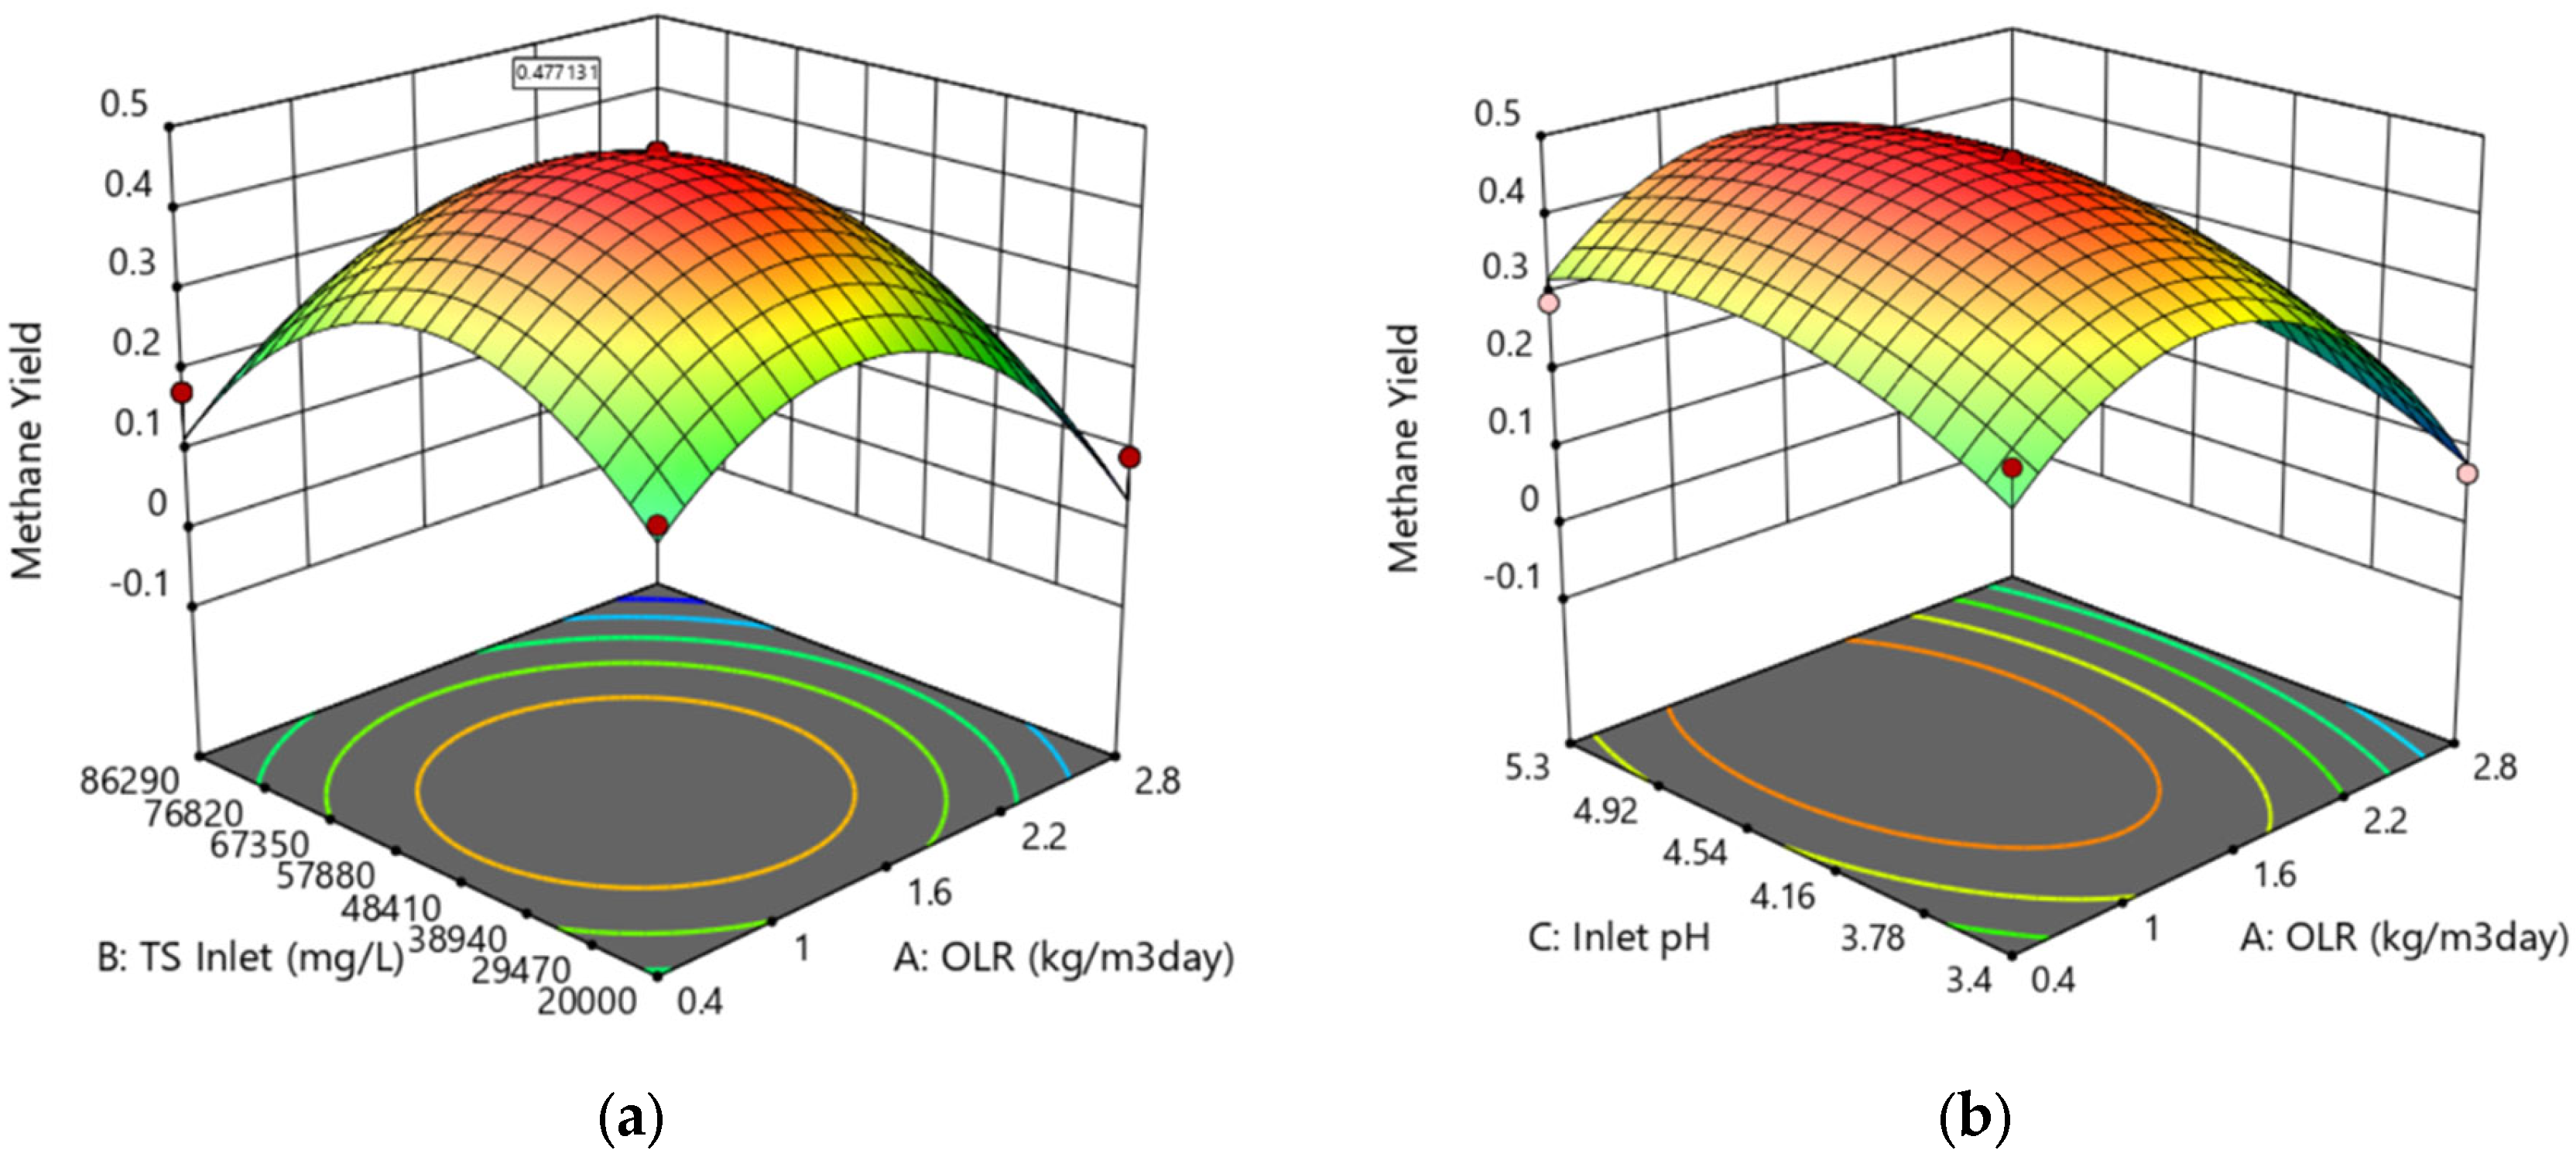
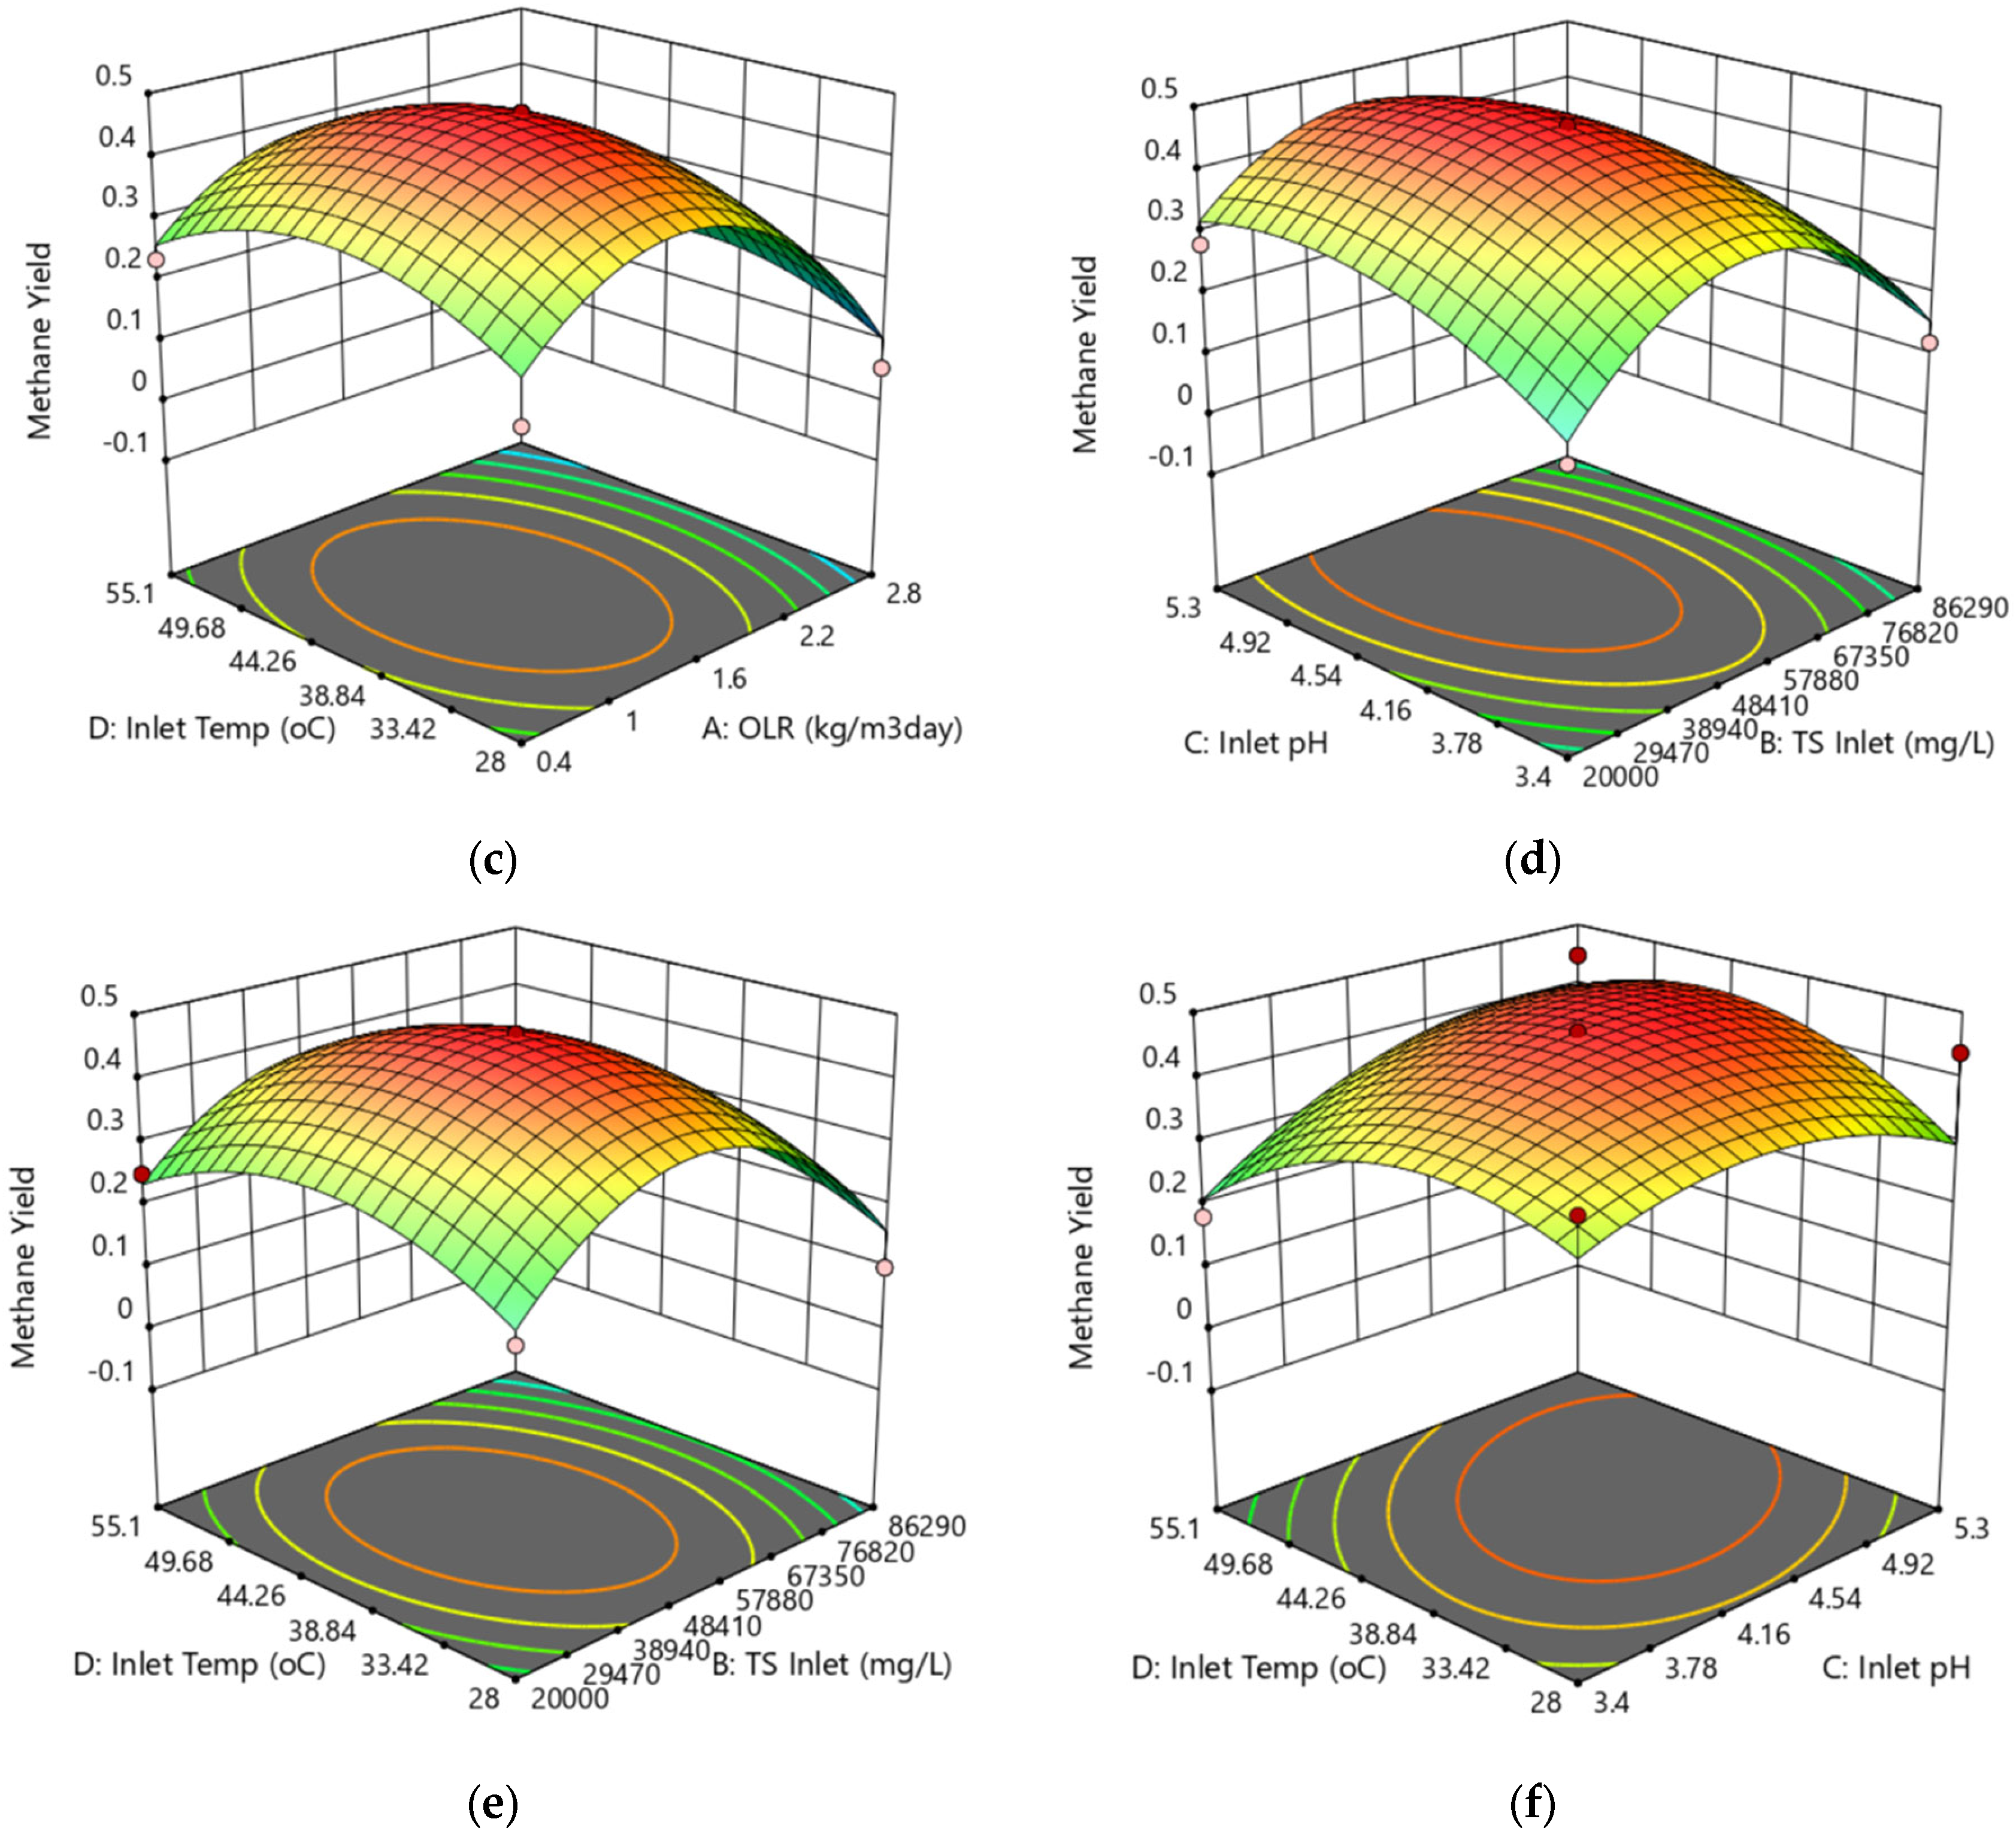
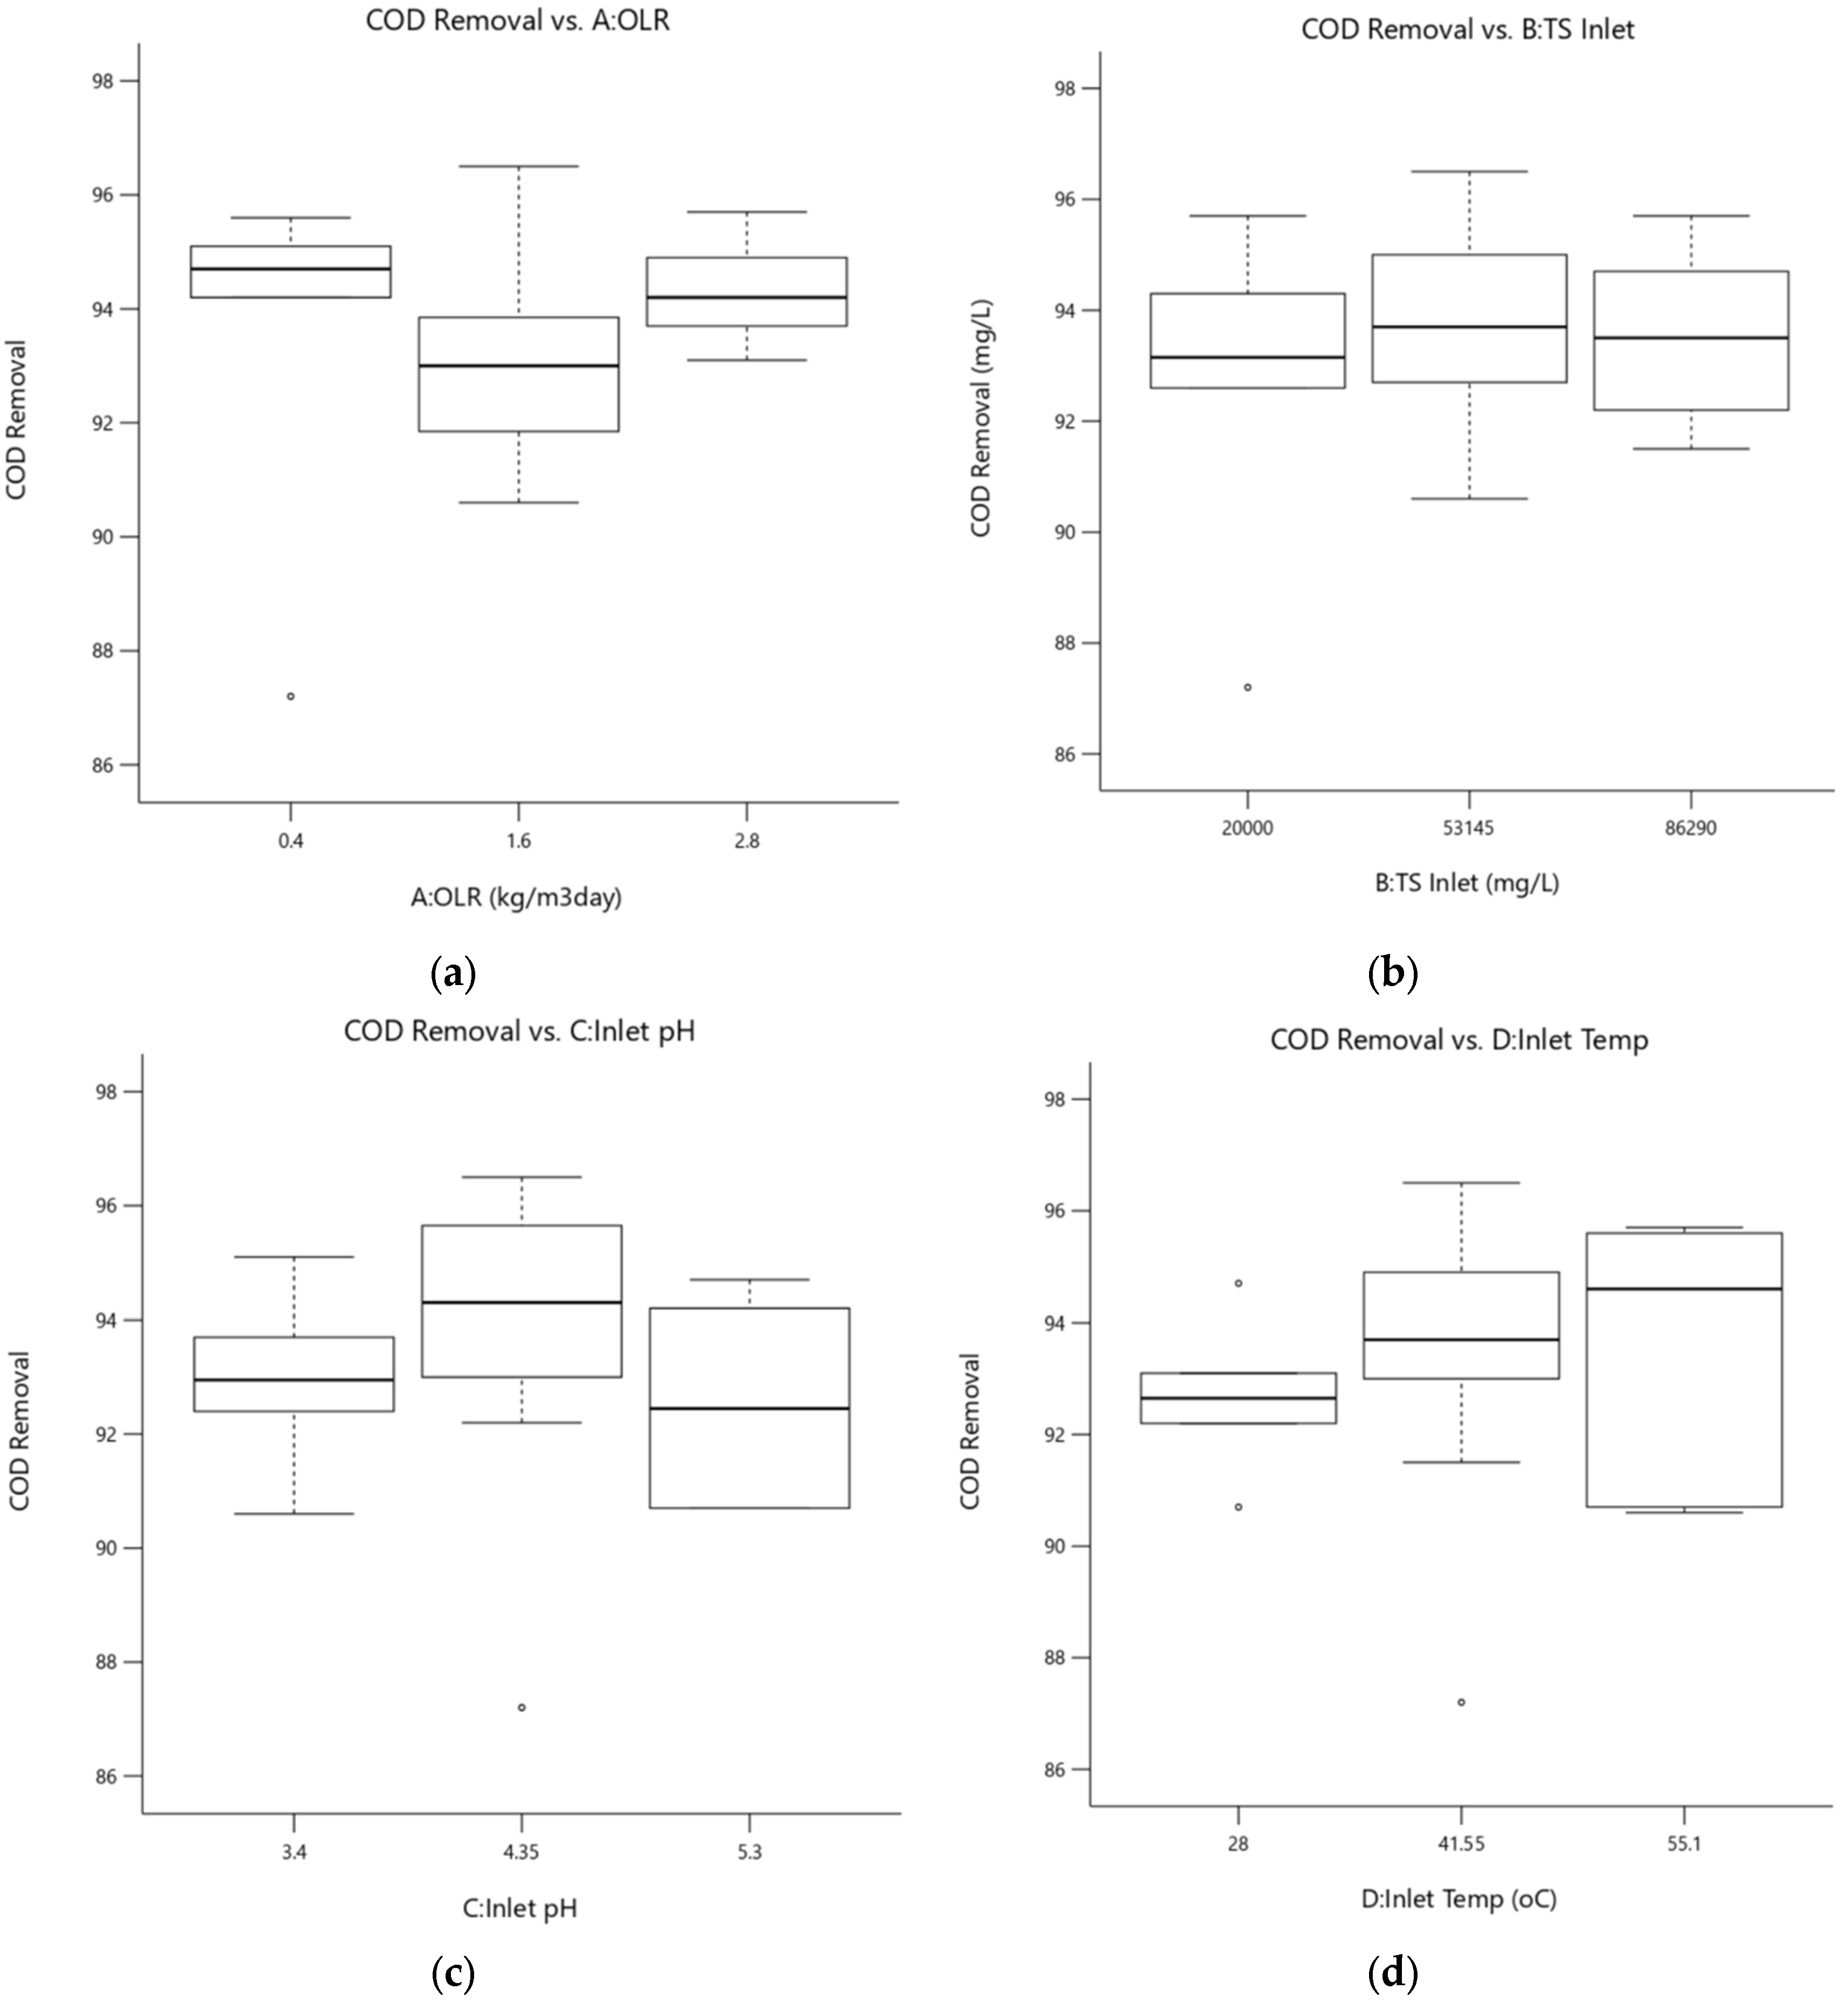
The comparative analysis of three anaerobic covered lagoon biogas plants (A, B, and C) showed that four parameters—OLR, inlet TS, inlet pH, and inlet temperature—have significant effects on methane yield. However, only OLR and inlet TS had a significant effect on COD removal in all three plants. The study also found that the relationship between temperature and COD removal from the historical data did not match the theoretical trend due to variations in other parameters, such as pH. Using the Box–Behnken model for experiment design, this study identified OLR, inlet TS, and inlet pH as having significant effects on methane yield, with OLR being the most critical parameter. None of the parameters, however, had a significant effect on COD removal. An optimization study was conducted using the datasets from Plant A. RSM curves were generated, revealing that the optimal values for maximum methane yield of 0.335 m3/kgCODremoved, representing a 39.6% improvement, were achieved at an OLR of 1.23 kg/m3·day, an inlet TS of 46,370 mg/L, an inlet pH of 4.5, and an inlet temperature of 45.4 °C. To validate the optimal combination of variables, confirmatory experiments were performed using the optimized variables. The small percentage error differences between the experimental and predicted values confirmed the feasibility of using the optimized variables for commercialization purposes. It should be noted that the predicted values are based on the full regression equation, which includes all terms regardless of their statistical significance. However, these predicted values are still acceptable as the small coefficients of insignificant factors are unlikely to significantly impact the overall prediction. These findings could contribute to reducing greenhouse gas emissions and promoting sustainable development. Further analysis and optimization of the processes at Plant B and Plant C could be carried out if continuous data collection is conducted for at least three years, leading to continued improvements in biogas production processes. In conclusion, this study provides valuable insights into the optimization of biogas production processes and the potential for biogas to become a reliable source of renewable energy.

Author Contributions

Writing—Original Draft Preparation, G.T.X.Y.; Methodology, G.T.X.Y.; Software, G.T.X.Y.; Validation, P.L.L. and Y.J.C.; Writing—Review and Editing, Y.J.C., B.E., A.A.G., A.A.A.M., M.K.S. and J.W.L.; Visualization, G.T.X.Y.; Supervision, Y.J.C.; Conceptualization, B.E.; funding acquisition, A.A.G., A.A.A.M. and J.W.L. All authors have read and agreed to the published version of the manuscript.

Funding

The authors acknowledge the support provided by the University of Nottingham Malaysia in this research project. The authors are grateful to the Researchers Supporting Project number (RSP2023R407), King Saud University, Riyadh, Saudi Arabia, for the financial support. Jun Wei Lim thanks the financial support received from the Yayasan Universiti Teknologi PETRONAS with the cost center of 015LC0-341.

Data Availability Statement

No new data were created or analyzed in this study. Data sharing is not applicable to this article.

Acknowledgments

The authors acknowledge the support provided by the University of Nottingham Malaysia in this research project. The authors are grateful to the Researchers Supporting Project number (RSP2023R407), King Saud University, Riyadh, Saudi Arabia, for the financial support. Jun Wei Lim thanks the financial support received from the Yayasan Universiti Teknologi PETRONAS with the cost center of 015LC0-341.

Conflicts of Interest

The authors declare no conflict of interest.

Appendix A

Table A1. Experimental design with four independent variables and two responses generated using Design-Expert software.
StdRunABCDMethane YieldCOD Removal
kg/m3·daymg/LpH°CL/gCOD removed%
2411.686,2904.3555.10.10895.7
521.653,1453.4280.37992.4
2931.653,1454.3541.550.4796.5
140.420,0004.3541.550.22587.2
350.486,2904.3541.550.17594.7
2561.653,1454.3541.550.4796.5
2871.653,1454.3541.550.4793
1180.453,1454.3555.10.23595.6
2191.620,0004.35280.19792.9
19100.453,1455.341.550.2994.2
22111.686,2904.35280.10192.2
18122.853,1453.441.550.06893.7
17130.453,1453.441.550.28595.1
4142.886,2904.3541.550.05893.7
26151.653,1454.3541.550.4793
10162.853,1454.35280.05693.1
15171.620,0005.341.550.28193.4
6181.653,1455.3280.43890.7
9190.453,1454.35280.18394.7
13201.620,0003.441.550.14892.6
14211.686,2903.441.550.12193.3
20222.853,1455.341.550.0794.7
27231.653,1454.3541.550.4793
23241.620,0004.3555.10.25194.3
8251.653,1455.355.10.44890.7
12262.853,1454.3555.10.08894.9
16271.686,2905.341.550.1491.5
2282.820,0004.3541.550.09395.7
7291.653,1453.455.10.18290.6

References

  1. Amin, M.A.; Shukor, H.; Yin, L.S.; Kasim, F.H.; Shoparwe, N.F.; Makhtar, M.M.Z.; Yaser, A.Z. Methane Biogas Production in Malaysia: Challenge and Future Plan. Int. J. Chem. Eng. 2022, 2022, 2278211. [Google Scholar] [CrossRef]
  2. Shahidul, M.I.; Malcolm, M.L.; Eugene, J.J.; Mamunur, R. Optimization of Factors Affecting Biogas Production From Pome. Sci. Int. Lahore 2018, 30, 851–859. [Google Scholar]
  3. Foong, S.Z.Y.; Chong, M.F.; Ng, D.K.S. Strategies to Promote Biogas Generation and Utilisation from Palm Oil Mill Effluent. Process Integr. Optim. Sustain. 2021, 5, 175–191. [Google Scholar] [CrossRef]
  4. Malaysian Palm Oil Board. Datasheet—1) Typical Characteristics of Palm Oil Mill Effluent, 2) Fuel Properties of Biogas, Natural Gas and Liquified Petroleum Gas (LPG); Palm Oil Engineering Bulletin No. 66; Malaysian Palm Oil Board (MPOB): Kuching, Malaysia, 2003; p. 29. Available online: http://poeb.mpob.gov.my/datasheet-1-typical-characteristics-of-palm-oil-mill-effluent-2-fuel-properties-of-biogas-natural-gas-and-liquified-petroleum-gas-lpg/ (accessed on 23 February 2023).
  5. Fikri Hamzah, M.A.; Abdul, P.M.; Mahmod, S.S.; Azahar, A.M.; Jahim, J.M. Performance of anaerobic digestion of acidified palm oil mill effluent under various organic loading rates and temperatures. Water 2020, 12, 2432. [Google Scholar] [CrossRef]
  6. Rajani, A.; Santosa, A.; Saepudin, A.; Gobikrishnan, S.; Andriani, D. Review on biogas from palm oil mill effluent (POME): Challenges and opportunities in Indonesia. IOP Conf. Ser. Earth Environ. Sci. 2019, 293, 012004. [Google Scholar] [CrossRef]
  7. Sodri, A.; Septriana, F.E. Biogas Power Generation from Palm Oil Mill Effluent (POME): Techno-Economic and Environmental Impact Evaluation. Energies 2022, 15, 7265. [Google Scholar] [CrossRef]
  8. Djimtoingar, S.S.; Derkyi, N.S.A.; Kuranchie, F.A.; Yankyera, J.K. A review of response surface methodology for biogas process optimization. Cogent Eng. 2022, 9, 2115283. [Google Scholar] [CrossRef]
  9. Saleh, A.F.; Kamarudin, E.; Yaacob, A.B.; Yussof, A.W.; Abdullah, M.A. Optimization of Biomethane Production by Anaerobic Digestion of Palm Oil Mill Effluent Using Response Surface Methodology. Asia-Pac. J. Chem. Eng. 2011, 7, 353–360. [Google Scholar] [CrossRef]
  10. Shakib, N.; Rashid, M. Biogas Production Optimization from POME by Using Anaerobic Digestion Process. J. Appl. Sci. Process Eng. 2019, 6, 369–377. [Google Scholar] [CrossRef]
  11. Lamoh, M.M.; Joy, E.J.; Rashid, M.; Islam, S.; Hashmi, S. Biogas production optimization from palm oil mill effluent: Experiments with anaerobic reactor. Int. J. Integr. Eng. 2020, 12, 261–270. [Google Scholar]
  12. Lok, X.; Chan, Y.J.; Foo, D.C.Y. Simulation and optimisation of full-scale palm oil mill effluent (POME) treatment plant with biogas production. J. Water Process Eng. 2020, 38, 101558. [Google Scholar] [CrossRef]
  13. Aqualimpia. Covered Lagoon Digester. Available online: https://www.en-aqualimpia.com/why-aqualimpia/ (accessed on 7 December 2022).
  14. Rahayu, A.S.; Karsiwulan, D.; Yuwono, H.; Trisnawati, I.; Mulyasari, S.; Rahardjo, S.; Hokermin, S.; Paramita, V. Handbook POME-to-Biogas Project Development in Indonesia; Winrock International: Little Rock, AR, USA, 2015; p. 98. Available online: https://winrock.org/wp-content/uploads/2016/05/CIRCLE-Handbook-2nd-Edition-EN-25-Aug-2015-MASTER-rev02-final-new02-edited.pdf (accessed on 23 February 2023).
  15. Yap, C.C.; Chan, Y.J.; Loh, S.K.; Supramaniam, C.V.; Soh, A.C.; Chong, M.F.; Chew, C.L.; Lim, L.K. Comparison of different industrial scale palm oil mill effluent anaerobic systems in degradation of organic contaminants and kinetic performance. J. Clean. Prod. 2020, 262, 121361. [Google Scholar] [CrossRef]
  16. Tiong, J.S.M.; Chan, Y.J.; Lim, J.W.; Mohamad, M.; Ho, C.D.; Rahmah, A.U.; Kiatkittipong, W.; Sriseubsai, W.; Kumakiri, I. Simulation and optimization of anaerobic co-digestion of food waste with palm oil mill effluent for biogas production. Sustainability 2021, 13, 13665. [Google Scholar] [CrossRef]
  17. Wu, S.; Maskaly, J. Study on the effect of total dissolved solids (TDS) on the performance of an SBR for COD and nutrients removal. J. Environ. Sci. Health 2017, 53, 146–153. [Google Scholar] [CrossRef] [PubMed]
  18. Mohd, N.S.; Li, B.; Ibrahim, S.; Riffat, R. Temperature phased anaerobic digestion at the intermediate zone of 45 °C: Performances, stability and pathogen deactivation. Sains Malays. 2021, 50, 1827–1841. [Google Scholar] [CrossRef]
  19. Bornare, J.; Kalyanraman, V.; Sonde, R. Application of Anaerobic Membrane Bioreactor (AnMBR) for Low-Strength Wastewater Treatment and Energy Generation. In Industrial Wastewater Treatment, Recycling and Reuse; Elsevier: Amsterdam, The Netherlands, 2014; pp. 399–434. [Google Scholar] [CrossRef]
  20. Senturk, E.; Ince, M.; Engin, G.O. The effect of shock loading on the performance of a thermophilic anaerobic contact reactor at constant organic loading rate. J. Environ. Health Sci. Eng. 2014, 12, 84. [Google Scholar] [CrossRef] [PubMed]
  21. Stat-Ease. Understanding Lack of Fit: When to Worry. 2022. Available online: https://www.statease.com/blog/understanding-lack-of-fit-when-to-worry/ (accessed on 3 December 2022).
  22. Svensson, K.; Paruch, L.; Gaby, J.C.; Linjordet, R. Feeding frequency influences process performance and microbial community composition in anaerobic digesters treating steam exploded food waste. Bioresour. Technol. 2018, 269, 276–284. [Google Scholar] [CrossRef] [PubMed]
  23. Wulandari, W.; Senda, S.P. Analysis of biogas production from palm oil mill effluent at different feed flow rates in biogas plant Sei Pagar Riau. IOP Conf. Ser. Earth Environ. Sci. 2022, 963, 012006. [Google Scholar] [CrossRef]
Figure 1. Research Methodology Flow Chart.
Processes 11 01603 g001
Figure 3. Methane Yield vs. OLR of Three Plants.
Processes 11 01603 g003
Figure 4. Methane Yield vs. Inlet pH of Three Plants.
Processes 11 01603 g004
Figure 5. Methane Yield vs. Inlet TS of Three Plants.
Processes 11 01603 g005
Figure 6. Methane Yield vs. Inlet Temperature of Three Plants.
Processes 11 01603 g006
Figure 7. COD Removal vs. OLR of Three Plants.
Processes 11 01603 g007
Figure 8. COD Removal vs. Inlet pH of Three Plants.
Processes 11 01603 g008
Figure 9. COD Removal vs. Inlet TS of Three Plants.
Processes 11 01603 g009
Figure 10. COD Removal vs. Inlet Temperature of Three Plants.
Processes 11 01603 g010
Figure 11. Average Methane Yield.
Processes 11 01603 g011
Figure 12. Average COD Removal.
Processes 11 01603 g012
Figure 13. Perturbation Plot of Methane Yield and its Input Parameters (A (OLR), B (Inlet TS), C (Inlet pH), D (Inlet Temperature)).
Processes 11 01603 g013
Figure 14. Box Plots of Methane Yield for Different (a) OLR and (b) Inlet TS values.
Processes 11 01603 g014
Figure 15. Box Plots of Methane Yield for Different Values of (a) pH and (b) Temperature.
Processes 11 01603 g015
Figure 16. Three-Dimensional Response Surface Plots of Methane Yield, as a function of (a) OLR (kg/m3·day) and inlet TS (mg/L); (b) OLR (kg/m3·day) and inlet pH; (c) OLR (kg/m3·day) and inlet temperature (°C); (d) Inlet TS (mg/L) and inlet pH; (e) Inlet TS (mg/L) and inlet temperature (°C); (f) inlet pH and inlet temperature (°C).
Processes 11 01603 g016aProcesses 11 01603 g016b
Figure 17. Box Plots of COD Removal on Different Input Parameters of (a) OLR (kg/m3·day); (b) inlet TS (mg/L); (c) inlet pH; (d) inlet temperature (°C) (“°” indicates outliers of the data).
Processes 11 01603 g017
Table 1. Typical POME Characteristics and Discharge Standards in Malaysia [3,4].
ParametersConcentration RangeDischarge Standards
Chemical oxygen demand (COD) (mg/L)15,000–100,000-
Biological oxygen demand (BOD) (mg/L)10,250–43,75050
Total solids (TS) (mg/L)11,500–79,000-
Total suspended solids (TSS) (mg/L)5000–54,000400
Oil and grease (mg/L)130–18,00050
Temperature (°C)80–9045
pH3.4–5.25.0–9.0
Table 2. Lower and Upper Bound Values of Parameters in Plant A.
A: OLR (kg/m3·day)B: Inlet TS (mg/L)C: Inlet pHD: Inlet Temperature (°C)
Lower bound0.420,0003.428
Upper bound1.686,2905.355.1
Table 3. ANOVA Results for Methane Yield.
SourceSum of SquaresdfMean SquareF-Valuep-Value
Model0.5528140.03957.640.0003significant
A0.076810.076814.860.0017significant
B0.020210.02023.90.0682Weakly significant
C0.019510.01953.780.0723Weakly significant
D0.000110.00010.02840.8685
AB0.000110.00010.01090.9184
AC2.25 × 10−612.25 × 10−60.00040.9836
AD0.000110.00010.01940.8913
BC0.003210.00320.62870.4411
BD0.000610.00060.10690.7486
CD0.010710.01072.070.1719
A20.257510.257549.83<0.0001significant
B20.234810.234845.43<0.0001significant
C20.032910.03296.370.0243significant
D20.057610.057611.150.0049significant
Residual0.0723140.0052
Lack of Fit0.0723100.0072
Pure Error040
Cor Total0.625128
SD = 0.0719, CV% = 29.91, R2 = 0.8843, Adjusted R2 = 0.7685, Predicted R2 = 0.3334, Adequate precision = 9.8018.
Table 4. ANOVA Results for COD Removal.
SourceSum of SquaresdfMean SquareF-Valuep-Value
Model00
Residual114.83284.1
Lack of Fit100.13244.171.140.5099not significant
Pure Error14.743.68
Cor Total114.8328
Table 5. Optimization Results.
FactorsUnitsValue
OLRkg/m3·day1.23
Inlet TSmg/L46,014.25
Inlet pH-4.511
Inlet Temperature°C45.41
Responses
Methane Yieldm3/kg CODremoved0.477
COD Removal%93.43
Table 6. Comparison between Base Values and Optimized Values.
ParametersUnitsBase ValueOptimized ValueImprovements (%)
OLRkg/m3·day1.5011.23-
Inlet TSmg/L46,37046,014-
Inlet pH-4.74.5-
Inlet Temperature°C45.445.4-
Methane Yieldm3/kg CODremoved0.2400.33539.6%
COD Removal%92.4693.431.1%
Table 7. Verification of experiment at optimum conditions.
ParametersUnitsExperimental ValuesStandard DeviationDifference
(%)
OLRkg/m3·day1.260.152.44
Inlet TSmg/L49,01412416.52
Inlet pH-4.40.22.22
Inlet Temperature°C46.51.52.42
Methane Yieldm3/kg CODremoved0.330.051.49
COD Removal%93.41.250.03
Disclaimer/Publisher’s Note: The statements, opinions and data contained in all publications are solely those of the individual author(s) and contributor(s) and not of MDPI and/or the editor(s). MDPI and/or the editor(s) disclaim responsibility for any injury to people or property resulting from any ideas, methods, instructions or products referred to in the content.

