Article

Investigation of Synechocystis sp. CPCC 534 Motility during Different Stages of the Growth Period in Active Fluids

by
Zahra Samadi
1,
Malihe Mehdizadeh Allaf
1,
Thomas Vourc’h
2,
Christopher T. DeGroot
3 and
Hassan Peerhossaini
1,3,4,*
1
Mechanics of Active Fluids and Bacterial Physics Lab, Department of Civil and Environmental Engineering, Western University, London, ON N6A 3K7, Canada
2
Université Clermont Auvergne, Clermont Auvergne INP, CNRS, Institut Pascal, F-63000 Clermont-Ferrand, France
3
Department of Mechanical and Materials Engineering, Western University, London, ON N6A 3K7, Canada
4
Laboratoire AstroParticules et Cosmologie (APC), CNRS, Université de Paris Cité, 75205 Paris, France
*
Author to whom correspondence should be addressed.
Processes 2023, 11(5), 1492; https://doi.org/10.3390/pr11051492
Submission received: 5 April 2023 / Revised: 7 May 2023 / Accepted: 10 May 2023 / Published: 15 May 2023
(This article belongs to the Special Issue Advances in Bioprocess Technology)

Abstract

:
The motility behavior of suspended microorganisms plays an essential role in the properties of active fluids. Despite the important progress in our understanding of microorganisms’ motility in recent years, there are still several open questions about the dynamics of cell motility in active suspensions. Of special interest is the relationship between cell motility and age. In this study, cyanobacterium Synechocystis sp. CPCC 534 was used as the model microorganism, and the cell trajectories were tracked for 78 days during the cell growth period. Results showed that the length of cell trajectories had substantially increased from the exponential growth phase to the stationary phase and had declined at the end of the stationary phase. Similar trends were observed for the cells’ mean squared displacement (MSD), the time-dependent diffusion coefficient of cell suspensions, and the cell displacement probability density function (PDF). These results suggest that the cellular age of microorganisms has a significant effect on various metrics of cell motility and, therefore, can impact the transport properties of active suspensions.

1. Introduction

Suspensions of photosynthetic microorganisms are often described as “living” or “active” fluids. Active fluids contain a collection of cells, or active particles, suspended in a fluid medium, where the cells can convert chemical nutrients into mechanical energy to drive the flow. In an environment with uniform nutrient distribution, cells move in a random-walk pattern, with high-motility “run” periods separated by low-motility “tumble” periods [1,2]. However, in the presence of gradients in nutrient or light distribution, cells move preferentially in the direction opposite to the gradient (i.e., from low to high availability of nutrients/light). These processes are called chemotaxis and phototaxis for movements driven by nutrients and light, respectively [1,3,4].
Fluid flow, cell motility, microbe biokinetics, and radiative transport are among the important parameters in designing and optimizing photobioreactors used for cell growth in active fluids [5,6,7,8]. Among these factors, motility is one of the major ones in providing favorable conditions for microorganisms’ nutrient uptake and light harvesting and, therefore, enhancing biomass growth [9,10,11]. Moreover, motility plays a vital role in the formation of biofilms. In the initial period of biofilm formation, bacteria proceed toward and adhere to wet solid surfaces. This adhesion allows for bacterial surface colonization and creates protective biofilms. It is essential to understand the motility of the microorganisms to identify the adhesion rate and the subsequent colonization process [12,13,14,15].
In a study by Shoesmith [16], a simple quantitative method was applied to measure the motility of Pseudomonas viscosa, Bacillus brevis, and Escherichia coli by counting the number of bacteria passing through a small aperture during a certain period of time. The results revealed that bacterial motility is proportional to the concentration and the mean velocity of cells in the suspension. In another study by Kim [17], the impact of motility on the diffusivity of two bacteria: Pseudomonas aeruginosa, a motile cell, and Klebsiella pneumoniae, a non-motile cell, was investigated through capillary tubes. It was found that the rate of diffusion of motile cells was 1000 times faster, and the diffusion coefficient was 2.3 times higher compared to non-motile bacteria. Arora et al. [18] carried out experiments in an agitated bioreactor to examine the motility behavior of E. coli as a function of its growth dynamics. They observed that the microorganisms’ motility was reduced by increasing the number of cells in the culture. This was concluded to be a result of a reduction in the “running” phase of the motility pattern. In a recent study by Fadlallah et al. [19], the motility behavior of active fluids (suspensions of Chlamydomonas reinhardtii and Synechocystis sp.) was studied under different intensities of hydrodynamic shear stress for 15 days. Their results revealed that hydrodynamic shear stress had a considerable effect on the motility of C. reinhardtii during the exponential growth period and enhanced the cellular swimming velocity of microorganism cells. On the other hand, Synechocystis did not exhibit any specific trend during the growth cycle and showed higher resistance to shear stress. This could be explained by the lack of flagella in Synechocystis and/or its small size in comparison to C. reinhardtii [19].
In bacterial cultures, once the cells have adapted themselves to the new environment, they move from the lag phase (where they are largely dormant) into an exponential growth phase. The exponential phase continues until the linear growth phase is reached, wherein the cell growth is reduced due to shading or nutrient depletion. At the end of the linear growth phase, bacteria enter the stationary phase in which the number of cell divisions balances with cell death, and the population of microorganisms remains constant in time. As nutrients deplete and waste materials inside the medium rise, the microorganism cells lose the ability to perform metabolic functions, and then the number of dead cells continues to increase and eventually exceeds that of live cells (decline/death phase) [20,21].
To the best of the authors’ knowledge, most previous studies have emphasized the motility of various microorganisms for a short time period during the cell’s exponential growth phase [19,22]. In this study, the motility of Synechocystis sp. CPCC 534 was used as a model organism to study the impacts of cell age on motility over longer periods of time (i.e., up to 78 days), going far beyond the exponential and stationary growth phases. For this purpose, the cell transport parameters such as cell velocity, mean squared displacement (MSD), time-dependent diffusion coefficient D (t), and displacement probability density function (PDF) were calculated [23]. To accomplish this, bacteria trajectories were extracted from the video footage recorded on an inverted video microscope. The average swimming velocity over a given time period was then calculated and correlated with the age of bacteria obtained from the growth curve [19]. These findings have practical implications for biomass and sustainable resource engineering, particularly with regard to designing bioreactors for mobile microorganisms, facilitating the movement of microorganisms in photobioreactors, and regulating the development of biofilms [19,23].
The model microorganism used in this study, Synechocystis sp., is a strain of unicellular, non-nitrogen-fixing freshwater cyanobacteria that acquires its energy for movement through photosynthesis [3,24,25]. It is one of the most prevalent microorganisms for studying the fundamental phenomena in bacterial flows for two important reasons: its availability and capability to have both phototrophic growths by oxygenic photosynthesis during light periods and heterotrophic growth by glycolysis and oxidative phosphorylation during dark periods [26,27,28]. Such bacteria are naturally motile, and they can move toward favorable environmental conditions (such as light, nutrients, and temperature) or move away from unfavorable ones by using a variety of motility machinery components such as pili [18,29,30].

2. Materials and Methods

2.1. Culture Conditions

Synechocystis sp. CPCC 534 wild type was obtained from the Canadian Phycological Culture Center (Waterloo, ON, Canada). The stock culture was maintained and grown in BG11 medium [31] at 20 ± 1 °C. Suspensions were exposed to a photon flux of 50 ± 5 µmole.m−2.s−1 with a light cycle of 12/12 h. The initial experimental concentration of Synechocystis sp. in the media was adjusted to 1 × 10⁷ cells.mL−1. To provide a homogeneous environment for the cell growth and to prevent cell sedimentation inside the photobioreactor, a magnetic stirrer (VWR Canada) with stirring bars of 7.9 mm diameter and 19.8 mm length at 360 rpm rotation speed was employed. To control environmental conditions, the photobioreactors were placed in a fully controlled incubator (PHCbi) [24,32].

2.2. Experimental Protocol

Experiments were carried out in triplicate and were performed in 125 mL Pyrex flask photobioreactors. A Spectronic 200E spectrophotometer was used to measure the optical density (OD) of Synechocystis sp. CPCC 534 suspensions daily at 750 nm wavelength as a proxy for cell growth. The wavelength of maximal absorption for chlorophyll-a was found to be at 670 nm and for chlorophyll-b at 652 nm. To calculate the reference values, the intensity of the transmitted light at 750 nm was measured. The absorption at 750 nm results only from chlorophyll-free structures in the cells. A calibration curve was used to calculate the number of Synechocystis sp. cells per milliliter in a sample solution. Therefore, a dilution series of Synechocystis sp. CPCC 534, cultivated at the same environmental growth conditions, were prepared, and the optical density and the cell density (number of cells.mL−1) were measured using the Spectronic 200E spectrophotometer (Thermo Fisher Scientific, Waltham, CA, USA) and a Hausser Scientific hemocytometer (Thermo Fisher Scientific, Waltham, CA, USA), respectively [24,32].

2.3. Calculation of Synechocystis sp. Growth Rate (r) and Doubling Time (k)

The growth rate (r) of the Synechocystis sp. cells was estimated through the logarithmic growth phase by Equation (1) [33].
r = l n N t l n N 0 t
where N0 is the number of cells at the beginning of an observation period, Nt is the cell population at time t, and ∆t is the duration of the observation period (ttt0).
The growth rate (r) is used to evaluate the number of cell divisions per day, known as doubling per day (𝑘), by Equation (2) [33].
k = r l n 2 = r 0.6931

2.4. Video Microscopy and Image Acquisition

An aliquot of 40 µL of suspension sample was placed in the cavity of a concave slide, covered with a glass coverslip, and finally sealed with grease to form a micro slide. To observe and record cell displacement in the closed micro slide, it was placed with its glass coverslip side on the stage of an inverted optical Olympus IX83 video microscope equipped with a 40X magnification lens and a CCD camera. The bacteria settled on the flat side of the micro slide after about 30 min. Then the cells’ movement in the sample was recorded in “vsi” format for 50 min at a rate of one frame per second. The resolution of the CCD camera was 325 nm per pixel [1,23].

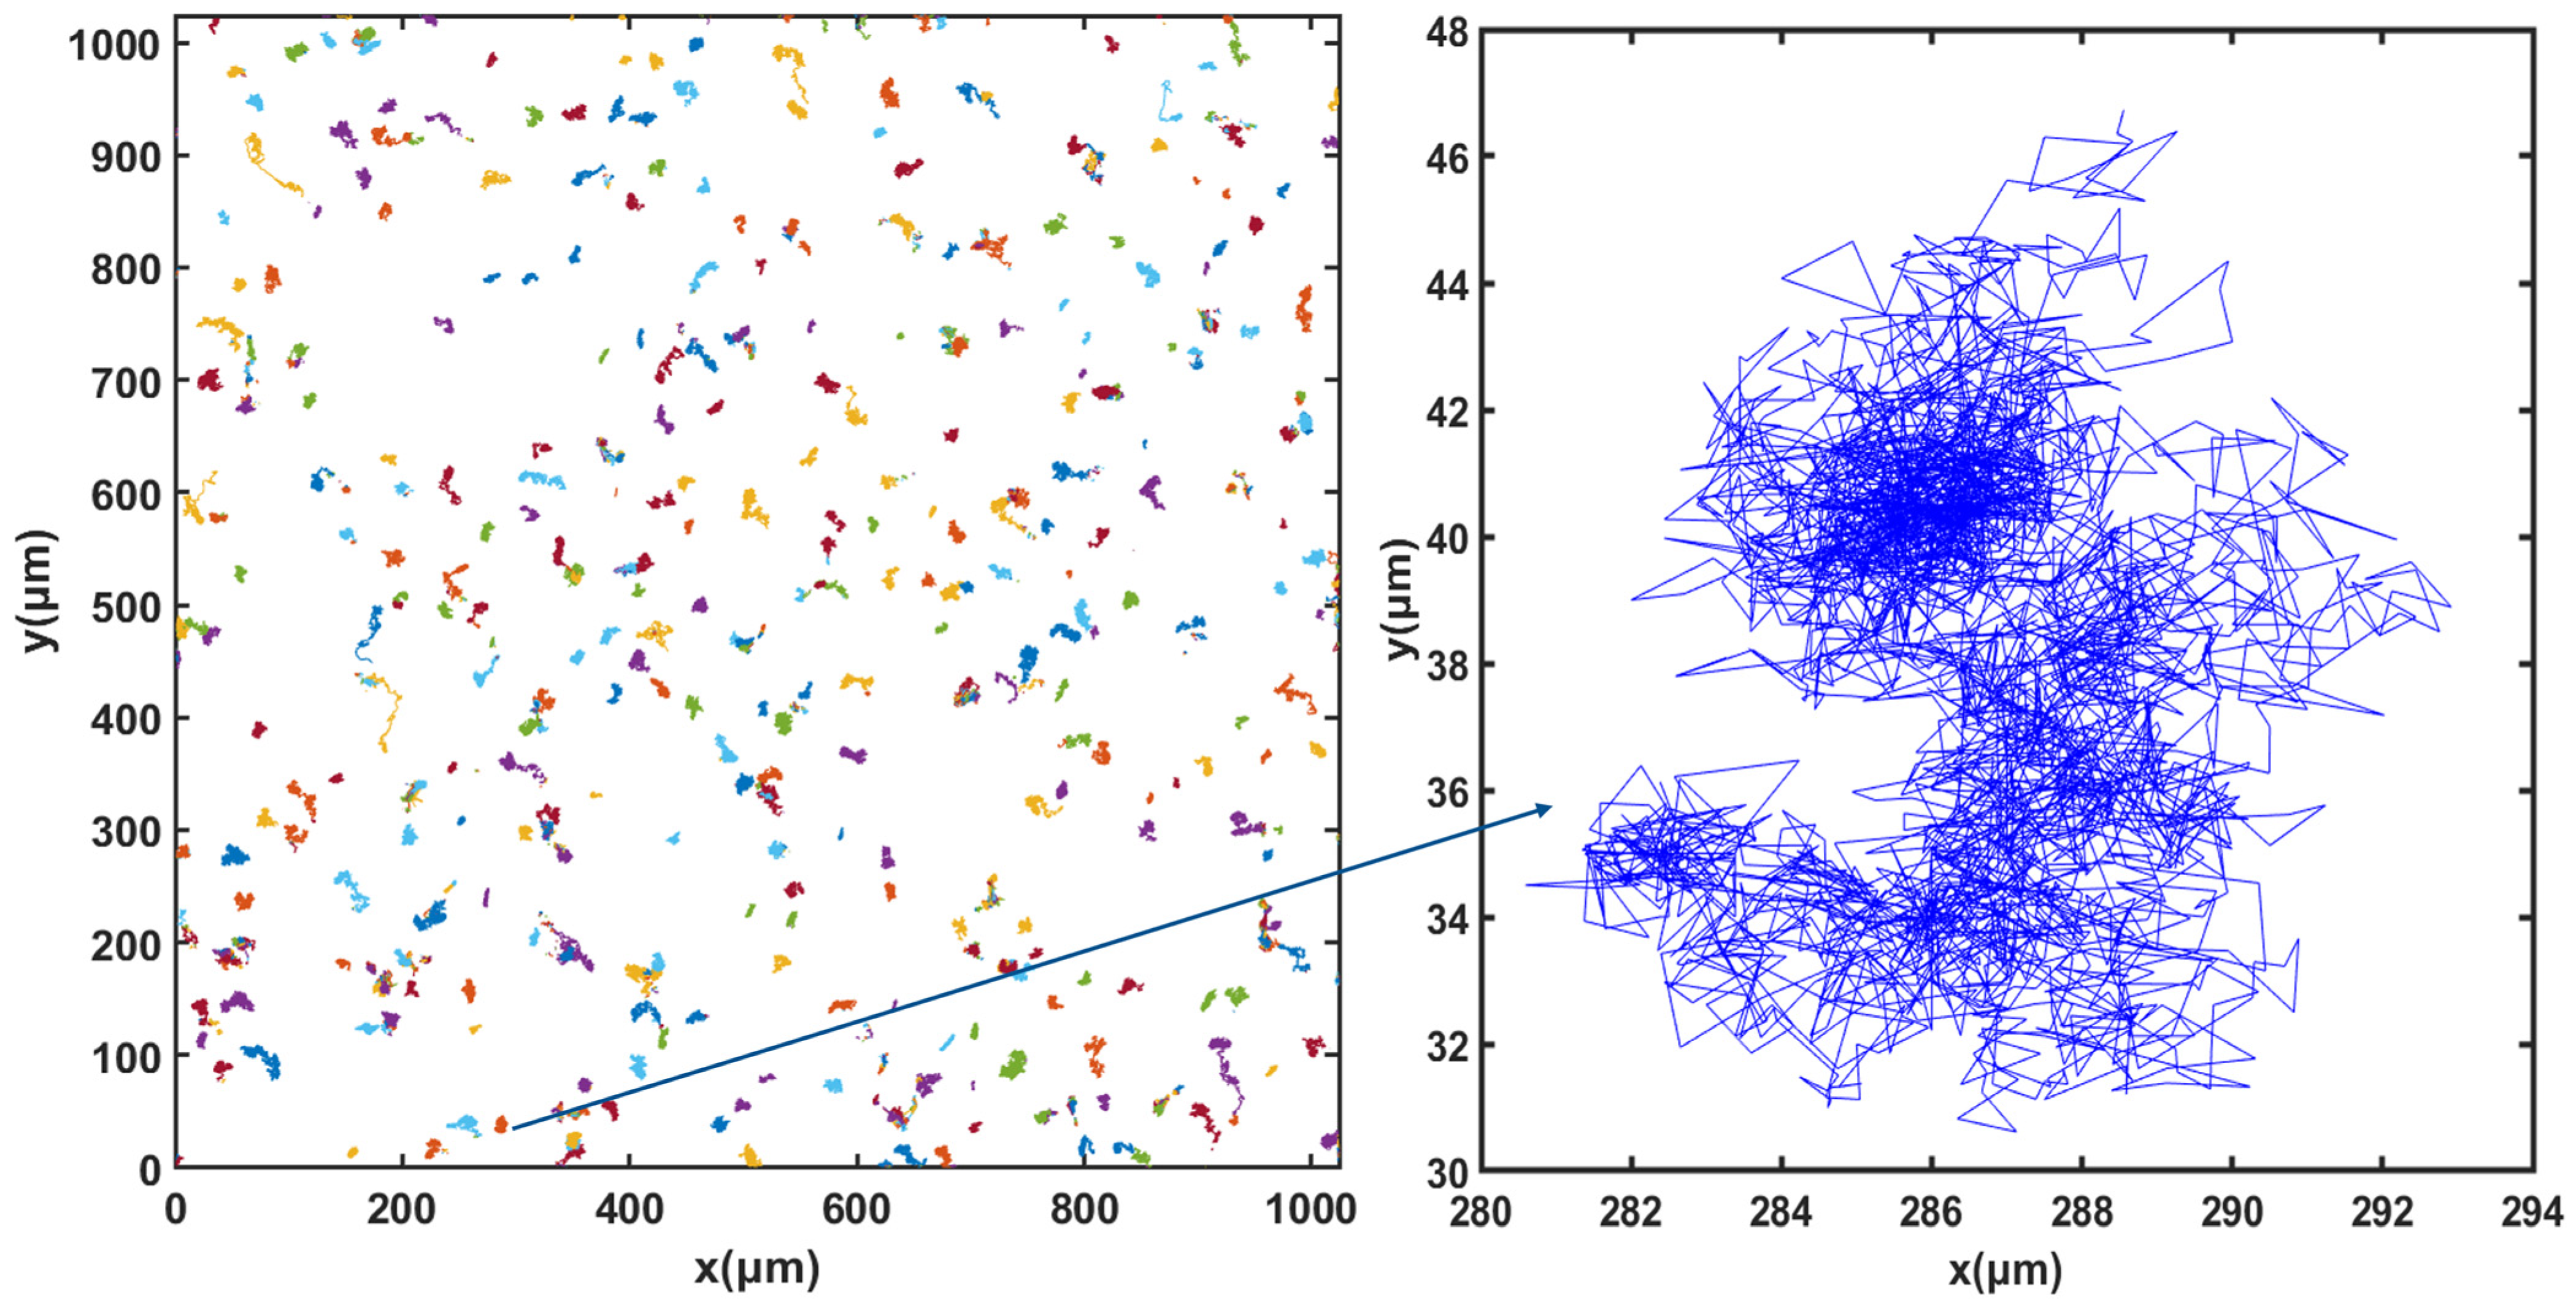
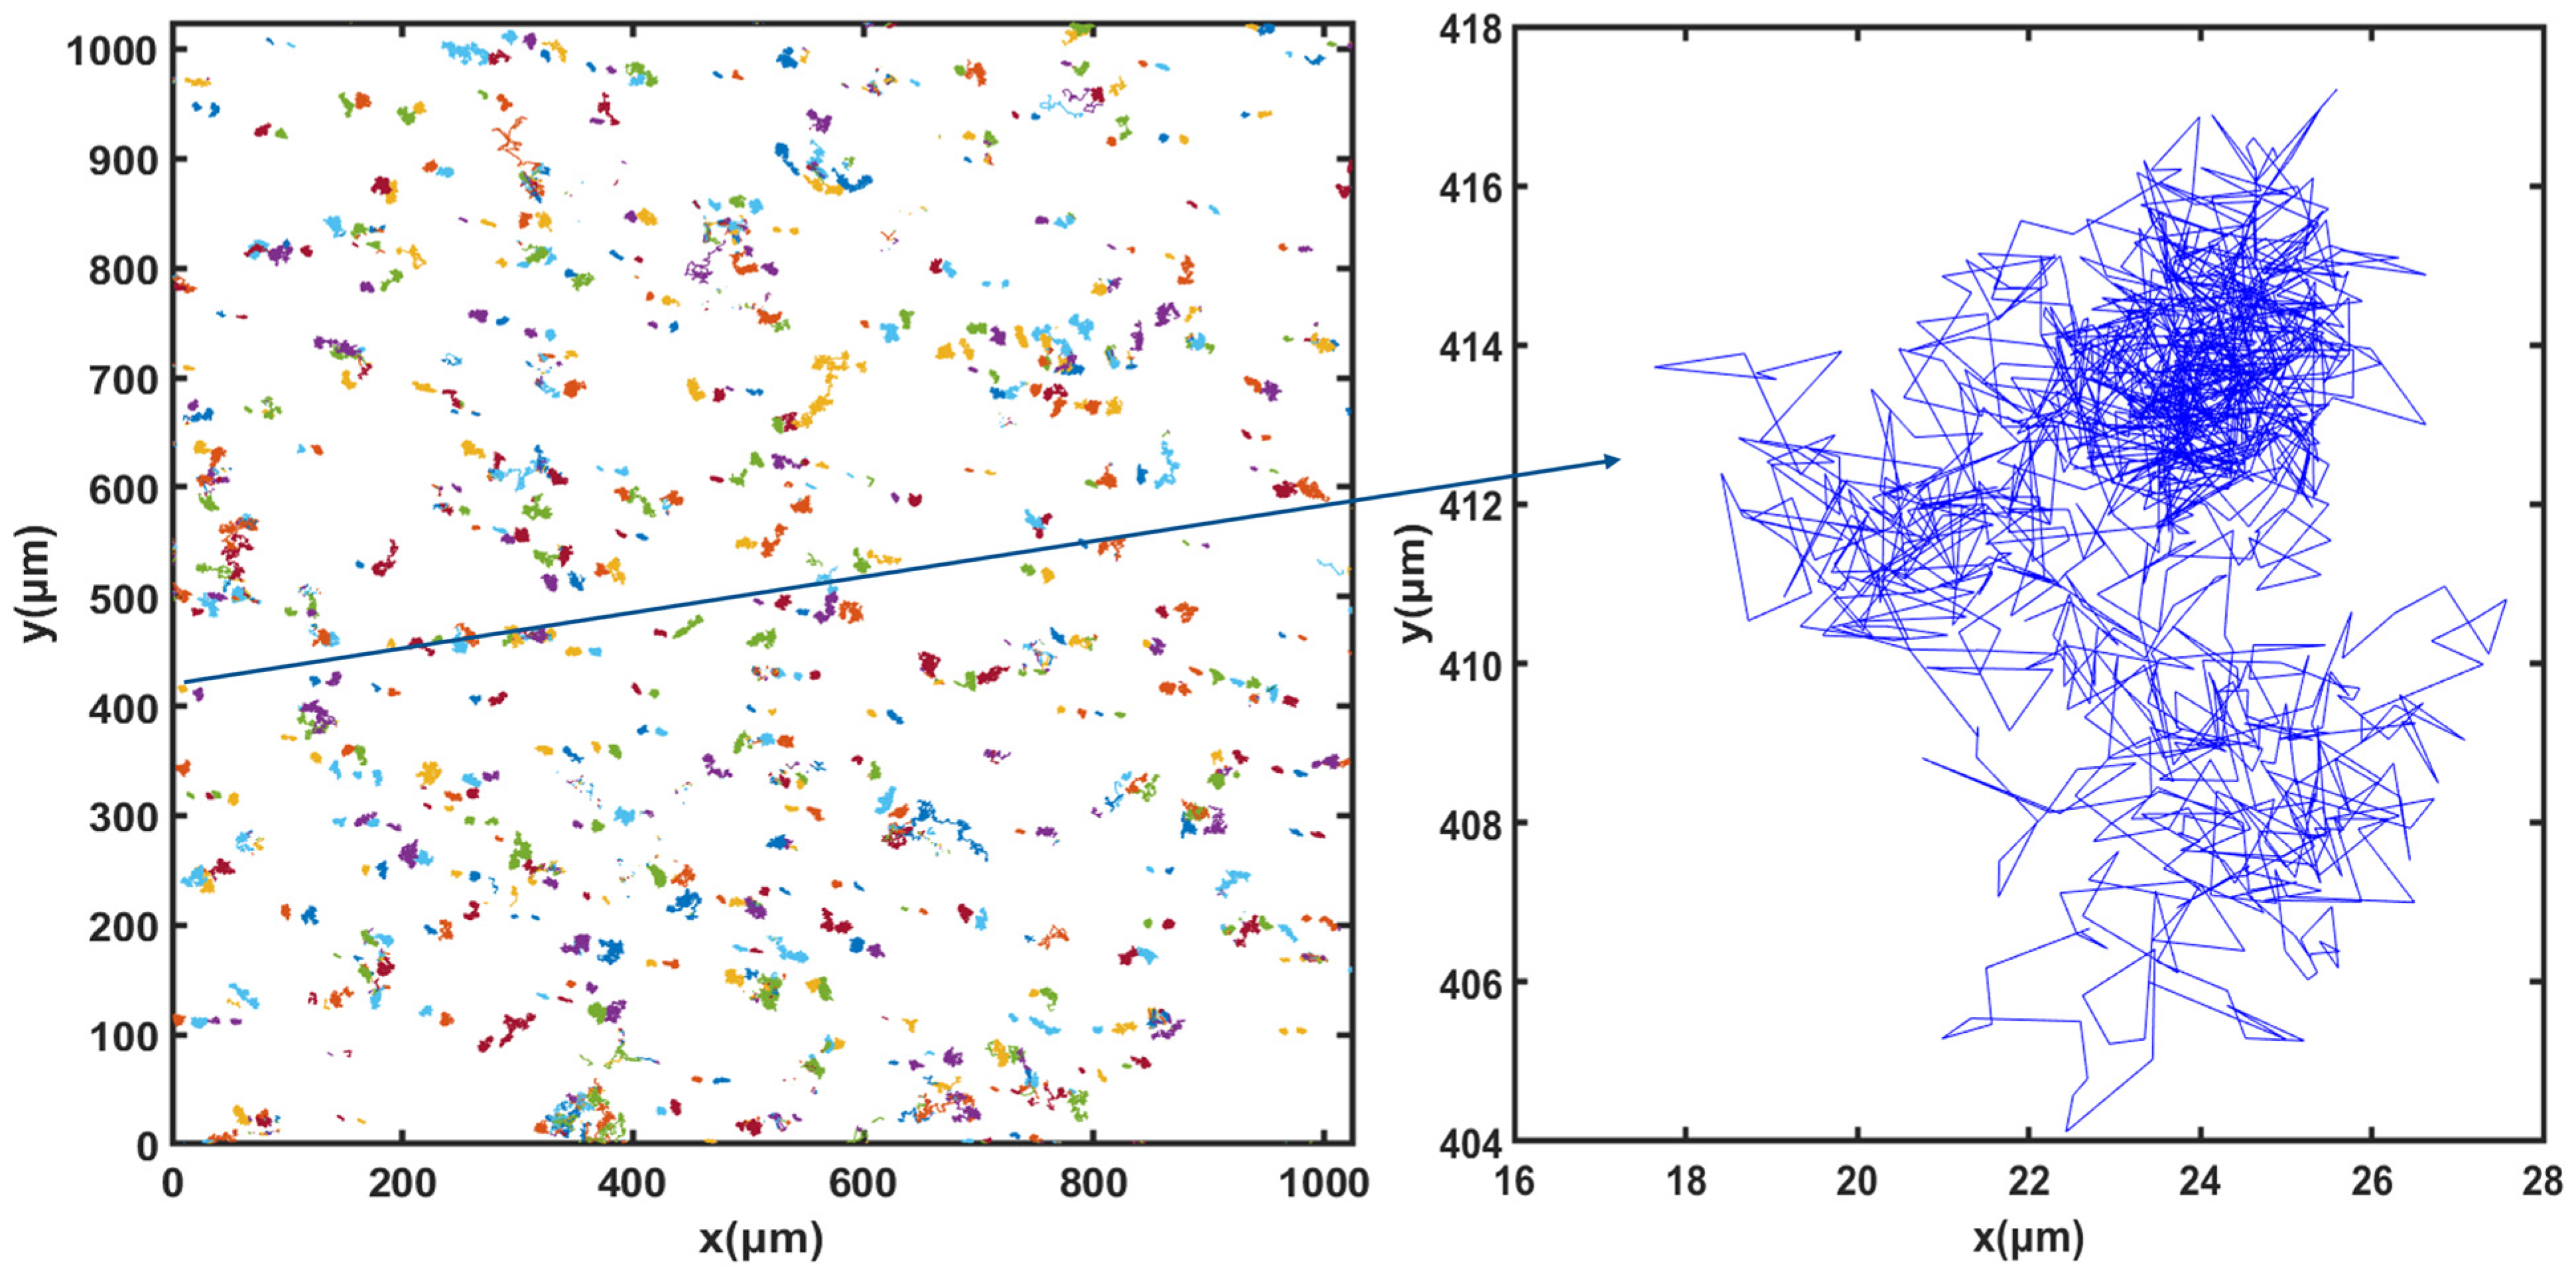
2.5. Analysis of Cell Dynamics

The recorded video footage was post-processed with Fiji ImageJ software (1.53c, Wayne Rasband) to acquire binary images. The binary video footage in “tif” format was then used for particle tracking [34] using MATLAB Version: 9.11.0.2207237 (R2021b) (Natick, MA, USA). Cell tracking was carried out in three steps: first, all cells’ x and y positions were extracted from the recorded video footage, frame by frame, to determine cell trajectories. Then, cell motility was estimated from the average cell velocity by eliminating the non-motile cells (or other debris) in the calculations. Finally, the mean squared displacement (MSD), diffusion coefficient, and displacement probability density function (PDF) were calculated to evaluate the dynamics of Synechocystis sp. CPCC 534 [35].

2.6. Statistical Analysis

For the statistical analysis, the “statsmodels” package in Python was used with 95% confidence intervals, and p < 0.05 was evaluated as significant [36].

3. Results and Discussion

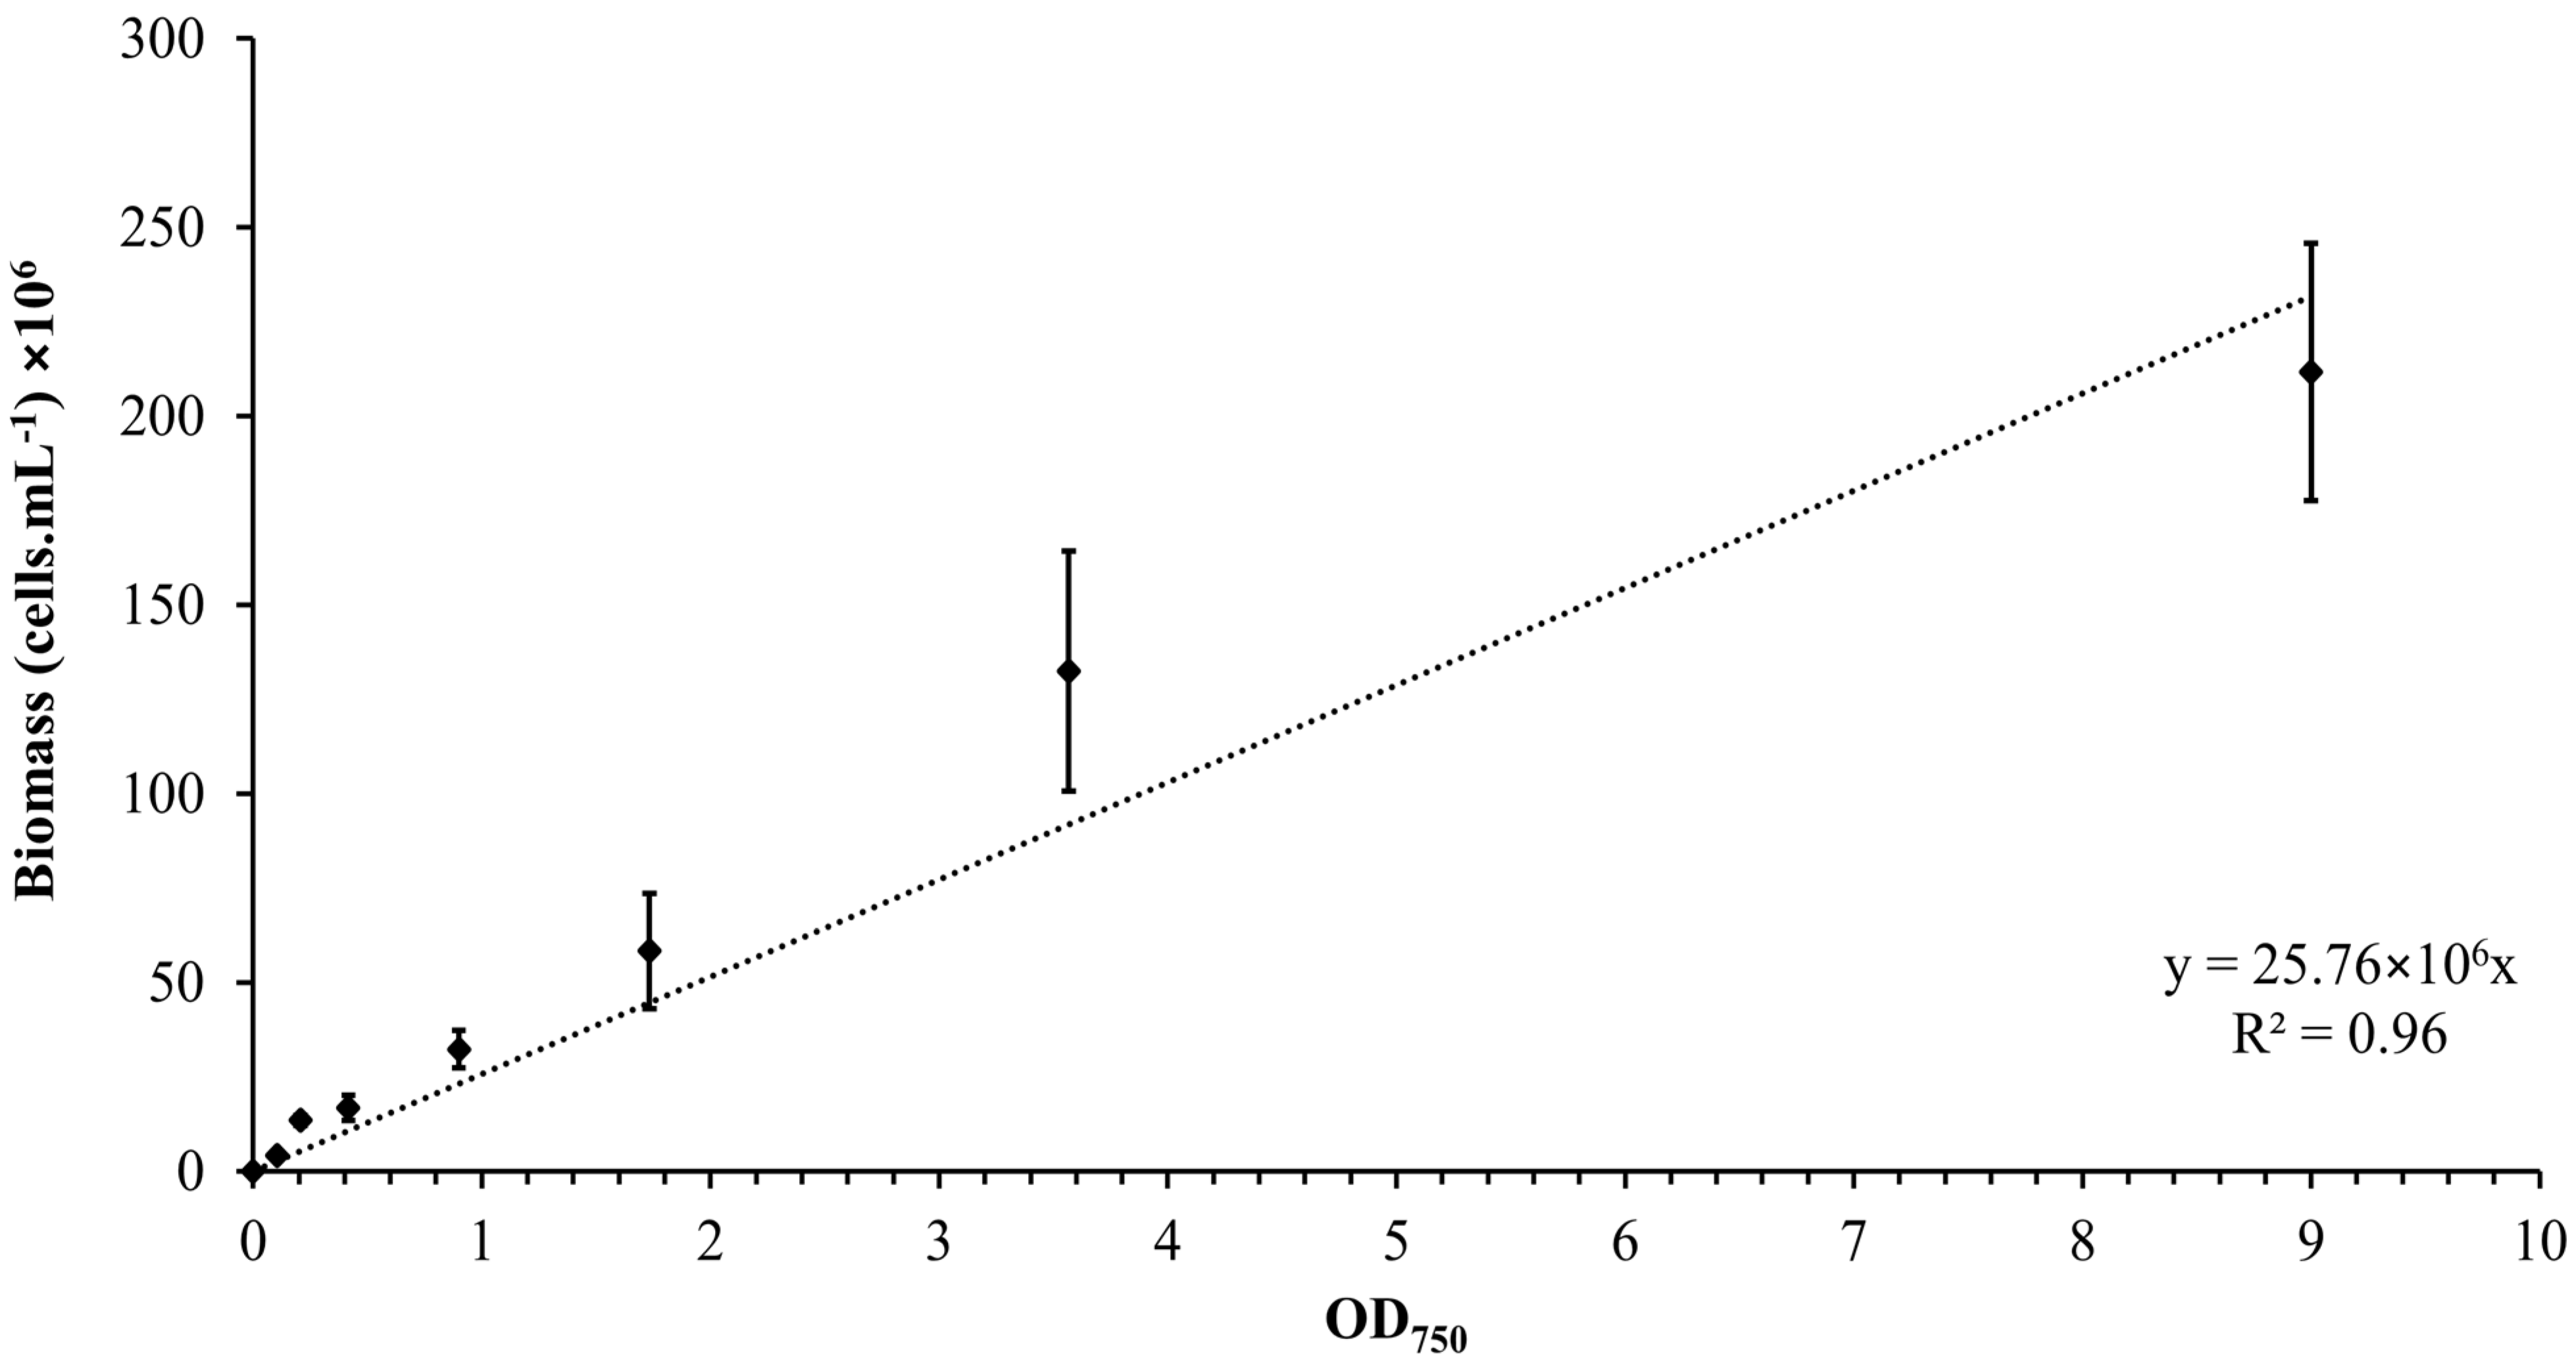
3.1. Calibration Curve
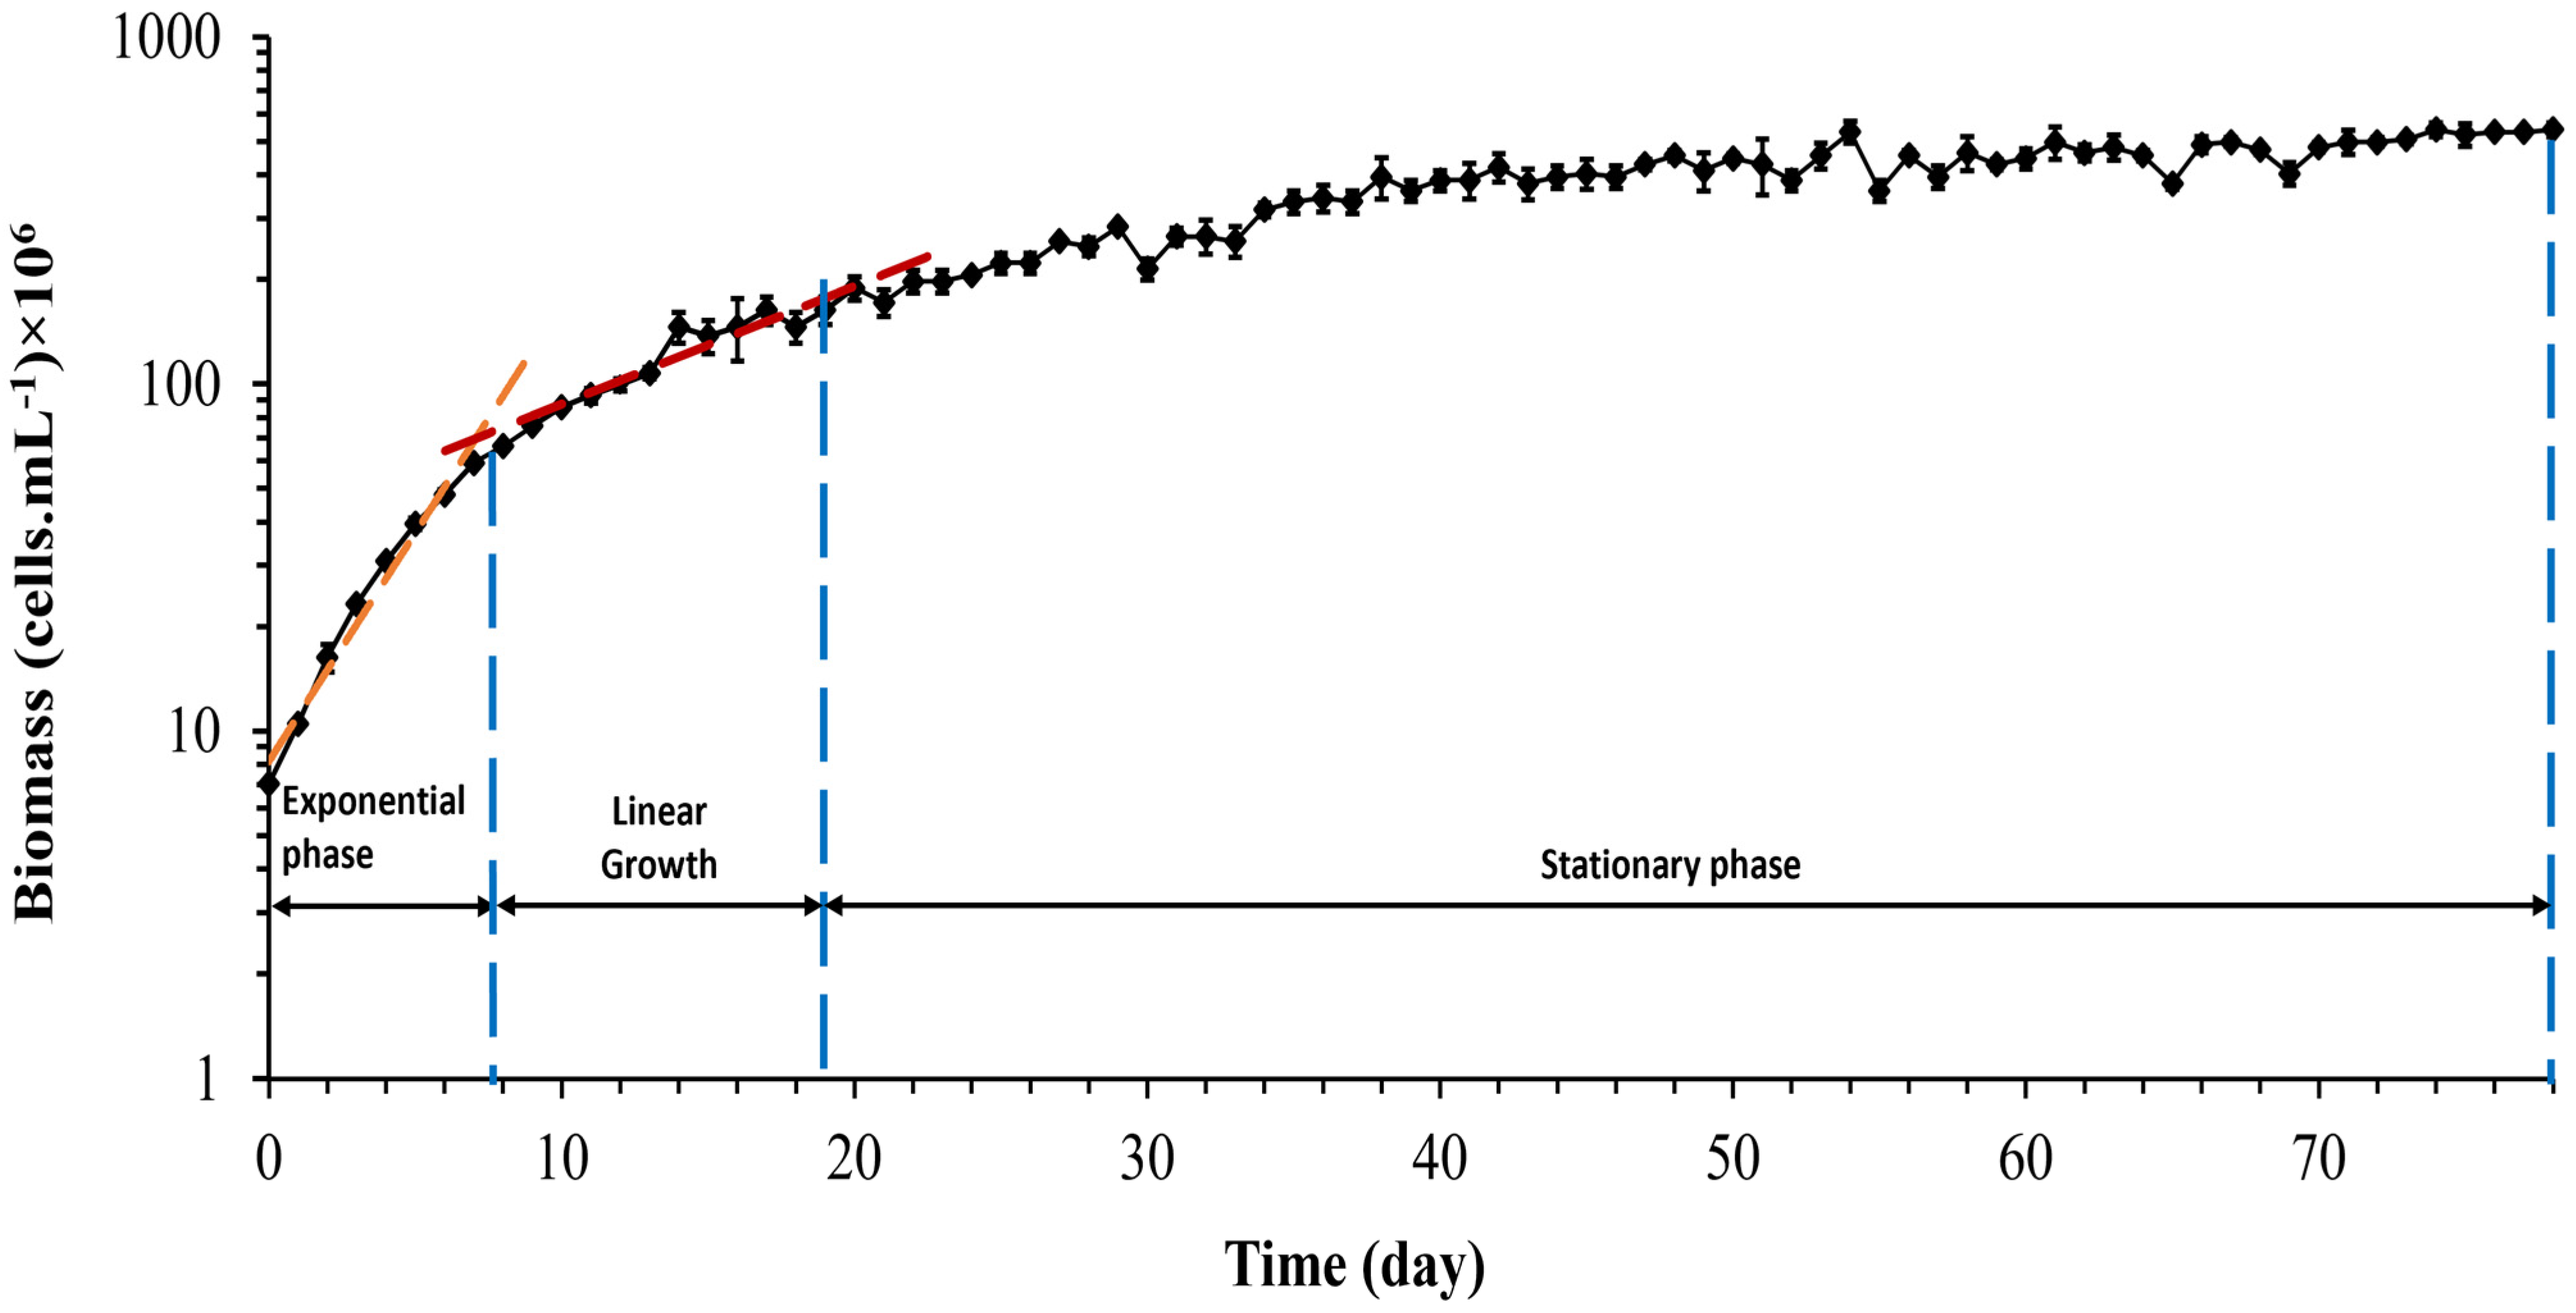
The calibration curve was established by plotting the OD versus the number of Synechocystis sp. CPCC 534 cells, as is shown in Figure 1. The concentration of Synechocystis sp. CPCC 534 in all subsequent experiments was determined using the equation derived from the calibration curve (Figure 1) [24].

3.2. Growth Curve

The growth curve, Figure 2, represents the variation of live Synechocystis sp. CPCC 534 cells number during a 78-day growth period. In the present culture, Synechocystis sp. cells immediately moved to the exponential (log) growth phase and reached the linear phase after eight days. The transition from the exponential to linear phase is evident from the slope change in the growth curve [35].
The growth rate and doubling per day calculated during the exponential growth phase were 0.3 ± 0.01 d−1 and 0.43 ± 0.015 d−1, respectively. The growth rate equation for both the exponential phase and linear phase, respectively, are:
ln C b i o m a s s = ln 8 × 10 6 + 0.3 d
ln C b i o m a s s = ln ( 4 × 10 7 ) + 0.08 d
where  C b i o m a s s  is the biomass concentration, and  d  is the time in days.

3.3. Cell Motion

For cell tracking, the concentration of microorganisms in the suspension was set to 107 cells.mL−1 and video microscope images were recorded for 50 min. Figure 3, Figure 4 and Figure 5 show the trajectories of the population of Synechocystis sp. CPCC 534 at (Figure 3) the beginning (on the first day) of the exponential growth phase, (Figure 4) the end of the exponential phase, and (Figure 5) the end of the stationary phase (at day 1, day 17, and day 78, respectively). The duration of all trajectories displayed in Figure 3, Figure 4 and Figure 5 is 50 min. The results show the length of cell trajectories had increased noticeably during the exponential phase compared to the beginning of the exponential growth phase and the end of the stationary phase. In Figure 3 and Figure 5, the cell trajectories mainly consist of “tumbling” movement and extend around 10 pixels in space, while in Figure 4, cells perform more “run” movements, and the trajectories extend over 80 pixels in space. This observation implies that cell motility improved with the cells’ age. The decline of cell motility at the end of the stationary phase could be due to nutrient depletion in the PBR and/or the fact that most cells had reached the end of their cell life cycle, Figure 5 [5,32].

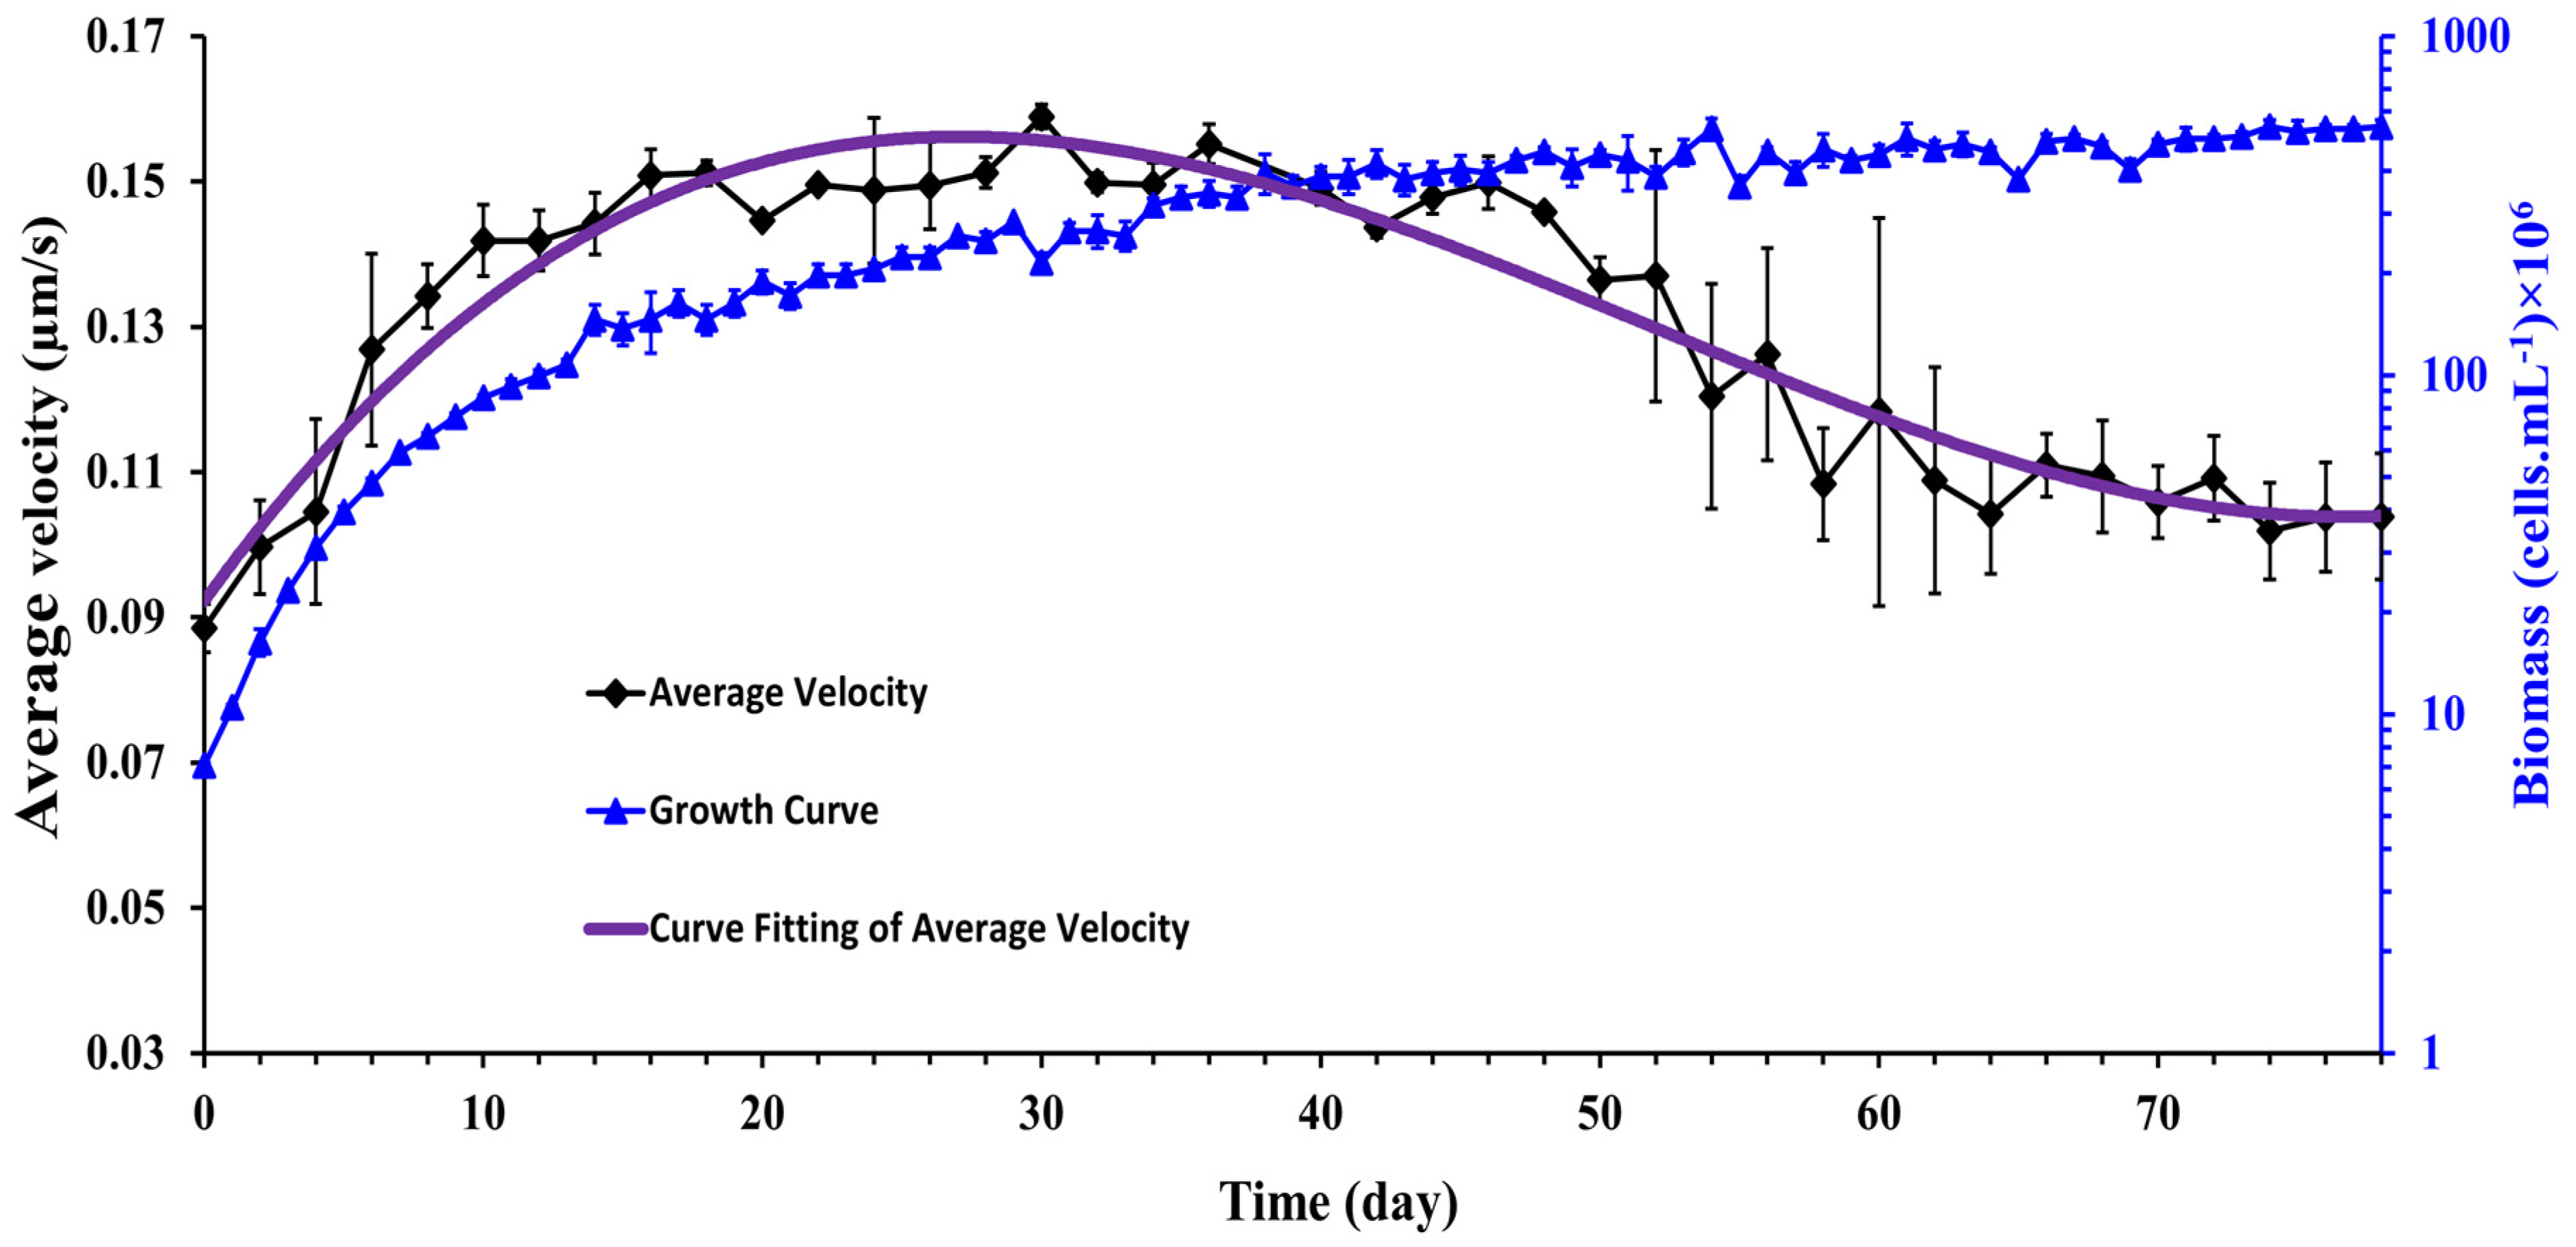
3.4. Evolution of Cell Motility during Synechocystis Growth

The instantaneous velocity of a single cell was calculated as the displacement between two consecutive frames multiplied by the acquisition framerate (one frame per second). The instantaneous velocity for each cell was then averaged over the experimental time period to determine the average cell velocity, Vp. Finally, the ensemble average velocity was calculated as follows:
V m = 1 n p p = 1 n p V p
where  n p  is the number of motile Synechocystis cells present in the recorded video [19]. The measurement time for each experimental run was 50 min, and cell concentrations for all experiments were constant (107 cells.mL−1). In Figure 6, the average velocity of Synechocystis sp. cell is plotted as a function of time for 78 days of observation. The growth curve corresponding to the same observation period is also superposed on the average velocity curve. It is observed that the cells’ average velocity increases with time during the exponential and linear growth periods and starts to decline monotonously from the beginning of the stationary growth phase.
This observation suggests cell motility was directly correlated with cell growth and cell aging attenuated cell motility. Of special interest is the observation in the stationary growth region where the motility of the cells decays with time. The question arises whether the aged cells give birth to fewer motile cells or whether other factors, such as self-shading or nutrient depletion, caused this reduction in cell motility. We could not address this question due to experimental limitations, but it would be an interesting topic for future study.
A similar pattern of results was observed by Fadlallah et al. [19] where they cultured C. reinhardtii at 22 ± 1 °C with a photon flux of 70 ± 5 µmole.m−2.s−1 and a stirring rate of 360 rpm for 15 days. Their results showed the mean velocity of C. reinhardtii improved noticeably during the exponential phase while the average velocity oscillated randomly around a constant value in the stationary phase. In this experiment, however, the authors did not observe the decay of cell motility, perhaps because the experiments were not followed a long time enough in the stationary growth phase to verify the motility decay as was conducted in the present work.
These velocity data were fitted to a non-linear third-order polynomial model in the form:
V m = a 1 d 3 + a 2 d 2 + a 3 · d + a 4
The model parameters were determined using the “statsmodels” package in Python. The parameter values and their 95% confidence intervals (given in brackets) are:
  • a1 = 8.36 × 10⁻⁷ (6.44 × 10⁻⁷ to 1.03 × 10⁻⁶)
  • a2 = −1.31 × 10⁻⁴ (−1.54 × 10⁻⁴ to −1.09 × 10⁻⁴)
  • a3 = 5.30 × 10⁻³ (4.53 × 10⁻³ to 6.06 × 10⁻³)
  • a4 = 9.25 × 10⁻² (8.57 × 10⁻² to 9.92 × 10⁻²)
All parameters were found to be statistically significant (p < 0.05). It should be noted that Equation (6) is obtained specifically for Synechocystis cells under the given growth conditions. Its generality needs to be studied in future work.

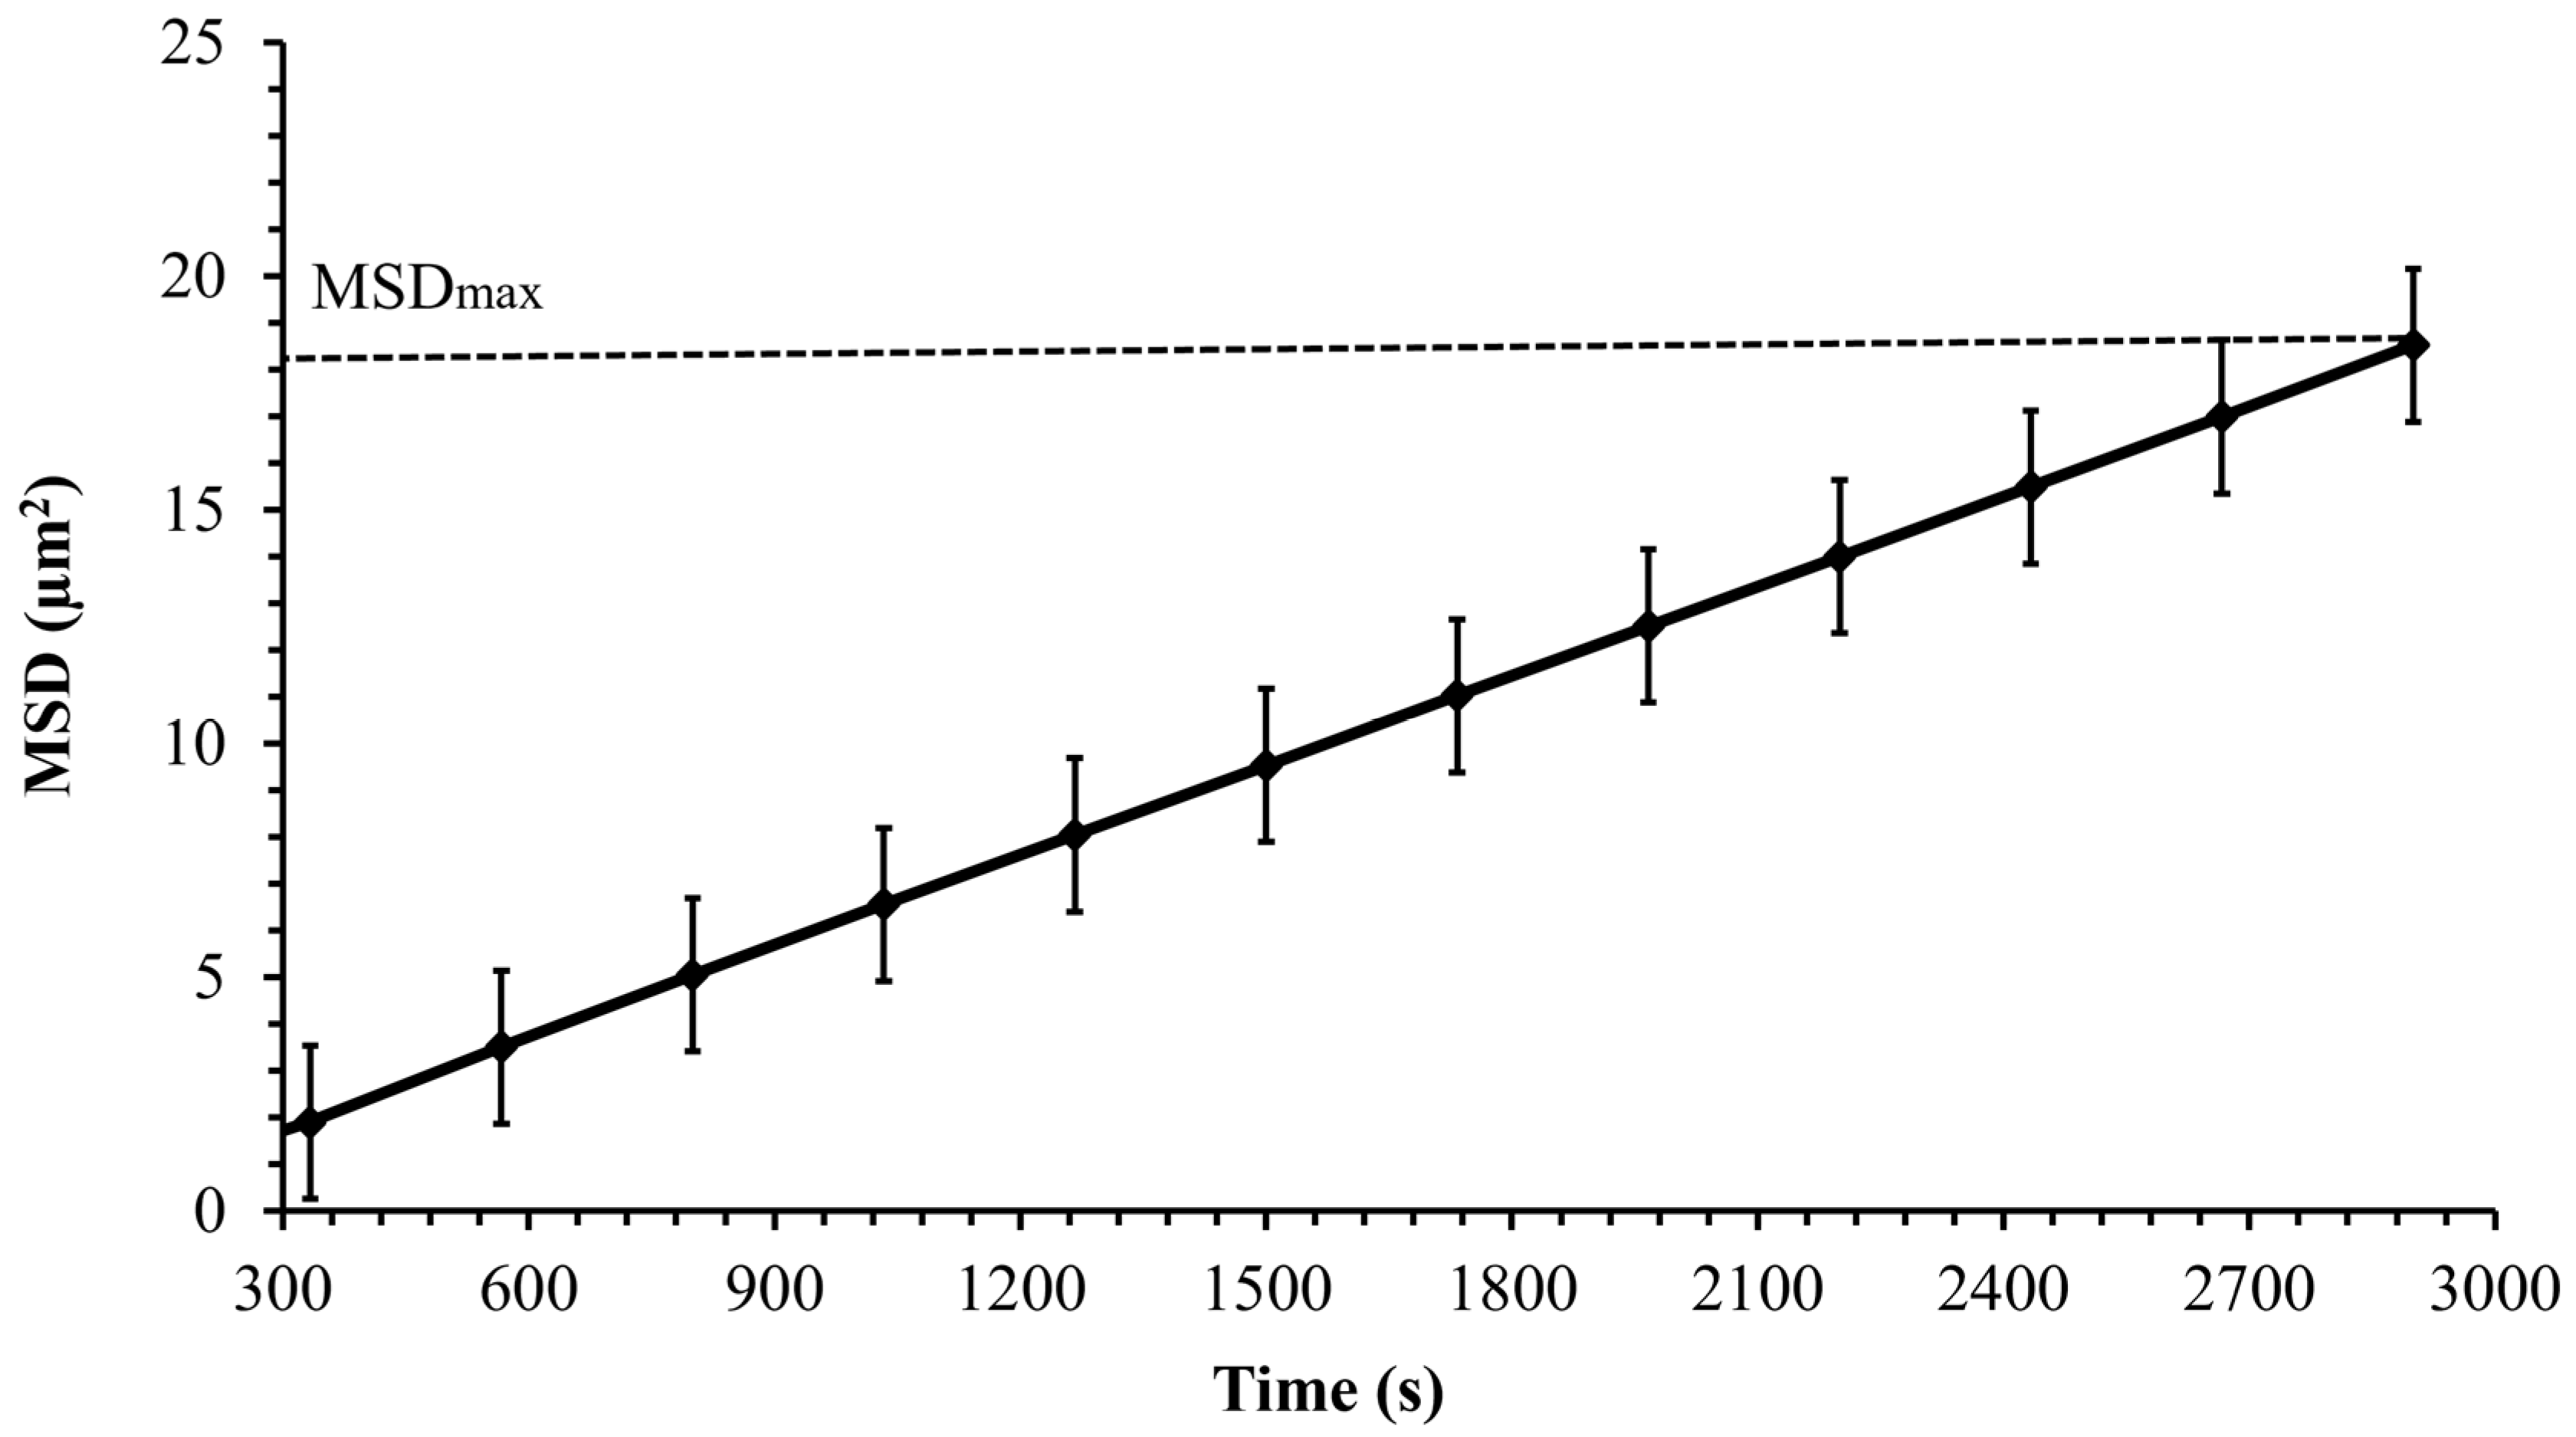
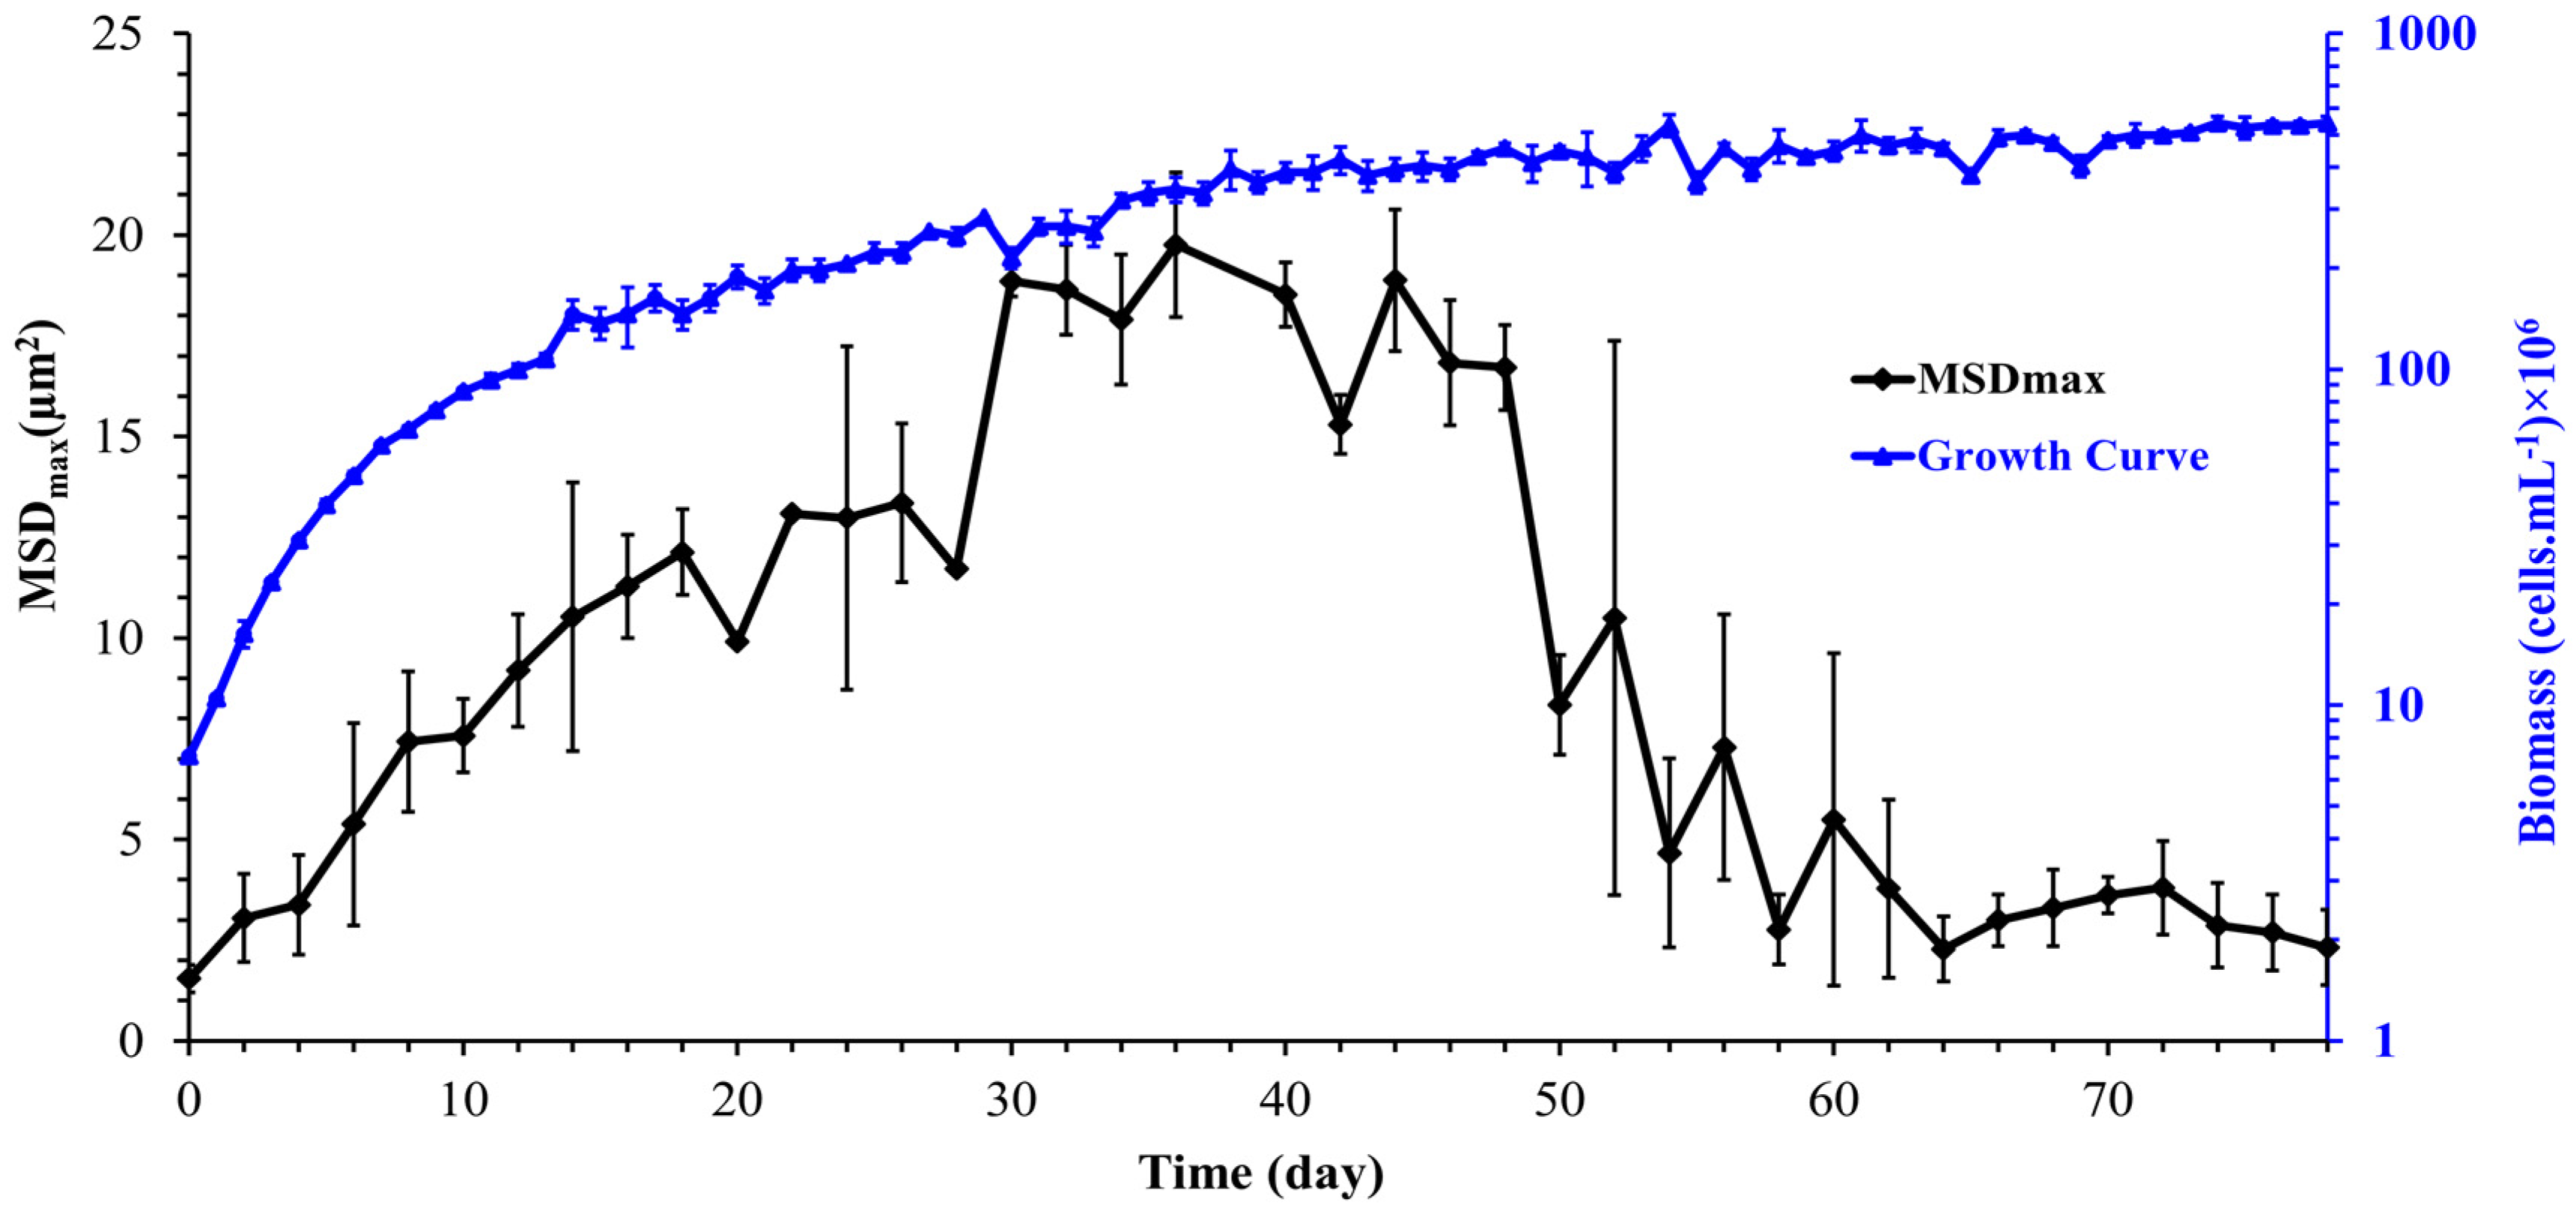
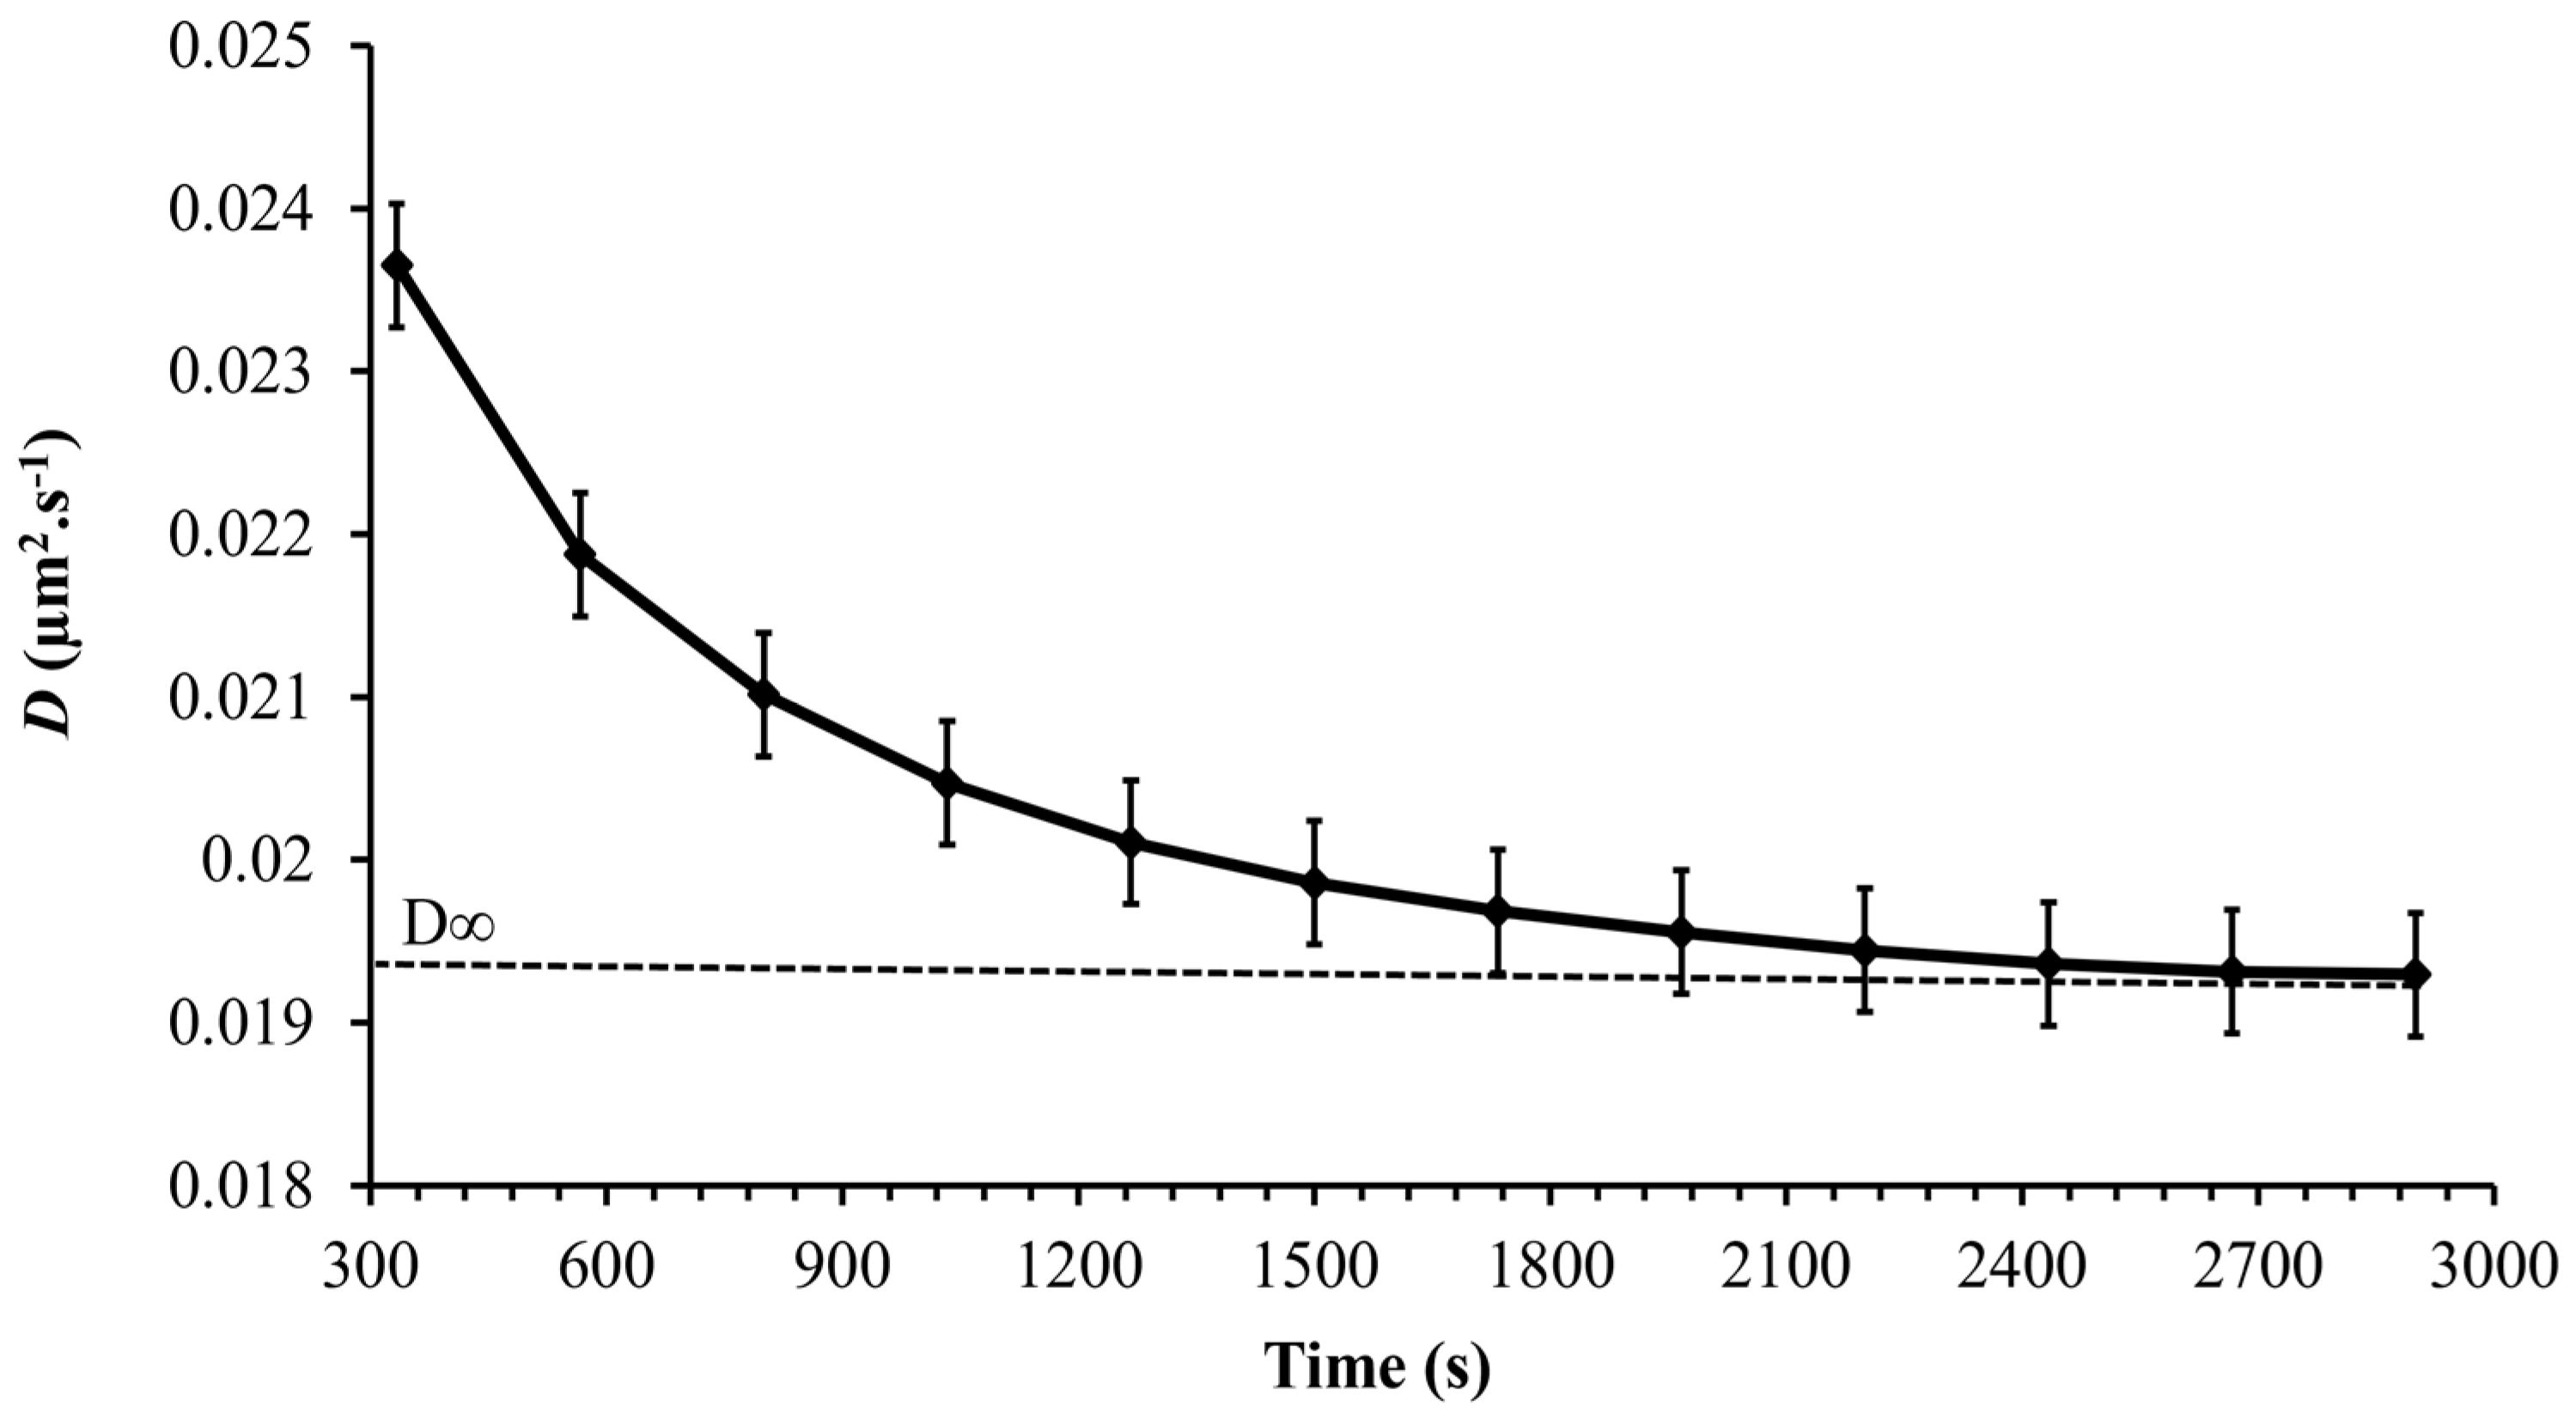
3.5. Dynamics of Cell Motion during Growth

The mean squared displacement (MSD) as a function of experimental time is used to describe the dynamics and the nature of cell motion. After determining cell trajectories, the MSD was computed to analyze the cell transport parameters, such as cell diffusion in its surrounding environment. Figure 7 shows the mean squared displacement of Synechocystis sp. CPCC 534 increases linearly with time over a 3000 s observation time, confirming Fickian diffusion behavior. A similar pattern was also found by Vourc’h et al. [23], who studied the surface diffusion of Synechocystis sp. PCC 6803 during the early stages of cell contact with a solid surface in diluted suspension. The maximum value of the MSD was estimated from Figure 7 and plotted in Figure 8 as a function of time. Due to the improvement in the cell motility, the MSDmax increased linearly during the exponential and linear growth phases, followed by an almost constant value up to day 44. Then the MSDmax declined progressively in the stationary range and roughly leveled off until the end of this period.
To assess the details of the temporal evolution of the motility during an observation period, we divide the 50 min duration of the recording into 12 temporal windows centered around time t. We denote  δ ,  the time elapsed between two successive values of t. Inside each window centered on t, we compute MSD(t,D) as the MSD computed for a time interval  Δ  as:
M S D t , Δ = 1 N t i = 1 N t 1 δ Δ t = t δ 2 + Δ 2 t + δ 2 Δ 2 X i t + Δ 2 X i t Δ 2 2
where  N t  is the number of trajectories recorded on the temporal window.
For most applications, one would need to know the behavior of the diffusion coefficient as a function of time. As  M S D t , Δ  is proportional to  Δ  inside each temporal window centered around t, this enables the derivation of a time-dependent diffusion coefficient  D t  such as:
D t = M S D t , Δ 4 Δ
Figure 9 shows a slow decrease in the diffusion coefficient with time reaching a constant value asymptotically after 3000 s. A time-dependent diffusion coefficient was also observed in [23] and was related to the secretion of EPS by Synechocystis cells. As was shown in the previous section, the Synechocystis motility is age-dependent, and therefore, it is expected that the diffusion coefficient is age-dependent as well. Thus, the instantaneous diffusion coefficient becomes concomitantly time and age-dependent, a fact that makes its dynamics quite complex. However, the long-term diffusion coefficient is of special interest in most practical applications. The long-term diffusion coefficient obtained from the experiments carried out for each point on the growth curve is plotted in Figure 10 for the whole growth period of Synechocystis sp. CPCC 534. Based on Figure 10, it followed the same pattern as the MSDmax profile, confirming that cell motility dominates the diffusion dynamics of Synechocystis sp. CPCC 534.

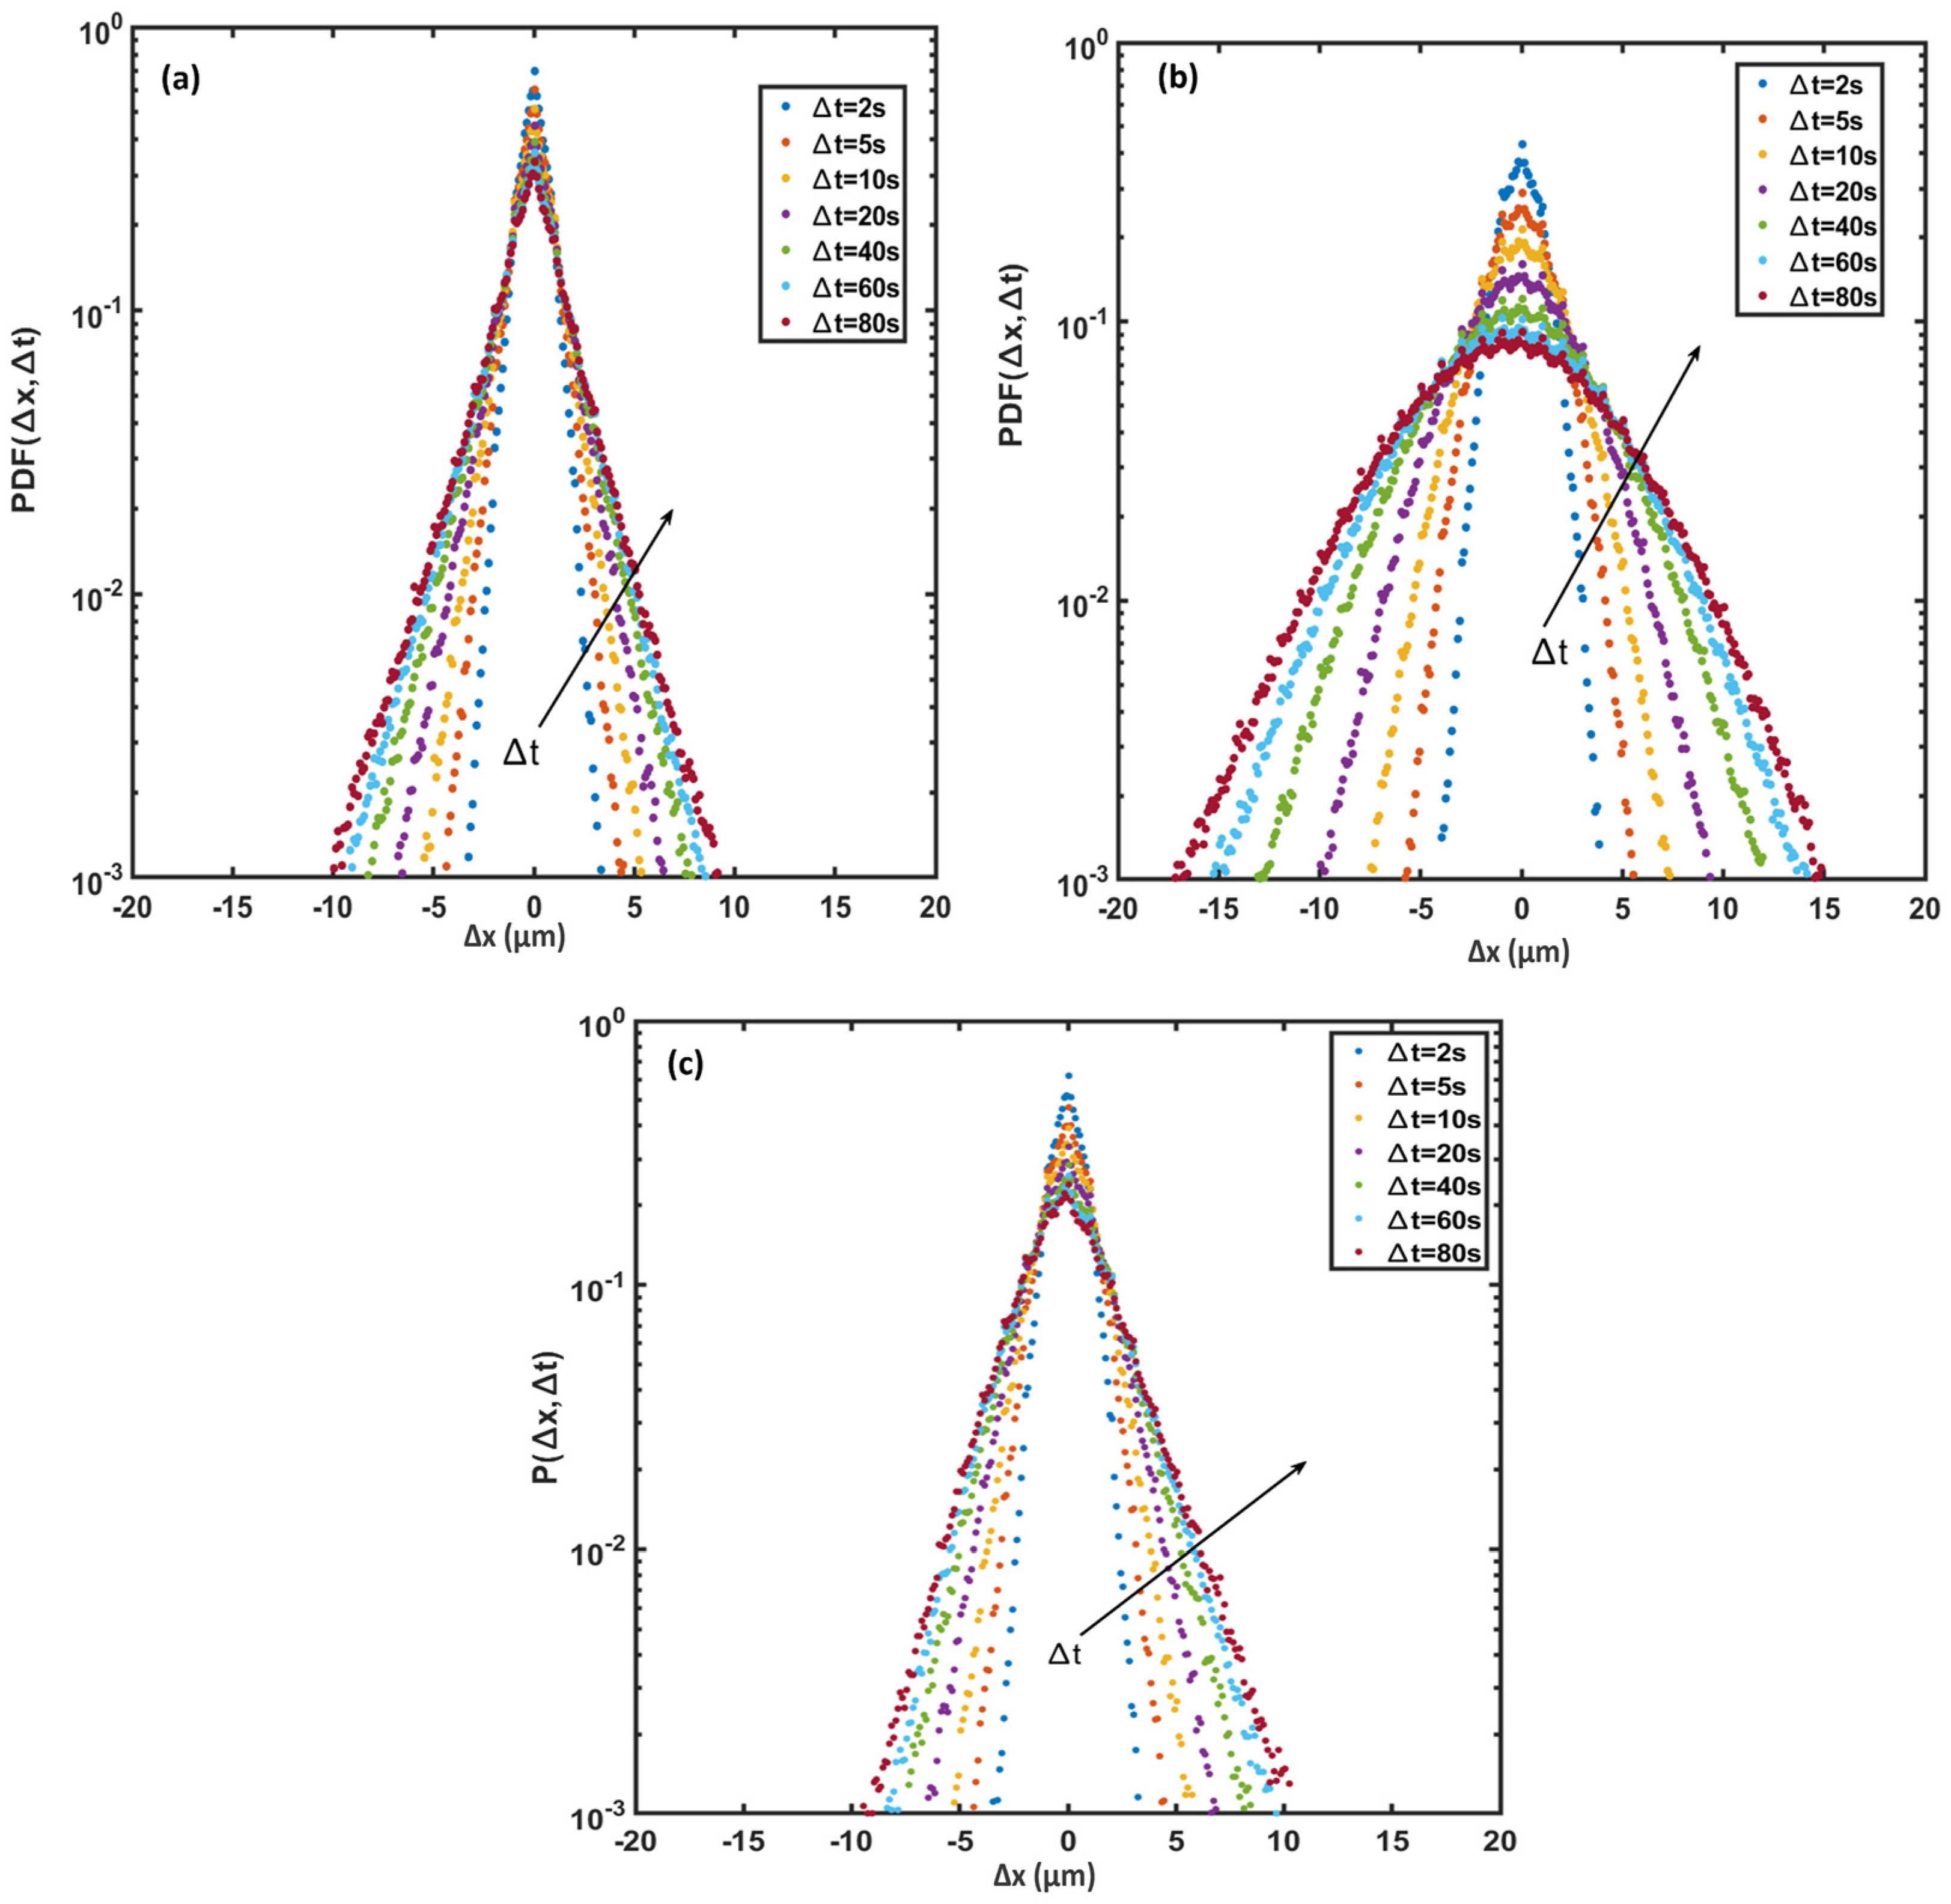
3.6. Probability Density Function (PDF)

In active suspensions, the probability density function (PDF) of cell displacements is usually non-Gaussian; or is a combination of a Gaussian distribution for long time intervals and an exponential distribution for short time intervals [37]. Figure 11 plots the PDFs along the x-axis for various time intervals at (a) the beginning of the exponential growth phase, (b) the end of the exponential growth phase, and (c) the end of the stationary phase. The PDF distributions are symmetrical and zero-centered and show a smooth transition from exponential to a Gaussian distribution with passing time. The central part of the PDF relates to the low motility (tumble) part of cell trajectories, while the tails indicate the higher cell motility (run) parts [38]. Figure 11a shows that the PDF consists of two parts: a sharp central part and wide tails. The central part of the PDFs for each observation time corresponds to the non-diffusive behavior of Synechocystis sp. CPCC 534 (tumble), and their maximum values decline with the passage of time as the motility of cells increases. The tail of each displacement distribution broadened as time passed, implying that the diffusive behavior of cyanobacteria tends to be Gaussian at longer times. The difference between Figure 11a,b indicates that the tail of each displacement distribution had been expanded noticeably from the beginning of the exponential growth phase to the end of this phase, signifying that cell motility had increased as cells matured. However, the PDF was remarkably narrowed at the end of the stationary phase, Figure 11c, when cells aged, and their motility declined and was dominated by tumbling motion.

4. Conclusions

The motility of wild-type Synechocystis sp. CPCC 534 was investigated during its complete growth cycle for 78 days. This rather long observation time, new in the literature, was aimed at investigating the correlation between the cell growth phase and cell motility evolution during the whole growth cycle, from the exponential to the decay phase.
The results revealed a direct correlation between cell motility and the cell growth phase: cell motility increased with time during the exponential linear growth phases. It declined all through the stationary phase before reaching a constant value asymptotically. The mean squared distance traveled by cells at different stages of growth followed a trend similar to that of the cell motility time-variation, as was expected.
The instantaneous diffusion coefficient of Synechocystis at all growth states decreased with time and asymptotically reached a constant value. This type of time dependence for diffusion coefficient has already been observed [23] and has been shown experimentally to be due to the secretion of exopolysaccharides by Synechsystis cells [5]. However, the present work revealed that the long-term diffusion coefficient is also directly correlated with the growth state of the cells and follows the same time evolution as that of the MSD.
The PDF of the cell displacement, on the other hand, confirmed the close correlation between the cell motility and its growth state; at the beginning of the exponential phase, the PDFs were of exponential type, revealing the non-diffusive behavior of the cells. The tail of each displacement distribution then broadened as time passed, implying the diffusive behavior of Synechsystis cells, and tended to Gaussian at longer times. The results of this study find their application in the prediction of biofilm formation on photobioreactor walls.

Author Contributions

Conceptualization, H.P.; Methodology, Z.S., M.M.A., T.V., C.T.D. and H.P.; Software, Z.S., T.V. and C.T.D.; Validation, M.M.A., C.T.D., T.V. and H.P.; Formal Analysis, Z.S., M.M.A., T.V., C.T.D. and H.P.; Investigations, Z.S. and M.M.A.; Resources, C.T.D. and H.P.; Data Curation, Z.S.; Writing—Original Draft, Z.S.; Review and Editing, M.M.A., T.V., H.P. and C.T.D.; Supervision, M.M.A., C.T.D. and H.P.; Project Administration, M.M.A. and H.P.; Funding Acquisition, H.P. and C.T.D. All authors have read and agreed to the published version of the manuscript.

Funding

CDG acknowledges the financial support of Natural Sciences and Engineering Research Council of Canada discovery grant RGPIN-2017-04078, which partially supported ZS, and HP acknowledges the financial support of Natural Sciences and Engineering Research Council of Canada grant RGPIN-2019-05156 which partially supported Z.S. and M.M.A.

Data Availability Statement

There is no supporting data for this paper.

Conflicts of Interest

The authors declare no conflict of interest.

Abbreviations

dDay
DDiffusion coefficient
EPSExopolysaccharide
kDoubling per day
MSDMean squared displacement
ODOptical density
PBRPhotobioreactor
PDFProbability density function
rGrowth rate
VmAverage velocity

References

  1. Vourc’h, T.; Léopoldès, J.; Peerhossaini, H. Light control of the diffusion coefficient of active fluids. J. Fluids Eng. 2020, 142, 031109. [Google Scholar] [CrossRef]
  2. Fadlallah, H.; Jarrahi, M.; Herbert, E.; Ferrari, R.; Mejean, A.; Peerhossaini, H. Active Fluids: Effects of Hydrodynamic Stress on Growth of Self-Propelled Fluid Particles. J. Appl. Fluid Mech. 2020, 13, 561–570. [Google Scholar] [CrossRef]
  3. Saintillan, D. Rheology of active fluids. Annu. Rev. Fluid Mech. 2018, 50, 563–592. [Google Scholar] [CrossRef]
  4. Dervaux, J.; Capellazzi Resta, M.; Brunet, P. Light-controlled flows in active fluids. Nat. Phys. 2017, 13, 306–312. [Google Scholar] [CrossRef]
  5. Mehdizadeh Allaf, M.; Peerhossaini, H. Cyanobacteria: Model microorganisms and beyond. Microorganisms 2022, 10, 696. [Google Scholar] [CrossRef]
  6. Ortiz, A.; Díez-Montero, R.; García, J.; Khalil, N.; Uggetti, E. Advanced biokinetic and hydrodynamic modelling to support and optimize the design of full-scale high-rate algal ponds. Comput. Struct. Biotechnol. J. 2022, 20, 386–398. [Google Scholar] [CrossRef]
  7. Solimeno, A.; Parker, L.; Lundquist, T.; García, J. Integral microalgae-bacteria model (BIO_ALGAE): Application to wastewater high rate algal ponds. Sci. Total Environ. 2017, 601, 646–657. [Google Scholar] [CrossRef]
  8. Hadiyanto, H.; Elmore, S.; Van Gerven, T.; Stankiewicz, A. Hydrodynamic evaluations in high-rate algae pond (HRAP) design. Chem. Eng. J. 2013, 217, 231–239. [Google Scholar] [CrossRef]
  9. Palma, V.; Gutiérrez, M.S.; Vargas, O.; Parthasarathy, R.; Navarrete, P. Methods to evaluate bacterial motility and its role in bacterial–host interactions. Microorganisms 2022, 10, 563. [Google Scholar] [CrossRef]
  10. Lauffenburger, D.; Aris, R.; Keller, K. Effects of cell motility and chemotaxis on microbial population growth. Biophys. J. 1982, 40, 209–219. [Google Scholar] [CrossRef]
  11. Sunda, W.G.; Graneli, E.; Gobler, C.J. Positive feedback and the development and persistence of ecosystem disruptive algal blooms. J. Phycol. 2006, 42, 963–974. [Google Scholar] [CrossRef]
  12. Vissers, T.; Koumakis, N.; Hermes, M.; Brown, A.T.; Schwarz-Linek, J.; Dawson, A.; Poon, W.C. Dynamical analysis of bacteria in microscopy movies. PLoS ONE 2019, 14, e0217823. [Google Scholar] [CrossRef] [PubMed]
  13. Wood, T.K.; González Barrios, A.F.; Herzberg, M.; Lee, J. Motility influences biofilm architecture in Escherichia coli. Appl. Microbiol. Biotechnol. 2006, 72, 361–367. [Google Scholar] [CrossRef] [PubMed]
  14. Karimi, A.; Karig, D.; Kumar, A.; Ardekani, A.M. Interplay of physical mechanisms and biofilm processes: Review of microfluidic methods. Lab Chip 2015, 15, 23–42. [Google Scholar] [CrossRef]
  15. Muhammad, M.H.; Idris, A.L.; Fan, X.; Guo, Y.; Yu, Y.; Jin, X.; Qiu, J.; Guan, X.; Huang, T. Beyond risk: Bacterial biofilms and their regulating approaches. Front. Microbiol. 2020, 11, 928. [Google Scholar] [CrossRef] [PubMed]
  16. Shoesmith, J.G. The measurement of bacterial motility. Microbiology 1960, 22, 528–535. [Google Scholar] [CrossRef]
  17. Kim, Y.C. Diffusivity of bacteria. Korean J. Chem. Eng. 1996, 13, 282–287. [Google Scholar] [CrossRef]
  18. Arora, S.; Bhat, V.; Mittal, A. Correlating single cell motility with population growth dynamics for flagellated bacteria. Biotechnol. Bioeng. 2007, 97, 1644–1649. [Google Scholar] [CrossRef]
  19. Fadlallah, H.; Peerhossaini, H.; De Groot, C.; Jarrahi, M. Motility Response to Hydrodynamic Stress During the Growth Cycle in Active Fluid Suspensions. J. Fluids Eng. 2021, 143, 074501. [Google Scholar] [CrossRef]
  20. Bertrand, R.L. Lag phase is a dynamic, organized, adaptive, and evolvable period that prepares bacteria for cell division. J. Bacteriol. 2019, 201, e00697-18. [Google Scholar] [CrossRef]
  21. Himeoka, Y.; Kaneko, K. Theory for transitions between exponential and stationary phases: Universal laws for lag time. Phys. Rev. X 2017, 7, 021049. [Google Scholar] [CrossRef]
  22. Jin, D.; Kotar, J.; Silvester, E.; Leptos, K.C.; Croze, O.A. Diurnal variations in the motility of populations of biflagellate microalgae. Biophys. J. 2020, 119, 2055–2062. [Google Scholar] [CrossRef] [PubMed]
  23. Vourc’h, T.; Peerhossaini, H.; Léopoldès, J.; Méjean, A.; Chauvat, F.; Cassier-Chauvat, C. Slowdown of surface diffusion during early stages of bacterial colonization. Phys. Rev. E 2018, 97, 032407. [Google Scholar] [CrossRef] [PubMed]
  24. Samadi, Z.; Mehdizadeh Allaf, M.; Saifi, R.; De Groot, C.T.; Peerhossaini, H. Effects of turbulent mixing and orbitally shaking on cell growth and biomass production in active fluids. AJBSR 2022, 15, 396–404. [Google Scholar] [CrossRef]
  25. Mueller, T.J.; Welsh, E.A.; Pakrasi, H.B.; Maranas, C.D. Identifying regulatory changes to facilitate nitrogen fixation in the nondiazotroph Synechocystis sp. PCC 6803. ACS Synth. Biol. 2016, 5, 250–258. [Google Scholar] [CrossRef]
  26. Ikeuchi, M.; Tabata, S. Synechocystis sp. PCC 6803—A useful tool in the study of the genetics of cyanobacteria. Photosynth. Res. 2001, 70, 73–83. [Google Scholar] [CrossRef]
  27. Muth-Pawlak, D.; Kreula, S.; Gollan, P.J.; Huokko, T.; Allahverdiyeva, Y.; Aro, E.M. Patterning of the Autotrophic, Mixotrophic, and Heterotrophic Proteomes of Oxygen-Evolving Cyanobacterium Synechocystis sp. PCC 6803. Front. Microbiol. 2022, 13, 891895. [Google Scholar] [CrossRef]
  28. Knoop, H.; Gründel, M.; Zilliges, Y.; Lehmann, R.; Hoffmann, S.; Lockau, W.; Steuer, R. Flux balance analysis of cyanobacterial metabolism: The metabolic network of Synechocystis sp. PCC 6803. PLoS Comput. Biol. 2013, 9, e1003081. [Google Scholar] [CrossRef]
  29. Chau, R.M.; Bhaya, D.; Huang, K.C. Emergent phototactic responses of cyanobacteria under complex light regimes. MBio 2017, 8, e02330-16. [Google Scholar] [CrossRef]
  30. Conradi, F.D.; Mullineaux, C.W.; Wilde, A. The role of the cyanobacterial type IV pilus machinery in finding and maintaining a favourable environment. Life 2020, 10, 252. [Google Scholar] [CrossRef]
  31. Rippka, R.; Deruelles, J.; Waterbury, J.B.; Herdman, M.; Stanier, R.Y. Generic assignments, strain histories and properties of pure cultures of cyanobacteria. Microbiology 1979, 111, 1–61. [Google Scholar] [CrossRef]
  32. Mehdizadeh Allaf, M.; Habib, Z.; de Bruyn, J.R.; DeGroot, C.T.; Peerhossaini, H. Rheological and Biophysical Properties of Living Fluids Under Shear: Active Suspensions of Synechocystis sp. CPCC 534. J. Fluids Eng. 2022, 144, 021208. [Google Scholar] [CrossRef]
  33. Wood, A.M.; Everroad, R.C.; Wingard, L.M.; Andersen, R.A. Algal Culturing Techniques; Elsevier: Amsterdam, The Netherlands, 2005; p. 269. [Google Scholar]
  34. Berg, H.; Darnton, N.; Jaffe, N. Object Tracking Software; Rowland Institute at Harvard University: Cambridge, MA, USA, 2003. [Google Scholar]
  35. Samadi, Z.; Mehdizadeh Allaf, M.; Vourc’h, T.; DeGroot, C.T.; Peerhossaini, H. Are Active Fluids Age-Dependent? In Fluids Engineering Division Summer Meeting; American Society of Mechanical Engineers: New York, NY, USA, 2022; Volume 85833, p. V001T03A037. [Google Scholar] [CrossRef]
  36. Mei, X.; Lee, H.C.; Diao, K.Y.; Huang, M.; Lin, B.; Liu, C.; Xie, Z.; Ma, Y.; Robson, P.M.; Chung, M.; et al. Artificial intelligence–enabled rapid diagnosis of patients with COVID-19. Nat. Med. 2020, 26, 1224–1228. [Google Scholar] [CrossRef] [PubMed]
  37. Leptos, K.C.; Guasto, J.S.; Gollub, J.P.; Pesci, A.I.; Goldstein, R.E. Dynamics of enhanced tracer diffusion in suspensions of swimming eukaryotic microorganisms. Phys. Rev. Lett. 2009, 103, 198103. [Google Scholar] [CrossRef] [PubMed]
  38. Berg, H.C.; Brown, D.A. Chemotaxis in Escherichia coli Analyzed by Three-Dimensional Tracking. In Chemotaxis: Its Biology and Biochemistry; Karger Publishers: Basel, Switzerland, 1974; Volume 19, pp. 55–78. [Google Scholar] [CrossRef]
Figure 1. Calibration curve relating the OD750 to the biomass concentration for Synechocystis sp. CPCC 534 suspensions (n = 3 ± SD).
Processes 11 01492 g001
Figure 2. Growth curve of Synechocystis sp. CPCC 534 (n = 3 ± SD). The blue dashed lines show the end of each growth phase in this experiment.
Processes 11 01492 g002
Figure 3. Extracted trajectories of Synechocystis cells from the video microscope images, recorded over 50 min, for the first day of the exponential phase, day 1.
Processes 11 01492 g003
Figure 4. Extracted trajectories of Synechocystis cells from the video microscope images, recorded over 50 min, for the end of the exponential phase, day 17.
Processes 11 01492 g004
Figure 5. Extracted trajectories of Synechocystis cells from the video microscope images, recorded over 50 min, for the end of the stationary phase, day 78.
Processes 11 01492 g005
Figure 6. Time history of the average velocity of Synechocystis cells. The purple line was fitted to a non-linear third-order polynomial model. (n = 3 ± SD).
Processes 11 01492 g006
Figure 7. The MSD variation of Synechocystis sp. CPCC 534 versus time for a single experiment during 50 min observation period (n = 3 ± SD). Data were fitted to a non-linear third-order polynomial model.
Processes 11 01492 g007
Figure 8. Variation of the maximum mean squared displacement (MSDmax) with time during Synechocystis sp. CPCC 534 growth (n = 3 ± SD).
Processes 11 01492 g008
Figure 9. Variation, during 50 min observation time, of the time-dependent diffusion coefficient of Synechocystis sp. CPCC 534 (n = 3 ± SD).
Processes 11 01492 g009
Figure 10. Variation of long-term diffusion coefficient (D∞) during the growth period of Synechocystis sp. CPCC 534 (n = 3 ± SD).
Processes 11 01492 g010
Figure 11. Displacement probability density function (PDF) along the x-axis for Synechocystis sp. CPCC 534 cell trajectories (a) beginning of the exponential growth phase, (b) end of the exponential growth phase, and (c) end of the stationary phase. Arrows show increasing time intervals.
Processes 11 01492 g011
Disclaimer/Publisher’s Note: The statements, opinions and data contained in all publications are solely those of the individual author(s) and contributor(s) and not of MDPI and/or the editor(s). MDPI and/or the editor(s) disclaim responsibility for any injury to people or property resulting from any ideas, methods, instructions or products referred to in the content.

